1. Introduction
The interaction between the atmosphere and various geographic surface features, such as mountains, basins, and coasts, which are not of regular geometry, significantly influences climate patterns. These interactions create localized variations in temperature, relative humidity, precipitation, and wind, shaping the diverse climates observed around the world [
1,
2]. Nature, in general, does not build in regular shapes, such as straight parallelepipeds, pyramids, cylinders, spheres, etc. (
Appendix A). Hills and mountains, for example, are of irregular geometry, fractals, and the atmosphere, over millions of years, has adapted its connectivity to this irregular geometry and has evolved its behavior based on this objective reality. In a certain way, there is a language that communicates and gives the moments in which the atmosphere makes certain processes possible, such as rain, etc. We know of the influence of the tilt of the Earth’s axis on the seasons of the year and the effect of the relative distance between the Earth and the Sun on the climate. But, to a first approximation, under very localized initial conditions in the boundary layer of the variables of temperature, relative humidity, and wind speed, in conjunction with the geographic morphology, the set of variables achieves the complex connectivity required to make rain possible from the higher-energy clouds that are well above the boundary layer. But this precursor, or “call,” to precipitation has a very specific character. Communication can be hampered and blocked by pollution, urban densification, changes in soil roughness, housing development in mountainous and coastal areas, the albedo of construction materials, etc. [
3,
4,
5]. High-energy clouds carrying the heaviest rainfall will then randomly unload in areas where they find the appropriate signals. This can be deep in the ocean, in distant geographic locations, etc., traveling great distances, leaving vast geographies with water deficits.
Observation tells us that in general, many of the other living beings on the planet do not build their homes in regular geometry: termites, bees, spiders, moles, birds, beavers, wasps, etc. They keep open, not blocked by their constructions, the geography–atmosphere dialogue, something that is mutually beneficial as a not yet understood evolutionary symbiosis of species–geography–atmosphere.
Humans are the only ones who build their homes using regular geometric structures: buildings, sheds, silos, houses, temples, etc. It is no longer a mystery that cities contribute to climate change with thermal islands, the artificial change in soil roughness comparable to the thickness of the boundary layer, high-albedo construction materials, urban planning that reduces relative humidity, makes winds more turbulent, and increases temperatures, etc. [
6,
7]. In a crude form, the purpose is, through these measurable regular geometries, to optimize space and economic profit. But we cannot ignore the aspects of harmony and order linked to practical themes, which found some of their most notable precursors in ancient Greece, such as the Pythagorean school and the golden rule. This rule significantly influenced the construction of temples, homes, art, etc. for centuries [
8]. Fiction, from its perspective, also provides us with striking angles [
9]. These approaches, of many, to the essential topic of human housing constructions transcend all history. Finally, over time, changes in lifestyles, diet, and work have led to a modern approach to housing, driven by products like pollution and garbage. The issue has become more complex with the addition of subjective valuations that have increased costs. Our interaction with geography, and the atmosphere in particular, became dramatic. Is it possible that fractal cities integrated with fractal geographic morphology are a solution? Would this allow us to reconstruct the fragmented dialogue between humanity, geography, and the atmosphere? Technology has the potential to make such an idea possible. What does seem clear is that the artificial, regular, “geomorphological” geometry created by humans is not contributing to improving the connectivity of nature’s characteristic processes, operating almost like a Tower of Babel by obstructing past connectivity. Currently, it is known that the real estate sector, including construction and building operations, is one of the most important sources of pollution worldwide, consuming 36% of global energy and producing 39% of CO
2 emissions [
10,
11].
1.1. Turbulence Due to Obstacles
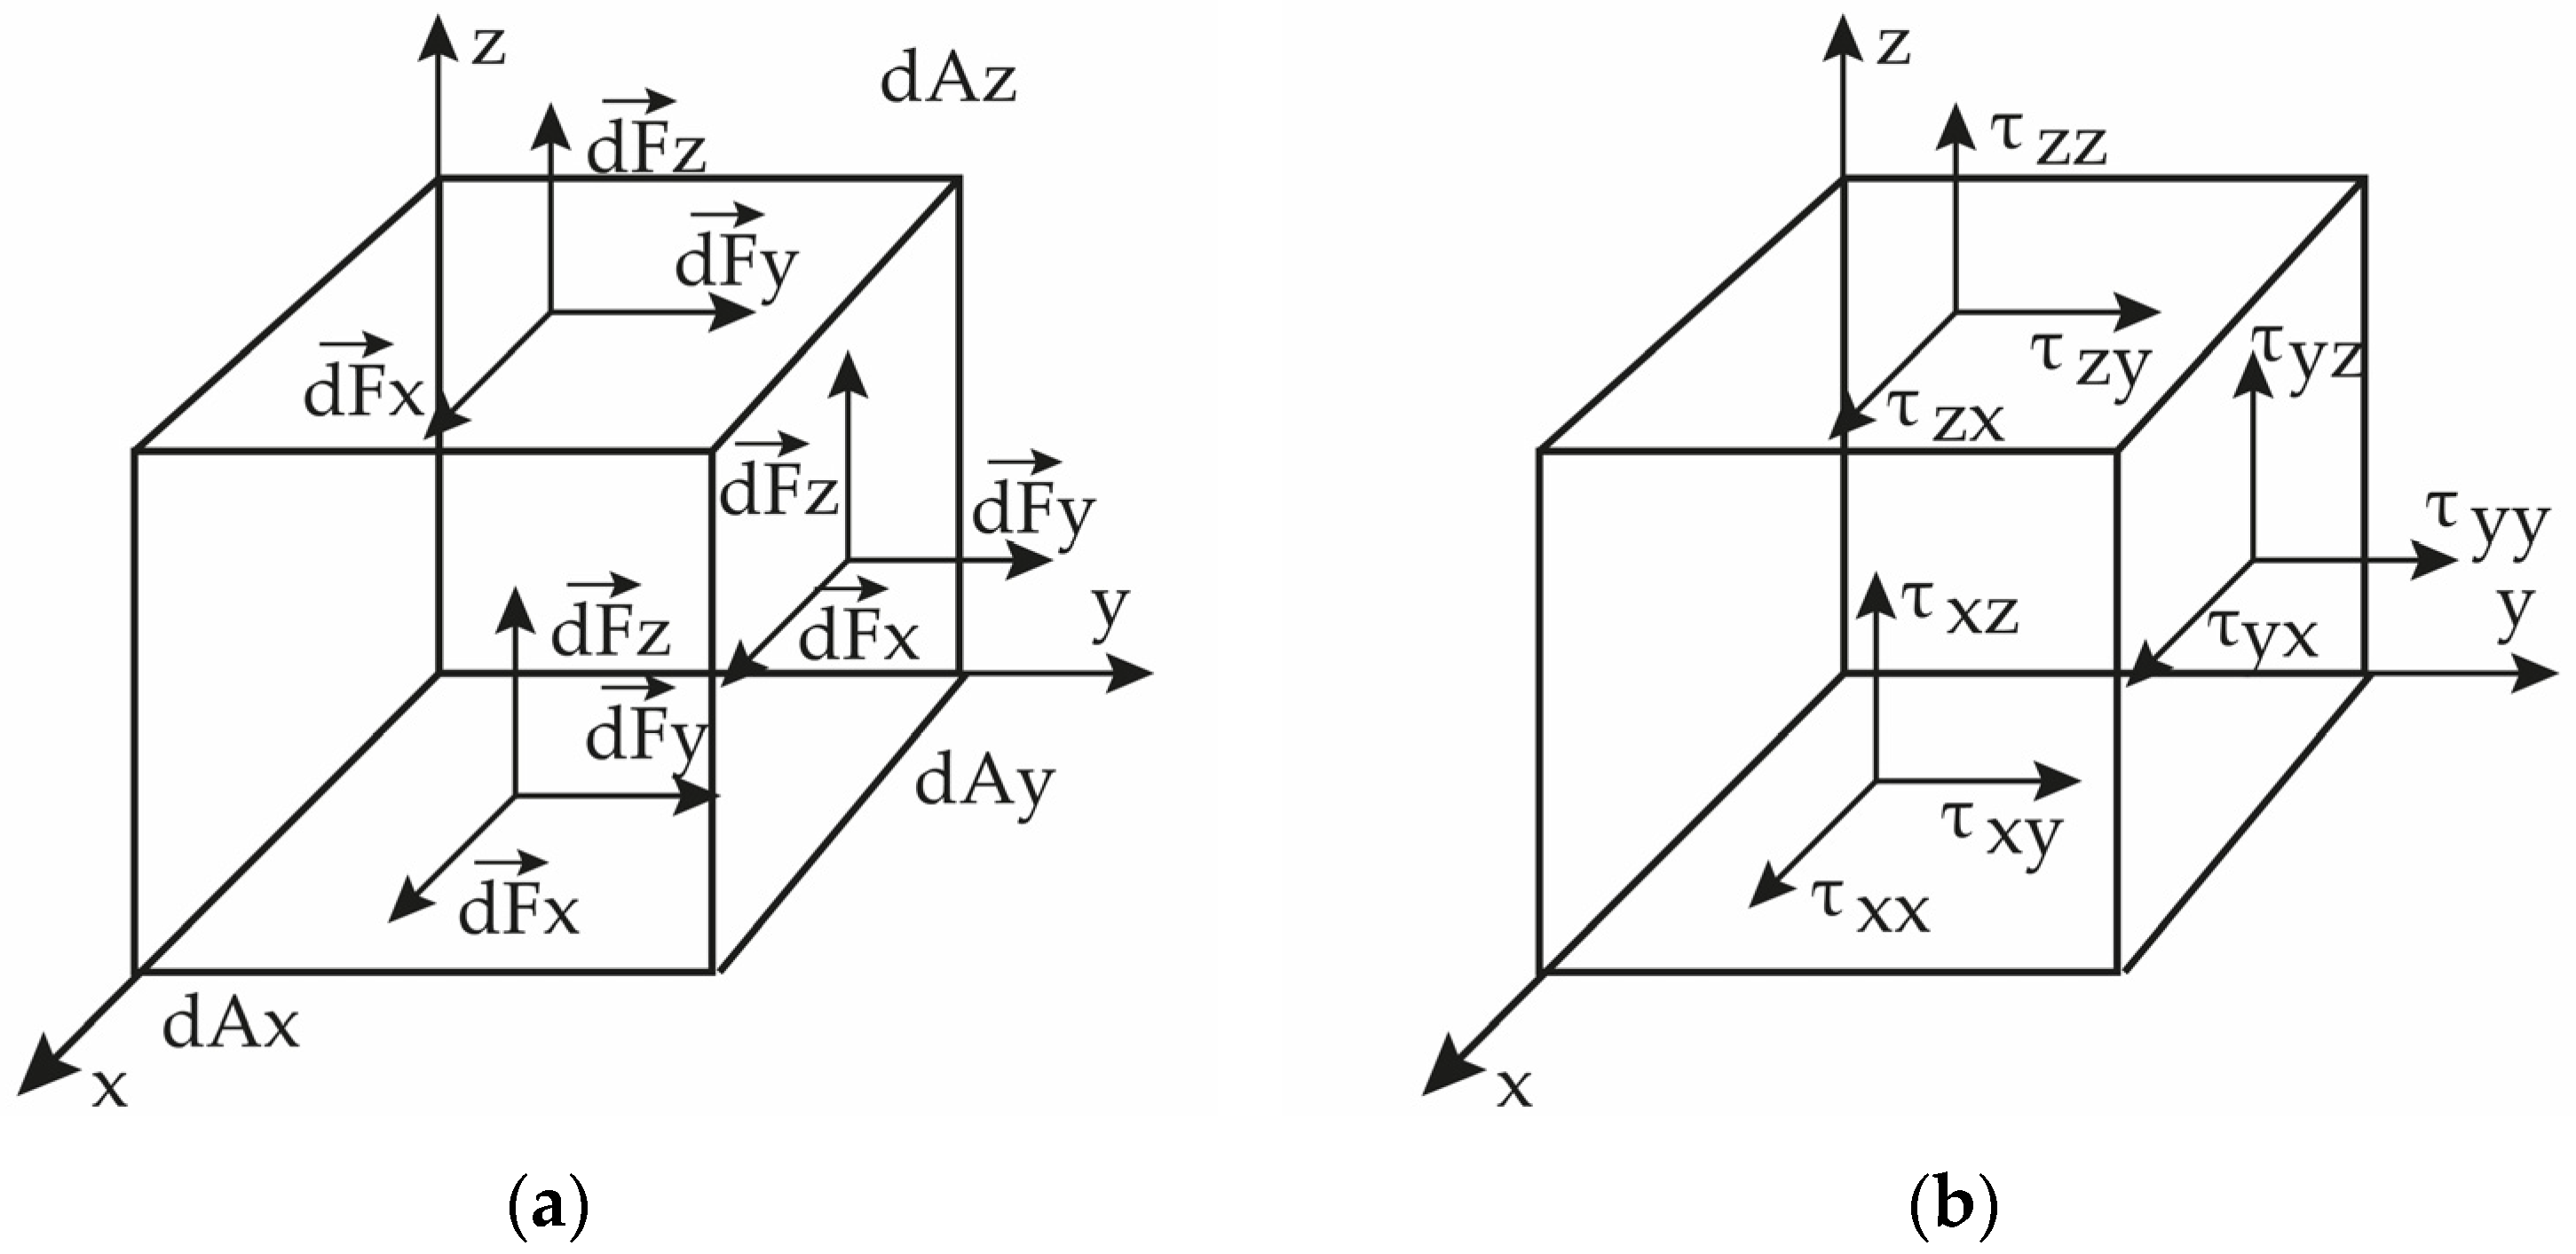
Figure 1 presents, approximately, a simplified version of the wind flow before and after an obstacle.
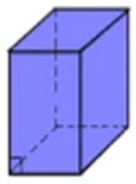
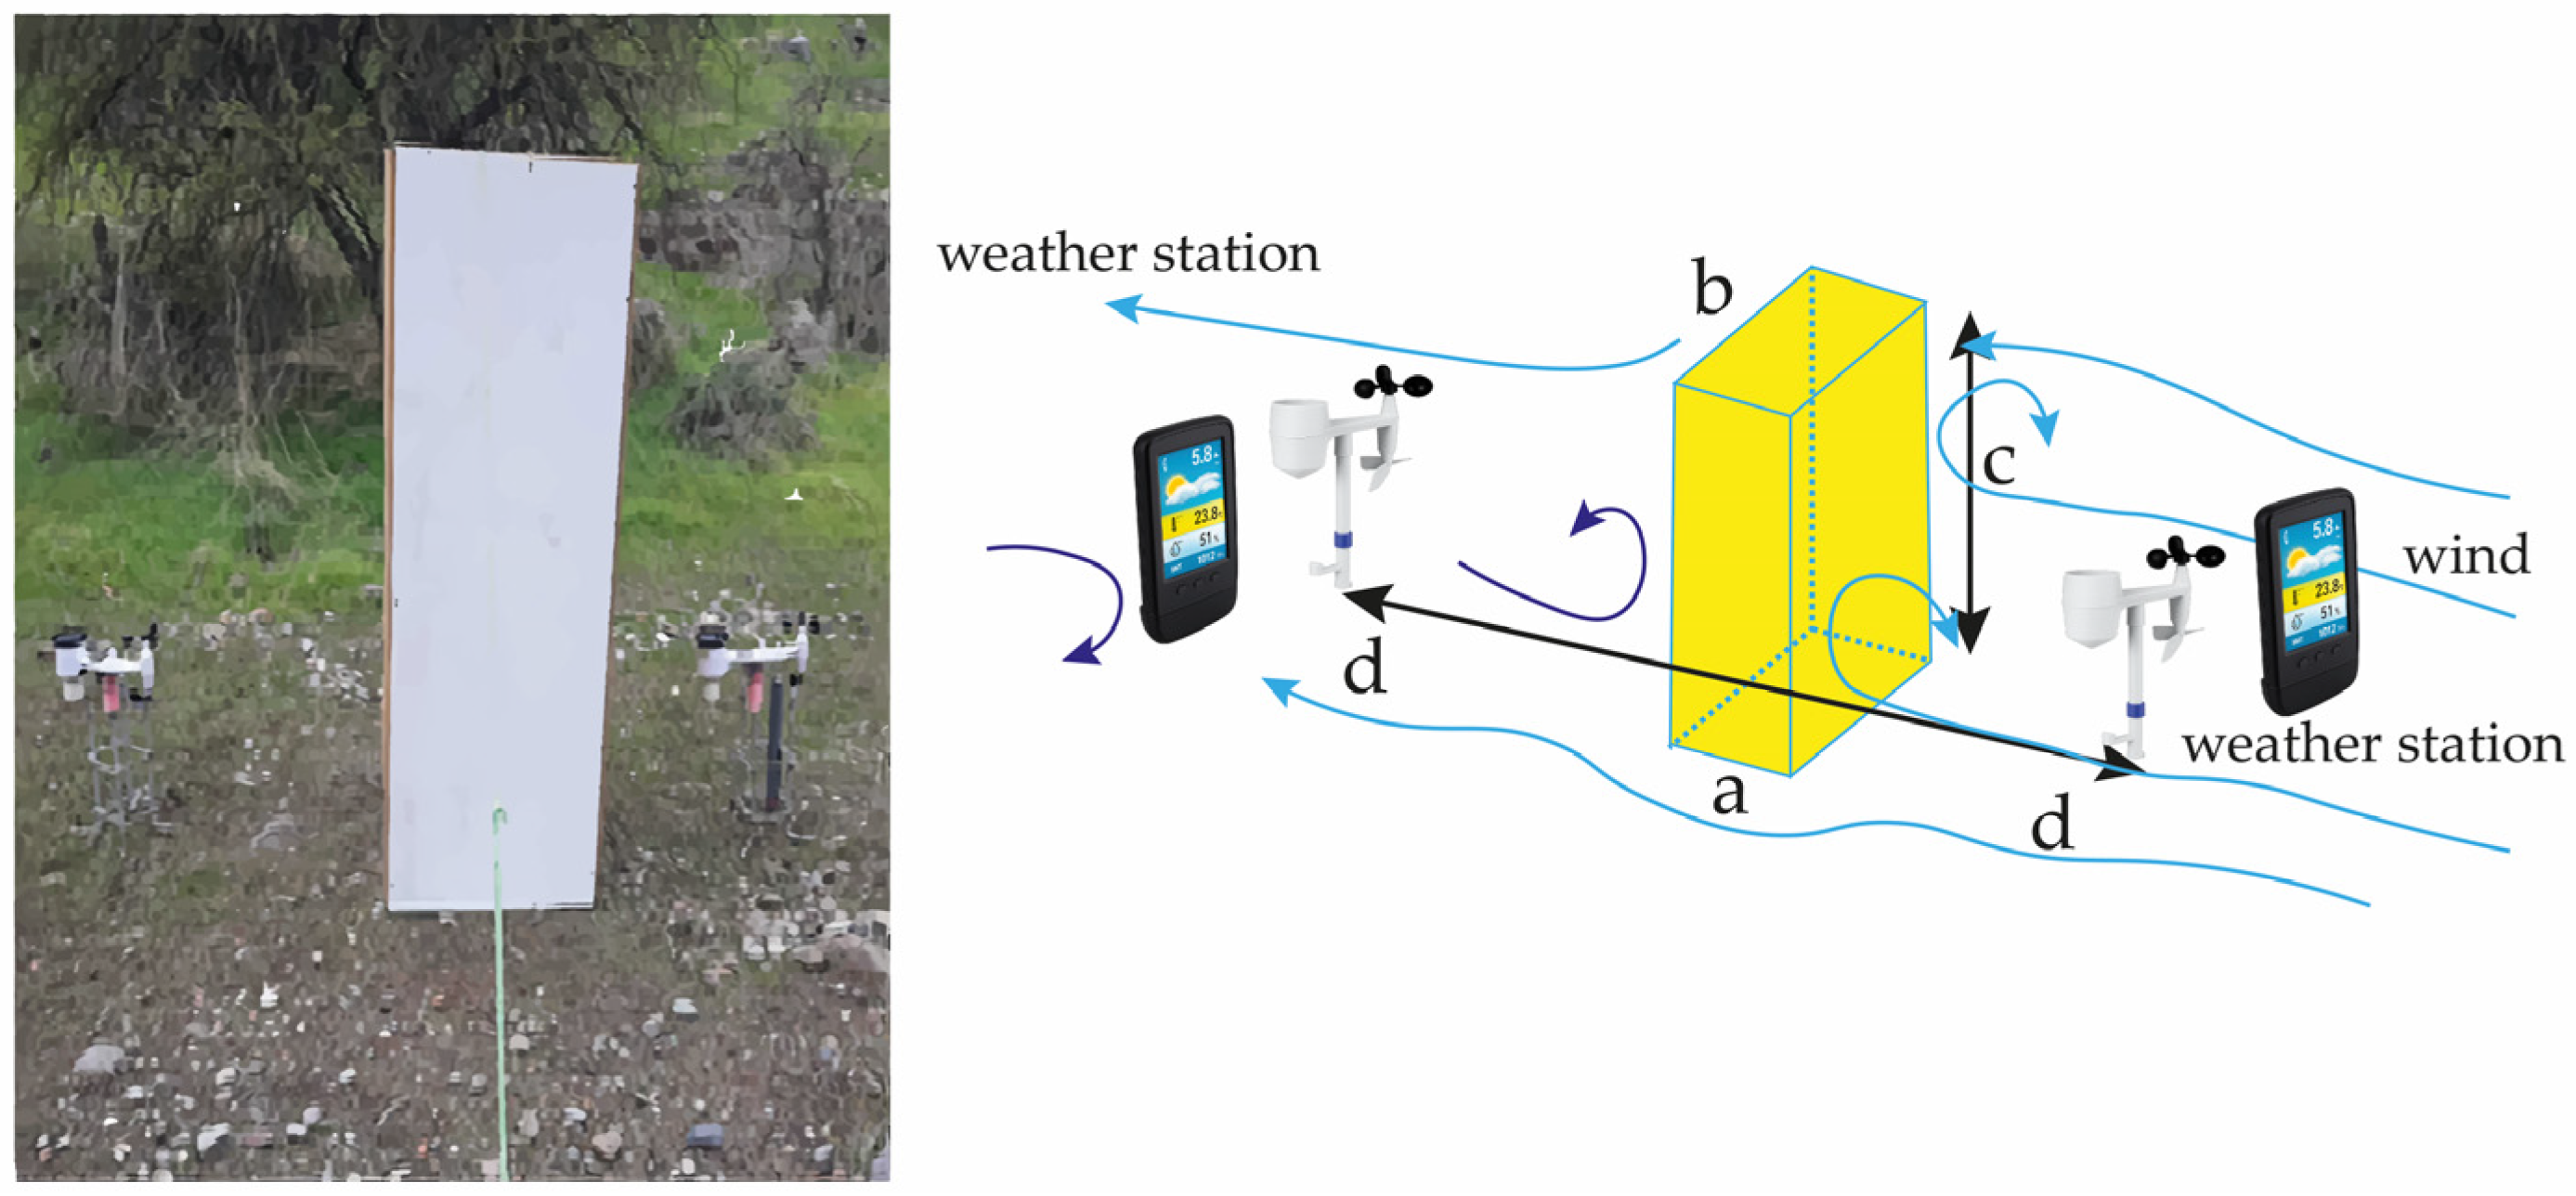
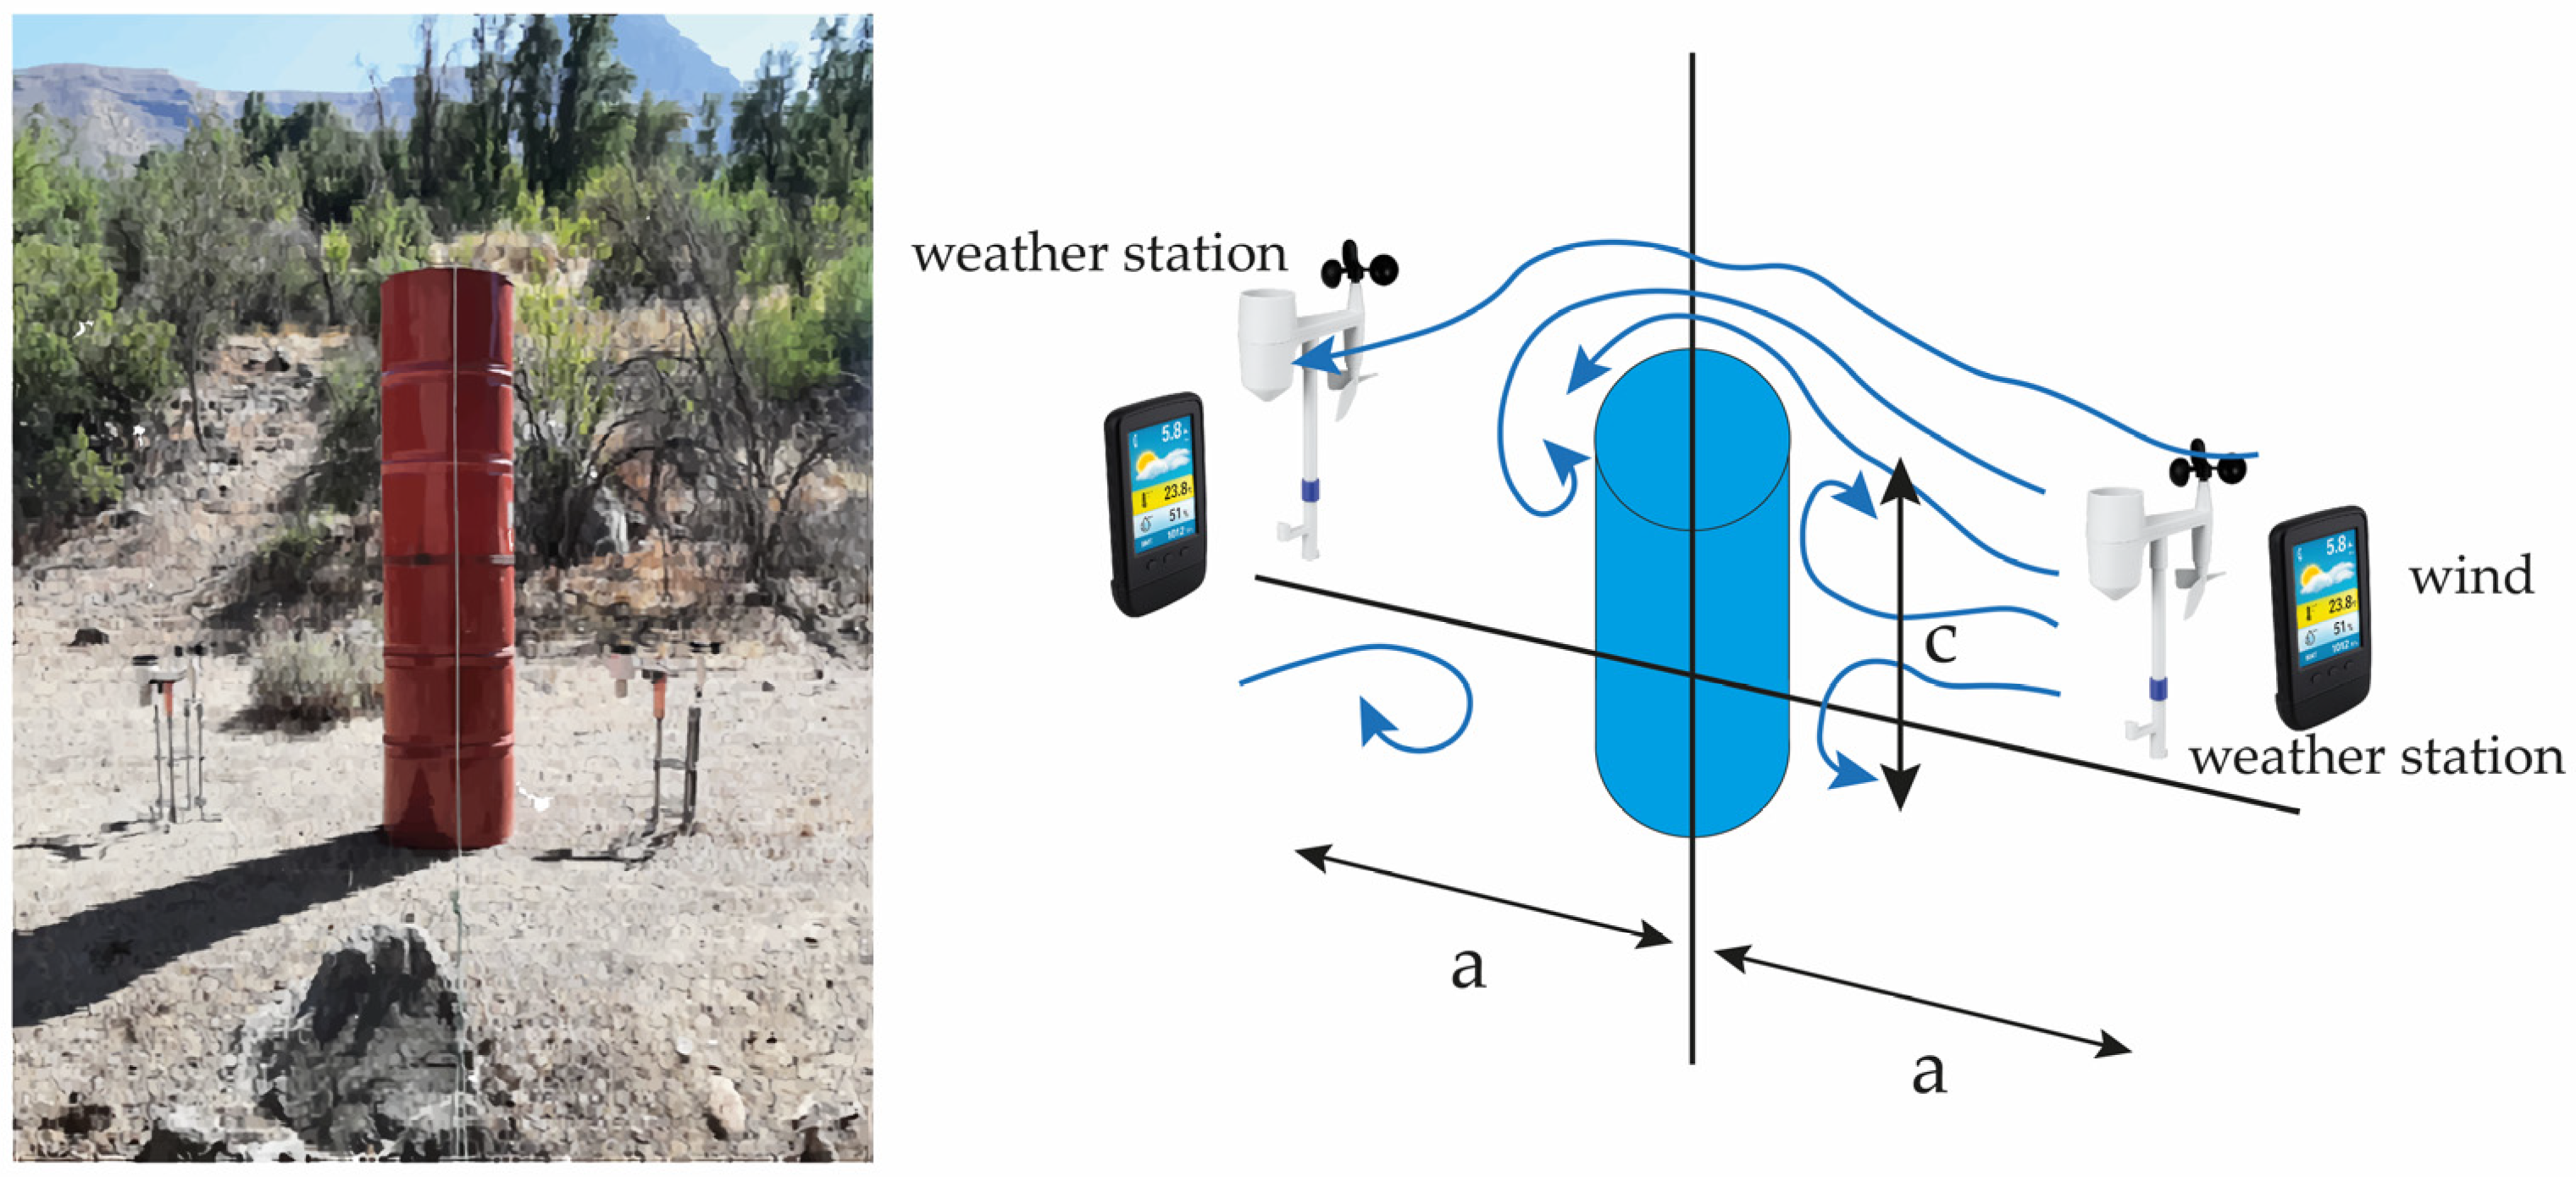
Figure 2 shows the interaction of the wind flow with a straight parallelepiped obstacle before and after and the possible location of instruments measuring temperature (T), relative humidity (RH), magnitude of wind speed (WS), and pressure (P) in the turbulent zone.
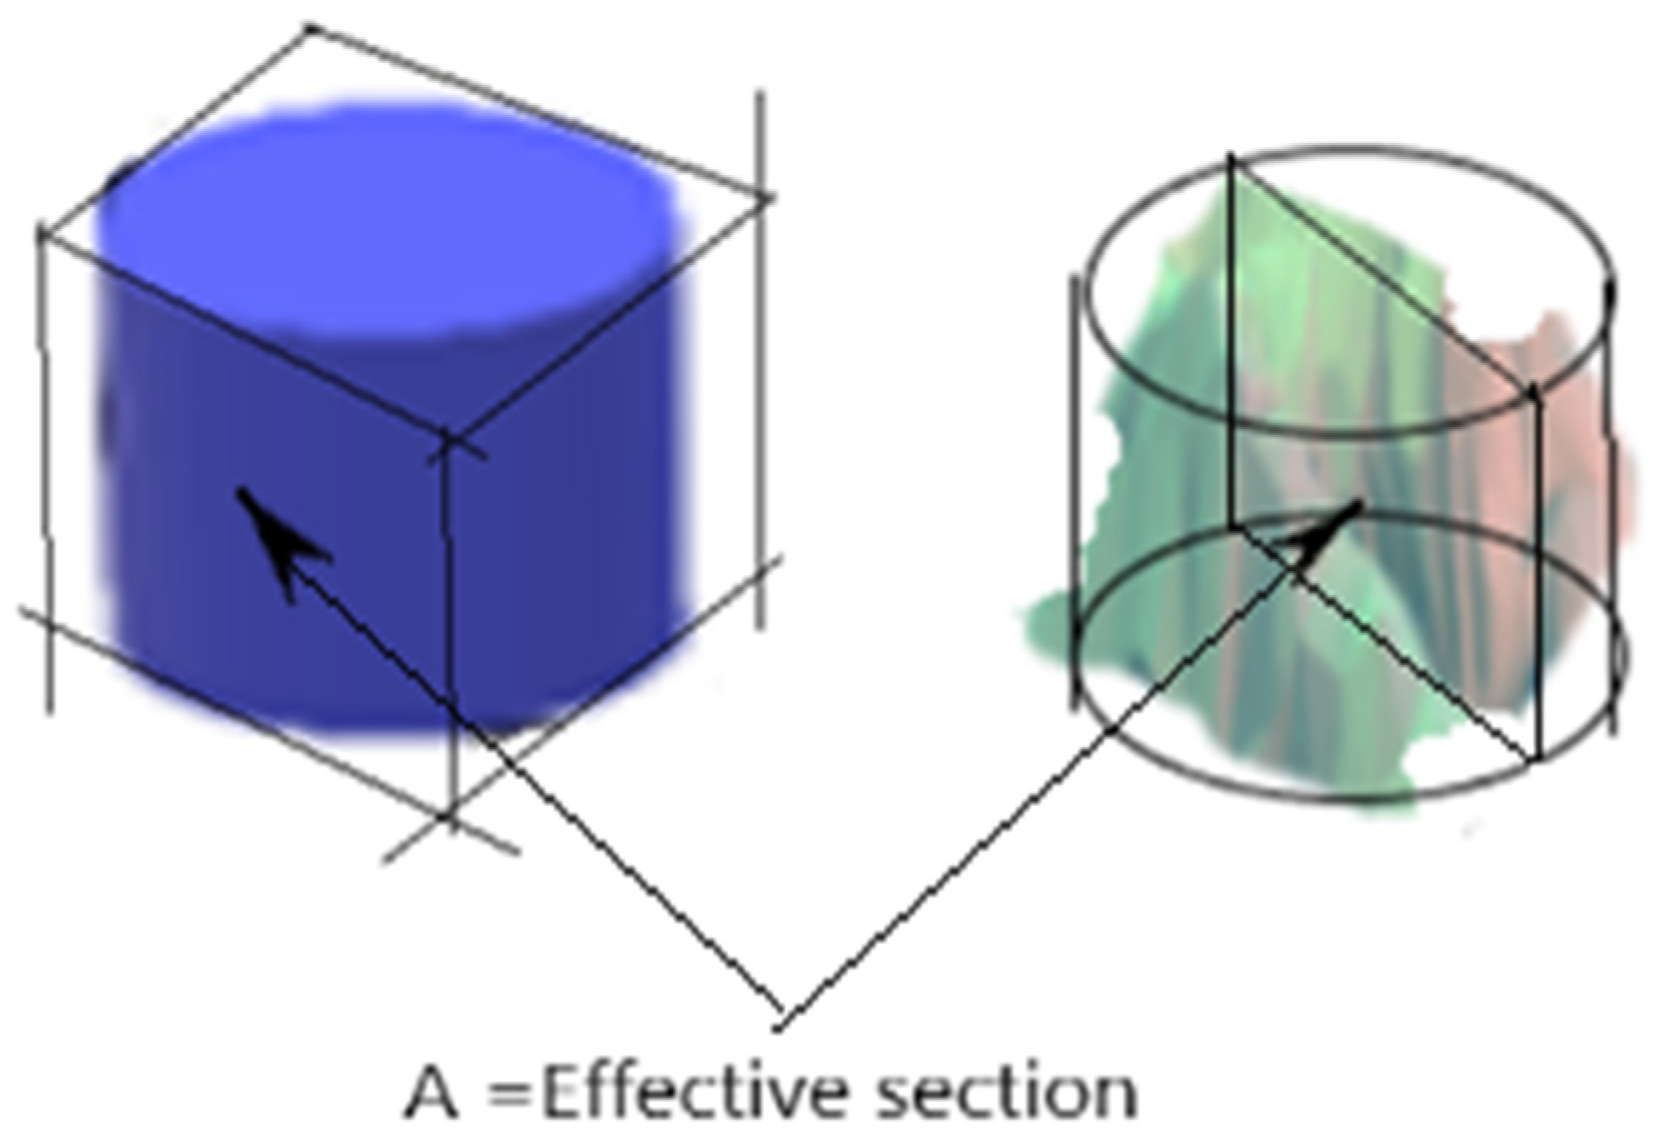
It is possible to study the interactions with other volumetric geometries by changing the parallelepiped for a cylinder and for an irregular volumetric figure whose effective section, A, is contained in the straight parallelepiped and in the cylinder, as shown in
Figure 3.
1.2. Thermal and Mechanical Turbulence
Figure 4 is an approximate representation of the behavior of thermal and mechanical turbulence.
Thermal or convective turbulence, also known as free convection, consists of ascending currents of warm air and descending currents of cold air due to the effect of buoyancy.
Updrafts form near the ground due to the heating of the air near the surface. This heating causes the air to become warmer than the surrounding air, and it begins to rise because it is less dense. This process occurs at several nearby points, forming several curtain-like updrafts. The intersection of these currents generates a single upward movement that we can identify as a plume with a diameter of about 100 m.
At higher levels within the boundary layer, these plumes tend to group together to form larger updrafts, on the order of a kilometer in diameter, known as thermals. Some of these updrafts, provided they have sufficient moisture content to reach the condensation stage, become visible through the formation of cumulus clouds.
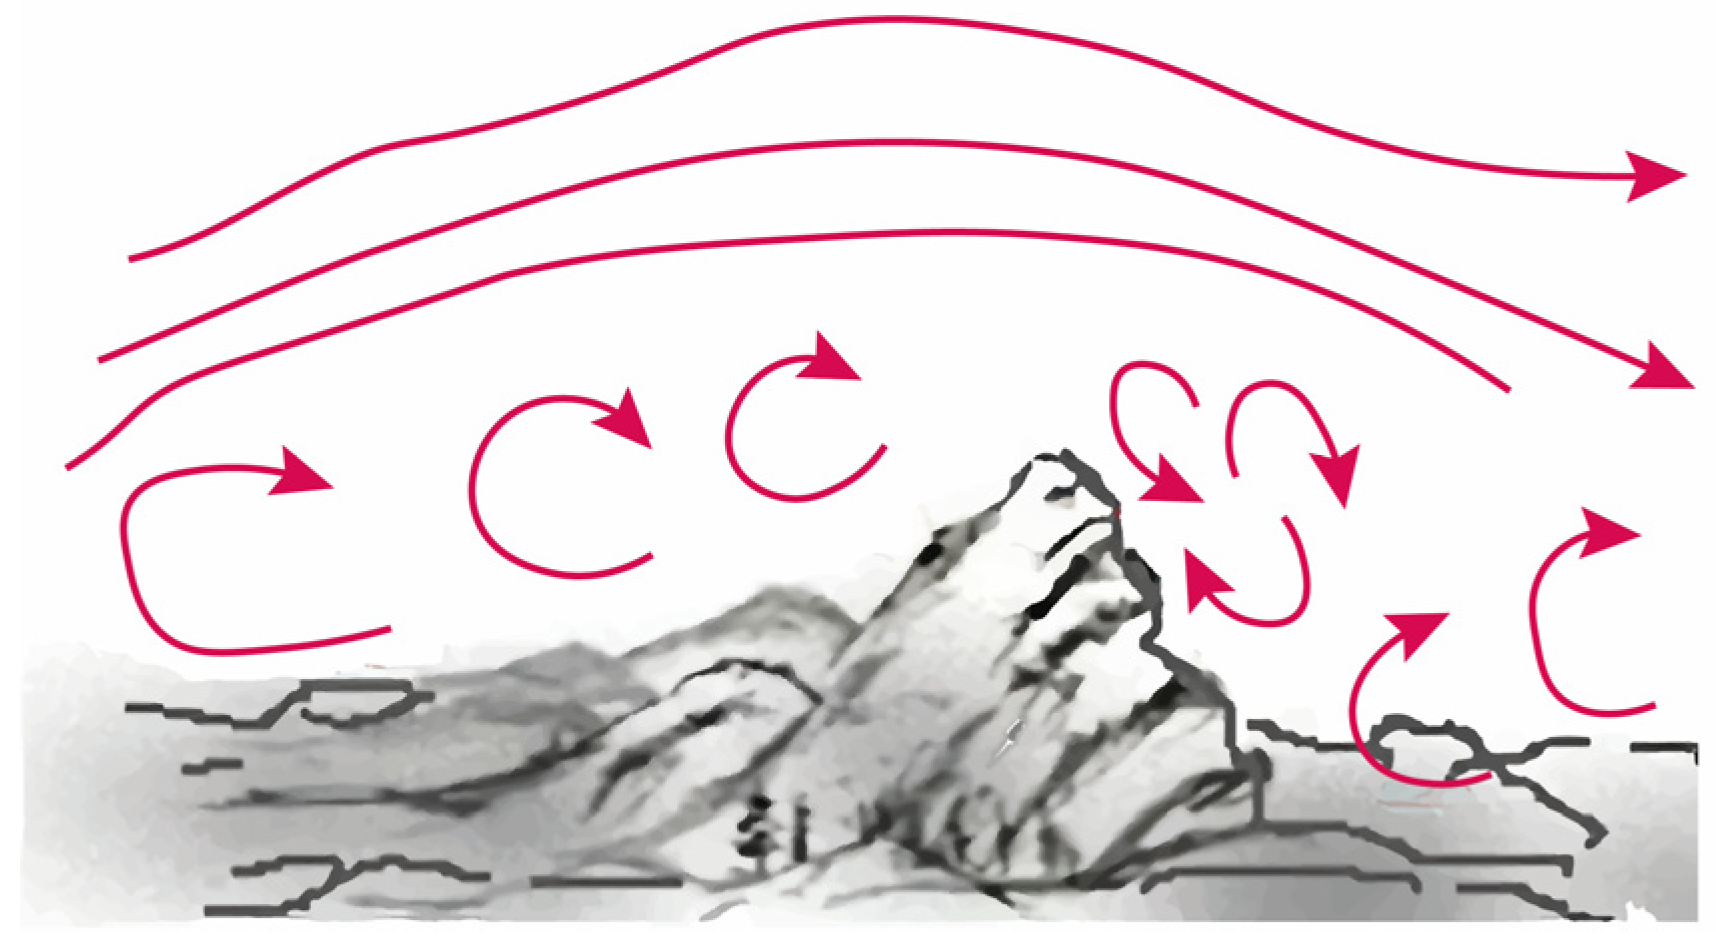
Mechanical turbulence, shown in
Figure 5, occurs when obstacles, such as buildings, uneven terrain, or trees, interfere with the normal flow of wind.
1.3. Turbulence Dissipation
Like all motion, turbulence is associated with a certain kinetic energy, which varies depending on the size of the eddy. This turbulent kinetic energy is not conserved and is continuously dissipated internally due to the viscosity of the fluid. Dissipation causes the disappearance of turbulence and occurs in smaller eddies.
Therefore, recalling the mechanism of inertial turbulence generation, which involves the loss of energy from larger eddies to form smaller ones, and taking into account that energy is dissipated in the latter, for turbulence to exist, larger-scale mechanical and thermal generation processes must continuously exist. Otherwise, once turbulence dissipates in small eddies, it would cease to exist.
3. Results
Mandelbrot [
40,
41] pointed out that fractals are, in many ways, more natural, and therefore better intuitively understood by humans, than artificially smoothed objects based on Euclidean geometry. Might we add that the atmosphere interacts differently with fractal objects? What is the basis of this difference? And what magnitude would allow us to quantitatively assess this atmosphere–fractal objects relationship?
We know that one of the major problems facing humanity is atmospheric warming, which causes climate change due to human activity. That is, we generate more heat than the atmosphere can naturally process [
42,
43,
44,
45]. Direct observation of practically all human cities shows structures (used as family homes, industrial warehouses, buildings, etc.) with geometric shapes of parallelepipeds (in all of their variations: straight, irregular, cubic, etc.) and cylinders. Cones and pyramids are very rare cases. Therefore, it seems reasonable to focus on these types of geometric volumes and their effect on the micrometeorology of the boundary layer.
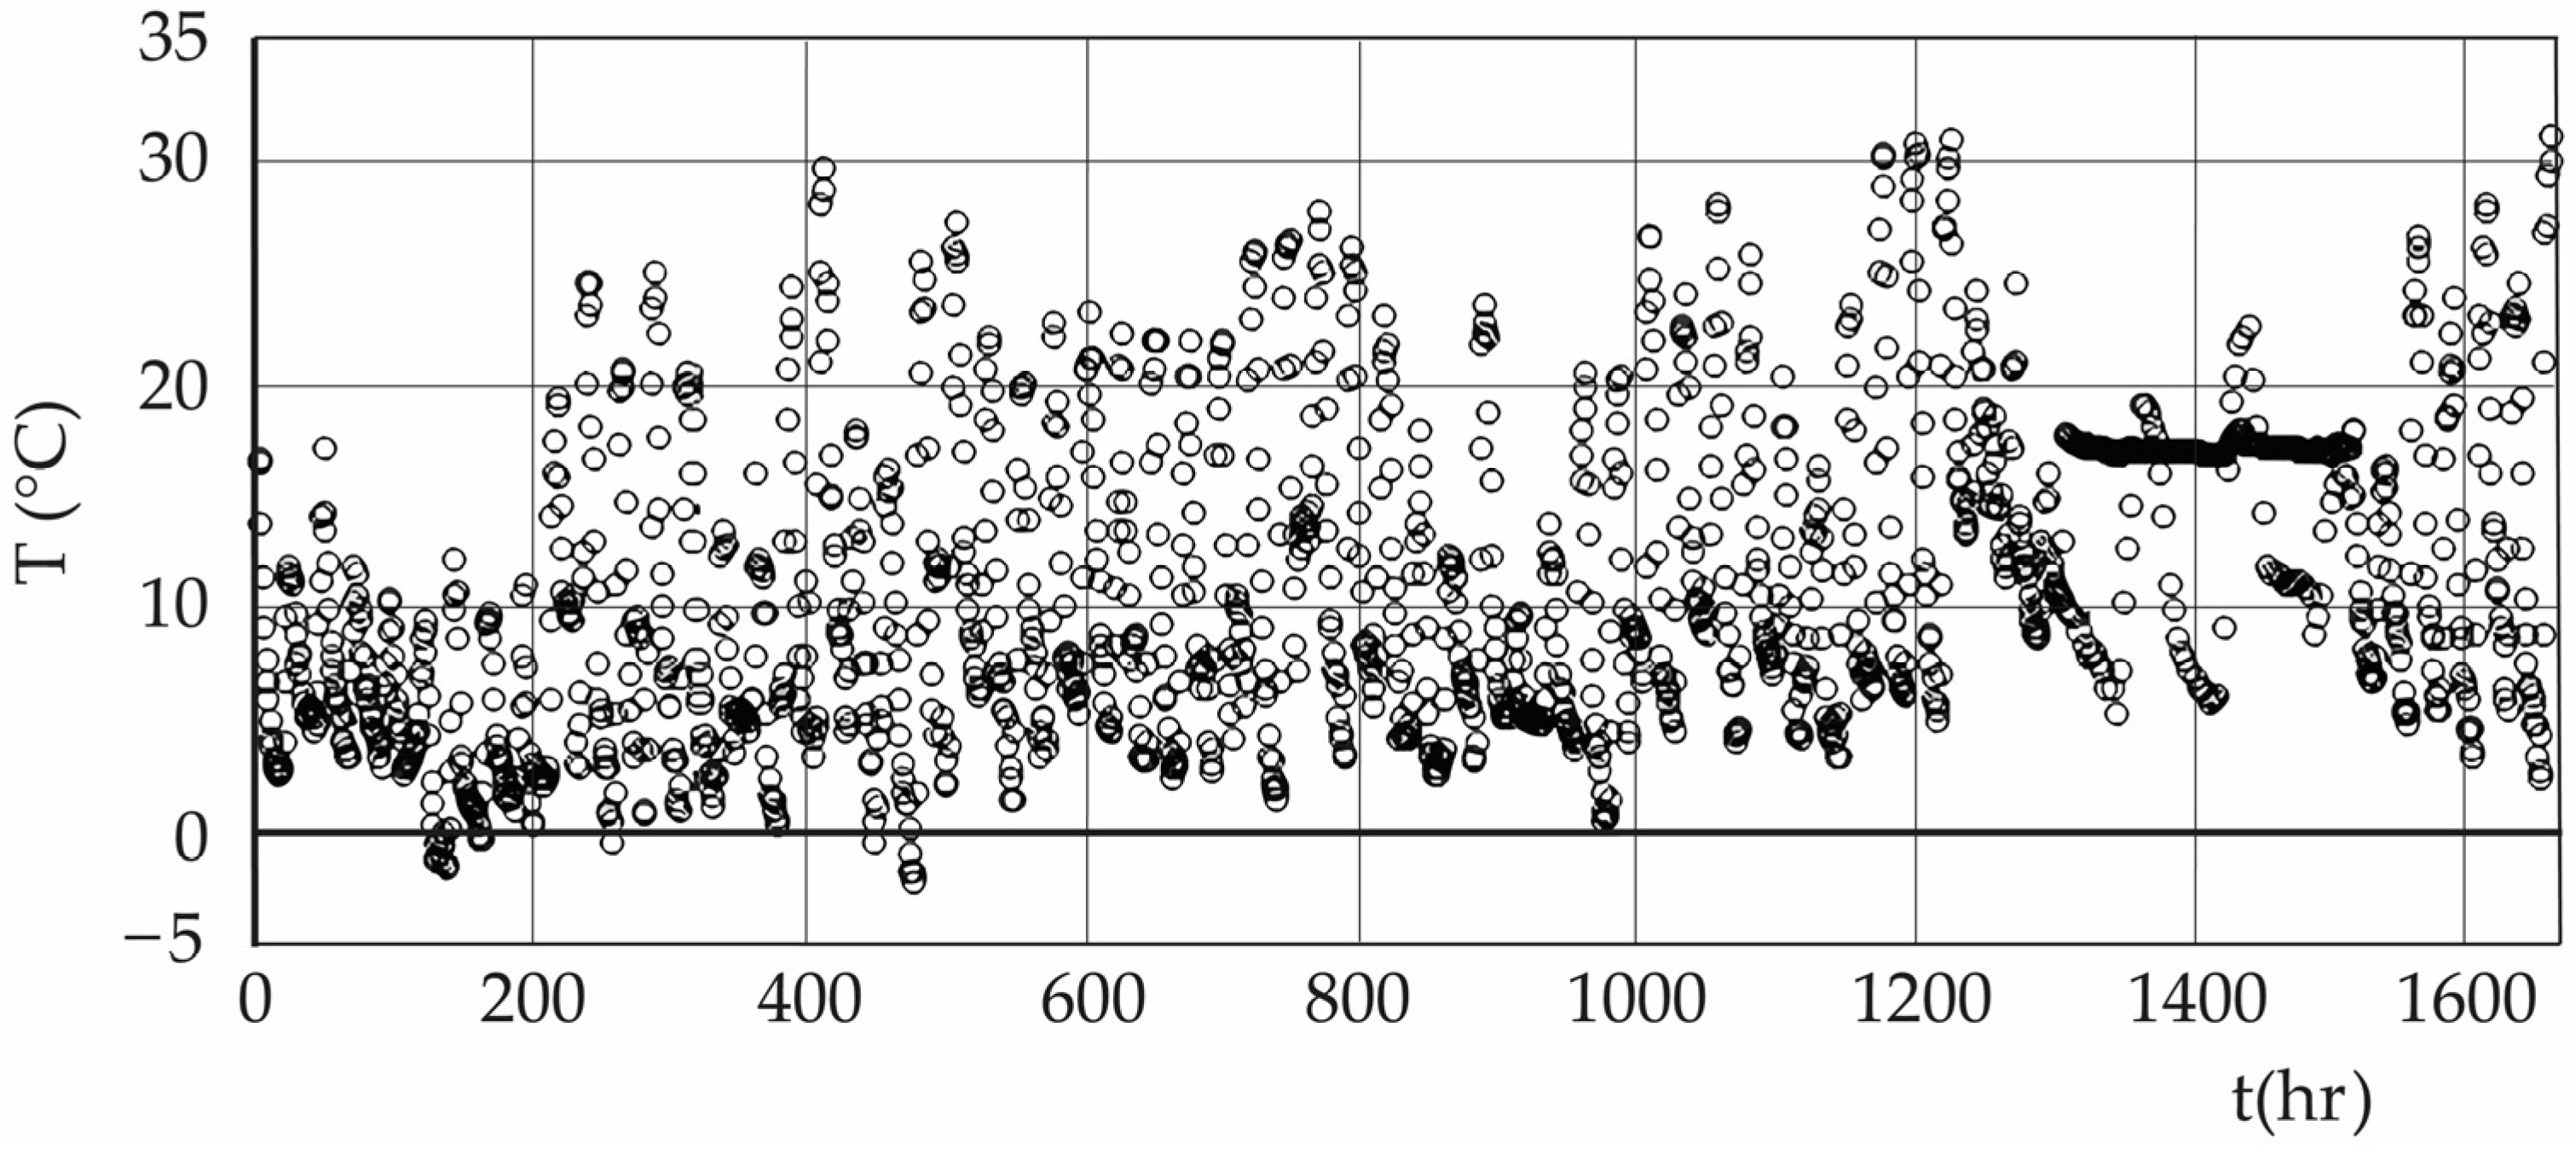
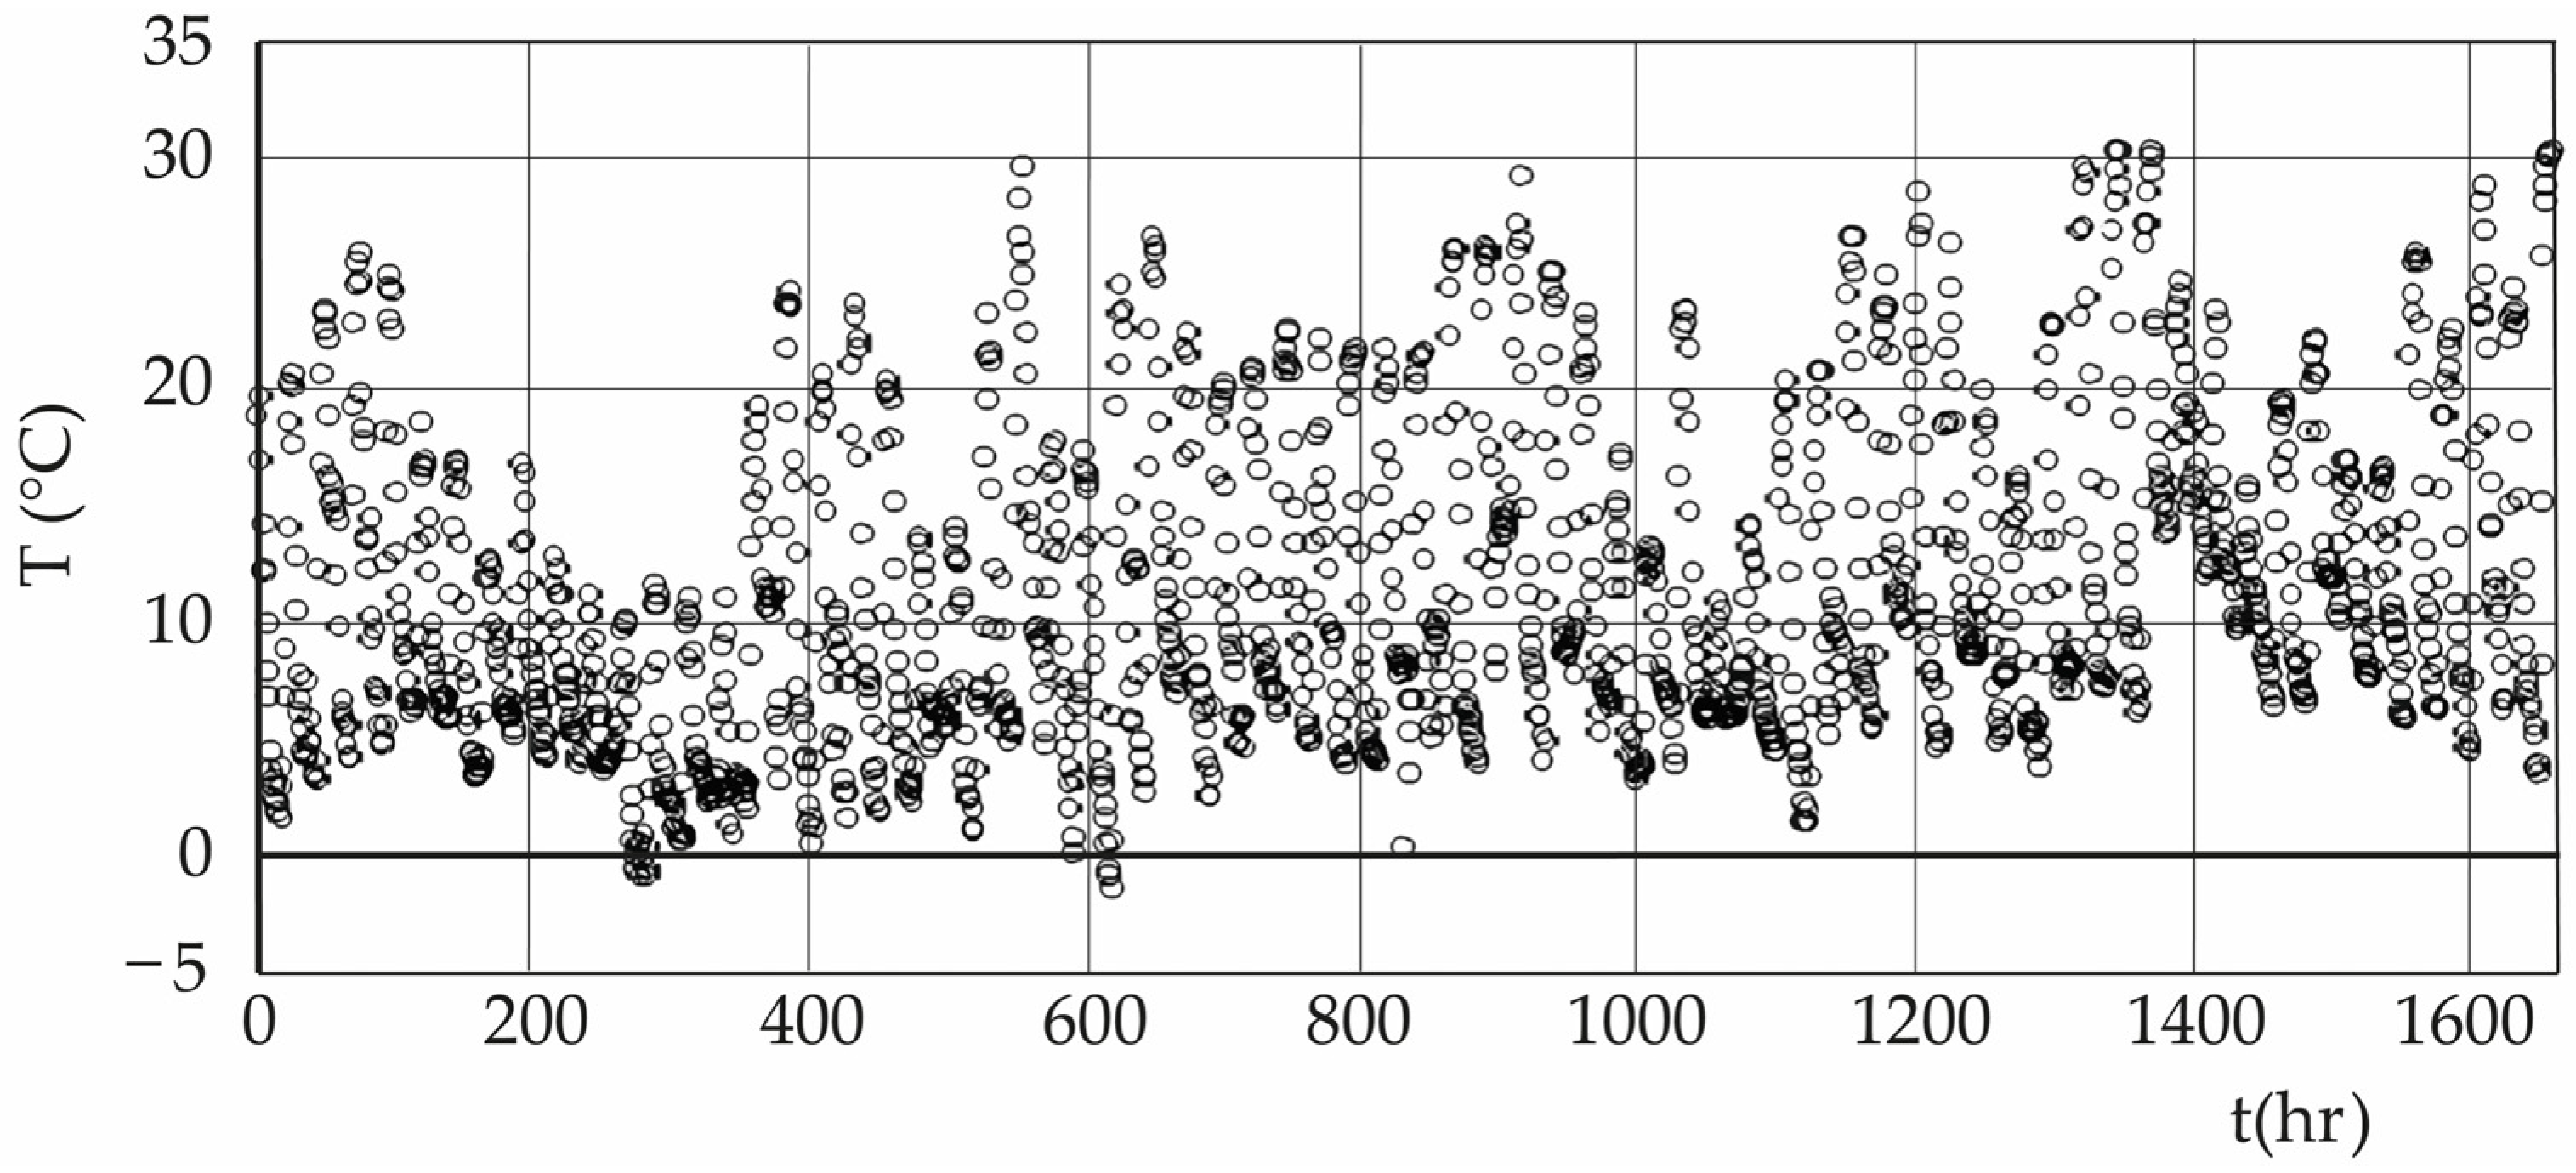
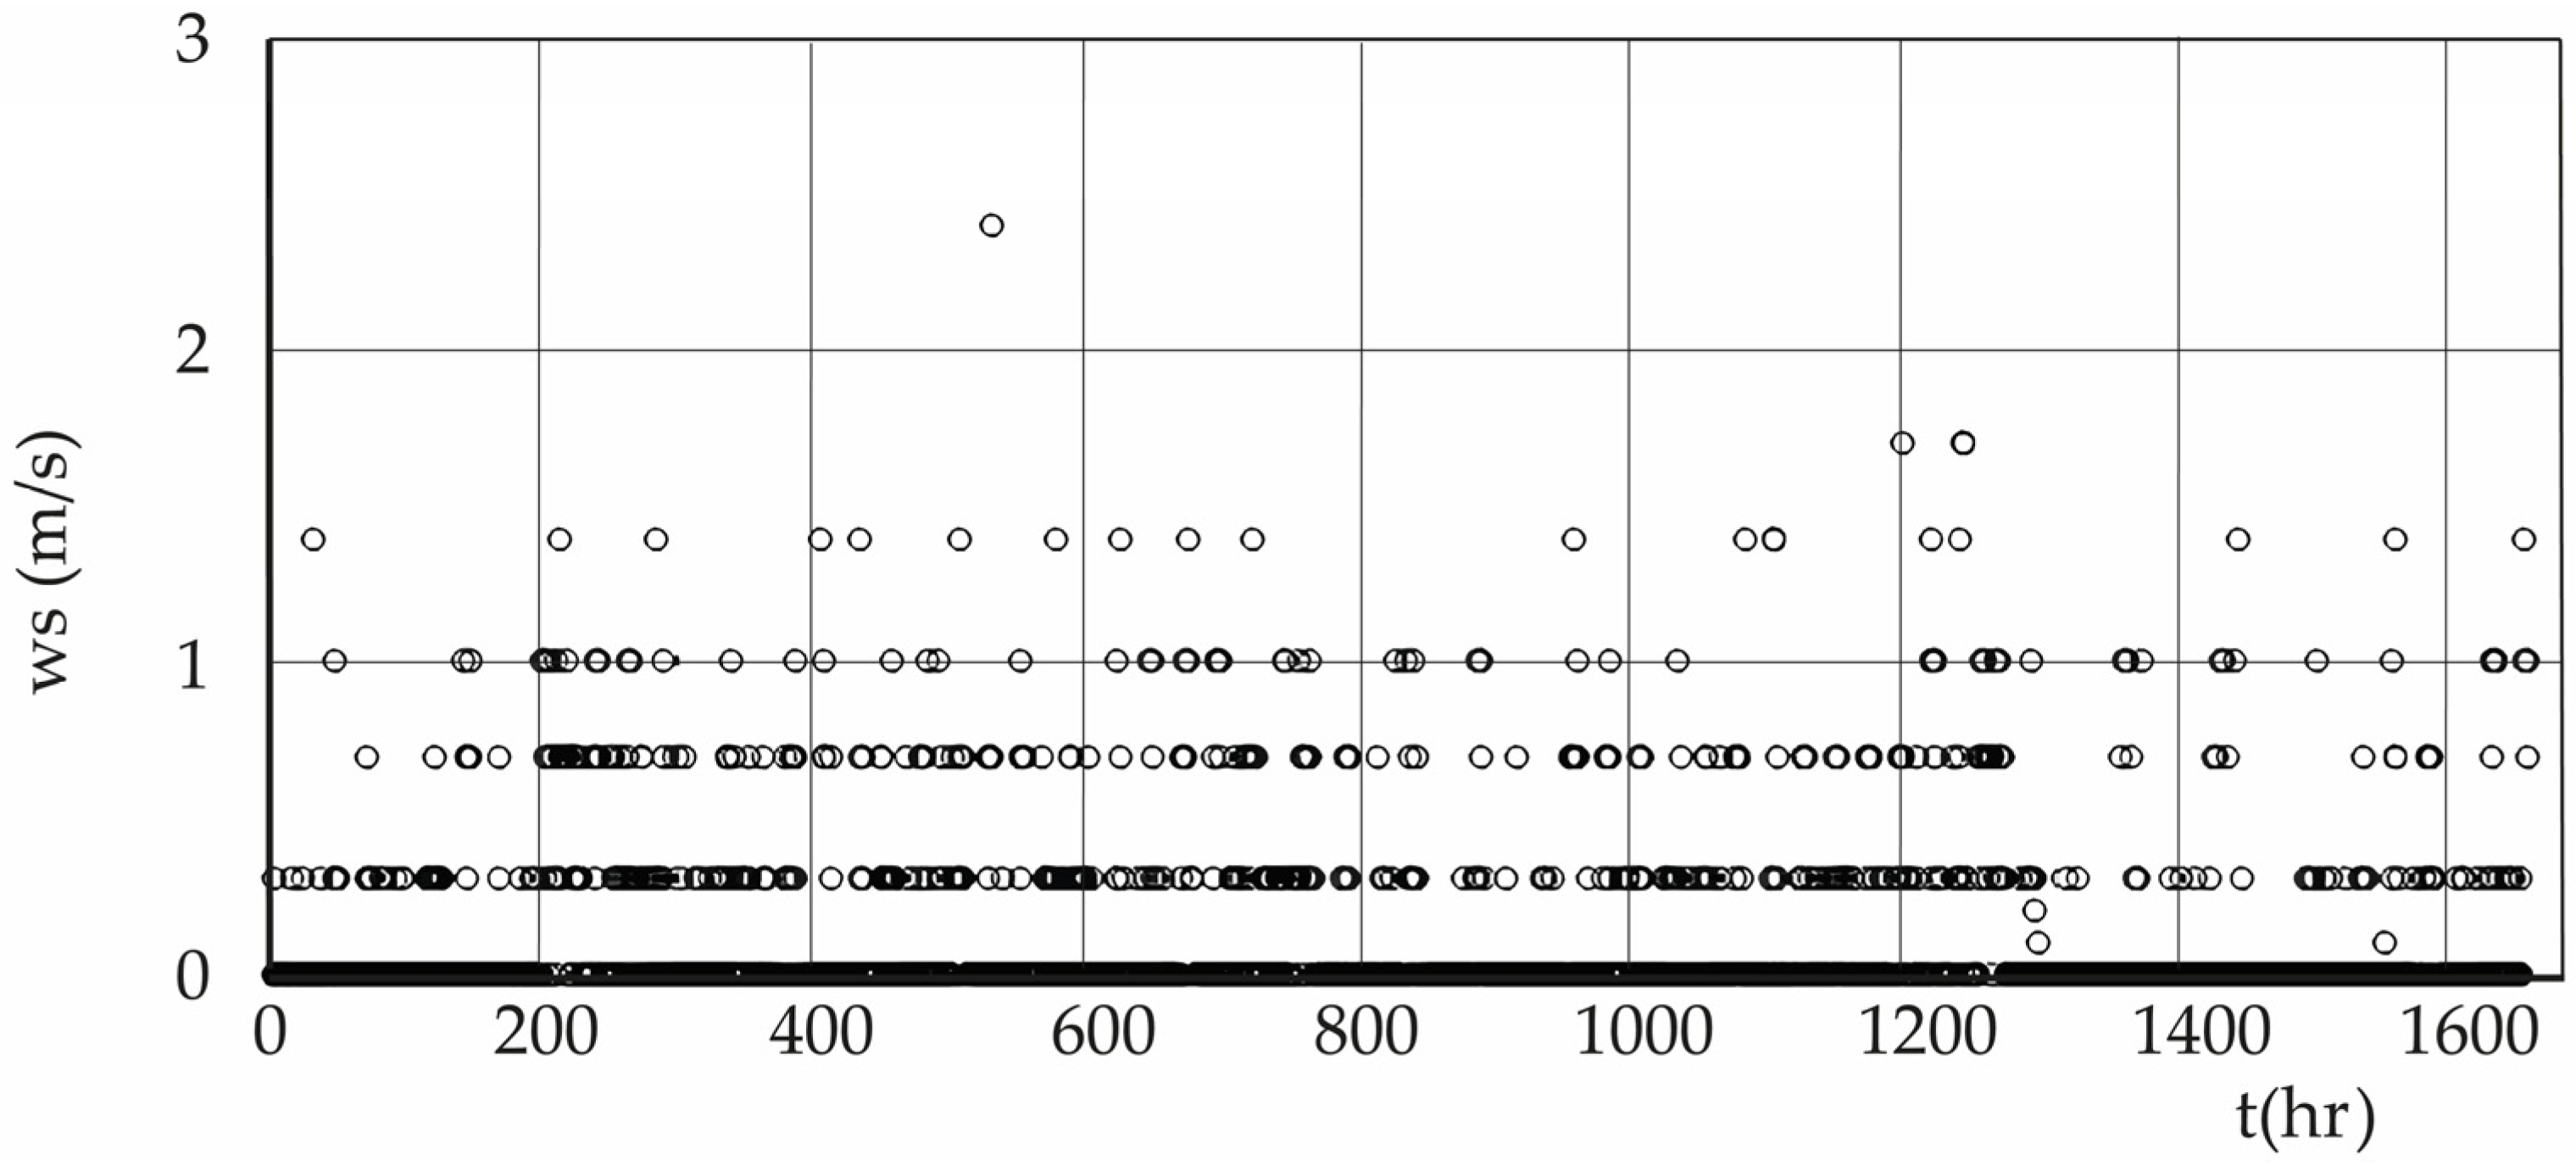
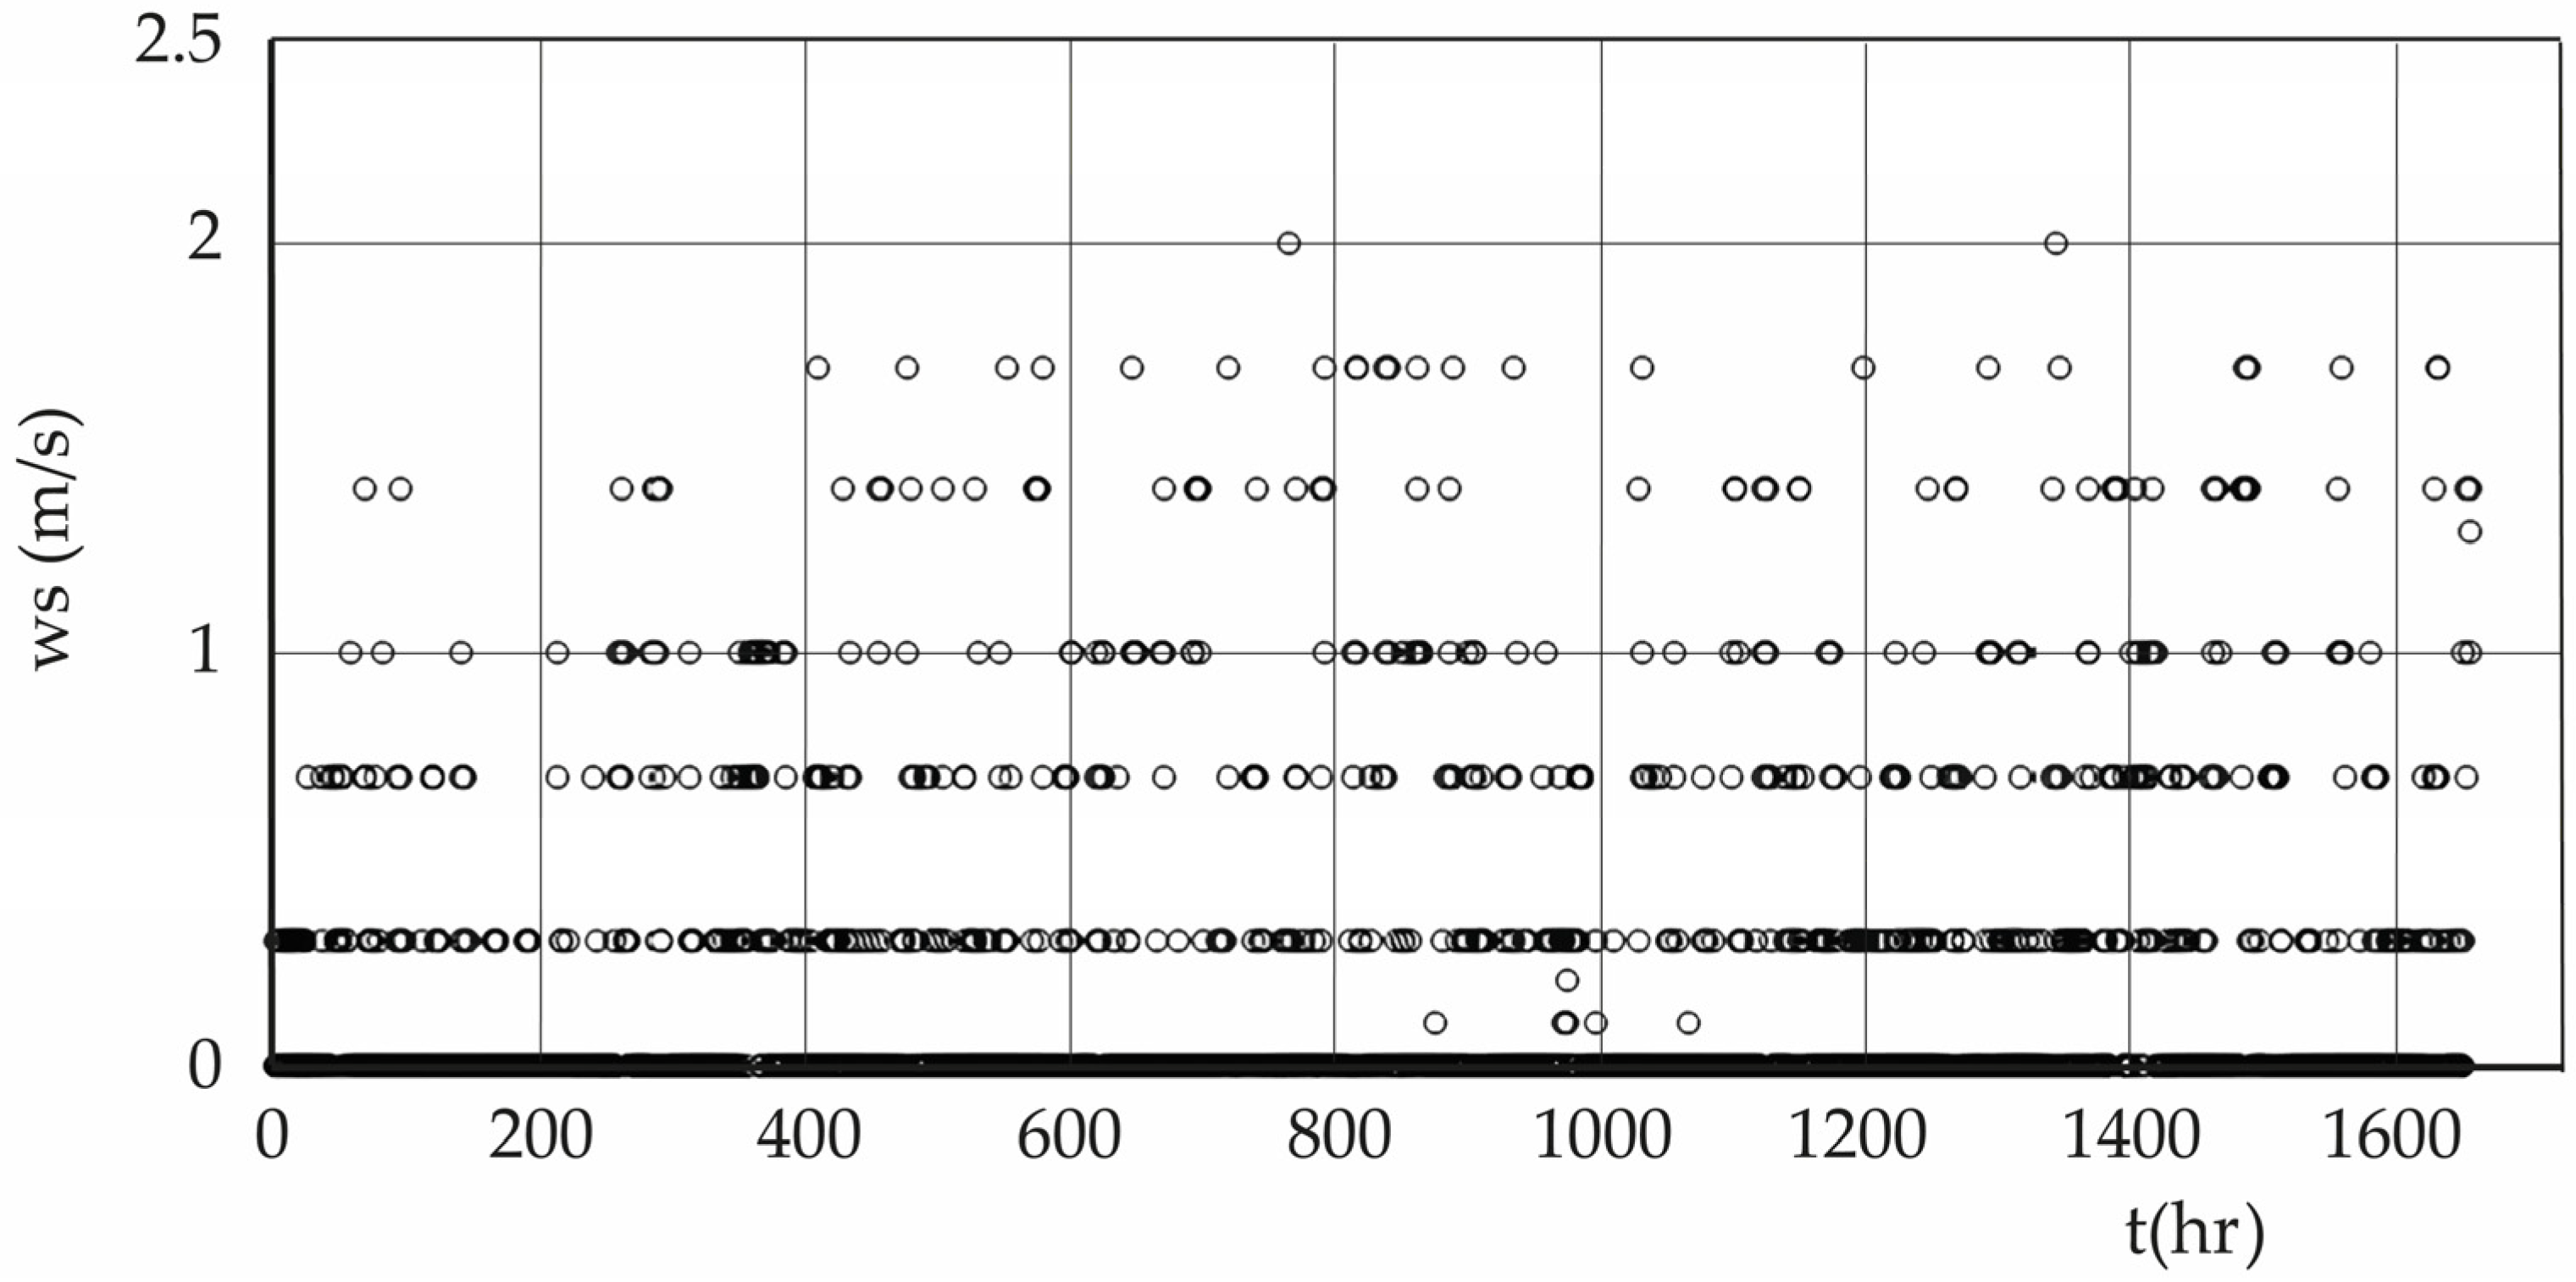
Is it possible to develop a test to verify, comparatively, which human geometric construction generates the greatest heat flow into the atmosphere? As a first step towards this investigation, three geometric volumes can be used: a right parallelepiped, a right cylinder, and a miniature artificial mountain constructed to resemble real mountains known to admit fractal representation. The three geometric volumes were made of the same material, but the cylinder was red to see if this aspect makes any difference. They were exposed in a natural environment without any restrictions, measuring meteorological variables of temperature, relative humidity, and wind speed magnitude with two meteorological stations arranged at the same height and separation distance, in front and behind, with respect to the volumetric object. These hourly measurements, with a total of approximately 1650 h for each geometry, formed time series that can be analyzed using chaos theory, being of interest to obtain the value of the maximum Kolmogorov entropy [
30].
Parallelepiped
The parallelepiped is placed on flat, dry, non-rough terrain with constant sunlight and radiation, with sparse shrub and tree vegetation, as shown in
Figure 10. The measurement period is approximately 2.3 months, during the summer season.
Table 1 is a summary of the chaotic parameter calculations, performed using CDA software (Professional Version 2.2) [
33], on time series of temperature, relative humidity, and wind speed magnitude, measured in the vicinity of a geometric obstacle in the shape of a parallelepiped.
is the difference in entropic flux calculated from the measurements made on the opposite faces of the geometric volume.
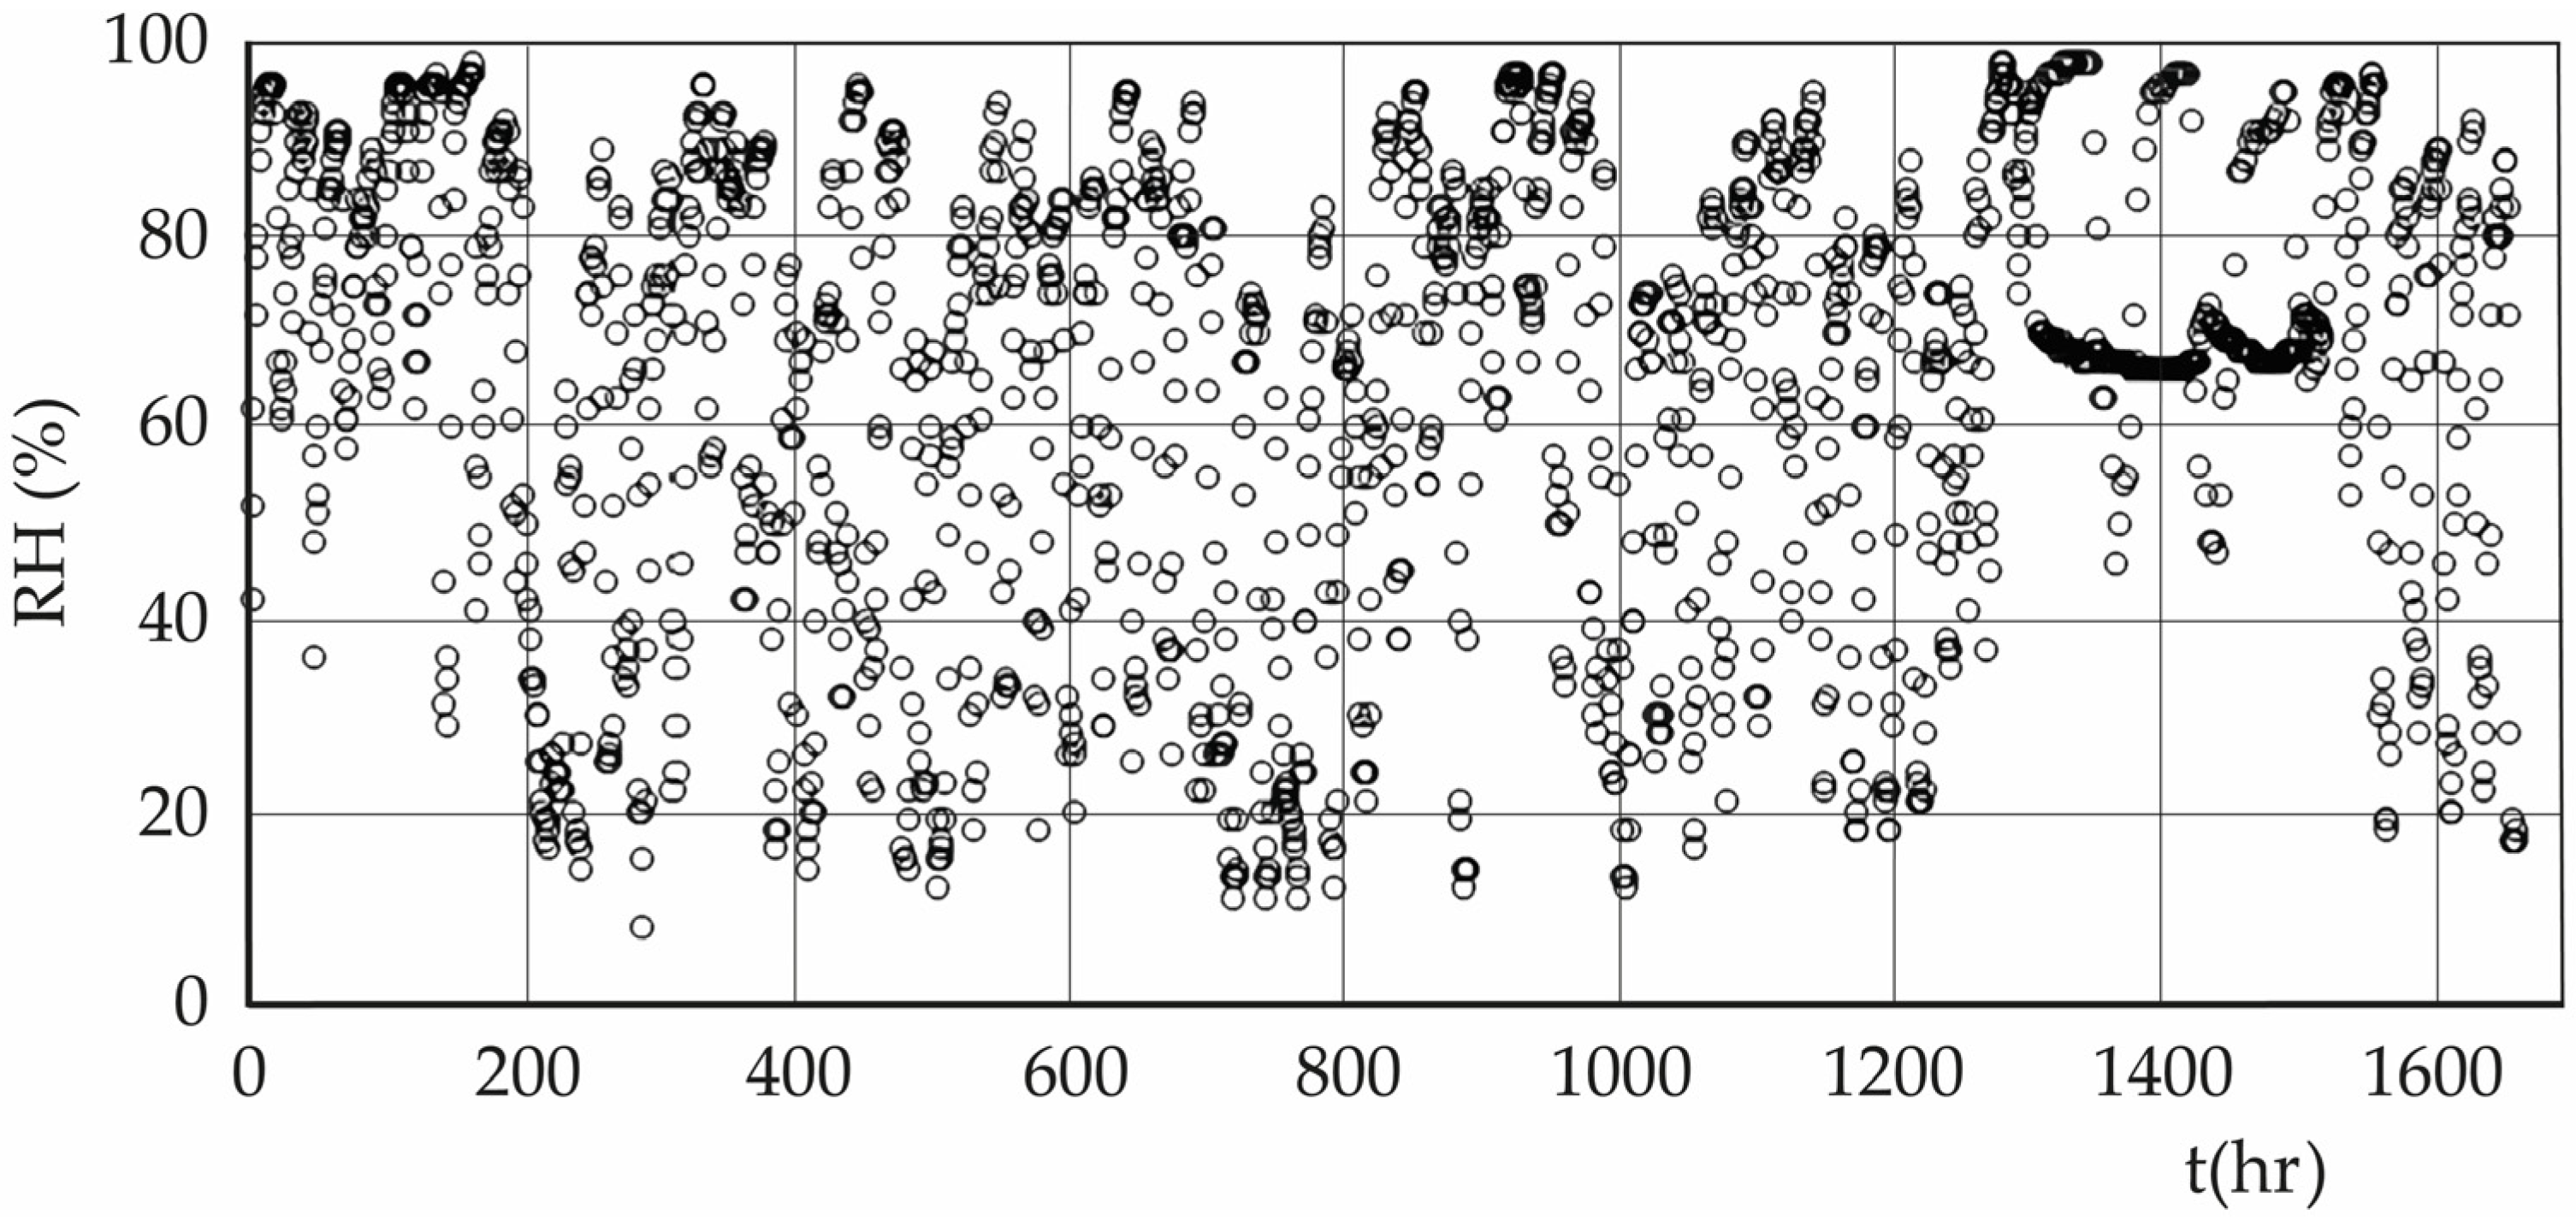
In general, the distribution of data for meteorological variables in the other two geometric volumes studied (cylinder and fractal mountain) acquires a configuration like that presented in
Figure 11,
Figure 12,
Figure 13,
Figure 14,
Figure 15 and
Figure 16, so they will be omitted.
Cylinder
The cylinder is located on flat, dry, even terrain with constant sunlight and sparse shrub and tree vegetation, as shown in
Figure 17. The measurement period is approximately 2.3 months, during the summer season.
Table 2 is a summary of the chaotic parameter calculations, performed using CDA software, for the time series of temperature, relative humidity, and wind speed, measurements taken near a geometric obstacle in the form of a cylinder.
is the difference in entropic flux calculated from the measurements made on the opposite faces of the geometric volume.
Fractal Mountain
The fractal mountain is located on flat, dry, and even terrain, with constant sunlight and sparse shrub and tree vegetation, as shown in
Figure 18. The measurement period is approximately 2.3 months, during the summer season.
Table 3 is a summary of the chaotic parameter calculations, performed using CDA software, in the time series of temperature, relative humidity, and wind speed magnitude, measurements taken near a geometric obstacle in the form of a fractal mountain.
is the difference in entropic flux calculated from the measurements made on the opposite faces of the geometric volume.
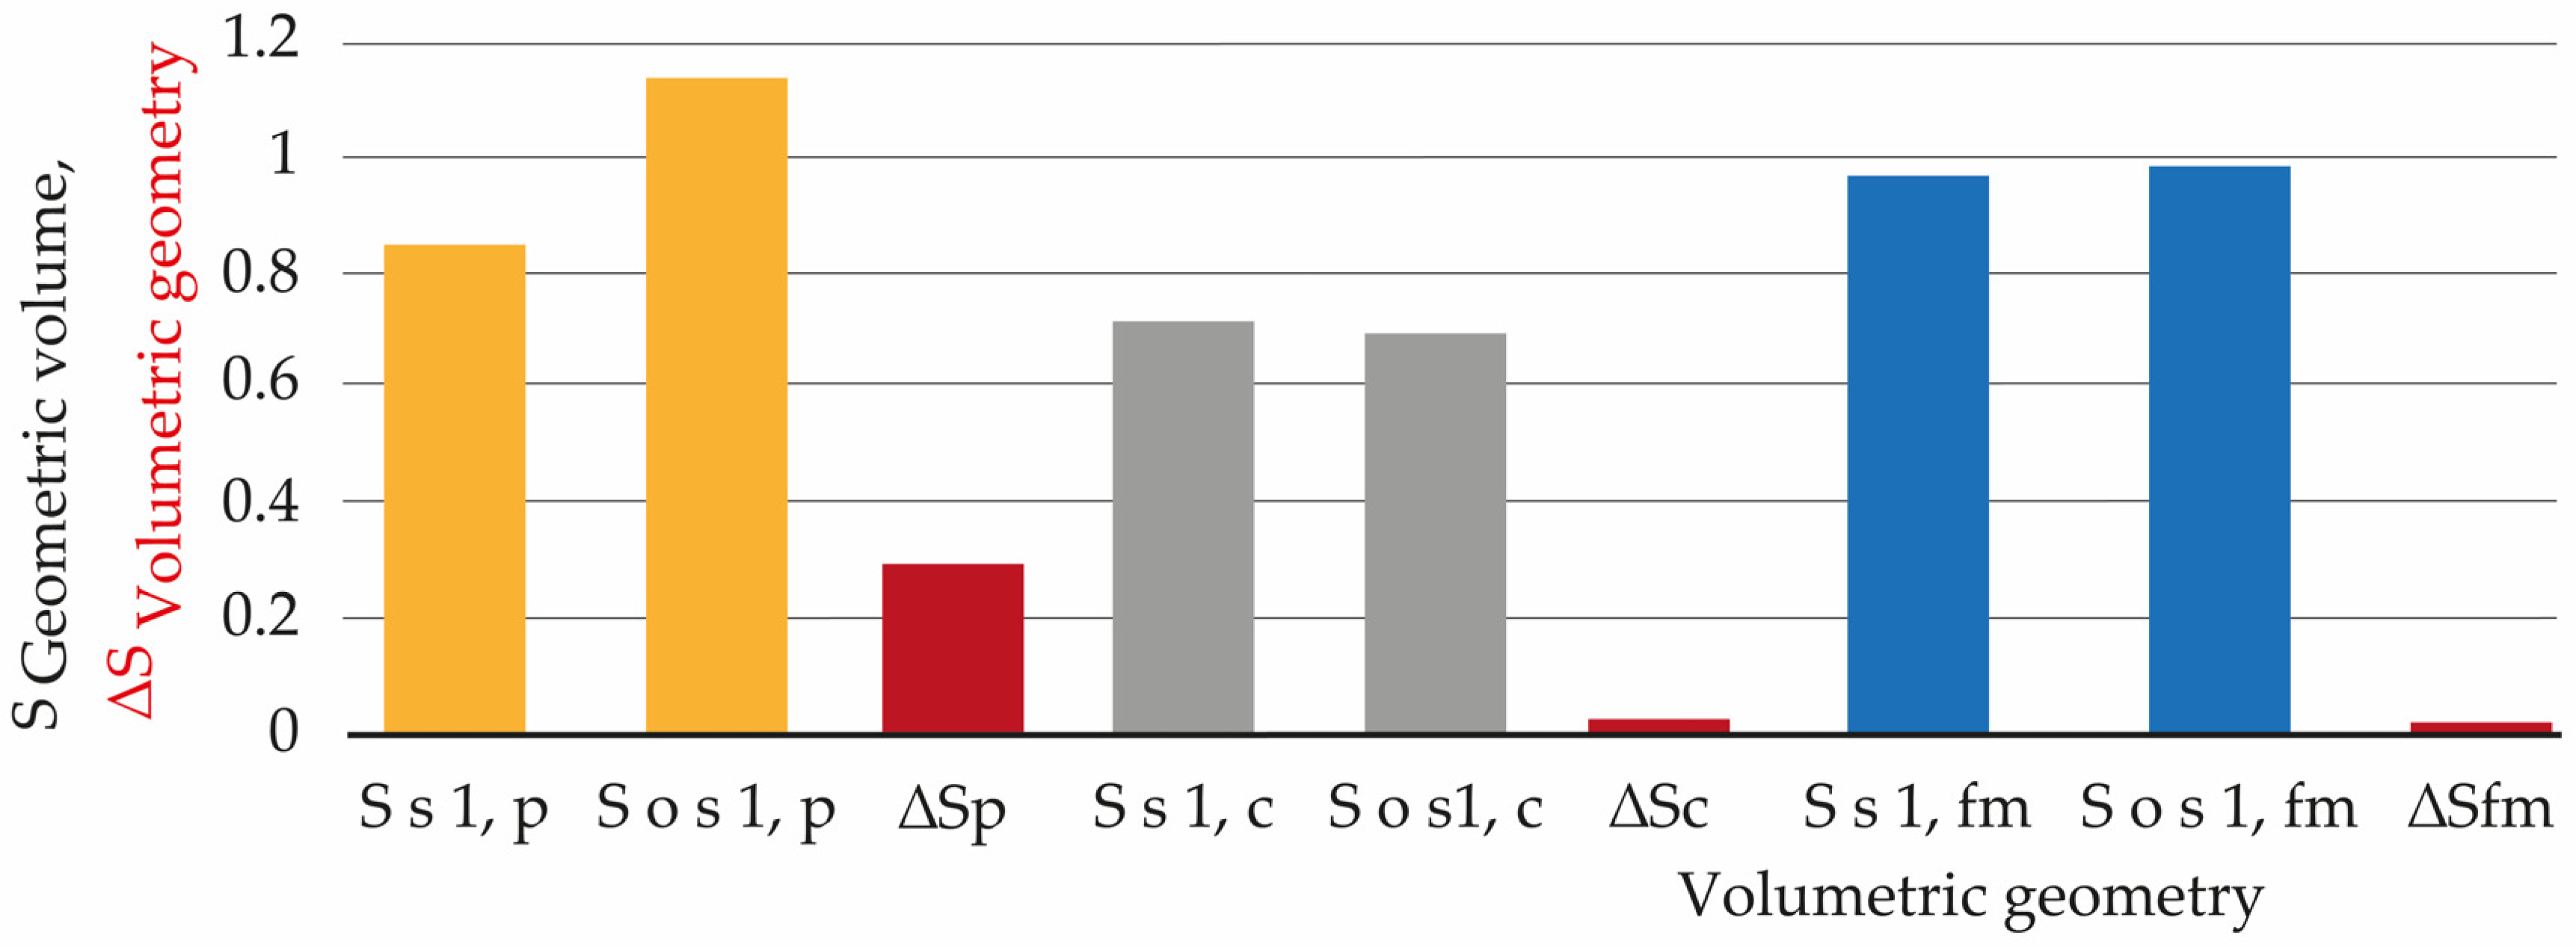
Figure 19 is a comparison chart of the maximum entropic fluxes along two opposite faces of an object with a volumetric geometry: S
s 1, p = entropic flux along face 1 of the parallelepiped; S
o s 1, p = entropic flux along the face opposite side 1 of the parallelepiped; S
s 1, c = entropic flux along face 1 of the cylinder; S
o s 1, c = entropic flux along the face opposite side 1 of the cylinder; S
s 1, fm = entropic flux along face 1 of the fractal mountain; S
o s 1, fm = entropic flux along the face opposite side 1 of the fractal mountain. The decreasing values of ΔS indicate the differences in entropic fluxes between the faces of each volumetric geometry.
A basic characteristic to consider on the surface is the albedo, which is a measure of a surface’s ability to reflect solar radiation. It is expressed as a percentage, where a high value (100%, maximum value) indicates that the surface reflects a lot of light. Conversely, a low value (for example, 10%) indicates that the surface absorbs a lot of light. The albedo also depends on the nature of the material that makes up the surface [
46]. In the case of the present investigation and according to the volumetric geometry used, the following was found.
Parallelepiped: It was constructed with veneered wood, whose albedo fluctuates between 0.15 and 0.25, a low value indicating that the surface reflects little sunlight, having a low effect on the environment.
Metal cylinder: The albedo of metals varies between 0.5 (matte metal, with little ability to reflect sunlight) and 0.98 for polished metal (with a great ability to reflect sunlight back into the environment).
For the fractal mountain constructed with white fabric, the fabric’s albedo is generally high at 0.95, reflecting a lot of sunlight back into the environment.
In this study, the surfaces with the highest albedo, the cylinder and the fractal mountain, show the lowest entropic flux into the environment. Therefore, in the context of this presentation, albedo does not have a significant impact on the results.
Table 4 presents the average temperature, relative humidity, and wind speed magnitude on the front and back of each volumetric geometry.
When comparing the ΔS values according to the volumetric geometries used,
By constructing
Table 5, which groups the volumetric geometry (VG) data studied and the entropic flux data for each case,
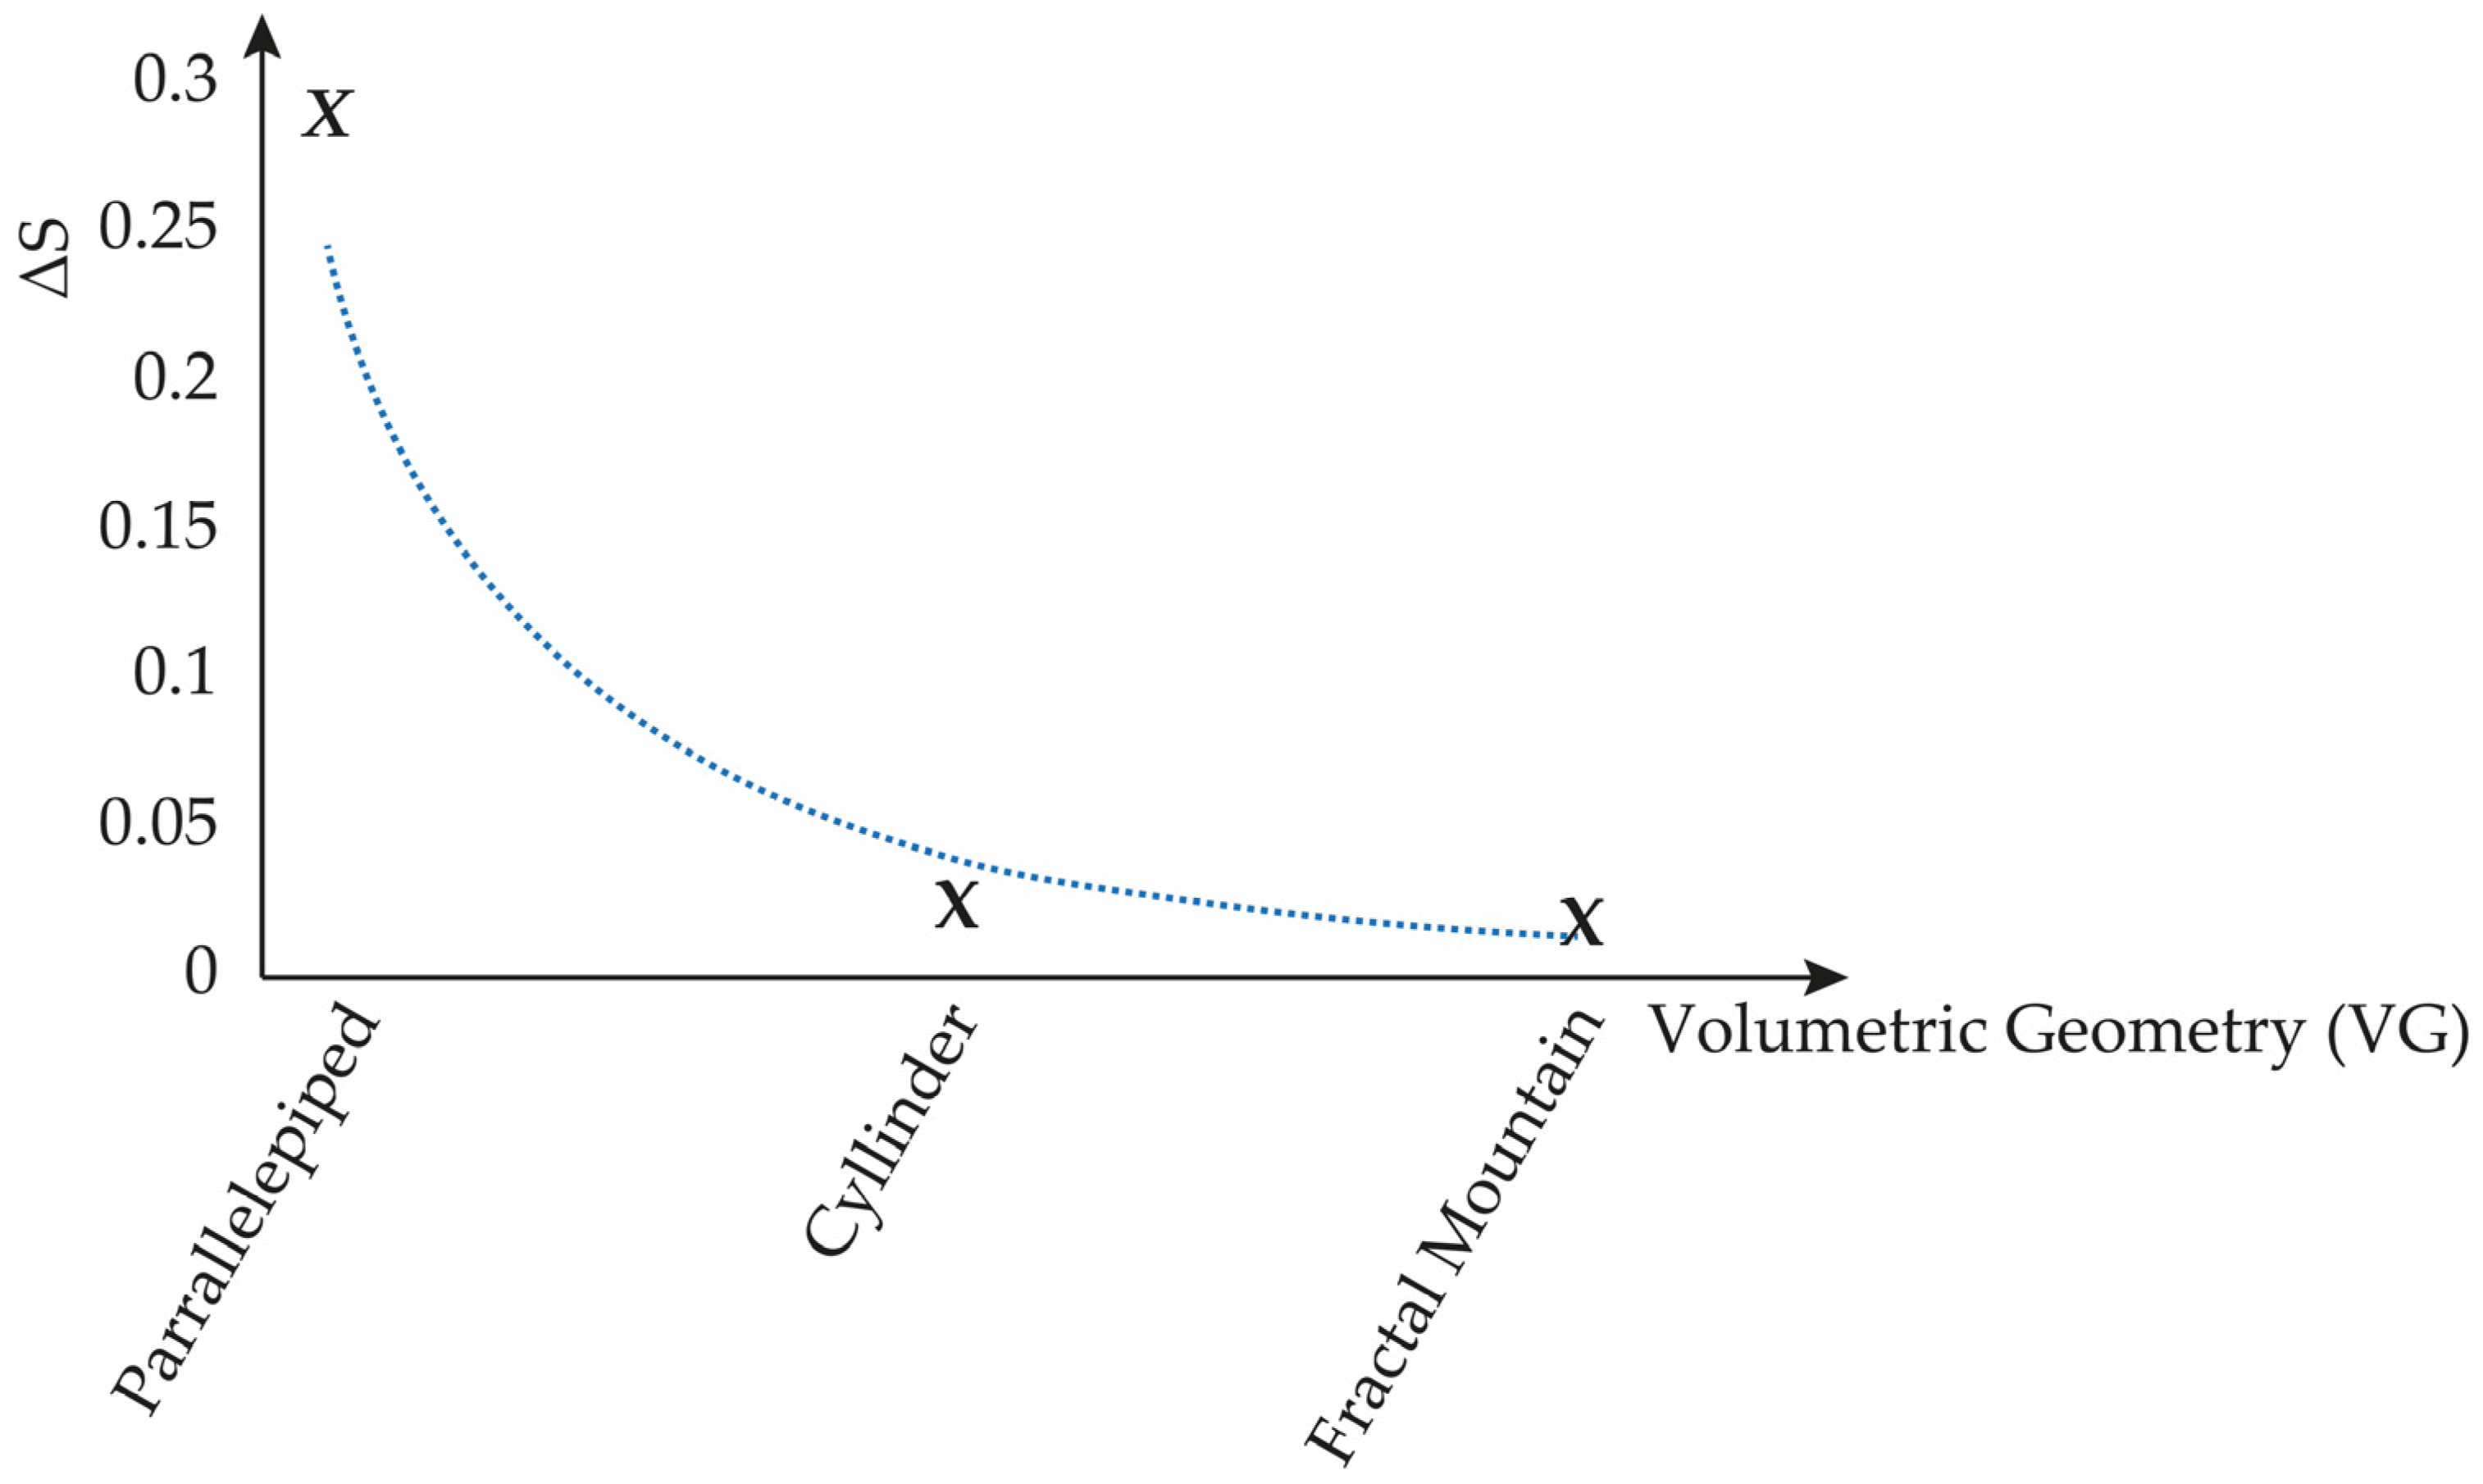
Figure 20 can be constructed.
Figure 20 shows the asymptotic decay according to the volumetric geometry of the entropic (heat) flow.
It is possible to estimate the amount of information that allows for the future behavior of an interactive system to be, approximately, predictable, and, similarly, the speed with which the system loses information over time. The loss of information (<ΔI> in (bits/h)) can be determined according to the equation
λ is the maximum Lyapunov exponent. <ΔI> was calculated as the sum of the partial contribution of each MV (meteorological variables: T, WS, RH). The fractal dimension was also determined:
where H is the Hurst exponent.
Table 6 contains a summary of the information loss and fractal dimension calculations for the different volumetric geometries studied.
The average fractal dimension of the meteorology is greater in the fractal mountain, and the cylinder loses information the fastest, while the parallelepiped causes a slower loss of meteorological information, which makes it closer to a deterministic system.
4. Discussion
The results obtained are promising for elucidating the effect of regular geometries on urban micrometeorology. The measurements were taken in an area with a relatively “pristine” or unpolluted environment. This condition may allow for the environmental response to intervention or disturbance in the form of a volumetric geometry, even if this geometry is small in size, to be complex or chaotic. Fractals can be viewed as indicators of form. They are based on a flow of repeating geometric patterns at different scales. The systems involved in the study, geographic configuration and meteorology, are fractals. The measured time series (of temperature, relative humidity, and wind speed magnitude) are used to calculate the maximum entropic fluxes originating in front of and behind the obstacles (three cases: two with regular geometry and one with fractal geometry). Calculating the difference in entropic fluxes for each case allows for comparing their reactions by obstacle type: non-fractal and fractal geometries. The maximum inflections of the entropic flow surfaces [
47,
48] are revealed in the form of thermal fluxes, similar to the energy dissipated in a mechanical system interacting with another. One possible interpretation, from a metric perspective, is that it may represent a measure of the departure of the fractal manifold metric from the Euclidean metric. In mathematics, a manifold is the standard geometric object that generalizes the intuitive notion of a curve (one-manifold) and a surface (two-manifold) to any dimension and over diverse fields (not only the real fields, but also complex and matrix fields). Entropy is a concept associated with disorder and information. In the context of Ricci flow [
49], entropy is used as a function that evolves under the flow, allowing one to study the evolution of the geometry of a spacetime and to understand its long-term behavior. Perelman [
50] introduced an entropy formula that evolves under Ricci flow, which is crucial to understanding how the flow handles singularities or maximal inflections.
The entropy time Equation (22), or entropic flux, describes the behavior of scalar quantities, such as temperature; it states that high-temperature concentrations will disperse until a uniform temperature is reached throughout the object. However, the achievement of uniformity at the surface will depend on the geometry of the object. Similarly, Ricci flow describes the behavior of a tensor quantity, the Ricci curvature tensor. Hamilton’s idea [
51] was that under Ricci flow, high-curvature concentrations would disperse until a uniform curvature is reached over the entire three-dimensional manifold.
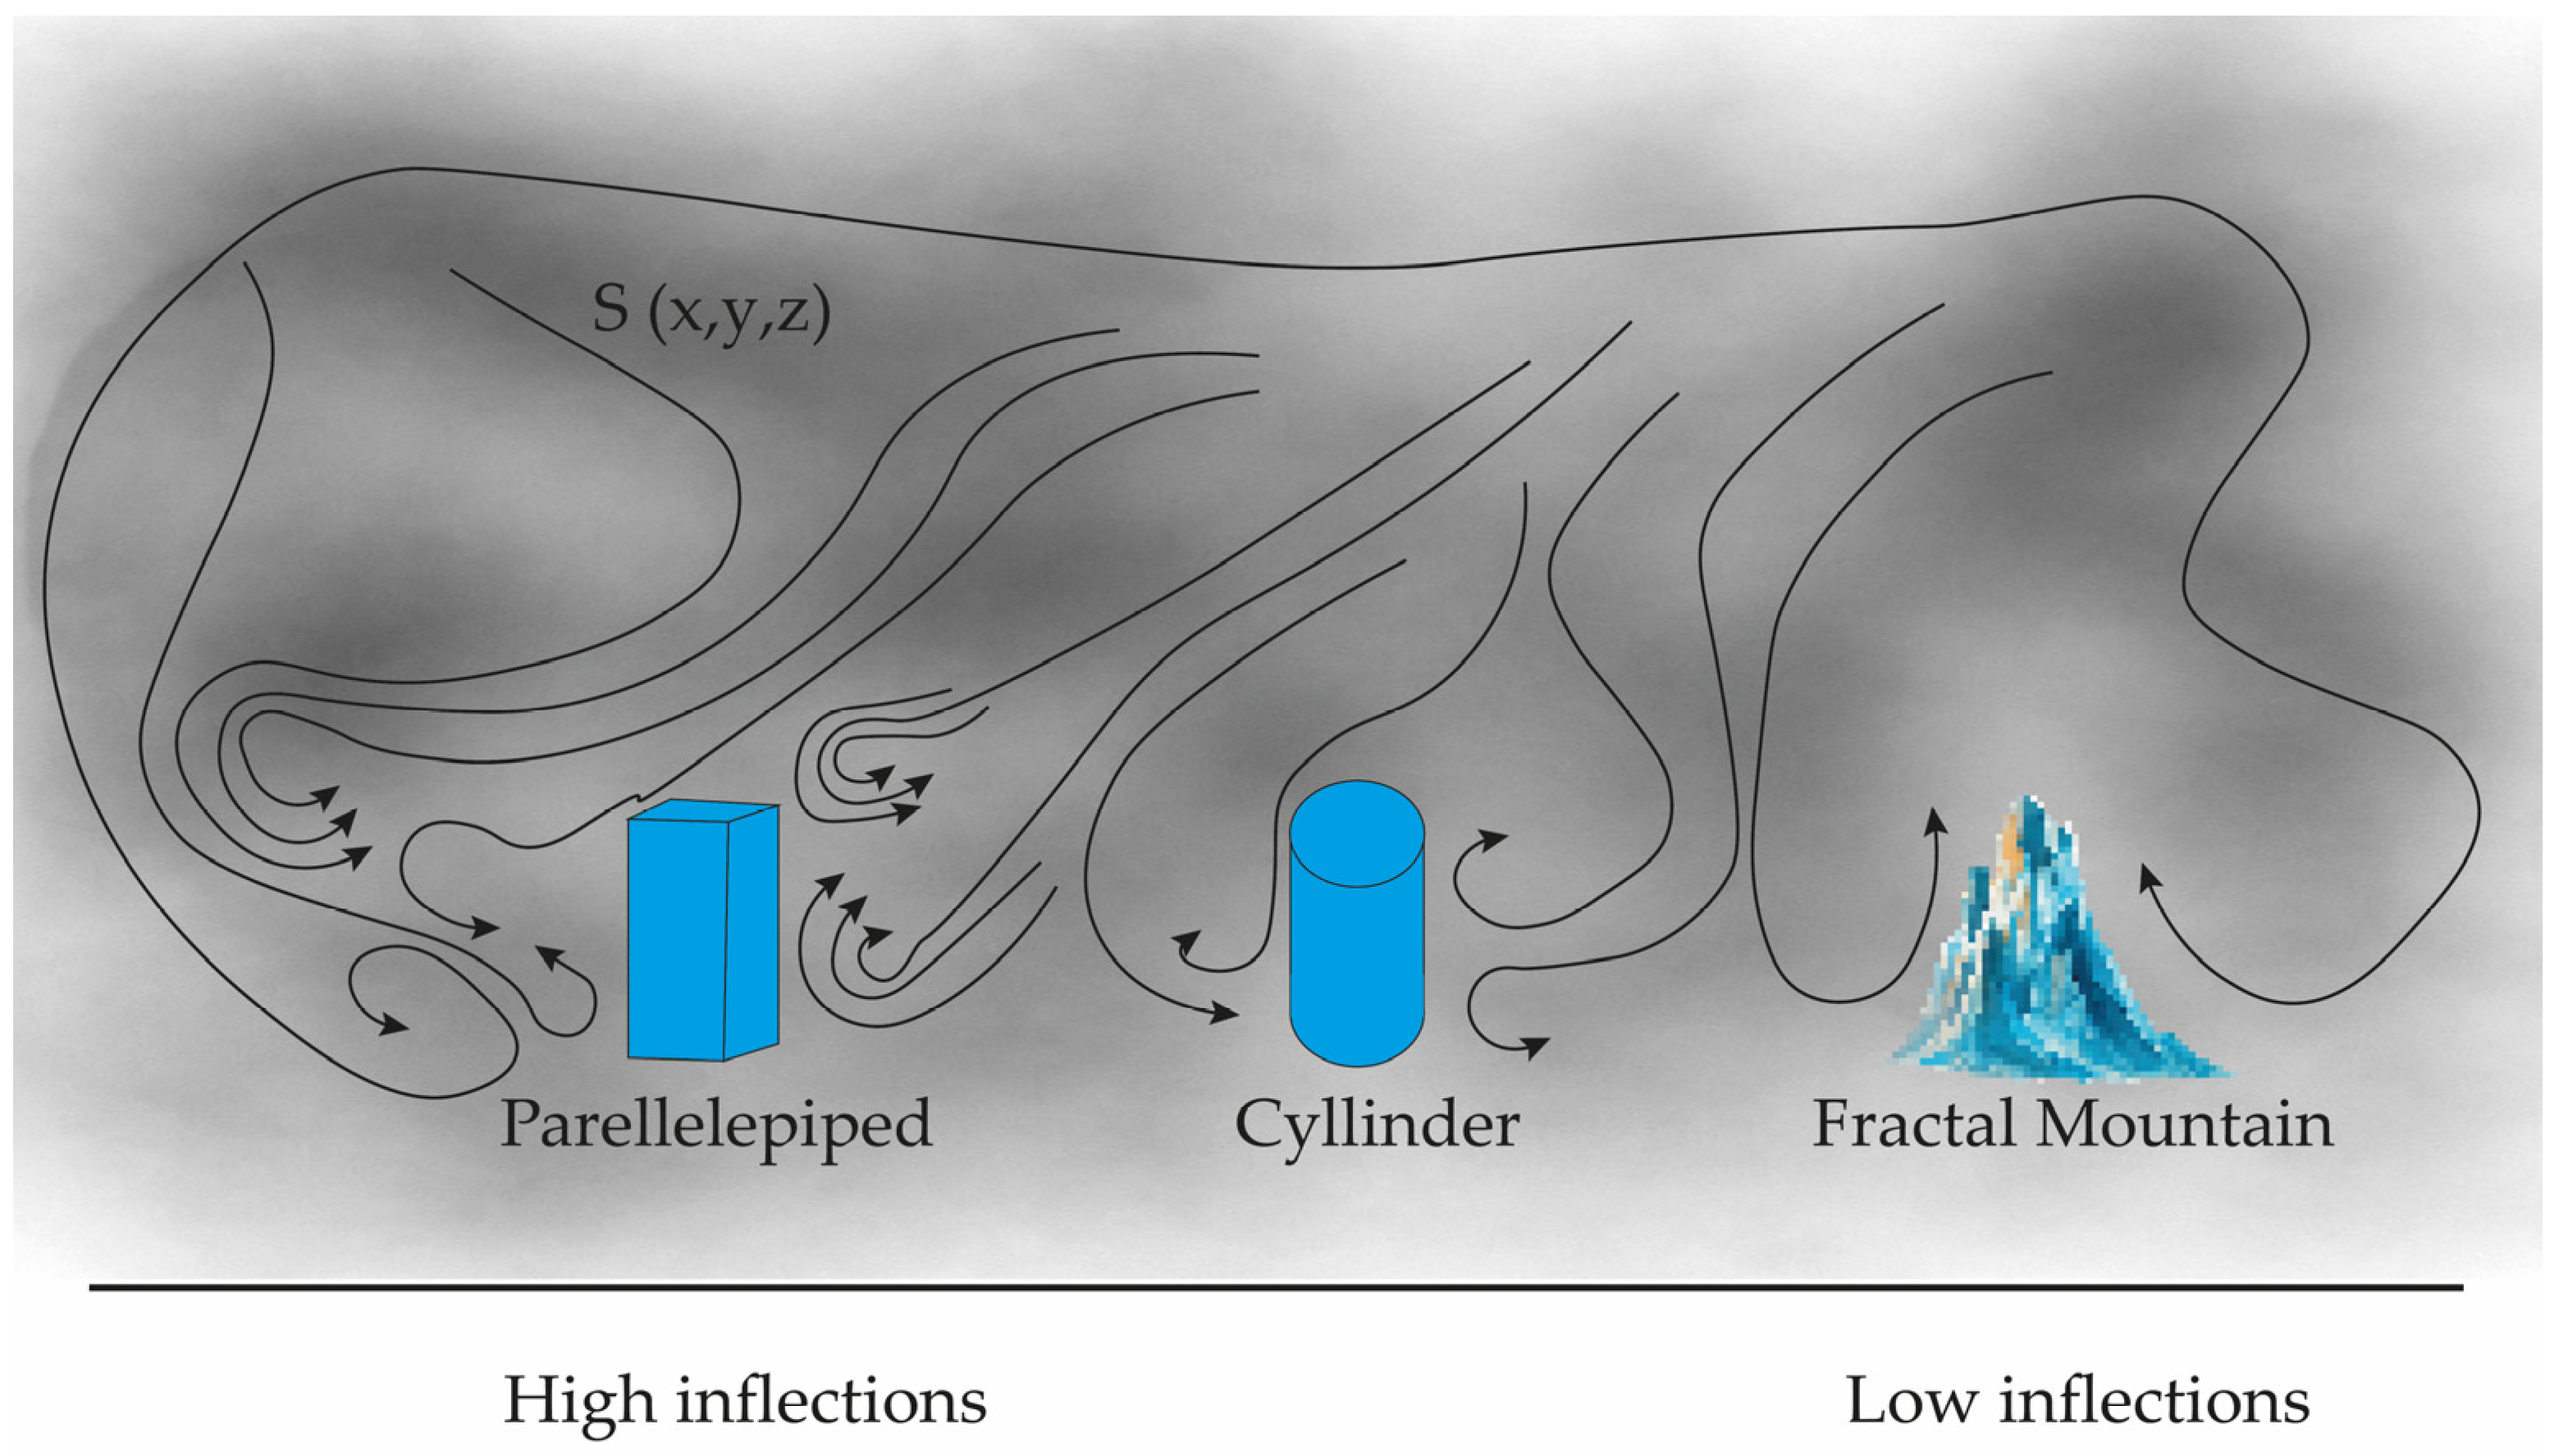
The process studied can be assumed with regular volumetric geometries that are deformed, evolving towards fractal geometry; if the initial condition of the entropic surface of urban meteorology originated by the Euclidean volumetric geometry of the parallelepiped contains high inflections, the evolution towards the fractal geometry of the regular geometry has an effect similar to the Ricci flow on the entropic surface, as it disperses the inflections until reaching the minimum inflection in the fractal mountain (fractal geometry), as shown in
Figure 21.
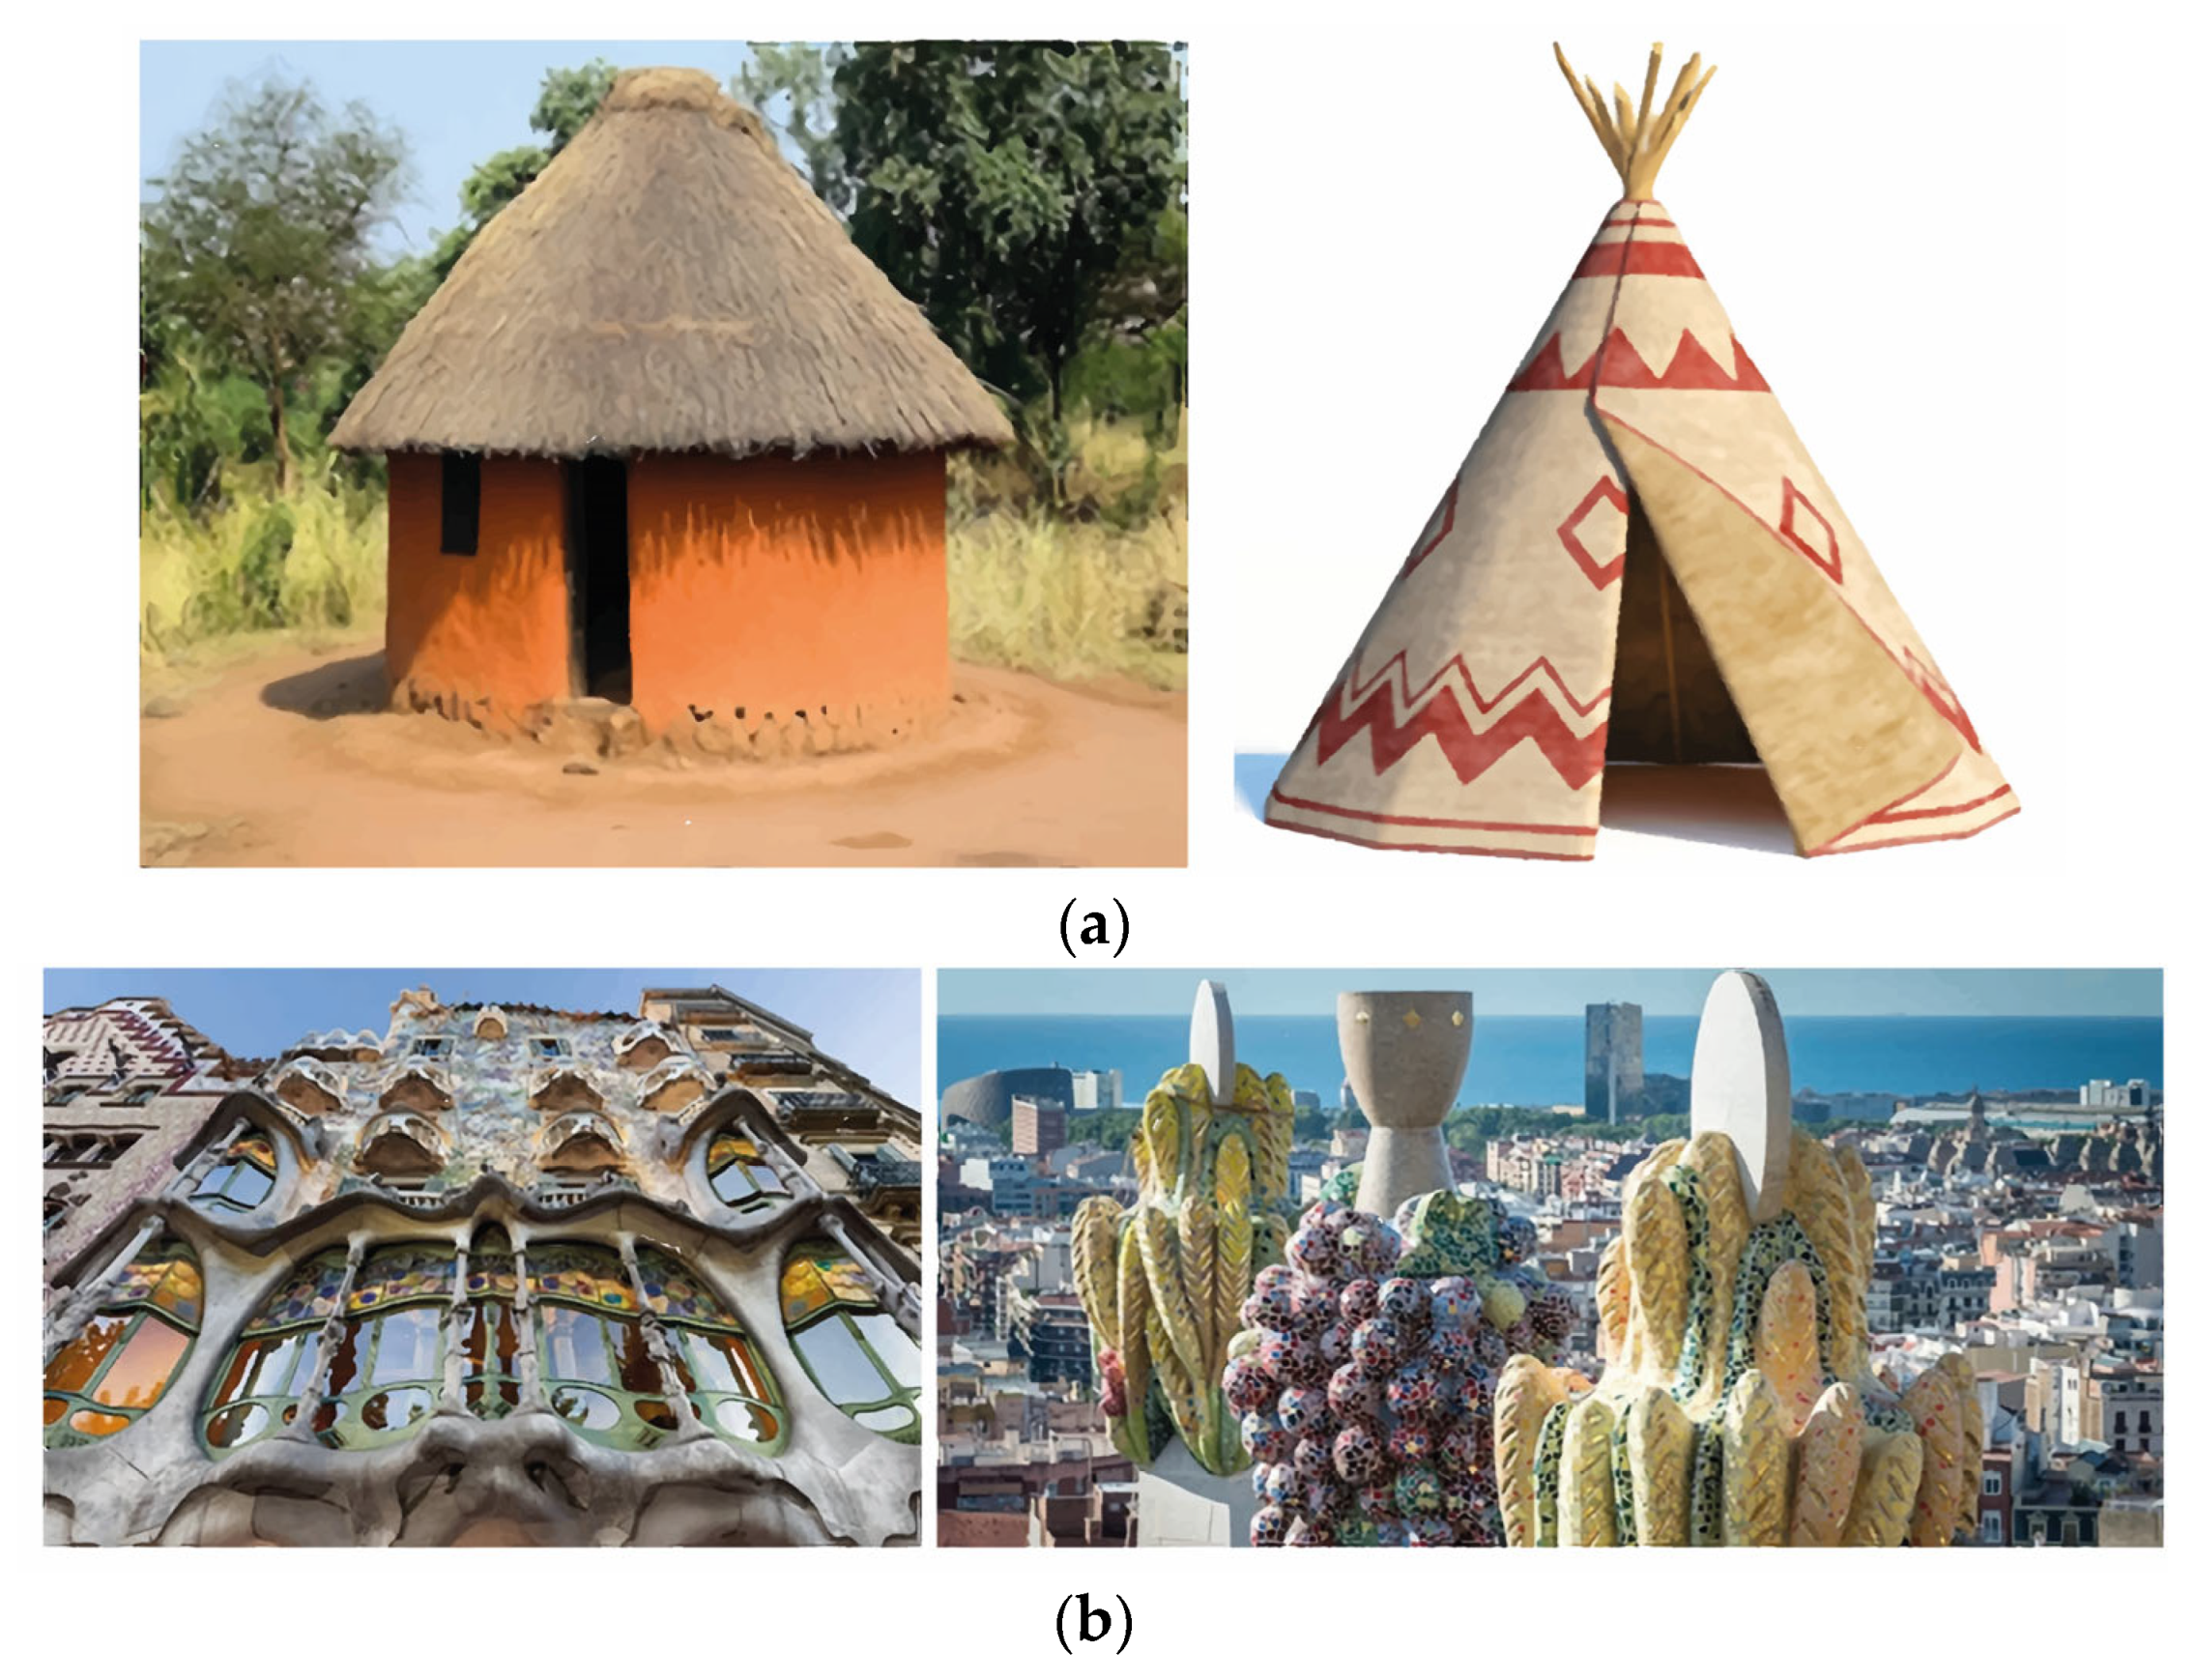
Nature, from the perspective developed in this work, is fractal, including urban meteorology time series (temperature, relative humidity, wind speed), trees, coastal edges, mountains, geographic basins, living creatures, pollutant time series, natural processes, etc. Even the ancestral dwellings of primitive peoples tended towards fractal structures, as shown in
Figure 22.
The presence of obstacles in the form of a parallelepiped, a cylinder, and a fractal mountain affects the micrometeorology [
19,
20] measured before and after a natural air flow interacted with them, producing turbulence. This turbulence can be related to the small-scale manifestation of the Kolmogorov cascade [
52,
53,
54,
55]. Close to the ground, the finer eddies disperse their energy as heat due to viscosity. Thus, in the turbulent zone, two quantities are manifested: the average energy dissipation rate, ε
D, and the kinematic viscosity, ν. The relationship between these two quantities gives the length scale
The Kolmogorov entropy calculated from the time series in this study has units
. When transforming its units [
56], it remains
, which is equivalent to Energy/(Temperature time), dimensionally:
This study of the influence of geometric volumes on the boundary layer shows that some of them favor heat flow towards the boundary layer. By estimating the average energy dissipation rate and the small-scale kinematic viscosity, a regime of variations in heat and entropy fluxes can be established [
55,
57,
58]. Other types of fluids have shown similar behavior [
58,
59,
60].
According to the results obtained, a first approximation shows that the geometric shape that dissipates the most heat into the atmosphere is the parallelepiped, a geometric shape that corresponds to more than 90% of housing, industrial plants, recreational areas, etc. that make up modern cities around the world. Three-dimensional constructions and entropy are linked through various aspects of physics, including thermodynamics, material science, and quantum mechanics. Entropy and entropy flow, a measure of disorder or randomness in a system, can be visualized and analyzed in the context of three-dimensional structures.
The fractal mountain in the experiment, whose irregular surface faces function as a radiator, allows for heat exchange between two media, one of which is ambient air. The radiator makes it possible to mitigate and dissipate heat from a system, thus preventing overheating. This system commonly operates by convection but also by radiation. The radiator can also be related to a heat exchanger that transfers or, in certain cases, receives heat to or from the ambient air.
In general, a metric space is a set associated with a distance function; that is, this function is defined on the set, fulfilling properties attributed to distance, such that, for any two points in the set, they are at a certain distance assigned by the function. The best-known example of a metric space is three-dimensional Euclidean space with its usual notion of distance. Fractal geometry is a source of some strange metric spaces, because a fractal, as noted, is a geometric object whose basic structure, fragmented or apparently irregular, is repeated at different scales.
A mountain can be considered a fractal. Fractals are geometric structures whose shape repeats at different scales, and mountains, as shown in
Figure 23, like other natural structures, such as clouds, coastlines, and rivers, exhibit this property of self-similarity.
Ricci flow [
51] is a process that deforms Riemannian metrics, similarly to heat diffusion, smoothing out the irregularities of the metric. On surfaces [
61], Ricci flow tends to convert the metric into one of constant Gaussian curvature [
62], Theorem 1.6, which is related to the uniformization theorem [
63]. Entropic surfaces, in this context, refer to surfaces that exhibit varying maximum entropy properties or disorder in their curvature distribution affected by their interaction with regular and fractal geometry.
According to [
47,
48], a surface of maximum entropy variables according to measurements in a geomorphology exhibits a non-uniform curvature distribution, with areas of high and low curvature, representing states of greater disorder or entropy. These types of surfaces were determined for the periods 2010/2013, 2017/2020, and 2029/2022 in the geomorphology of the Santiago de Chile basin [
47,
48]. These surfaces, in a thermodynamic state space, represent the entropy quantities of the polluting systems and the urban meteorology systems. In the three periods, they allow for visualizing, in a first approximation, the evolution of the entropy surface of the polluting system and its influence on the entropy surface of urban meteorology under different conditions (droughts, heat waves, heat islands, urban densification, deforestation, basin geomorphology, etc.) for an extensive period of measurement. Entropic surfaces change as systems evolve (changes of state); their roughness reveals information about the system’s tendency to increase or decrease entropy, as well as the conditions under which entropy reaches a maximum or minimum, facilitating the understanding of physical and chemical processes.
Localized time series measurements (whether of pollutants and urban meteorology) have maximum entropy and an associated metric [
36]. The entropy metric is a measure of the complexity or chaos of a dynamical system described by the time series, where a higher value indicates greater complexity (Equation (1), [
36]). Essentially, the entropy metric is a measure of the growth rate of information in a dynamical system [
36]. An entropic surface metric, in the sense given by Ruppeiner [
64,
65], is a way of measuring the distance between two points in the state space of a thermodynamic system based on the entropy geometry. In other words, it describes how the entropy of a system changes as we move from one state to another.
