Article

Pavement Crack Detection Using Fractal Dimension and Semi-Supervised Learning

1
Faculty of Geosciences and Engineering, Southwest Jiaotong University, Chengdu 611756, China
2
Guangdong Key Laboratory of Urban Informatics, Shenzhen 518060, China
3
School of Architecture and Urban Planning, Shenzhen University, Shenzhen 518060, China
*
Author to whom correspondence should be addressed.
Fractal Fract. 2024, 8(8), 468; https://doi.org/10.3390/fractalfract8080468
Submission received: 2 July 2024 / Revised: 4 August 2024 / Accepted: 7 August 2024 / Published: 12 August 2024
(This article belongs to the Special Issue Fracture Analysis of Materials Based on Fractal Nature)

Abstract

Pavement cracks are crucial indicators for assessing the structural health of asphalt roads. Existing automated crack detection models depend on large quantities of precisely annotated crack sample data. The irregular morphology of cracks makes manual annotation time-consuming and costly, thereby posing challenges to the practical application of these models. This study proposes a pavement crack image detection method integrating fractal dimension analysis and semi-supervised learning. It identifies the self-similarity characteristics within the crack regions by analyzing pavement crack images and using fractal dimensions to preliminarily determine the candidate crack regions. The Crack Similarity Learning Network (CrackSL-Net) is then employed to learn the semantic similarity of crack image regions. Semi-supervised learning facilitates automatic crack detection by combining a small amount of labeled data with a large volume of unlabeled image data. Comparative experiments are conducted on two public pavement crack datasets against the HED, U-Net, and RCF models to comprehensively evaluate the performance of the proposed method. The results indicate that, with a 50% annotation ratio, the proposed method achieves high-precision crack detection, with an intersection over union (IoU) exceeding 0.84, which is close to that of U-Net. Visual analysis of the detection results confirms the method’s effectiveness in identifying cracks in complex environments.

1. Introduction

Pavement cracks significantly reduce the lifespan of road structures and pose serious safety hazards [1]. Research on automated pavement crack detection technology is crucial for enhancing maintenance efficiency and ensuring road health and traffic safety [2]. Traditional manual detection methods cannot meet the increasing demands for maintenance [3]. Due to the advancement of Artificial Intelligence (AI) technology, scholars have developed numerous automated pavement crack detection models using digital images [4]. Deep learning models are increasingly being applied for automated crack detection in pavement defect identification [5]. These include U-Net [6], RCF [7], SegNet [8], hierarchical convolution [9], active learning [10], and the large image segmentation model Segment Anything Model (SAM) [11], all of which have proven effective for crack detection tasks [12,13]. Deep learning techniques for crack detection can be divided into object detection and semantic segmentation [14].
Object detection techniques provide object location information by producing bounding boxes that cover the object. They provide an approximate location and extent of objects within an image. Choi et al. [14] proposed SDDNet for real-time pavement crack detection. Kang et al. [15] integrated attention mechanisms into crack detection, reducing the issue of missed pavement cracks. Liu et al. [16] proposed using YOLO for real-time crack detection. However, object detection can only provide rough location information and cannot accurately segment the shape and contours of the object. The accuracy of object detection methods can be impacted by cracks in complex backgrounds [1].
Semantic segmentation techniques provide more detailed and precise object detection information, accurately depicting the shape and size of the object. Over time, the focus of crack detection research has gradually shifted to semantic segmentation methods. Although these methods improve object detection accuracy, they require handling more complex models and larger datasets, increasing computational costs [17]. Yang et al. [18] proposed a crack detection method that uses a pyramid model combined with a hierarchical network. Ye et al. [19] introduced an end-to-end crack recognition network called Ci-Net, based on Fully Convolutional Networks (FCN) [20]. Despite Ci-Net maintaining the same architecture as FCN, it introduces improvements in the convolution and deconvolution layers, achieving high-precision crack detection. Based on Ci-Net, Fei et al. [21] suggested more complex feature extraction and multi-scale analysis techniques, proposing the CrackNet-V model, which maintains good crack detection accuracy in complex environments. However, FCN-based methods can lose some detailed information during the downsampling and upsampling processes, affecting boundary detection accuracy [20]. Bang et al. [22] proposed using SegNet for pavement crack detection, retaining the encoder part of VGG16 but modifying the decoder part to achieve better edge detection results. Zou et al. [9] developed a pavement crack segmentation network called DeepCrack based on the SegNet architecture, which pairs convolution features produced in the encoder with features generated at the same scale in the decoder. This method avoids the need to learn the upsampling process, but the quality of pooling indices limits its accuracy. Nayyeri et al. [23] proposed a crack detection method that separates background and foreground based on visual saliency, but it tends to miss tiny cracks. Zhu et al. [24] discovered that surface cracks in materials possess fractal characteristics, and their distribution can be effectively characterized using the concept of fractal dimension. Yin et al. [25] introduced a detection methodology that employs fractal dimensions to quantify the progression of cracks and the evolution of damage under uniaxial tensile conditions. An et al. [26] combined fractal dimension analysis with the UHK-Net neural network to detect and segment concrete cracks and address the challenge of accurately segmenting small concrete cracks. Cheng et al. [27] combined fast Fourier transform with convolutional neural networks (CNN) to enhance crack detection accuracy in low-light environments. These advancements underscore the efficacy of integrating traditional mathematical techniques with modern deep learning models to surmount the inherent complexities in crack detection and segmentation.
Despite many significant achievements in pavement crack detection, mainstream end-to-end automatic crack detection technologies [28] depend on large-scale annotated data to effectively capture crack features. It is relatively simple to obtain sample data in environments where there are clear differences between cracks and asphalt pavements, resulting in good detection outcomes. However, difficulties in determining the boundaries of atypical cracks arise in complex scenarios, such as low-contrast environments, shadow occlusion, and cracks being obstructed by foreign objects [29]. The irregularity of crack edges presents challenges even for experienced experts, making it difficult to quickly and accurately annotate crack boundaries [30]. The annotation process is time-consuming and labor-intensive [31], complicating the provision of sufficient data for automatic crack detection in complex environments.
With the success of the InvaSpread model [32], object detection based on self-supervised learning has garnered significant attention. Self-supervised learning leverages object self-similarity comparisons to learn feature representations [33], demonstrating superior performance to ImageNet-supervised networks in various computer vision tasks [34]. As self-supervised learning techniques continue to mature, they offer promising solutions for overcoming the limitations of traditional supervised learning methods, particularly when labeled data are scarce or difficult to obtain. To address the limitation of requiring large amounts of annotated data, several self-supervised learning methods [35] have been developed. However, cracks possess a fractal property, displaying similar complexity and irregularity at different scales, which complicates their identification and segmentation. This fractal nature poses a significant challenge to current self-supervised learning algorithms [36]. Consequently, employing semi-supervised learning (SSL) for crack detection has emerged as a more promising approach [31].
This study proposes a crack detection method based on fractal dimension and semi-supervised learning. Initially, the fractal dimension within crack regions is crucial in selecting candidate crack region images. Consequently, this research introduces the Crack Similarity Learning Network (CrackSL-Net), which combines a small amount of annotated data with candidate region image data to achieve automatic crack detection. This approach reduces the dependence on experts for crack annotation by enabling effective detection with limited annotated data. The main research contributions of this study are outlined as follows:
  • Self-similarity characteristics within crack regions are identified by analyzing pavement crack images, leading to the development of a method for extracting candidate crack regions in pavement images using fractal dimensions.
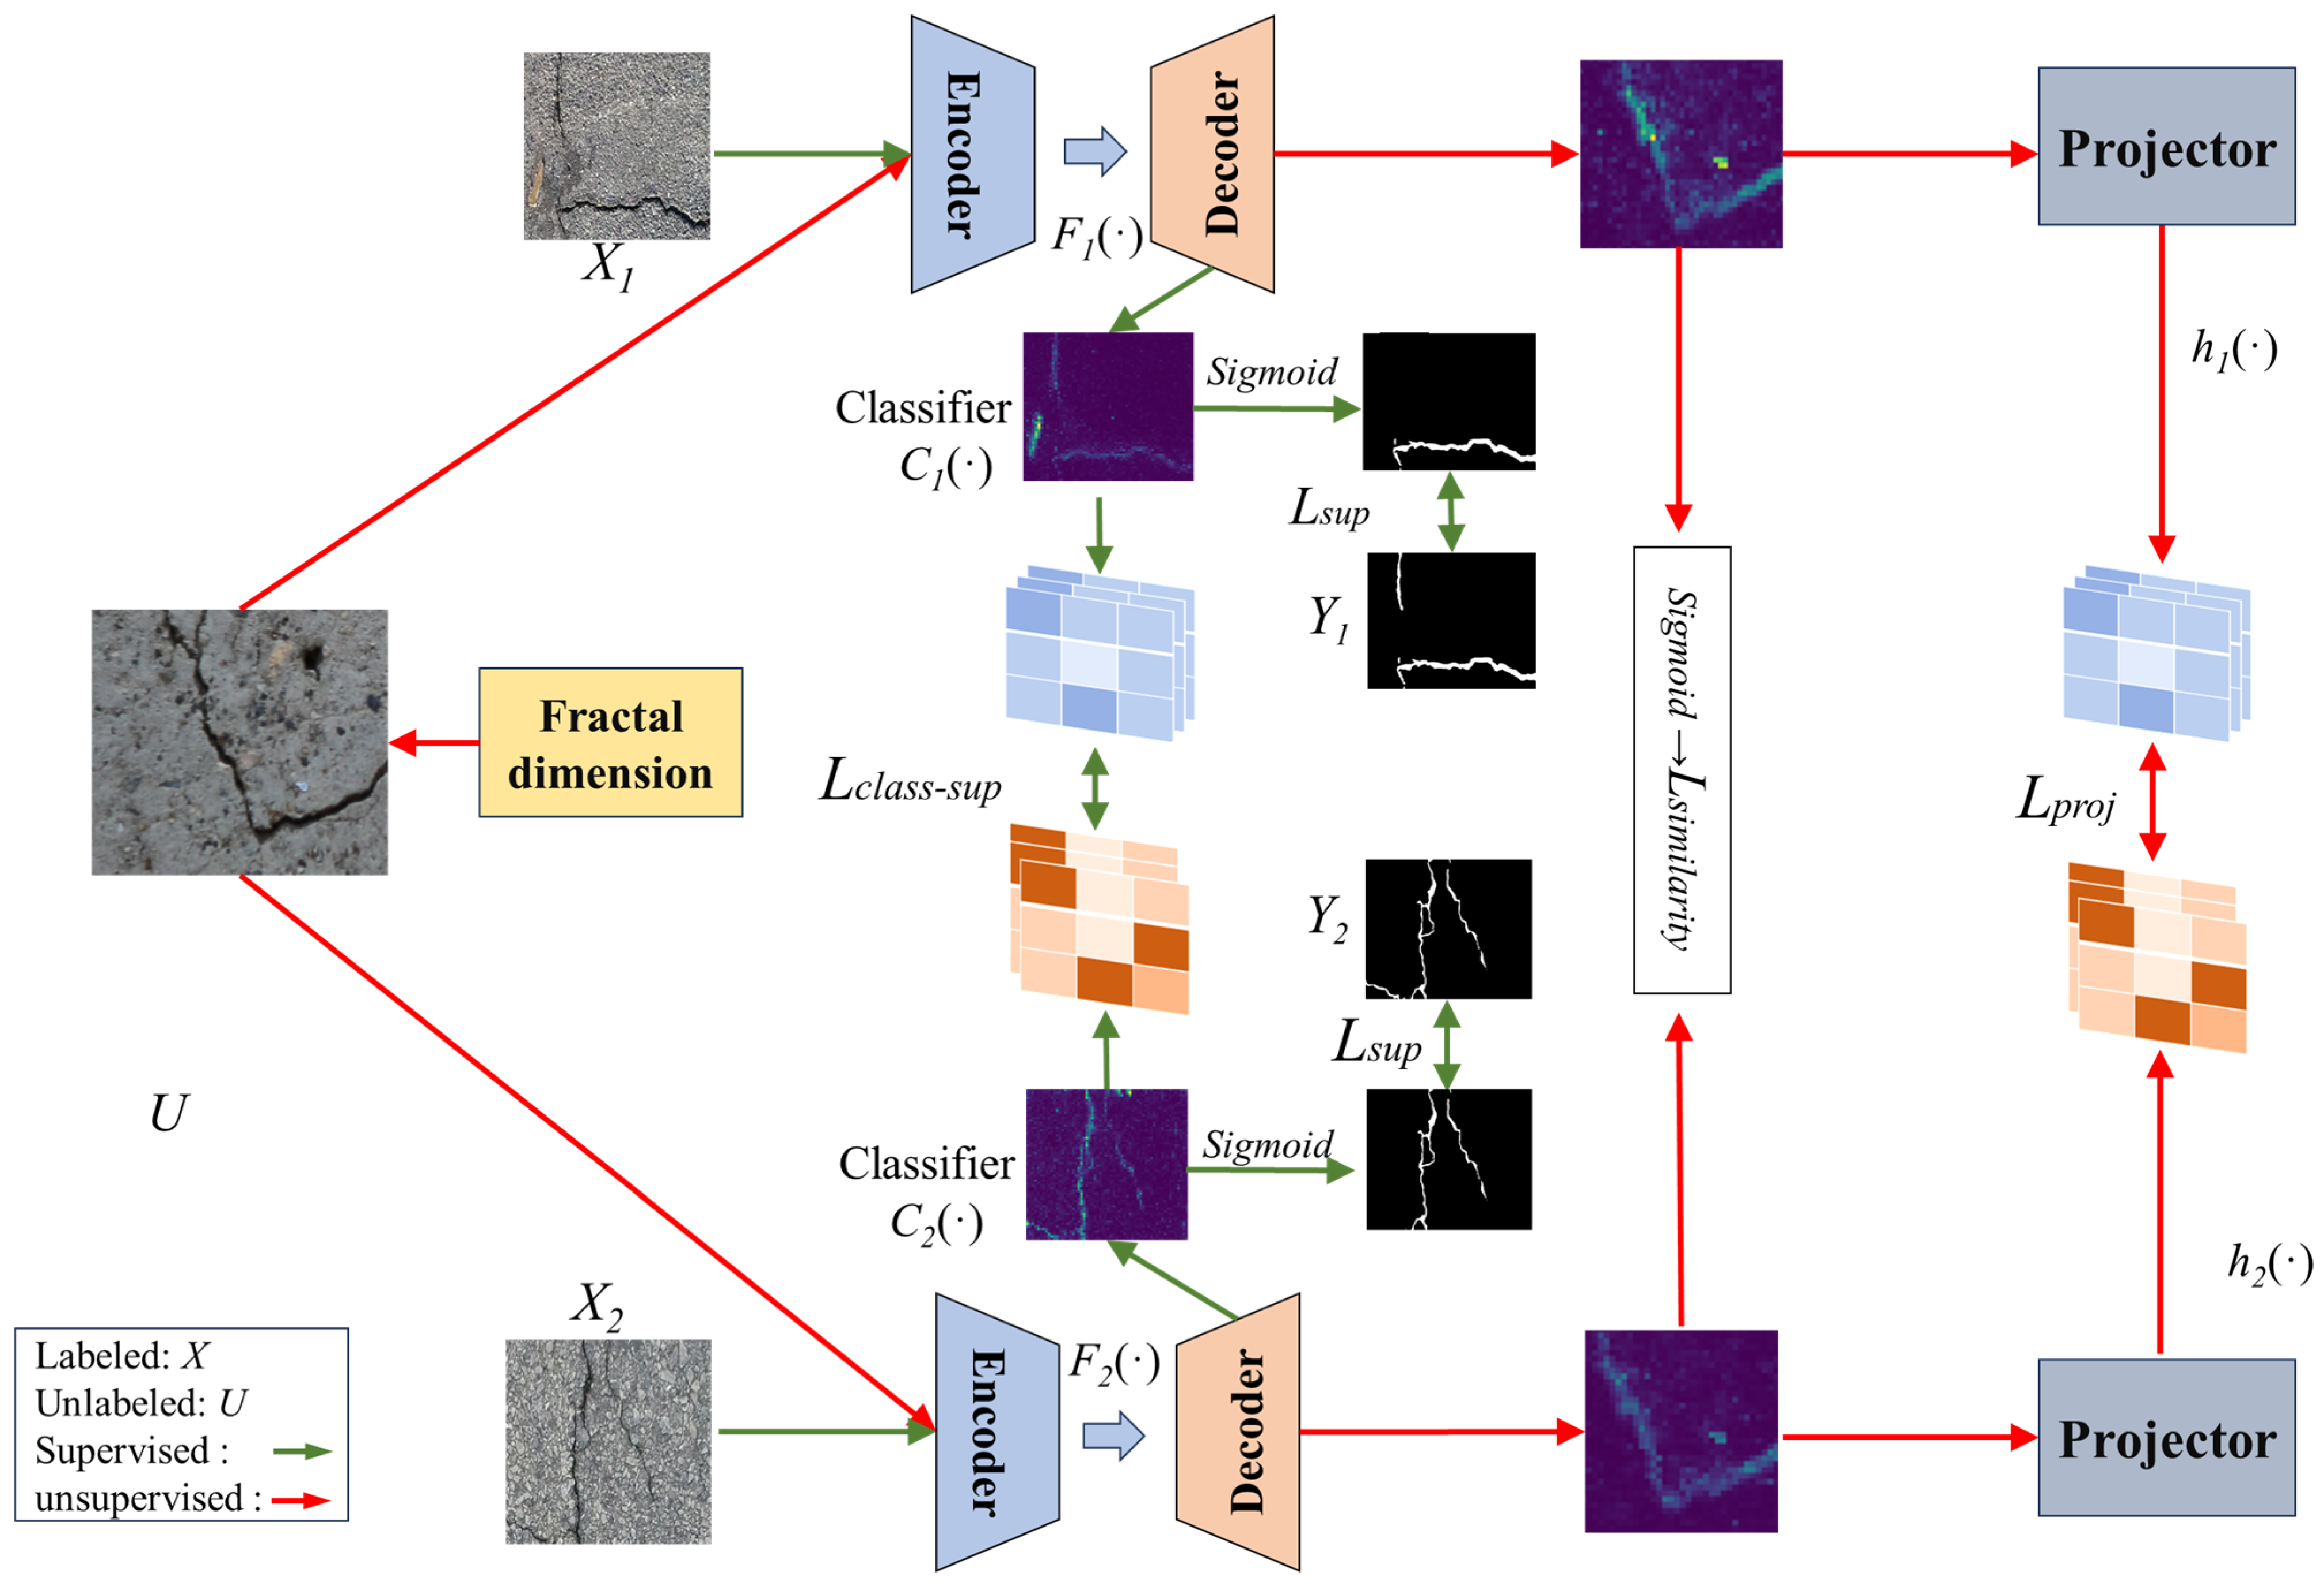
  • A semi-supervised learning-based automatic crack detection model, CrackSL-Net, is developed, which effectively achieves automatic crack detection in pavement images by employing a semantic similarity learning strategy and contrastive learning methods.
  • Evaluation tests are performed on the GAPs384 and Crack500 datasets, and performance comparison experiments are conducted with various mainstream detection methods to assess the performance of the proposed method.

2. Methods

2.1. Crack Candidate Region Extraction

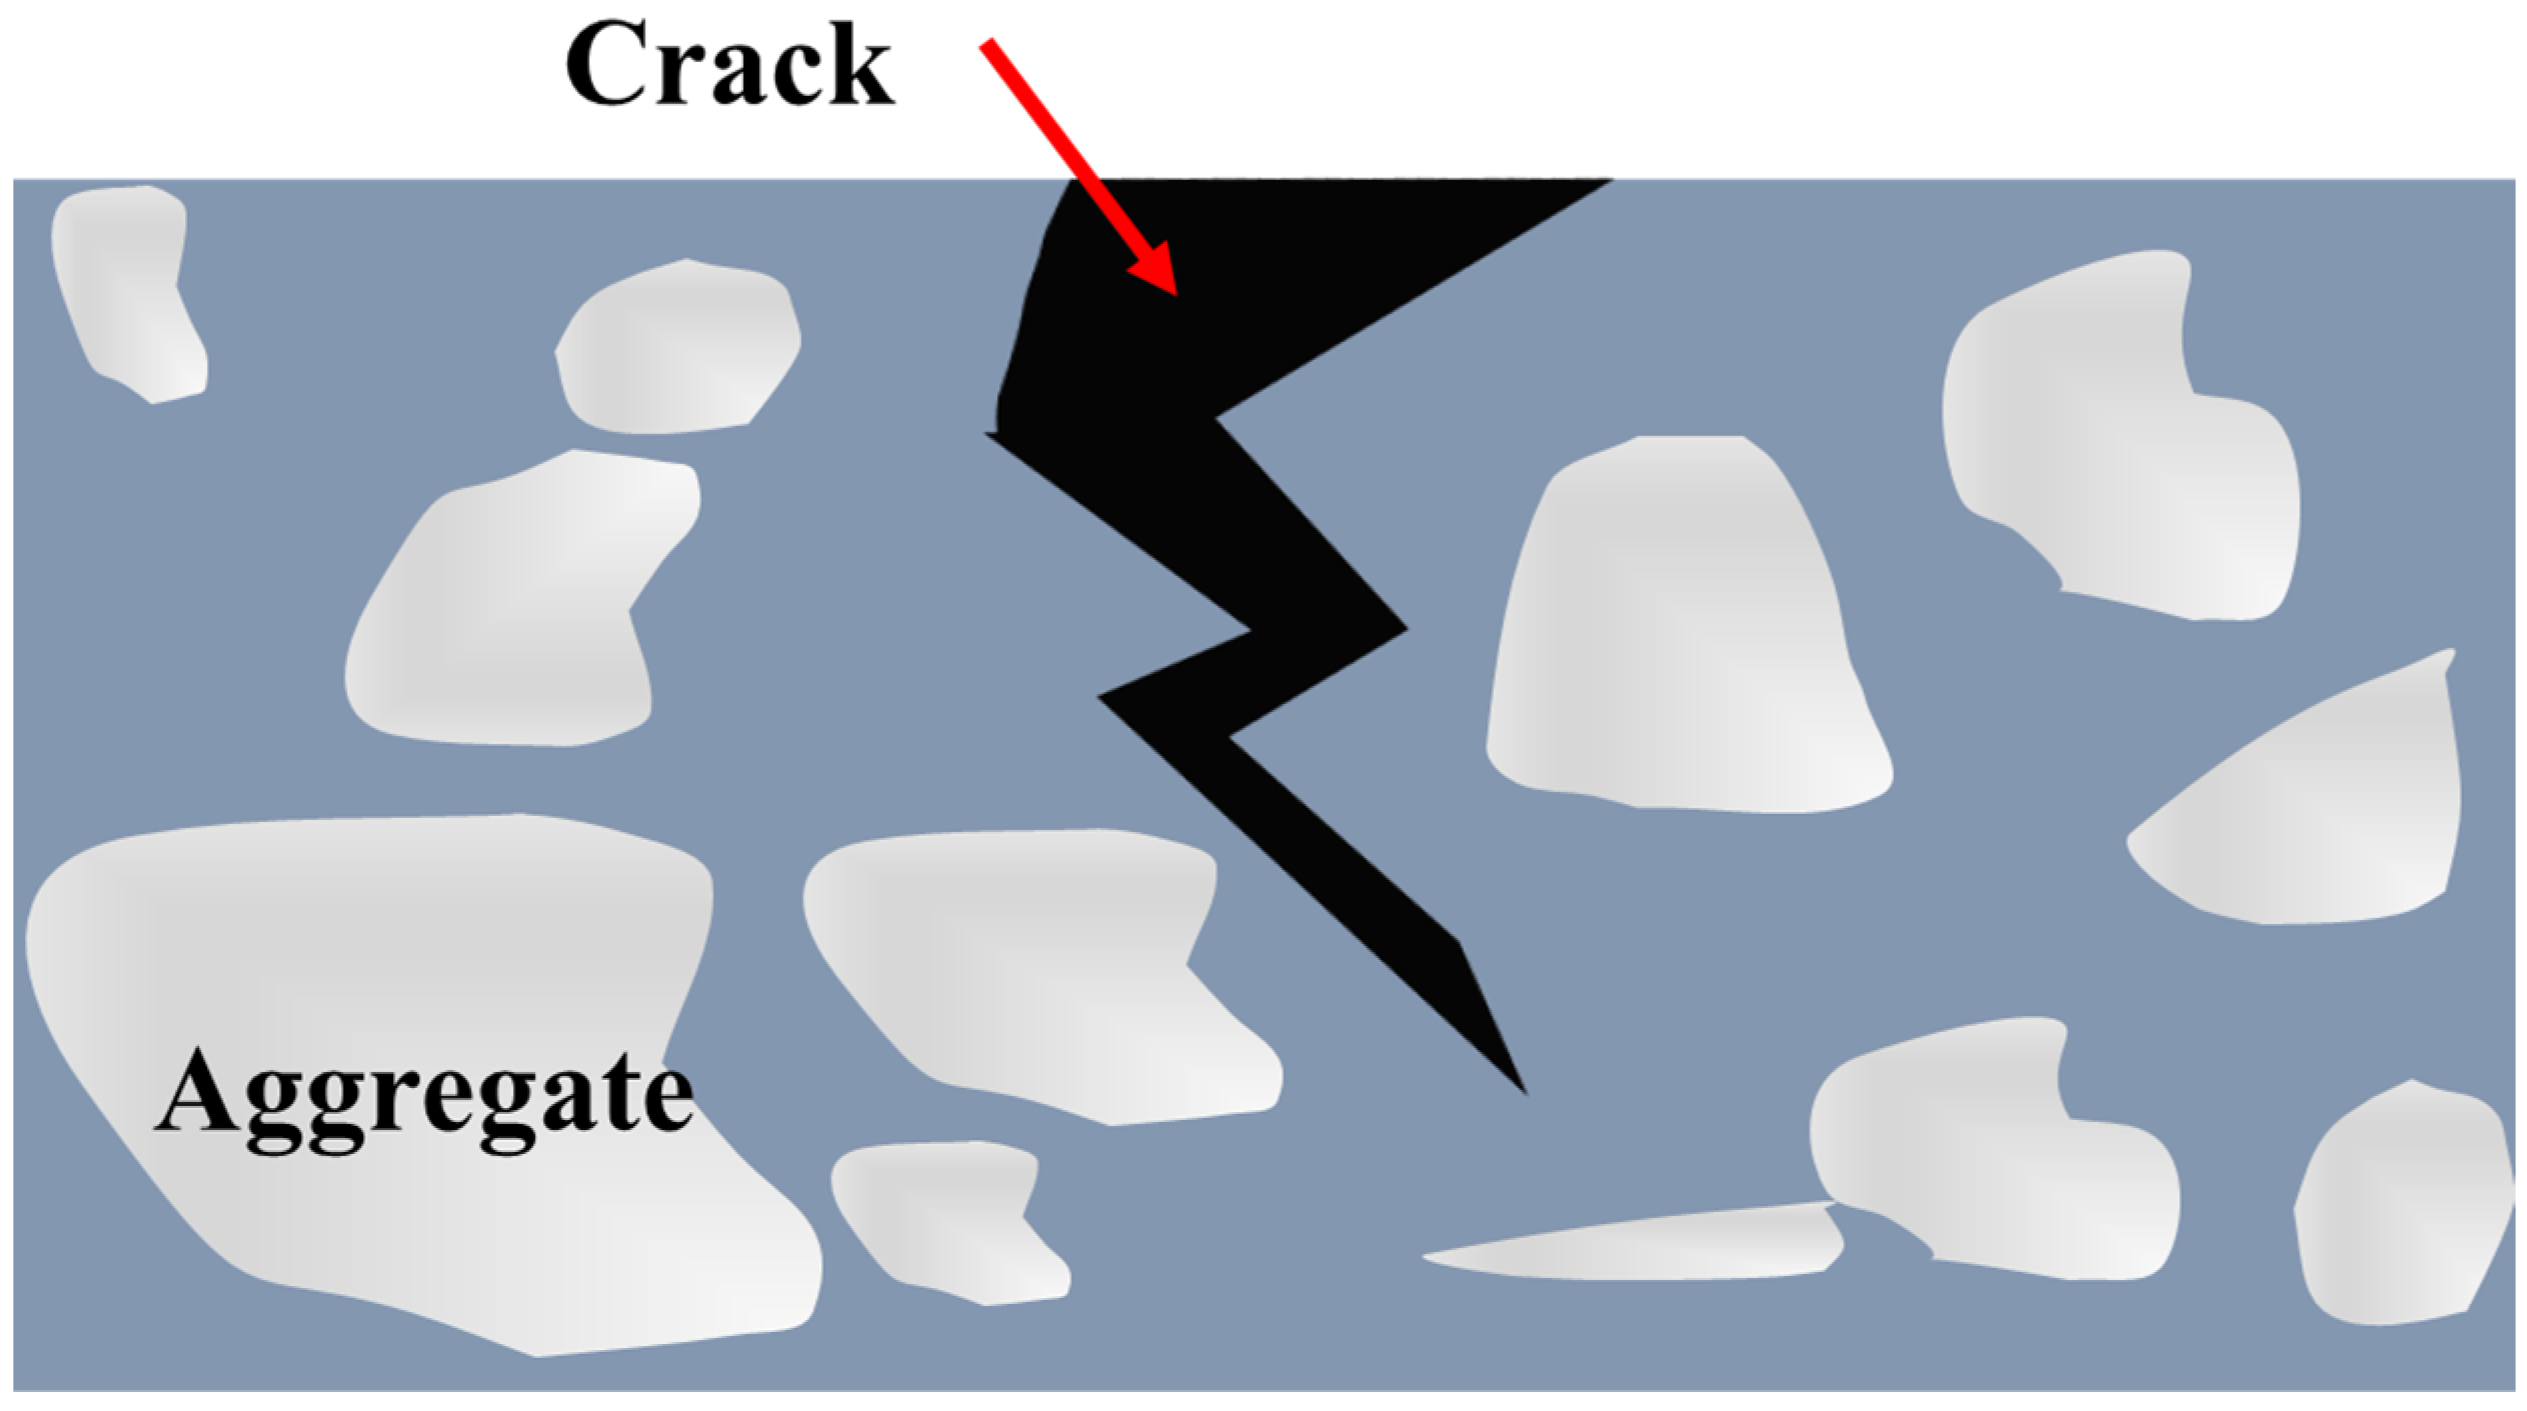
2.1.1. Fractal Nature of Crack

Cracks in pavement typically form due to factors like traffic loads, temperature fluctuations, or material aging. The formation of cracks occurs when the stress on the pavement material exceeds its bearing capacity, leading to natural gaps in the pavement [37]. Figure 1 indicates that, theoretically, crack surfaces are not filled with any material, and any region within the crack is similar to the entirety.
The fractal dimension can quantify this self-similarity, thereby providing a unified perspective to understand the multi-scale characteristics of cracks. Figure 2 illustrates that if we assume the fractal dimension of the crack is D, the relationship between the crack length L and the unit scale ϵ can be mathematically described as follows [26]:
L = N ε × ϵ D
where ϵ is the unit scale; N ε represents the number of measurement units needed to cover the crack at that scale.

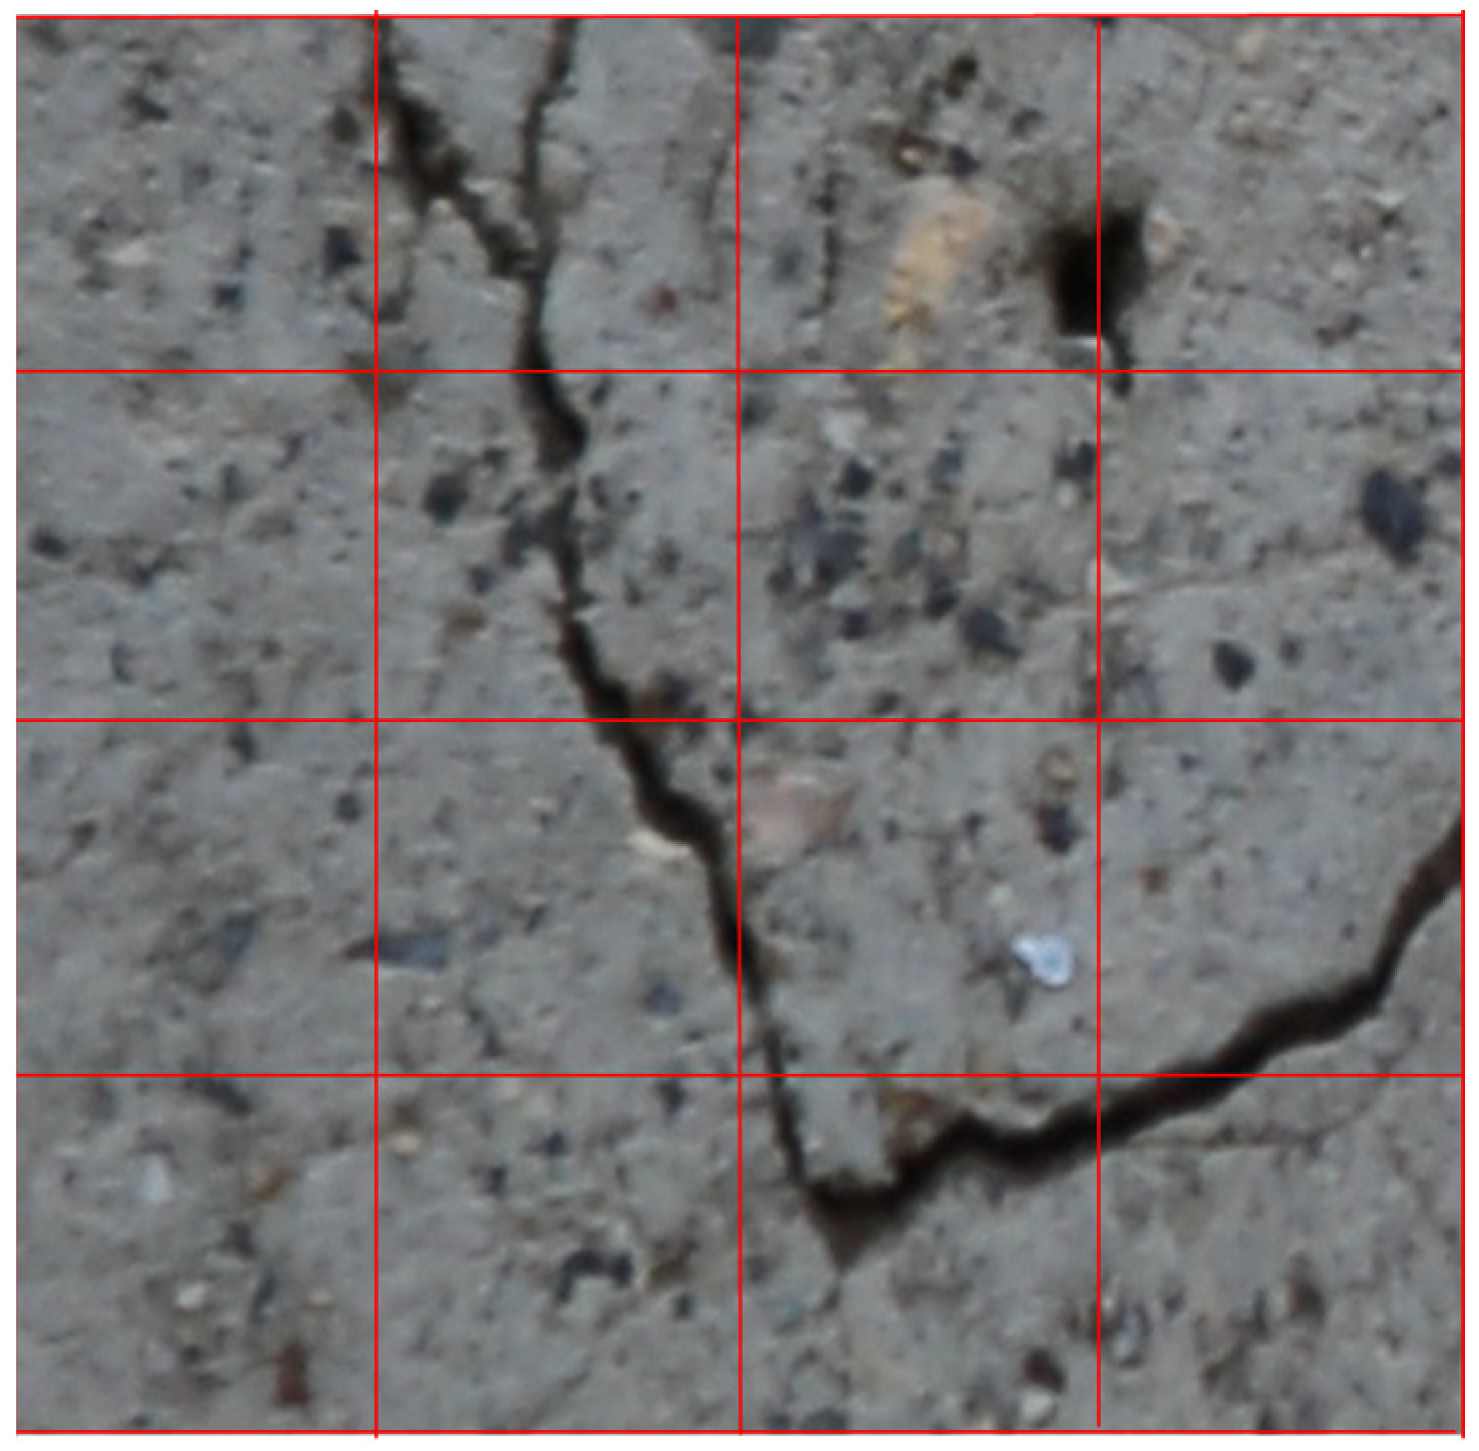
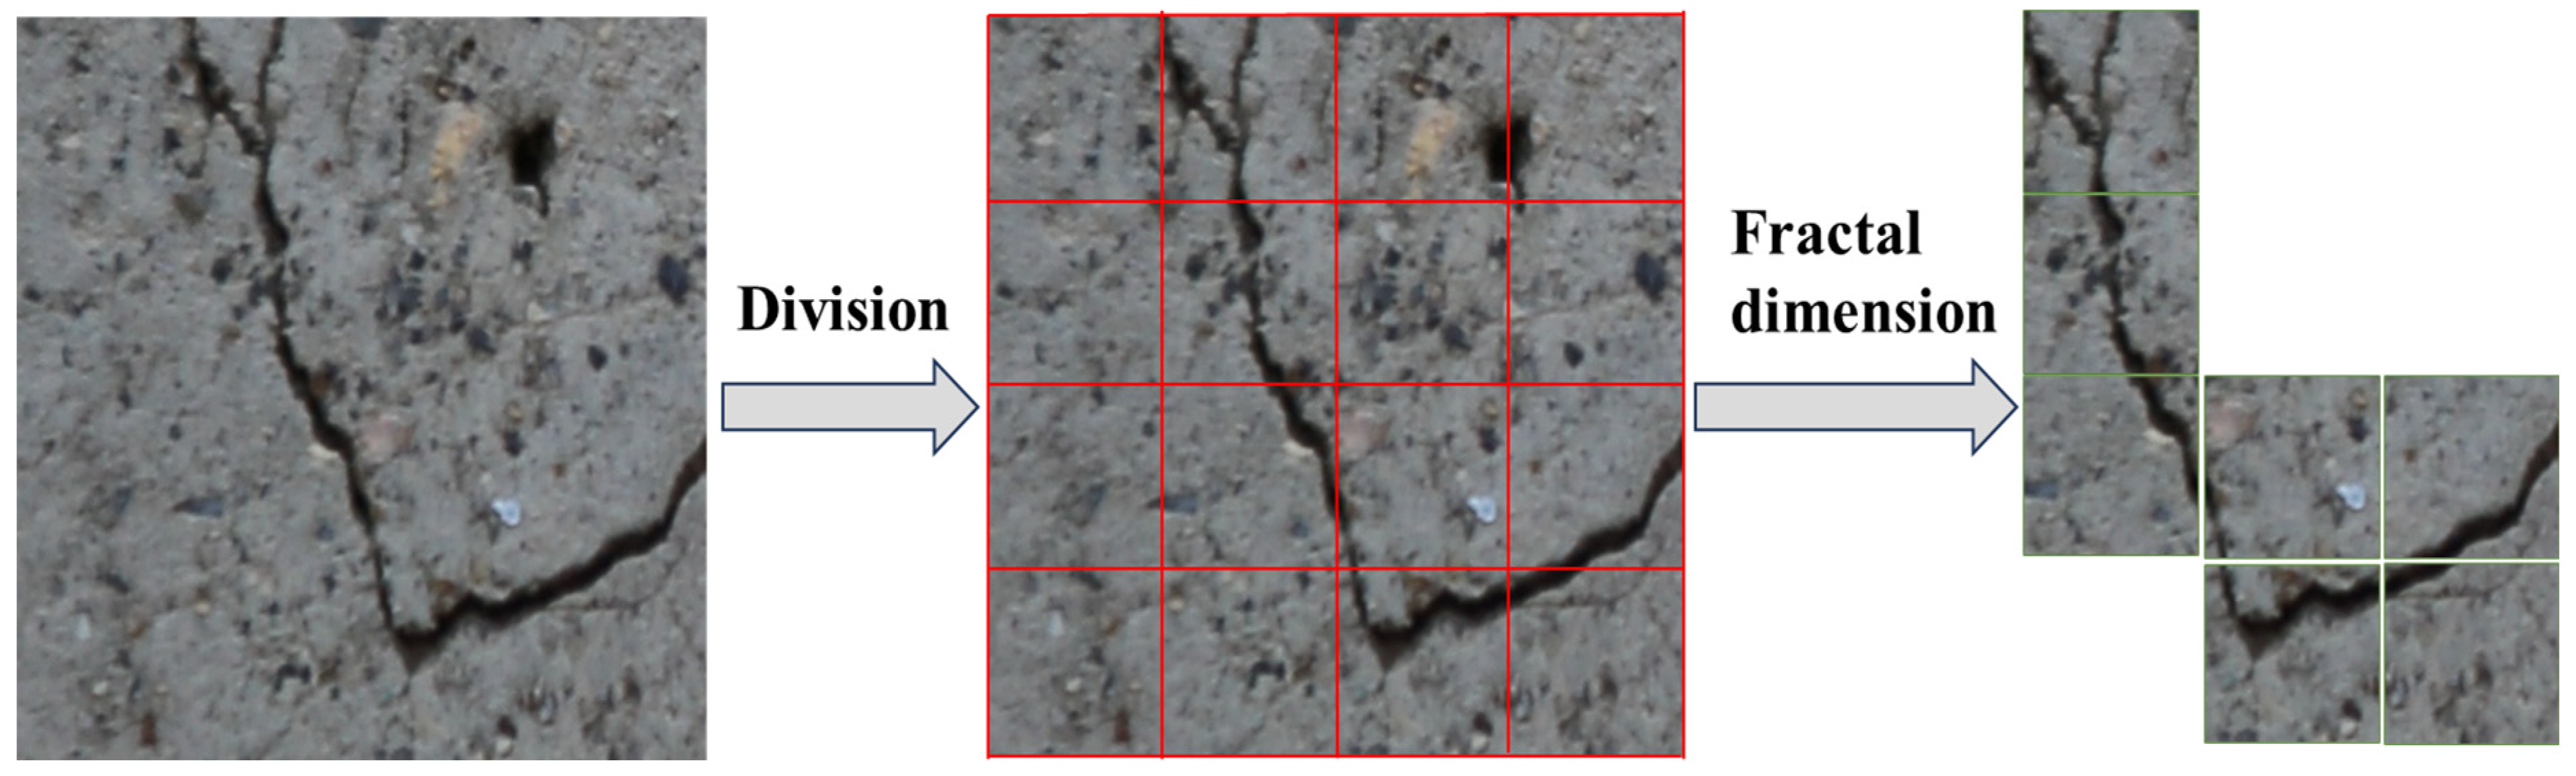
2.1.2. Crack Candidate Region Extraction Using Fractal Dimension

Cracks are common phenomena in engineering structures, exhibiting complex morphologies and significant self-similarity. The fractal dimension, a quantitative measure of this self-similarity, indicates greater complexity and irregularity of the cracks with higher values. Furthermore, the spatial distribution of cracks adheres to specific statistical patterns that the fractal dimension helps to reveal. This study employs fractal dimensions to identify potential crack regions in pavement images. When there are insufficient crack annotation data, this method can rapidly pinpoint the suspect regions, consequently reducing computational demands.
The crack candidate region acquisition method is shown in Algorithm 1. Initially, the image is segmented into multiple equal-sized blocks according to the dimensions of the image. This segmentation helps in locally analyzing complex images and structural features, thus improving the accuracy of crack detection. The size of the blocks is adjustable to ensure that each block adequately captures the local features, as illustrated in Figure 3.
Algorithm 1: Fractal Dimension-Based Crack Candidate Region Extraction
Input:  I : Pavement image, b: Block size, T D : Fractal dimension threshold
Output: R: Crack candidate regions
1:
Divide  I  into non-overlapping blocks of size b × b
2:
Let B represent the set of all blocks
3:
For each block B i B :
4:
Initialize the set of grid sizes ε
5:
For each grid size ε:
6:
Overlay the grid on the block
7:
Count the number of grid cells N(ε) that contain portions of the crack
8:
End for
9:
Plot log N(ε) against log ε
10:
Fit a straight line to the plot and calculate the slope D i
11:
Store the fractal dimension D i for each block
12:
End for
13:
Initialize an empty list R
14:
For each block B i :
15:
if  D i T D :
16:
Add the block B i to the R
17:
End if
18:
End for
19:
Return R
Secondly, the fractal dimension is the primary method for initially detecting each section. The likelihood of each image block containing cracks is assessed based on the calculated fractal dimension. The box-counting method is employed to compute the fractal dimension [38]. This process involves calculating the number of grid cells N ε that include portions of the crack (Equation (2)), adjusting the grid cell size ε , and obtaining the number of grid cells for various grid sizes. In a logarithmic coordinate system, the relationship between log N ε and log ε is a straight line with a slope of D. The fractal dimension D is then calculated (Equation (3)), and a threshold for the fractal dimension is established. Image blocks with a fractal dimension that meets or exceeds this threshold are deemed likely to contain cracks, and conversely, image blocks below this threshold are considered unlikely to contain cracks.
N ε = C ϵ D
log N ε = D log ε + log C
where C is a proportionality constant related to the image block and the scale of the boxes.
Finally, the preliminarily detected crack candidate regions are identified and saved for further analysis. These regions lay the foundation for more detailed detection and subsequent crack analysis, which is essential for crack analysis when annotation data are limited.

2.2. Crack Detection Model

This study introduces the Crack Similarity Learning Network (CrackSL-Net), a semi-supervised learning technique powered by contrastive learning [39]. CrackSL-Net captures the similarity between internal regions of crack images as auxiliary information, utilizing contrastive learning to improve the model’s capability to differentiate between crack and non-crack areas. This method divides the labeled dataset into two non-overlapping subsets, X 1 X 2 = , and validates the strategy using a full negative sample pair [31]. This segmentation enables the network, trained on these subsets, to predict the representations of unlabeled images more accurately.

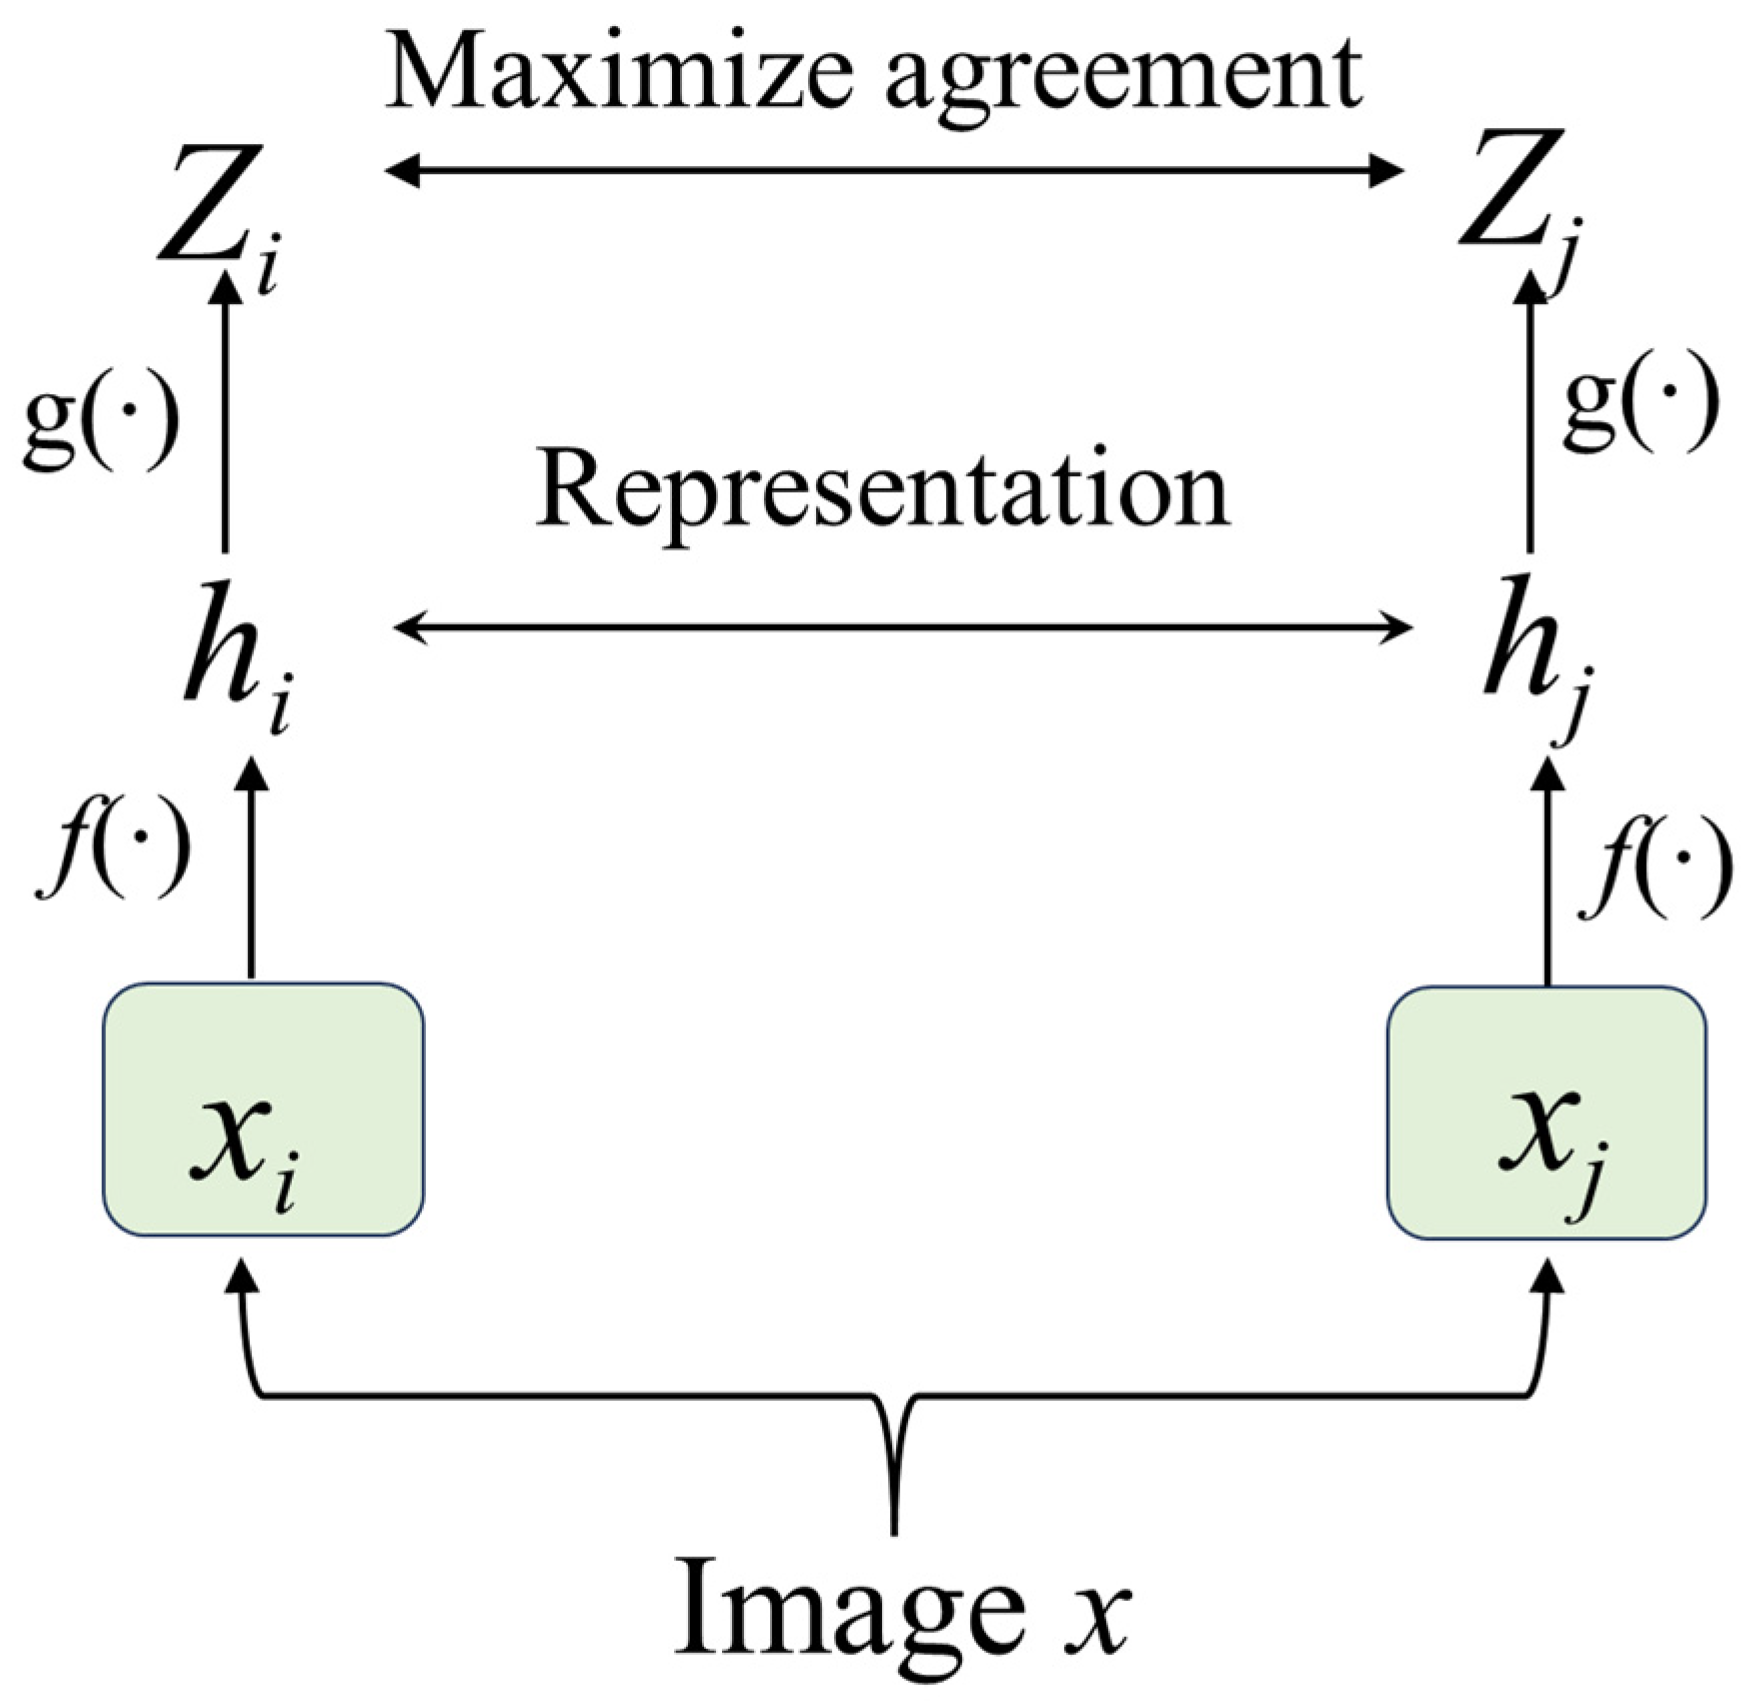
2.2.1. Contrastive Learning Model

Contrastive learning is a representative self-supervised learning method focusing on acquiring effective representations by comparing the similarities and differences among data points [40]. This technique typically involves constructing pairs of positive and negative samples; positive samples correspond to similar or related data points, while negative samples correspond to dissimilar or unrelated data points. This method often necessitates extensive data augmentation operations. To bolster the network’s capacity to learn general representation features, data augmentation strategies such as rotation, flipping, affine transformations, random grayscale noise, Gaussian blur, and color jittering are widely utilized [41]. The primary objective is to draw the representations of positive sample pairs closer together while pushing those of negative sample pairs further apart.
Figure 4 indicates that using SimCLR as an example, contrastive learning acquires discriminative feature representations by maximizing the similarity between two different augmented versions of the same image while minimizing the similarity between augmented versions of various images [42]. The contrastive loss function L i , j is defined as follows:
L i , j = l o g e x p c o s z i , z j / τ k = 1 2 N 1 k i e x p c o s z i , z k / τ
where z i and z j are the representation vectors of two different augmented versions of the same image obtained after processing through the encoder and projection head; c o s ( z i , z j ) is the cosine similarity between them; τ is a chosen temperature constant that controls the scale of the similarity scores; N is the batch size; 2N is the total number of positive and negative sample pairs. The indicator function 1 k i equals 1 when k i , and 0 otherwise, ensuring that the similarity of the positive sample pair to itself is not included in the denominator.

2.2.2. Structure of the Crack Detection Model

Figure 5 demonstrates that within the CrackSL-Net architecture, labeled and unlabeled crack data are initially input into two encoder–decoder structured segmentation networks. The networks’ predicted labels are then contrastively analyzed using a classifier and a projector; the classifier processes labeled data, while the projector handles unlabeled data. The labeled dataset is defined as X = X i , Y i i = 1 m , where each pair X i , Y i consists of an image X i R C × H × W and its manually labeled data Y i 0,1 H × W . Unlabeled images are defined as U = U i i = 1 n , where U i R C × H × W . In this study, the number of unlabeled crack images n is significantly greater than the number of labeled images m. The labeled crack set is evenly divided into two subsets, X i i = 1 m = X 1 X 2 and X 1 X 2 = , to ensure that the two segmentation networks learn to crack features from diverse perspectives. Segmentation networks, classifiers, and projectors, defined as {F1, F2}, {C1, C2}, and {h1, h2}, respectively, are key components in machine learning and computer vision, clarifying their roles and interactions in complex systems.
Under the CrackSL-Net framework, both labeled and unlabeled crack data are utilized in parallel. During training, each unlabeled image U i is simultaneously processed by two segmentation networks and a projector. The feature representations extracted from the predicted segmentation of the unlabeled images by the projector are used to construct spatial positive and negative sample pairs. This approach achieves pixel-level consistency analysis of the feature representations. The goal is to minimize the differences in feature representations at the same spatial location across the two segmentation networks and the projector while maximizing the differences at different spatial locations. This strategy provides a self-supervised learning loss for the unlabeled data.
For the labeled crack data, the two subsets X 1 and X 2 are processed through distinct network and classifier paths, where images in X 1 do not appear in X 2 , and vice versa. The inputs X 1 and X 2 are not required to originate from the same type of pavement crack data because the cracks themselves are fractal in nature. Network 1 processes the first half of the images, while Network 2 processes the second half to ensure significant temporal differences between the two datasets. The classifier’s role is to construct negative sample pairs, encouraging the network to learn from varying perspectives of the labeled data, thereby maximizing the distinctiveness of classifier features across different labeled images. This separation strategy effectively enhances the accurate detection of the overall crack integrity. The segmentation networks employ a unified encoder–decoder structure, utilizing a Res2Net pre-trained on ImageNet as the encoder [43]. The decoder processes the data through four stages, each comprising a convolutional block and an upsampling layer, ultimately producing a predicted segmentation mask with the same resolution as the original image.

2.2.3. Loss Function

The predicted results for the annotated data are compared to their ground truth labels using a supervised loss function. The supervised loss function L s u p is defined as follows:
  L s u p = L I o U w + L B C E w
where L I o U w and L B C E w are the weighted IoU loss and weighted Binary Cross Entropy (BCE) loss, respectively.
The class prediction findings obtained through the segmentation network are employed to define a loss function L c l a s s s u p , which measures the similarity between two feature representations. The loss function L c l a s s s u p is defined as follows:
L c l a s s s u p = l o g e x p q c · k c + / τ i = 0 K e x p q c · k i c / τ
where q and k are the feature maps of network classification; q c   · k c + is the positive sample pairs; q c   · k i c is the negative sample pairs; τ is the chosen temperature constant, it is set to 0.07.
When processing unlabeled data, the data are first input into the segmentation network using heavy augmentation techniques. The similarity loss is then employed to evaluate the similarity between the two unlabeled predictions. The similarity loss L s i m i l a r i t y is defined as follows:
  L s i m i l a r i t y = L s u p = L I o U w + L B C E w
where L s u p is the supervised loss function; L I o U w is the weighted IoU loss; L B C E w is the weighted BCE loss.
For the unlabeled data, high-level feature maps produced by the projector function h ( · ) are utilized for similarity measurement through a pixel-level contrastive loss. Elements that occupy the same spatial location constitute positive sample pairs, whereas those at different locations form negative sample pairs. The pixel-level contrastive loss L p r o j is determined using the following formula:
  L p r o j = l o g e x p q p · k p + / τ i = 0 K e x p q p · k i p / τ
where q and k are the feature maps of the two projector functions, q denotes the feature to be queried, and k denotes the feature being queried; q p   · k p + represents the positive sample pairs; q p   · k i p is the negative sample pairs; τ is the chosen temperature constant, it is set to 0.07.
The total loss function consists of two sets of loss terms for labeled and unlabeled data. The two segmentation networks are jointly updated using the four loss functions. The overall loss function L is defined as follows:
  L = α L s u p + β L c l a s s s u p + γ L s i m i l a r i t y + δ L p r o j
where α, β, γ, and δ are constants.

3. Implementation

3.1. Pavement Crack Data

Experiments were conducted utilizing two public datasets, GAPs384 and Crack500, which provided a detailed training and evaluation process to evaluate the model’s performance. These datasets encompass the diversity of pavement environments, enabling effective testing of the model’s generalization ability and accuracy.
GAPs384, a German asphalt pavement defect dataset created by Eisenbach [44], includes 1969 high-resolution (1920 × 1080 pixels) grayscale images. These images document not only cracks but also various pavement defects, such as potholes, patches, and different components like road markings. The dataset depicts the diversity of pavement environments, including various defect types and road components. This diversity provides rich material for testing the model’s generalization ability and accuracy. For the experiments, 509 images that contained cracks were selected for training and testing.
Crack500, a dataset of pavement cracks captured on a university campus by Yang et al. [18] from Temple University using a smartphone, contains 500 images with sizes around 2000 × 1500 pixels. These images cover cracks under various environmental and lighting conditions. Data augmentation techniques, including rotation, cropping, scaling, and color adjustment, were applied to enhance the dataset’s richness and adaptability [45]. The original images were cropped and resized to 256 × 256 pixels through these techniques, resulting in 1896 images.

3.2. Experimental Environment

The experimental model was developed in Python, with the network model constructed using Pytorch version 1.9 on the Ubuntu 18.04 operating system. All experiments were conducted on a Tesla A100 GPU with 40 GB of memory, manufactured by NVIDIA in California, United States.
To ensure consistency in testing experimental conditions, all experiments were trained using uniform hyperparameters. Specifically, the experimental setup included setting the batch size to 8 and the initial learning rate to 0.001. All input images were resized to 256 × 256 pixels before training to optimize GPU computation. Various data augmentation techniques, such as random rotation, horizontal flipping, and color jittering, were employed to increase sample diversity, prevent overfitting, and enhance model generalization.

3.3. Evaluation Indicators

To assess the accuracy of different crack detection algorithms, key metrics such as the Dice Sørensen Coefficient (DSC), Intersection over Union (IoU), and Mean Absolute Error (MAE) were used to evaluate the detection results [28]. These metrics are commonly employed to assess the accuracy of crack detection and measure the accuracy and reliability of the detection results systematically. The evaluation metrics for crack detection were represented using TP (True Positive), TN (True Negative), FP (False Positive), and FN (False Negative) [46] to represent the evaluation metrics for crack detection, the formulas can be described as follows:
D S C = 2 T P 2 T P + F P + F N
I o U = T P T P + F P + F N
M A E = T P + F N T P + T N + F P + F N

4. Experiments and Analyses

4.1. Crack Detection Results and Analysis

4.1.1. Performance Comparison Analysis

Experiments were conducted to compare CrackSL-Net with current mainstream supervised networks, including HED [47], U-Net [6], and RCF [7]. This comprehensive evaluation was performed using the GAPs384 and Crack500 datasets, assessing multiple evaluation metrics to provide a quantitative basis for analyzing model performance. The evaluation encompassed comparisons across various supervision levels and tested performance under different proportions of labeled data.
Table 1 shows that on the GAPs384 dataset, U-Net in fully supervised mode exhibits the best performance in both DSC and IoU metrics, reaching 0.91 and 0.88, respectively. Its MAE also remains at 0.05, indicating that U-Net has excellent performance in crack detection on the GAPs384 dataset under fully supervised conditions. The performance of all models improved as the proportion of labeled data increased. With only 5% of labeled data, CrackSL-Net achieves a DSC of 0.82 and an IoU of 0.79, significantly surpassing the other models. Increasing the labeled data proportion to 50% allows CrackSL-Net’s DSC and IoU values to peak, nearly matching U-Net’s fully supervised detection performance. This highlights CrackSL-Net’s capacity to sustain high performance even with minimal labeled data, with its consistently low MAE further attesting to its effectiveness.
As shown in Table 2, in fully supervised mode on the Crack500 dataset, RCF obtains the top score of 0.88 in the DSC metric, and U-Net has the highest score of 0.85 in the IoU metric. All methods exhibit similar performance levels in MAE, with scores ranging from 0.06 to 0.07. Even with just 5% labeled data, CrackSL-Net significantly outperforms other models, achieving a DSC of 0.72 and an IoU of 0.67, surpassing U-Net’s performance under fully supervised conditions. With the label proportion rising to 50%, CrackSL-Net sustains its high performance, with a DSC of 0.87 and an IoU of 0.84, outperforming the HED model in DSC and nearly matching U-Net’s fully supervised detection capabilities.
Figure 6 shows that the first row displays the original pavement crack images, the second row presents the ground truth, and the third row demonstrates the detection results of CrackSL-Net. From left to right, the first and fifth images reveal visible pavement cracks, and CrackSL-Net successfully detects the primary cracks with robust overall segmentation performance, largely covering the crack locations shown in the ground truth. The second image shows relatively obvious cracks, albeit under darker lighting conditions. CrackSL-Net’s detection results closely match the ground truth, even with slight discontinuities or noise in some areas. The third image features cracks on a rough surface with uneven lighting in certain regions. CrackSL-Net detects cracks under these conditions, although there can be noise or minor detection errors in specific areas. The fourth image displays complex pavement cracks with multiple intersections. Although CrackSL-Net captures the general direction of the major cracks, slight omissions or discontinuities occur in some complex regions.
Accordingly, CrackSL-Net demonstrates exceptional detection capabilities in complex pavement crack scenarios. Whether under low-light conditions or segmenting cracks at complex intersections, CrackSL-Net accurately detects them. Despite minor discontinuities or noise in some areas, the results closely match the ground truth, demonstrating CrackSL-Net’s robustness and reliability in practical applications.

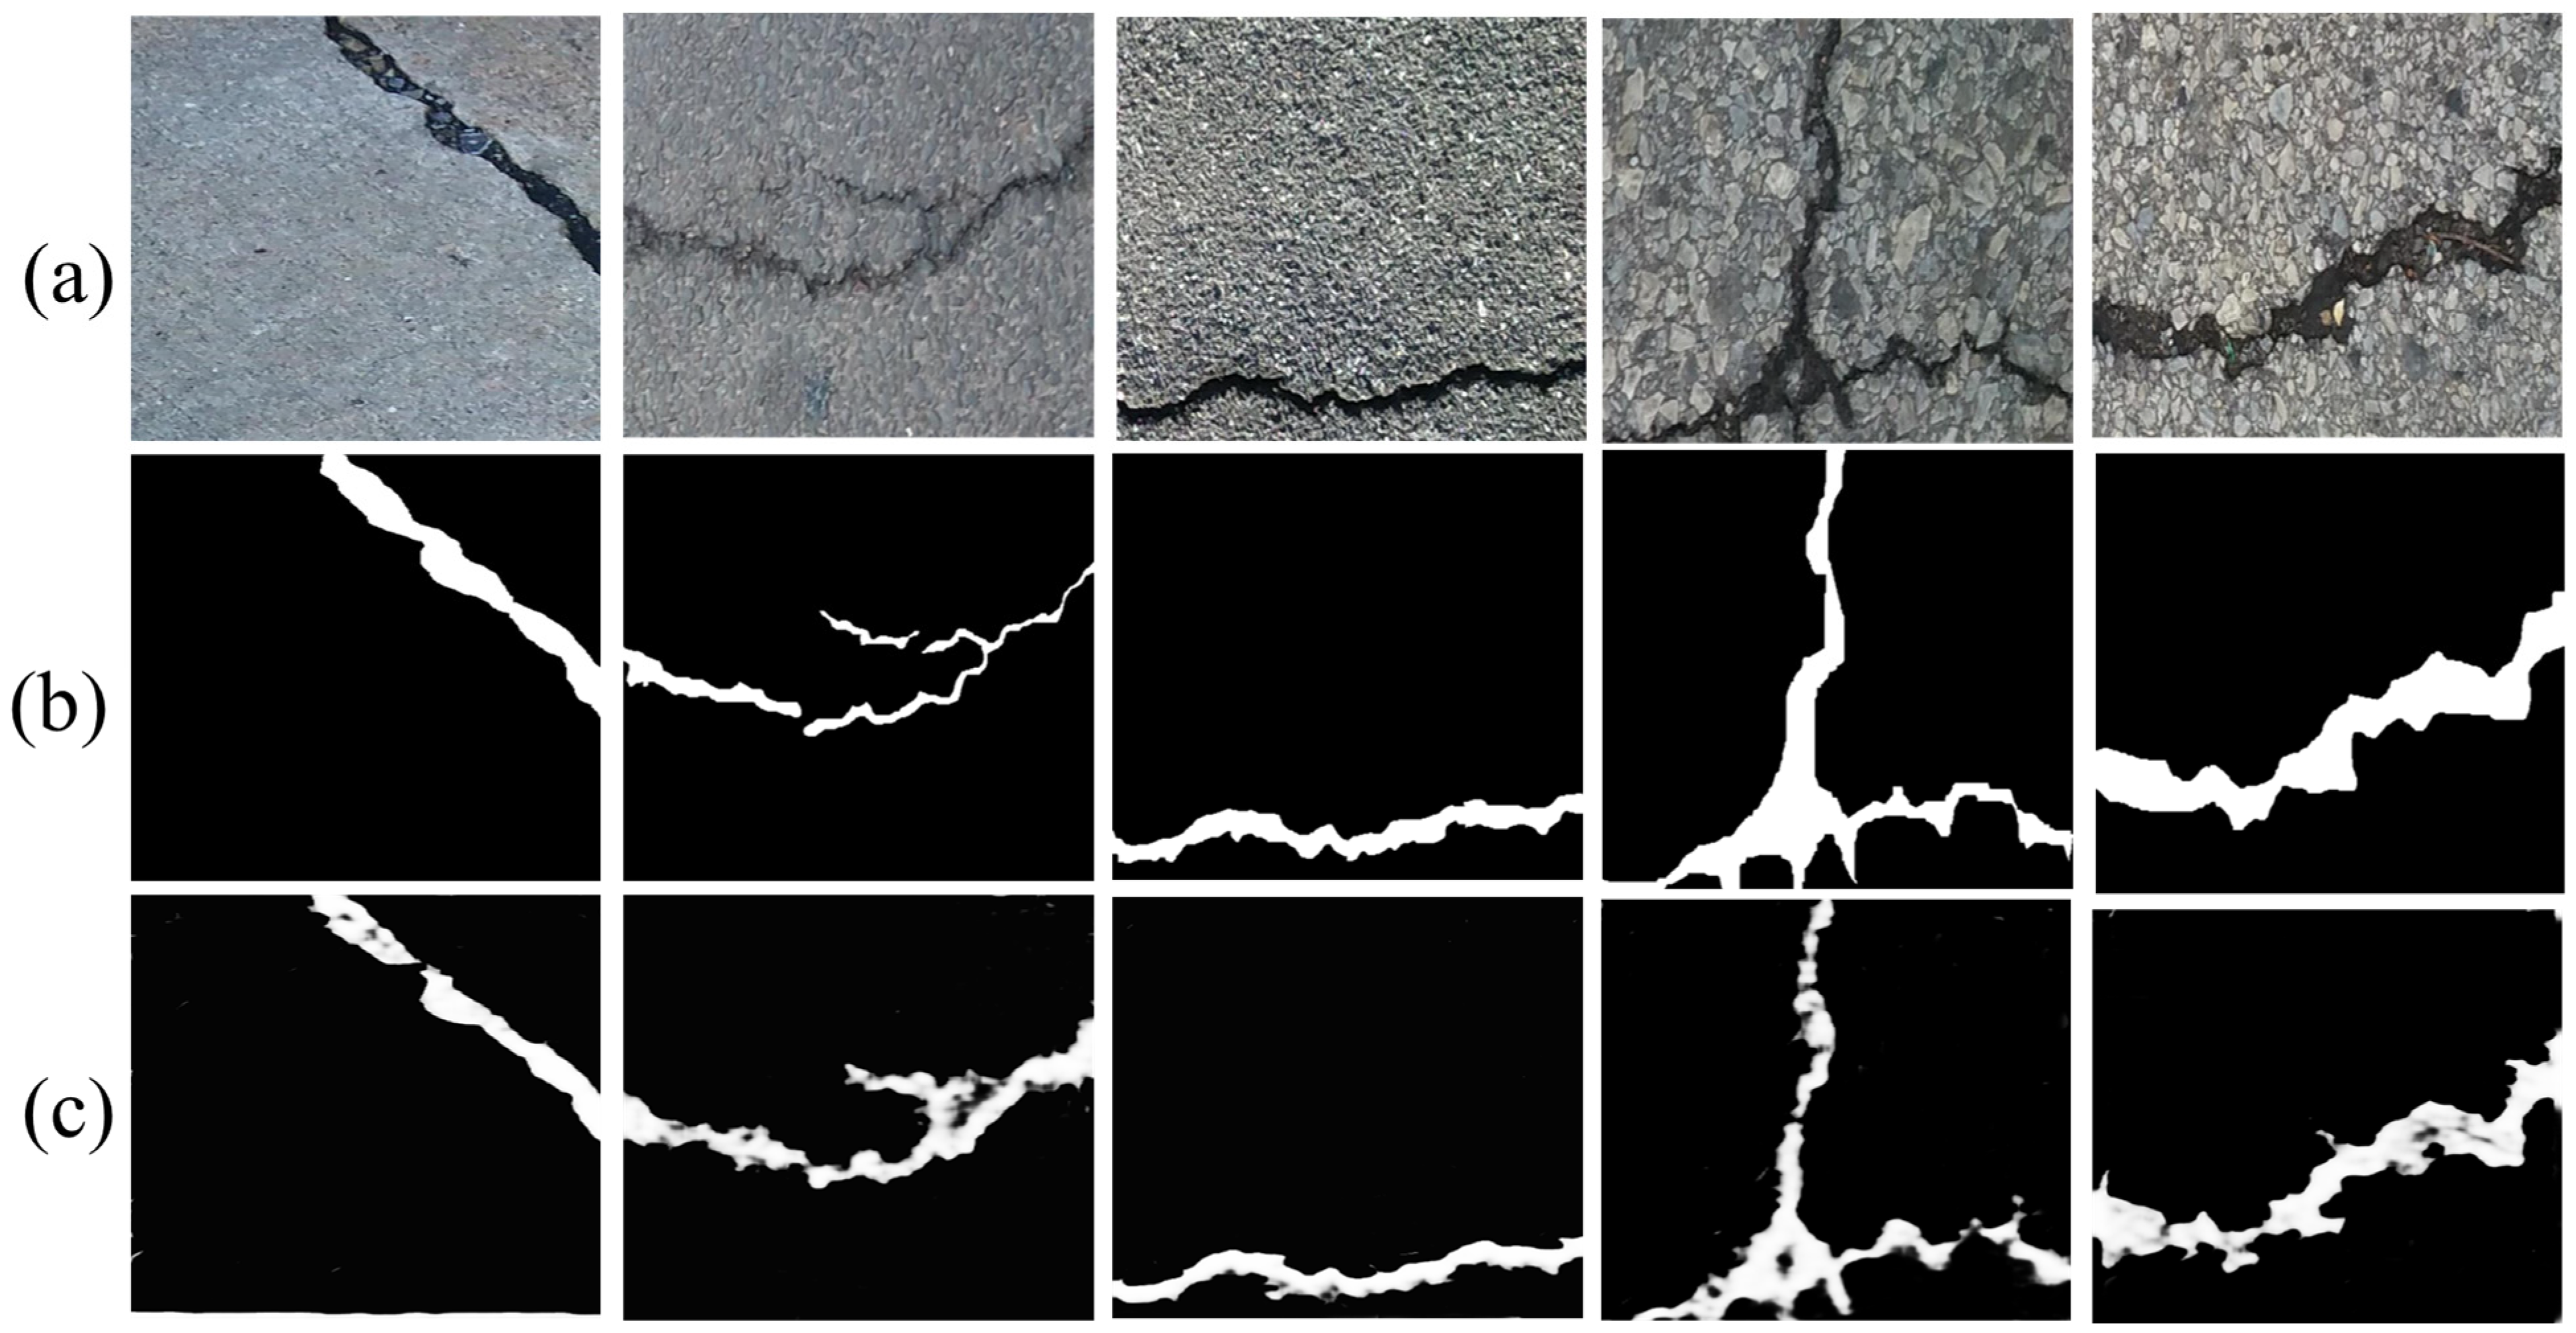
4.1.2. Comparative Analysis of Visualizations

The experiment compared the performance of CrackSL-Net with other mainstream models in crack detection tasks, highlighting the differences in the effectiveness of various methods in handling complex crack images through visualizations.
As shown in Figure 7, in the first row, when faced with two cracks in a low-contrast environment, the HED and RCF models fail to effectively distinguish them as separate entities. In contrast, although CrackSL-Net cannot determine the complete contour of the cracks as precisely as U-Net under limited data conditions, it successfully distinguishes and identifies the two cracks. In the second row, the HED, RCF, and U-Net models struggle to effectively identify the subtle distinctions between discontinuous cracks and aggregates. However, the CrackSL-Net model accurately distinguishes between cracks and aggregates, clearly marking the crack areas and demonstrating superior detection performance. In comparison to other models, CrackSL-Net more effectively detects the overall contours of the mesh-like cracks shown in the third and fourth rows. The model can more accurately differentiate the minor differences between the pavement background and cracks, thus exhibiting more precise and reliable performance in detecting crack integrity.
Comparative experimental analysis shows that CrackSL-Net, by utilizing the similarity between pavement crack regions, demonstrates robust crack detection capabilities across both datasets, even when limited to annotated data. Furthermore, this model exhibits superior adaptability to the varying conditions found in complex engineering pavement environments.

4.2. Ablation Study

This study conducted ablation experiments with different sample proportion combinations on the GAPs384 dataset to verify the effectiveness of the fractal dimension for crack detection. Table 3 indicates that, by comparing the performance of the baseline model (CrackSL-Net) with the model that incorporates fractal dimension features, the experimental results demonstrate improved crack detection performance across all weight combinations after including fractal dimension features. This improvement is especially significant under conditions with a low proportion of samples.
The roles of the classifier and projector were thoroughly analyzed to highlight their core and significant contributions to CrackSL-Net on the GAPs384 dataset. Table 4 demonstrates that incorporating the classifier and projector enables the dual-view architecture to learn more extensive features and achieve optimal results with 5%, 20%, and 50% labeled training images. When only the classifier is used, the network can learn from different perspectives but cannot accurately assess the prediction consistency of the unlabeled data. However, when only the projector is used, the network can obtain consistent feature representations but fails to learn generalizable features. When both the classifier and projector are applied simultaneously, they collaborate to enable the segmentation network to learn more comprehensive representations from both labeled and unlabeled data.
Ablation experiments were conducted on the GAPs384 dataset with various combinations of loss weights α, β, γ, and δ to explore the impact of different weight coefficients in the loss function on the model. Table 5 indicates that these experiments utilized a 50% proportion of labeled data. The study demonstrated the optimal performance of CrackSL-Net when the four loss weights were balanced.

5. Conclusions

This study proposes a pavement crack detection method that combines fractal dimension and semi-supervised learning to eliminate reliance on large amounts of manually annotated data for automatic pavement crack detection. Initially, the self-similarity characteristics within the crack regions are identified by analyzing pavement crack images, and the fractal dimension is calculated to determine the cracks’ locations. This process quickly identifies potential crack areas, reducing the computational load for subsequent analysis. Next, the study introduces CrackSL-Net, a semi-supervised crack detection model that learns to recognize the semantic similarities among crack image regions. This network is trained using a small amount of labeled data and a large amount of unlabeled data through semi-supervised learning, achieving good detection results even with limited labeled resources. Finally, comparative experiments are conducted with HED, U-Net, and RCF models on the GAPs384 and Crack500 datasets to evaluate the performance of the proposed method. The experimental findings indicate that, when tested against U-Net on two publicly available datasets, the proposed method exhibits comparable high-precision crack detection capabilities at a 50% annotation ratio, achieving an IoU exceeding 0.84. Moreover, the method maintains this precision despite limited labeling resources and demonstrates an improved ability to adapt to the complexities found in various engineering pavement environments.
More exploration of the mechanisms for extracting and utilizing the semantic similarity of pavement cracks must be conducted in future research. The accuracy and robustness of crack detection can be significantly enhanced by integrating data from multimodal sensors, such as LiDAR and infrared imaging.

Author Contributions

Conceptualization, methodology, software, writing—original draft, W.G.; Conceptualization, writing—review and editing, visualization, L.Z.; Writing—review, editing, and methodology, D.Z.; Supervision, funding acquisition, Q.L. All authors have read and agreed to the published version of the manuscript.

Funding

This research was funded by the National Natural Science Foundation of China (No. 2022YFB3904602), the Natural Science Foundation of Guangdong Province (No. 2022A1515011626), the Pearl River Talent Program (No. 2021JC02G046), and the Research Team Cultivation Program of Shenzhen University (No. 2023JCT003).

Data Availability Statement

The data used to support the findings of this study are available from the corresponding author upon request.

Acknowledgments

The authors would like to thank all the anonymous referees for their constructive comments and suggestions.

Conflicts of Interest

The authors declare no conflicts of interest.

References

  1. Ai, D.; Jiang, G.; Lam, S.K.; He, P.; Li, C. Computer vision framework for crack detection of civil infrastructure—A review. Eng. Appl. Artif. Intell. 2023, 117, 105478. [Google Scholar] [CrossRef]
  2. Yu, Y.; Guan, H.; Li, D.; Zhang, Y.; Jin, S.; Yu, C. CCapFPN: A Context-Augmented Capsule Feature Pyramid Network for Pavement Crack Detection. IEEE Trans. Intell. Transp. Syst. 2022, 23, 3324–3335. [Google Scholar] [CrossRef]
  3. Zhang, D.; Zou, Q.; Lin, H.; Xu, X.; He, L.; Gui, R.; Li, Q. Automatic pavement defect detection using 3D laser profiling technology. Autom. Constr. 2018, 96, 350–365. [Google Scholar] [CrossRef]
  4. Guo, W.; Zhang, X.; Zhang, D.; Chen, Z.; Zhou, B.; Huang, D.; Li, Q. Detection and classification of pipe defects based on pipe-extended feature pyramid network. Autom. Constr. 2022, 141, 104399. [Google Scholar] [CrossRef]
  5. Sattar, S.; Li, S.; Chapman, M. Road surface monitoring using smartphone sensors: A review. Sensors 2018, 18, 3845. [Google Scholar] [CrossRef] [PubMed]
  6. Ronneberger, O.; Fischer, P.; Brox, T. U-net: Convolutional networks for biomedical image segmentation. In Proceedings of the Lecture Notes in Computer Science (Including Subseries Lecture Notes in Artificial Intelligence and Lecture Notes in Bioinformatics); Springer: Cham, Switzerland, 2015; Volume 9351, pp. 234–241. [Google Scholar]
  7. Liu, Y.; Cheng, M.M.; Hu, X.; Bian, J.W.; Zhang, L.; Bai, X.; Tang, J. Richer Convolutional Features for Edge Detection. IEEE Trans. Pattern Anal. Mach. Intell. 2019, 41, 1939–1946. [Google Scholar] [CrossRef] [PubMed]
  8. Badrinarayanan, V.; Kendall, A.; Cipolla, R. SegNet: A Deep Convolutional Encoder-Decoder Architecture for Image Segmentation. IEEE Trans. Pattern Anal. Mach. Intell. 2017, 39, 2481–2495. [Google Scholar] [CrossRef] [PubMed]
  9. Zou, Q.; Zhang, Z.; Li, Q.; Qi, X.; Wang, Q.; Wang, S. DeepCrack: Learning hierarchical convolutional features for crack detection. IEEE Trans. Image Process. 2019, 28, 1498–1512. [Google Scholar] [CrossRef] [PubMed]
  10. Feng, C.; Liu, M.Y.; Kao, C.C.; Lee, T.Y. Deep active learning for civil infrastructure defect detection and classification. In Proceedings of the Congress on Computing in Civil Engineering, Proceedings; Mitsubishi Electric Research Laboratories, Inc.: Cambridge, MA, USA, 2017; pp. 298–306. [Google Scholar]
  11. Kirillov, A.; Mintun, E.; Ravi, N.; Mao, H.; Rolland, C.; Gustafson, L.; Xiao, T.; Whitehead, S.; Berg, A.C.; Lo, W.-Y.; et al. Segment Anything. In Proceedings of the IEEE/CVF International Conference on Computer Vision, Paris, France, 1–6 October 2023. [Google Scholar]
  12. Chaiyasarn, K.; Buatik, A.; Likitlersuang, S. Concrete crack detection and 3D mapping by integrated convolutional neural networks architecture. Adv. Struct. Eng. 2021, 24, 1480–1494. [Google Scholar] [CrossRef]
  13. Jiang, W.; Liu, M.; Peng, Y.; Wu, L.; Wang, Y. HDCB-Net: A Neural Network with the Hybrid Dilated Convolution for Pixel-Level Crack Detection on Concrete Bridges. IEEE Trans. Ind. Inform. 2021, 17, 5485–5494. [Google Scholar] [CrossRef]
  14. Choi, W.; Cha, Y.J. SDDNet: Real-Time Crack Segmentation. IEEE Trans. Ind. Electron. 2020, 67, 8016–8025. [Google Scholar] [CrossRef]
  15. Kang, D.H.; Cha, Y.J. Efficient attention-based deep encoder and decoder for automatic crack segmentation. Struct. Health Monit. 2022, 21, 2190–2205. [Google Scholar] [CrossRef] [PubMed]
  16. Liu, Z.; Zheng, T.; Xu, G.; Yang, Z.; Liu, H.; Cai, D. Training-time-friendly network for real-time object detection. In Proceedings of the AAAI 2020—34th AAAI Conference on Artificial Intelligence, New York, NY, USA, 7–12 February 2020; Volume 34, pp. 11685–11692. [Google Scholar] [CrossRef]
  17. Zhang, J.; Qian, S.; Tan, C. Automated bridge surface crack detection and segmentation using computer vision-based deep learning model. Eng. Appl. Artif. Intell. 2022, 115, 105225. [Google Scholar] [CrossRef]
  18. Yang, F.; Zhang, L.; Yu, S.; Prokhorov, D.; Mei, X.; Ling, H. Feature Pyramid and Hierarchical Boosting Network for Pavement Crack Detection. IEEE Trans. Intell. Transp. Syst. 2020, 21, 1525–1535. [Google Scholar] [CrossRef]
  19. Ye, X.W.; Jin, T.; Chen, P.Y. Structural crack detection using deep learning–based fully convolutional networks. Adv. Struct. Eng. 2019, 22, 3412–3419. [Google Scholar] [CrossRef]
  20. Shelhamer, E.; Long, J.; Darrell, T. Fully Convolutional Networks for Semantic Segmentation. IEEE Trans. Pattern Anal. Mach. Intell. 2017, 39, 640–651. [Google Scholar] [CrossRef] [PubMed]
  21. Fei, Y.; Wang, K.C.P.; Zhang, A.; Chen, C.; Li, J.Q.; Liu, Y.; Yang, G.; Li, B. Pixel-Level Cracking Detection on 3D Asphalt Pavement Images through Deep-Learning- Based CrackNet-V. IEEE Trans. Intell. Transp. Syst. 2020, 21, 273–284. [Google Scholar] [CrossRef]
  22. Bang, S.; Park, S.; Kim, H.; Kim, H. Encoder–decoder network for pixel-level road crack detection in black-box images. Comput. Civ. Infrastruct. Eng. 2019, 34, 713–727. [Google Scholar] [CrossRef]
  23. Nayyeri, F.; Hou, L.; Zhou, J.; Guan, H. Foreground–background separation technique for crack detection. Comput. Civ. Infrastruct. Eng. 2019, 34, 457–470. [Google Scholar] [CrossRef]
  24. Zhu, D.; Tang, A.; Wan, C.; Zeng, Y.; Wang, Z. Investigation on the flexural toughness evaluation method and surface cracks fractal characteristics of polypropylene fiber reinforced cement-based composites. J. Build. Eng. 2021, 43, 103045. [Google Scholar] [CrossRef]
  25. Yin, Y.; Ren, Q.; Lei, S.; Zhou, J.; Xu, L.; Wang, T. Mesoscopic crack pattern fractal dimension-based concrete damage identification. Eng. Fract. Mech. 2024, 296, 109829. [Google Scholar] [CrossRef]
  26. An, Q.; Chen, X.; Wang, H.; Yang, H.; Yang, Y.; Huang, W.; Wang, L. Segmentation of Concrete Cracks by Using Fractal Dimension and UHK-Net. Fractal Fract. 2022, 6, 95. [Google Scholar] [CrossRef]
  27. Cheng, J.; Chen, Q.; Huang, X. An Algorithm for Crack Detection, Segmentation, and Fractal Dimension Estimation in Low-Light Environments by Fusing FFT and Convolutional Neural Network. Fractal Fract. 2023, 7, 820. [Google Scholar] [CrossRef]
  28. Nguyen, S.D.; Tran, T.S.; Tran, V.P.; Lee, H.J.; Piran, M.J.; Le, V.P. Deep Learning-Based Crack Detection: A Survey. Int. J. Pavement Res. Technol. 2023, 16, 943–967. [Google Scholar] [CrossRef]
  29. Liu, K.; Chen, B.M. Industrial UAV-Based Unsupervised Domain Adaptive Crack Recognitions: From Database Towards Real-Site Infrastructural Inspections. IEEE Trans. Ind. Electron. 2023, 70, 9410–9420. [Google Scholar] [CrossRef]
  30. Pang, X.; Lin, C.; Li, F.; Pan, Y. Bio-inspired XYW parallel pathway edge detection network. Expert Syst. Appl. 2024, 237, 121649. [Google Scholar] [CrossRef]
  31. Peiris, H.; Chen, Z.; Egan, G.; Harandi, M. Duo-SegNet: Adversarial Dual-Views for Semi-supervised Medical Image Segmentation. In Proceedings of the Lecture Notes in Computer Science (Including Subseries Lecture Notes in Artificial Intelligence and Lecture Notes in Bioinformatics); Springer: Cham, Switzerland, 2021; Volume 12902 LNCS, pp. 428–438. [Google Scholar]
  32. Ye, M.; Zhang, X.; Yuen, P.C.; Chang, S.F. Unsupervised embedding learning via invariant and spreading instance feature. In Proceedings of the IEEE/CVF Conference on Computer Vision and Pattern Recognition, Long Beach, CA, USA, 15–20 June 2019; pp. 6203–6212. [Google Scholar] [CrossRef]
  33. He, K.; Fan, H.; Wu, Y.; Xie, S.; Girshick, R. Momentum Contrast for Unsupervised Visual Representation Learning. In Proceedings of the IEEE Computer Society Conference on Computer Vision and Pattern Recognition, Seattle, WA, USA, 14–19 June 2020; pp. 9726–9735. [Google Scholar]
  34. Weng, X.; Huang, Y.; Li, Y.; Yang, H.; Yu, S. Unsupervised domain adaptation for crack detection. Autom. Constr. 2023, 153, 104939. [Google Scholar] [CrossRef]
  35. Jin, X.; Bu, J.; Yu, Z.; Zhang, H.; Wang, Y. FedCrack: Federated Transfer Learning With Unsupervised Representation for Crack Detection. IEEE Trans. Intell. Transp. Syst. 2023, 24, 11171–11184. [Google Scholar] [CrossRef]
  36. Wu, Y.; Hong, M.; Li, A.; Huang, S.; Liu, H.; Ge, Y. Self-Supervised Adversarial Learning for Domain Adaptation of Pavement Distress Classification. IEEE Trans. Intell. Transp. Syst. 2023, 25, 1966–1977. [Google Scholar] [CrossRef]
  37. Zhao, X.; Sheng, Y.; Lv, H.; Jia, H.; Liu, Q.; Ji, X.; Xiong, R.; Meng, J. Laboratory investigation on road performances of asphalt mixtures using steel slag and granite as aggregate. Constr. Build. Mater. 2022, 315, 125655. [Google Scholar] [CrossRef]
  38. Wu, J.; Jin, X.; Mi, S.; Tang, J. An effective method to compute the box-counting dimension based on the mathematical definition and intervals. Results Eng. 2020, 6, 100106. [Google Scholar] [CrossRef]
  39. Lou, A.; Tawfik, K.; Yao, X.; Liu, Z.; Noble, J. Min-Max Similarity: A Contrastive Semi-Supervised Deep Learning Network for Surgical Tools Segmentation. IEEE Trans. Med. Imaging 2023, 42, 2832–2841. [Google Scholar] [CrossRef] [PubMed]
  40. Wang, X.; Qi, G.J. Contrastive Learning with Stronger Augmentations. IEEE Trans. Pattern Anal. Mach. Intell. 2023, 45, 5549–5560. [Google Scholar] [CrossRef] [PubMed]
  41. Chen, X.; He, K. Exploring simple Siamese representation learning. In Proceedings of the IEEE/CVF Conference on Computer Vision and Pattern Recognition, Nashville, TN, USA, 19–25 June 2021; pp. 15745–15753. [Google Scholar] [CrossRef]
  42. Chen, T.; Kornblith, S.; Norouzi, M.; Hinton, G. A simple framework for contrastive learning of visual representations. In Proceedings of the 37th International Conference on Machine Learning, ICML 2020, Virtual, 13–18 July 2020; Volume PartF16814, pp. 1575–1585. [Google Scholar]
  43. Gao, S.H.; Cheng, M.M.; Zhao, K.; Zhang, X.Y.; Yang, M.H.; Torr, P. Res2Net: A New Multi-Scale Backbone Architecture. IEEE Trans. Pattern Anal. Mach. Intell. 2021, 43, 652–662. [Google Scholar] [CrossRef] [PubMed]
  44. Eisenbach, M.; Stricker, R.; Seichter, D.; Amende, K.; Debes, K.; Sesselmann, M.; Ebersbach, D.; Stoeckert, U.; Gross, H.M. How to get pavement distress detection ready for deep learning? A systematic approach. In Proceedings of the International Joint Conference on Neural Networks, Anchorage, AK, USA, 14–19 May 2017; pp. 2039–2047. [Google Scholar]
  45. Lyu, C.; Hu, G.; Wang, D. Attention to fine-grained information: Hierarchical multi-scale network for retinal vessel segmentation. Vis. Comput. 2022, 38, 345–355. [Google Scholar] [CrossRef]
  46. Zhang, K.; Zhang, Y.; Cheng, H. Da CrackGAN: Pavement Crack Detection Using Partially Accurate Ground Truths Based on Generative Adversarial Learning. IEEE Trans. Intell. Transp. Syst. 2021, 22, 1306–1319. [Google Scholar] [CrossRef]
  47. Xie, S.; Tu, Z. Holistically-nested edge detection. In Proceedings of the IEEE International Conference on Computer Vision, Santiago, Chile, 7–13 December 2015; pp. 1395–1403. [Google Scholar]
Figure 1. Schematic of pavement cracks.
Fractalfract 08 00468 g001
Figure 2. The grid size of the overlay pavement image for ε = 1 4 .
Fractalfract 08 00468 g002
Figure 3. Flowchart of crack candidate region extraction.
Fractalfract 08 00468 g003
Figure 4. The structure of SimCLR [42].
Fractalfract 08 00468 g004
Figure 5. CrackSL-Net structural model.
Fractalfract 08 00468 g005
Figure 6. Crack detection results by CrackSL-Net: (a) Original crack images, (b) Ground truth, (c) Results of the proposed method.
Fractalfract 08 00468 g006
Figure 7. Crack detection results of different methods, the area within the red box is the focal point for our comparison. (a) Original crack images, (b) Ground truth, (c) Results of the proposed method, (d) Results of HED, (e) Results of RCF, and (f) Results of U-Net.
Fractalfract 08 00468 g007
Table 1. Performance results on the GAPs384 dataset.
MethodsDSCIoUMAE
HED (fully)0.890.750.06
RCF (fully)0.890.770.05
U-Net (fully)0.910.880.05
Label ratio lr5%20%50%5%20%50%5%20%50%
HED0.570.680.800.480.560.560.070.070.07
RCF0.610.710.810.530.630.770.060.060.06
U-Net0.640.720.810.600.760.780.070.060.06
CrackSL-Net0.820.860.900.790.830.870.050.030.03
Table 2. Performance results on the Crack500 dataset.
MethodsDSCIoUMAE
HED (fully)0.860.720.07
RCF (fully)0.880.740.06
U-Net (fully)0.870.850.06
Label ratio lr5%20%50%5%20%50%5%20%50%
HED0.490.700.770.340.600.680.080.070.07
RCF0.660.740.800.570.610.730.080.070.06
U-Net0.430.750.770.330.650.690.070.070.06
CrackSL-Net0.720.790.870.670.740.840.060.050.04
Table 3. Ablation experiments for fractal dimension.
MethodIoU (5%)IoU (20%)IoU (50%)
CrackSL-Net (baseline)0.610.700.83
+Fractal dimension0.670.740.84
Table 4. Ablation experiments for network structures, ‘√’ represents ‘Present’, while ‘×’ represents ‘Absent’.
Label RatioClassifierProjectorDSCIoUMAE
5%xx0.620.470.06
x0.670.540.06
x0.710.570.05
0.820.790.03
20%xx0.690.590.05
x0.760.630.04
x0.790.640.04
0.860.830.03
50%xx0.770.670.03
x0.850.760.03
x0.860.760.03
0.900.870.03
Table 5. Ablation experiments with different weight combinations.
αβγδDSCIoUMAE
0.10.20.30.40.890.830.02
0.10.20.40.30.880.830.02
0.20.10.30.40.890.840.02
0.20.10.40.30.890.840.02
0.30.40.10.20.880.850.02
0.30.40.20.10.890.850.02
0.40.30.10.20.890.860.02
0.40.30.20.10.890.840.02
0.20.20.30.30.890.870.02
0.30.30.20.20.890.870.02
0.250.250.250.250.900.890.02
Disclaimer/Publisher’s Note: The statements, opinions and data contained in all publications are solely those of the individual author(s) and contributor(s) and not of MDPI and/or the editor(s). MDPI and/or the editor(s) disclaim responsibility for any injury to people or property resulting from any ideas, methods, instructions or products referred to in the content.

