Abstract
In the field of geological exploration and wave propagation theory, particularly in heterogeneous attenuating media, the stability of numerical simulations is a significant challenge for implementing effective attenuation compensation strategies. Consequently, the development and optimization of algorithms and techniques that can mitigate these numerical instabilities are critical for ensuring the accuracy and practicality of attenuation compensation methods. This is essential to reveal subsurface structure information accurately and enhance the reliability of geological interpretation. We present a method for stable forward modeling in strongly attenuating media by reapplying the Hilbert transform to eliminate increasing negative frequency components. We derived and validated new constant-Q wave equation (CWE) formulations and a stable solving method. Our study reveals that the original CWE equations, when utilizing the analytic signal, regenerate and amplify negative frequencies, leading to instability. Implementing our method maintains high accuracy between analytical and numerical solutions. The application of our approach to the Chimney Model, compared with results from the acoustic wave equation, confirms the reliability and effectiveness of the proposed equations and method.
1. Introduction
As the underground medium is not completely elastic, amplitude attenuation and velocity dispersion occur during underground wave propagation [1,2,3,4,5,6]. The seismic quality factor Q [7,8,9] is a crucial parameter that describes the absorption attenuation and medium viscosity during seismic wave propagation. It provides valuable information for reservoir prediction and hydrocarbon detection. A lower Q value indicates a more viscous medium, leading to stronger attenuation of seismic waves and consequently shorter propagation distances.
There are two common models for describing seismic wave attenuation phenomena. The first category involves connecting multiple mechanical elements in series or parallel to form the Standard Linear Solid (SLS) method, which approximates a constant Q model [10,11,12,13,14]. The second category is based on the constant-Q model, using fractional-order viscoacoustic and viscoelastic wave equations for simulation [15,16,17,18,19]. In the Standard Linear Solid (SLS) model, the behavior of viscoacoustic media over a specified frequency range is characterized by a parameter that allows the quality factor Q to vary with frequency. Conversely, the constant-Q (CQ) theory posits that Q remains invariant with frequency. Alternatively, the constant-Q (CQ) model assumes Q is frequency-independent and requires only the phase velocity and quality factor Q for describing viscoacoustic media.
The constant Q wave equation, originally developed for frequency domain applications in attenuating media [20], poses significant computational challenges when implemented for seismic wave simulations [21,22]. To manage these challenges and extend the equation’s utility to time-domain analyses, researchers have transformed the equation from the frequency to the time domain, where it utilizes fractional-order time derivatives to represent stress–strain relationships. References [15,23,24] approximately simulated the propagation of viscoacoustic, viscoelastic, and anisotropic viscoelastic waves. While this approach can reduce high computational loads and memory consumption, it remains challenging for industrial applications. This issue can be addressed by replacing the fractional-order time derivative with a fractional-order Laplacian. Based on this idea, reference [25] proposed a generalized pseudo-spectral method, converting the fractional-order time derivative into a fractional-order spatial derivative, making it computationally more feasible.
Through approximation, reference [17] derived a new time-domain viscoacoustic wave equation that includes decoupled amplitude attenuation and phase dispersion terms. Additionally, reference [5] derived a seismic wave equation in which different attenuation effects are separately simulated by removing irrelevant terms and retaining relevant ones. These enhancements are crucial for modern numerical simulations, including reverse time migration and full-waveform inversion, especially in media with strong absorption properties [26,27,28,29,30].
As reference [17] pointed out, traditional fractional-order wave equations have low accuracy in strongly absorbing media. To address this issue, reference [31] derived an accurate time-domain viscoacoustic wave equation, considering primarily attenuation and dispersion effects separately to derive two individual wave equations. They further approximate the expanded CWEs using Taylor expansion to obtain a numerical solution. However, this method may result in wavefield instability during forward modeling in strongly attenuating media. We guess and verify that the instability is caused by the occurrence of negative frequencies during the wavefield forward modeling when we use analytic signal. By reapplying Hilbert transform, the instability issue can be resolved, and subsequent numerical experiments confirmed the correctness of our approach.
2. Materials and Methods
In our study, we reference the work by [2,31] to describe the relaxation property of a linearlossy acoustic media in the time domain
where is the creep function, is the gamma function, is the reference time, which can be chosen arbitrarily, and is the reference modulus defined as
The attenuation factor is expressed in terms of the quality factor
To establish the wave equation in the frequency domain, Equation (1) becomes
Here, we define the reference frequency as ; is the sign function. From reference [2], we also know that the wavenumber expression is . Substituting Equation (4) into this expression, we obtain
The real part of the equation represents dispersion, indicating that seismic velocity varies with frequency and the attenuation parameter . In other words, seismic velocity is a function of these two parameters
Conversely, the imaginary part details dissipation, encapsulated by the attenuation coefficient , which depends on frequency, velocity, and attenuation parameter . It is defined as:
This formula highlights how both positive and negative frequency components experience attenuation [30].
Frequency-dependent velocity is defined by Equation (6), and the attenuation coefficient is defined by Equation (7). represents the spatial wavenumber, and denotes the angular temporal frequency as defined by Equation (8). We observe that the attenuation coefficient depends on both the frequency-dependent velocity and the attenuation parameter. By substituting Equation (6) into Equation (5) and squaring both sides, we derive:
In order to avoid the occurrence of fractional derivatives in time, we apply the power of to both sides of Equation (8) and obtain
becomes . We can rewrite Equation (9) into this form
But we want to obtain a frequency-domain wave equation, so by multiplying pressure wavefields on both sides and introducing the frequency-domain source function , we obtain
Next, our objective is to transform Equation (11) into the time domain for the solution using traditional finite-difference time-marching stencils. However, direct conversion is not feasible because of the separate treatment of positive and negative frequency components, where the variables and contain only positive components in this equation. Leveraging Fourier transform principles, we recognize that computing the positive frequency components alone is sufficient, as the negative frequency components can be derived straightforwardly through symmetry properties.
In the frequency domain, the complex Hilbert transform is utilized on and .
The sections within the square brackets of Equations (12) and (13) represent the frequency-domain formulations of the real-valued Hilbert transform and , respectively. The terms and correspond to the analytic signals. We can obtain the following equation:
We define the complex velocity as:
In the time domain, it is
In Liu’s research, they isolated both the dispersion-only CWE and the dissipation-only CWE. In Liu’s research, they differentiated between the dispersion-only and dissipation-only complex wave equations (CWEs). They identified that the imaginary component on the right side of Equation (5) corresponds to the dissipation term. By removing this term and revising the derivations, the dispersion-only CWE can be extracted. Consequently, Equation (16) is simplified into a more comprehensible form. Moreover, by specific setting in Equation (5), the phase velocity is shown to be independent of frequencies, thereby indicating no dispersion. This results in a purely dispersion-only CWE.
is defined as
And the dissipation-only CWE is
Subsequently, through the manipulation of the formulation, the equation can be systematically classified into various distinct forms, as shown in Table 1.

Table 1.
Wavenumber and velocity parameters used to derive the analytical solutions.
During the process of solving the equations, it is observed that while the forms of the three equations appear theoretically sound and solvable, practical computations reveal instability issues, especially when values are very low. Specifically, equations involving only attenuation and those combining attenuation with dispersion both exhibit instability. This instability may stem from the reappearance of negative frequencies during wave propagation. To address this issue, after advancing a certain distance in computation, we apply a Hilbert transform to eliminate the negative frequency components. Subsequent numerical experiments validate that this method effectively enhances stability.
Regarding the solution of the three equations, the operator can be effectively solved in the wavenumber domain for homogeneous media using the generalized pseudo-spectral method, as Carcione described. However, the variability in the parameter in heterogeneous media complicates the use of this method, as spatial variations render the inverse FFT application impractical. To overcome this, an approach known as approximation with separable variables can be employed. In seismic exploration, values typically exceed 15, resulting in values less than 0.0032, indicating its minimal impact. Thus, we can utilize Taylor expansion to simplify the application of the operator.
In order to determine how many terms we should keep, we define the following error functions:
is the term on the left side of the equation, and is an expression on the right side of the equation, which can include one, two, or three terms. Figure 1 shows the error plots and corresponding zoomed-in views for including two and three terms, respectively.

Figure 1.
Error functions defined in Equation (21). The following are the error plots and corresponding zoomed-in views: (a) two terms, (b) three terms, and (c) local magnification of three terms.
From the error plots above, we can see that in most cases, including two terms on the right side of the equation is sufficient. However, in the rare scenario where the value to be calculated is less than 10, which is uncommon in the exploration field, three terms will be necessary on the right side of the equation.
Regarding the term in Equation (19), it can be substituted with the spatial domain Laplacian operator , which can be computed using existing spatial finite-difference operators.
Thus, from the analysis provided, it is apparent that to solve Equations (16), (17), and (19) numerically, the approach is akin to conventional finite-difference time-domain (FDTD) methods. These equations can be addressed by adapting existing FDTD algorithms, mainly involving the transformation of real-valued wavefield arrays into complex-valued arrays specifically for Equations (16) and (19).
Moreover, to further validate the derived equations, experimental testing in a homogeneous model is necessary initially.
Analytical solutions are derived by convolving the source function with the 3D time-domain Green’s function, initially formulated in the frequency domain.
where is the frequency-domain Green’s function, is the seismic velocity, and denote the source and receiver locations, respectively, and represents the distance between these two points. In the following homogeneous model example, the receivers are located at a distance of 10 wavelengths from the seismic source.
3. Numerical Examples
We employed a 3D model featuring a uniform velocity of 2000 m/s, with attenuation coefficients of 5 and 20 for strongly and weakly attenuative media, respectively. The simulation utilized a Ricker wavelet with a peak frequency of 18 Hz and a reference frequency of 1 Hz as the source function. The spatial grid was consistently set at 20 m across all dimensions, and a time step of 2.5 ms was used throughout the simulation. To reduce numerical dispersion errors, we implemented the pseudo-spectral method with the Lax–Wendroff stencil [32,33] to address Equations (16), (17), and (19).
3.1. Homogeneous Model
First, we explain why applying the Hilbert transform again can stabilize the solving process, as mentioned in the theoretical introduction. Consider the extreme case where . As depicted in Figure 2, if the Hilbert transform is not reapplied during the computation, the wavefield forward modeling process becomes unstable. However, if the Hilbert transform is reapplied, the wavefield forward modeling process remains stable.
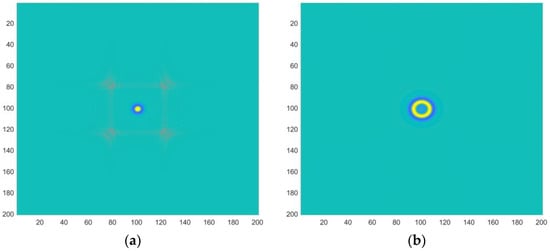
Figure 2.
Under the condition of , the forward simulation of (a) unstable and (b) stable wave field characteristics before and after the reapplication of the Hilbert transform.
To investigate the reason for instability in the forward modeling process, we selected a receiver located at a distance of 10 wavelengths from the source and examined the recorded vibrations at different time intervals. We observed that in the later stages of wave-field forward modeling, abnormal vibrations emerged with rapidly increasing amplitudes. Figure 3 shows the results of a spectrum analysis performed on receiver records at different times. This analysis revealed the presence and rapid growth of negative frequency components. When the spectral analysis is conducted on signals of varying durations, shorter-duration signals do not exhibit negative frequency components. However, as the duration of the received signals increases, negative frequencies begin to appear in the spectrum.
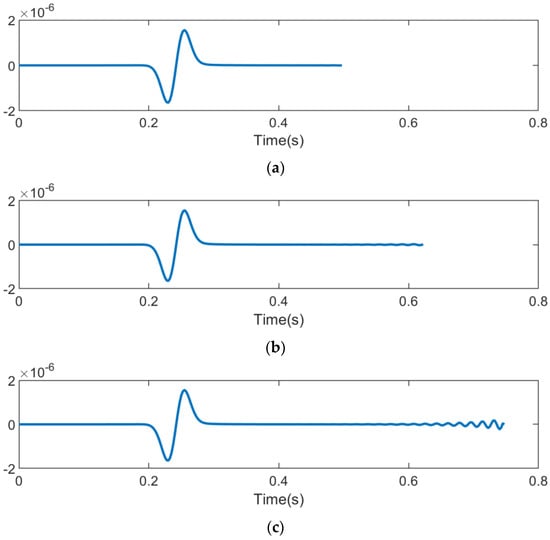
Figure 3.
Waveforms received by geophones at different time durations. (a) ; (b) ; and (c) .
The Figure 4 presents the frequency characteristics of the wavefield at different time intervals. As the forward modeling time increases, the positive frequency components remain similar, while the negative frequency components emerge and increase. The magnitude of these negative frequency components will soon surpass that of the positive frequency components, leading to instability during the solving process.
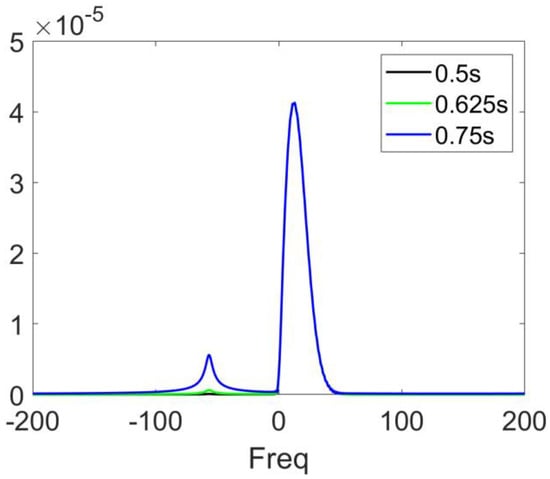
Figure 4.
The spectra corresponding to waveforms received at different times in Figure 3.
Now, the Hilbert transform is re-performed in the forward process, that is, the Hilbert transform is re-performed on the wave field after a certain step of the forward performance to obtain the analytic signal, and Figure 5 shows the waveform received by the geophone after the reapplication of the Hilbert transform.
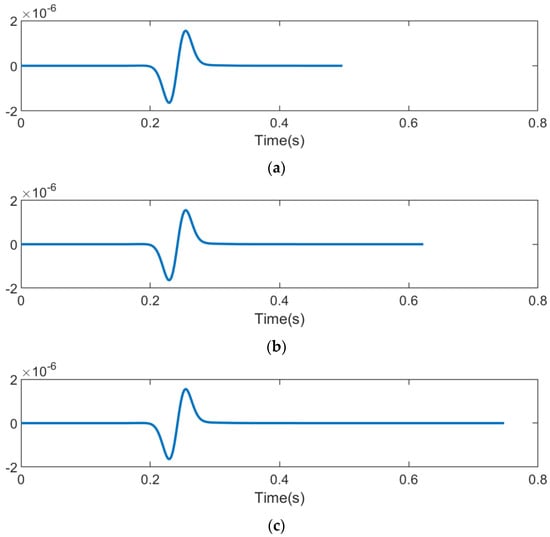
Figure 5.
Waveforms received by geophones at different time durations after reapplying the Hilbert transform in the forward process. (a) ; (b) ; and (c) .
Thus, numerical experiments have confirmed the validity of our approach. Therefore, in subsequent computations, we will systematically employ the Hilbert transform technique to guarantee waveform stability throughout the analysis.
Figure 6 illustrates both numerical and analytical solutions, demonstrating their alignment in scenarios with strongly () and weakly () attenuating media, where represents a medium without absorption. The numerical solution is consistent with the analytical solution, it shows the accuracy of the derived equation.
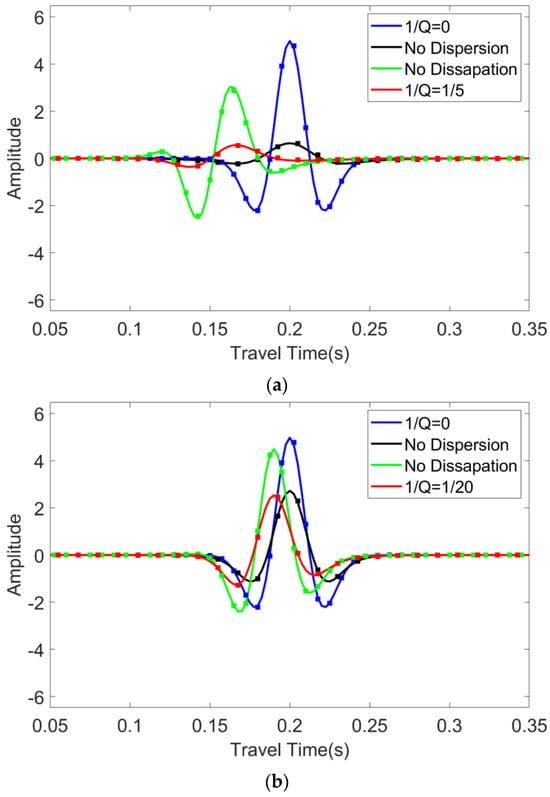
Figure 6.
Comparisons between numerical and analytical results for media exhibiting (a) strong () and (b) weak () attenuation, where represents a medium without absorption. The figure uses solid lines to represent the analytical solutions and dashed lines for the numerical solutions, featuring various equations including acoustic (blue), dispersion only (green), dissipation only (black), and combined dispersion and dissipation (red).
It can be observed that when is high, the numerical solutions of the three equations align very well with the analytical solutions. Even when is lower, the alignment remains satisfactory, which is sufficient for practical purposes.
Additionally, we can examine wavefield snapshots in a two-dimensional context to further assess the validity of the three equations. Figure 7a–c are wavefield snapshots with . The 2D wavefield snapshots show behavior consistent with empirical expectations, successfully representing both dispersion and attenuation effects through the individual equations.
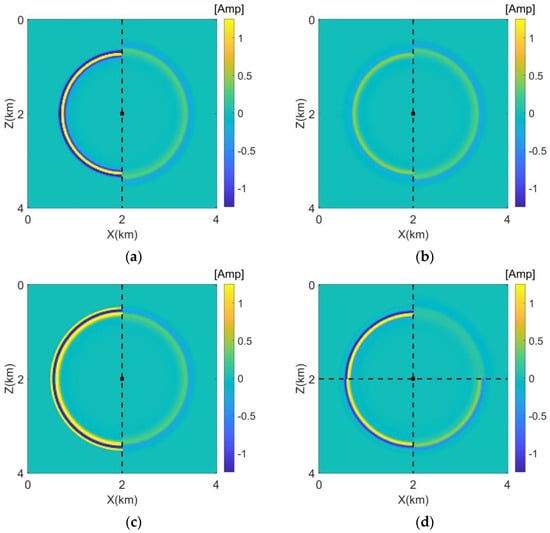
Figure 7.
Comparative forward modeling of (a) acoustic and viscoacoustic wave equations, (b) the attenuation-only and viscoacoustic wave equations, (c) the dispersion-only and viscoacoustic wave equations, (d) numerical solutions of Equation (16) with in the first, fourth, third, and second quadrants indicating that as the Q value decreases, both amplitude attenuation and dispersion effects become increasingly pronounced.
The following demonstrates the impact of different values on the forward-modeled wavefield. It can be observed that as the value decreases, both amplitude attenuation and dispersion effects become increasingly pronounced.
3.2. Chimney Model
In this section, we evaluated the solutions using the Chimney Model, as depicted in Figure 8.
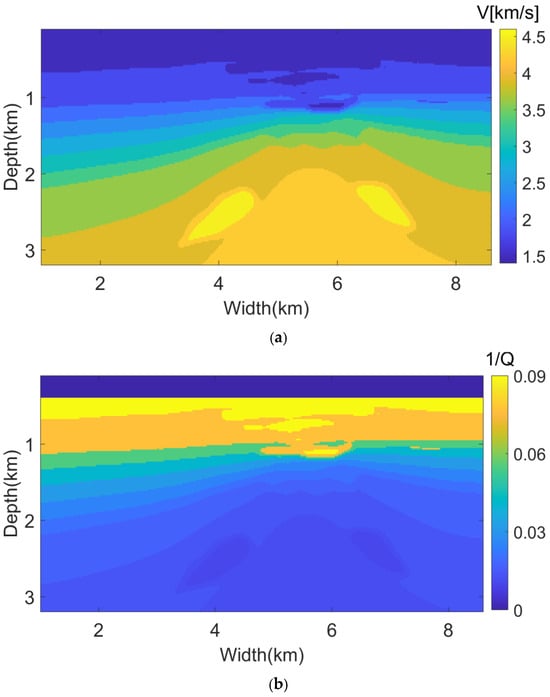
Figure 8.
Chimney Model: (a) the velocity model and (b) the inverse of the quality factor model.
In this model, the values range from 20 to 120. This model exhibits an overall increase in velocity from top to bottom, with a clear hierarchical structure. There are two high-velocity zones on either side of the middle. The value corresponds roughly to the velocity: higher velocity areas exhibit weaker absorption, while lower velocity areas exhibit stronger absorption, including areas with very strong absorption, which are considered very low values in the field of exploration. As in previous examples, the true operator is approximated using the first three terms of the equation. The Hilbert transform method was reapplied during the computation. The source wavelet had a peak frequency of 18 Hz, and the reference frequency was also set to 18 Hz. The Figure 9 shows the shot records from the forward modeling using the acoustic wave equation and the constant forward modeling.
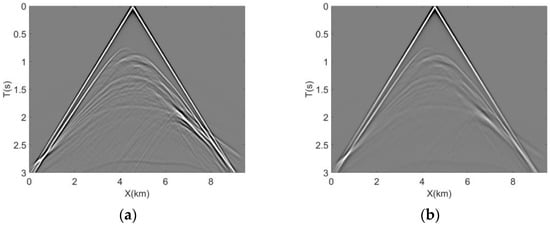
Figure 9.
The shot records from the forward modeling using (a) the acoustic wave equation and (b) the CQ-based viscoacoustic equation.
4. Discussion
The study of numerical instability in attenuation compensation is still a serious challenge, especially in strong attenuating media. Our work contributes a pivotal method to the field, focusing on stable forward modeling in strong attenuation media. We recognize that instability occurs because of the effect of negative frequencies, as evidenced by the results of spectrum analysis. By reapplying the Hilbert transform, we have successfully mitigated the problem of forward instability due to negative frequency generation. This insight led to our innovative technique, which not only mitigates these unwanted frequencies but also preserves a high level of congruence between analytical and numerical solutions. The validation of reference [30] derived three CWEs through rigorous testing, further solidifying the theoretical and practical value of our method.
The application of our stable solving method to the Chimney Model serves as a crucial benchmark. Comparison with the outcomes derived from the acoustic wave equation demonstrates not only the reliability but also the superior performance of our proposed methodology in accurately depicting subsurface structures.
This paper’s studies provide several avenues for future research exploring more complex geological models, including strong attenuation and heterogeneity, which will help to realize the full potential of our method. In addition, the combination of our method with advanced computational techniques, such as finite difference and pseudospectral methods, may further improve the computational efficiency and stability of the solution. The rational use of the Hilbert transform can restrain negative frequency growth and provide effective value for the development of wave propagation simulation technology. Our work is an important step forward in solving numerical simulations of strong attenuation. The stable forward modeling method proposed in this paper paves the way for more accurate subsurface imaging and provides a deeper understanding of the interaction among attenuation, dispersion, and numerical stability in complex media, thus driving innovation in geophysical exploration techniques.
5. Conclusions
Following the CQ wave propagation theory and Liu’s theory, we derived the time-domain constant-Q forward modeling equations from the frequency-domain equations by constructing an analytic signal. During the forward modeling process, we observed instability, which we identified as being caused by the reappearance of negative frequencies. By reapplying the Hilbert transform to eliminate the negative frequencies, we achieved stable solutions for the equations. The accuracy of the equations was validated through theoretical model tests, and their application to the Chimney Model produced ideal results when compared to the acoustic wave equation.
Compared with the traditional Standard Linear Solid (SLS) method, which is solvable via finite difference techniques, addressing these three complex wave equations (CWEs) poses greater challenges. The equation involving only attenuation can be tackled using spatial finite difference methods. In contrast, the remaining two equations necessitate employing the pseudo-spectral method within the wavenumber domain. We also noted that deriving the Q forward modeling equation solution from the solutions of the equations that only include attenuation and only include dispersion should be theoretically feasible. The equation that includes only dispersion does not require using complex-valued velocities, thereby avoiding instability issues. The equation that includes only attenuation does not contain , thus eliminating the need for Taylor expansion approximations. Future work can focus on further exploration in these areas.
Author Contributions
Conceptualization, S.D. and S.S.; methodology, S.D. and H.L.; software, S.S.; validation, H.L.; formal analysis, S.S.; data curation, H.L.; writing—original draft preparation, S.D.; writing—review and editing, S.S. and H.L.; visualization, S.S.; supervision, H.L.; project administration, H.L. All authors have read and agreed to the published version of the manuscript.
Funding
This work was supported by the National Natural Science Foundation of China under Grant 42374155, by the Laoshan Laboratory project (LSKJ202203405), and also by the Open Fund (Project Number:) of SINOPEC Key Laboratory of Geophysics.
Data Availability Statement
Data sharing does not apply to this article.
Conflicts of Interest
The authors declare no conflicts of interest.
References
- Futterman, W. Dispersion body waves. J. Geophys. Res. 1962, 67, 5279–5291. [Google Scholar] [CrossRef]
- Kjartansson, E. Constant Q-wave propagation and attenuation. J. Geophys. Res. 1979, 84, 4737–4748. [Google Scholar] [CrossRef]
- Aki, K.; Richards, P. Quantitative Seismology, 2nd ed.; University Science Books: Melville, NY, USA, 2002. [Google Scholar]
- Carcione, J.M. Wave Fields in Real Media: Theory and Numerical Simulation of Wave Propagation in Anisotropic, Anelastic, Porous and Electromagnetic Media; Elsevier: Amsterdam, The Netherlands, 2007. [Google Scholar]
- Zhang, Y.; Chen, T.; Zhu, H.; Liu, Y. A stable Q-compensated reverse-time migration method using a modified fractional viscoacoustic wave equation. Geophysics 2024, 89, S15–S29. [Google Scholar] [CrossRef]
- Xu, J.; Wang, R.; Zhang, Y. Research progress of seismic attenuation models. Prog. Geophys. 2024, 39, 525–541. [Google Scholar]
- Hale, D. An inverse Q-filter. Stanf. Explor. Proj. Rep. 1981, 28, 231–244. [Google Scholar]
- Hargreaves, N. Similarity and the inverse Q filter: Some simple algorithms for inverse Q filtering. Geophysics 1992, 57, 944–947. [Google Scholar] [CrossRef]
- Virieux, J.; Operto, S. An overview of full-waveform inversion in exploration geophysics. Geophysics 2009, 74, WCC1–WCC26. [Google Scholar] [CrossRef]
- Carcione, J.; Kosloff, D.; Kosloff, R. Wave propagation simulation in a linear viscoacoustic medium. Geophys. J. Int. 1988, 93, 393–401. [Google Scholar] [CrossRef]
- Robertsson, J.; Blanch, J.; Symes, W. Viscoelastic finite- difference modeling. Geophysics 1994, 59, 1444–1456. [Google Scholar] [CrossRef]
- Blanch, J.; Robertsson, J.; Symes, W. Modeling of a constant Q: Methodology and algorithm for an efficient and optimally inexpensive viscoelastic technique. Geophysics 1995, 60, 176–184. [Google Scholar] [CrossRef]
- Emmerich, H.; Korn, M. Incorporation of attenuation into time- domain computations of seismic wave fields. Geophysics 1987, 52, 1252–1264. [Google Scholar] [CrossRef]
- Zhu, T.; Carcione, J.; Harris, J. Approximating constant-Q seismic propagation in the time domain. Geophys. Prospect. 2013, 61, 931–940. [Google Scholar] [CrossRef]
- Carcione, J.; Cavallini, F.; Mainardi, F.; Hanyga, A. Time-domain modeling of constant-Q seismic waves using fractional derivatives. Pure Appl. Geophys. 2002, 159, 1719–1736. [Google Scholar] [CrossRef]
- Zhu, T.; Carcione, J. Theory and modelling of constant-Q P- and S-waves using fractional spatial derivatives. Geophys. J. Int. 2014, 196, 1787–1795. [Google Scholar] [CrossRef]
- Zhu, T.; Harris, J. Modeling acoustic wave propagation in heterogeneous attenuating media using decoupled fractional Laplacians. Geophysics 2014, 79, T105–T116. [Google Scholar] [CrossRef]
- Yao, J.; Zhu, T.; Hussain, F. Locally solving fractional Laplacian viscoacoustic wave equation using Hermite distributed approximating functional method. Geophysics 2017, 82, T59–T67. [Google Scholar] [CrossRef]
- Li, Q.; Zhou, H.; Zhang, Q. Efficient reverse time migration based on fractional Laplacian viscoacoustic wave equation. Geophys. J. Int. 2016, 204, 488–504. [Google Scholar] [CrossRef]
- Aki, K.; Richards, P. Quantitative Seismology, 1st ed.; University Science Books: Melville, NY, USA, 1980. [Google Scholar]
- Operto, S.; Virieux, J.; Amestoy, P.; L’Excellent, J.; Giraud, L.; Ali, H. 3D finite-difference frequency-domain modeling of vis-coacoustic wave propagation using a massively parallel direct solver: A feasibility study. Geophysics 2007, 72, SM195–SM211. [Google Scholar] [CrossRef]
- Mu, X.; Huang, J.; Wen, L.; Zhuang, S. Modeling viscoacoustic wave propagation using a new spatial variable order fractional Laplacian wave equation. Geophysics 2021, 86, T487–T507. [Google Scholar] [CrossRef]
- Carcione, J. Theory and modeling of constant-Q P- and S-waves using fractional time derivatives. Geophysics 2009, 74, T1–T11. [Google Scholar] [CrossRef]
- Zhu, T. Numerical simulation of seismic wave propagation in viscoelastic-anisotropic media using frequency-independent Q wave equation. Geophysics 2017, 82, WA1–WA10. [Google Scholar] [CrossRef]
- Chen, H.; Zhou, H.; Rao, Y. Constant-Q wave propagation and compensation by pseudo-spectral time-domain methods. Comput. Geosci. 2021, 155, 104861. [Google Scholar] [CrossRef]
- Fathalian, A.; Trad, D.; Innanen, K. An approach for attenuation-compensating multidimensional constant-Q viscoacoustic reverse time migration. Geophysics 2020, 85, S33–S46. [Google Scholar] [CrossRef]
- Chen, H.; Zhou, H.; Rao, Y. An implicit stabilization strategy for Q-compensated reverse time migration. Geophysics 2020, 85, S169–S183. [Google Scholar] [CrossRef]
- Sun, J.; Zhu, T. Strategies for stable attenuation compensation in reverse-time migration. Geophys. Prospect. 2018, 66, 498–511. [Google Scholar] [CrossRef]
- Xing, G.; Zhu, T. Modeling frequency-independent Q viscoacoustic wave propagation in heterogeneous media. J. Geophys. Res. Solid Earth 2019, 124, 11568–11584. [Google Scholar] [CrossRef]
- Liu, H.; Luo, Y. An analytic signal-based accurate time-domain vis-coacoustic wave equation from the constant-Q theory. Geophysics 2021, 86, T117–T126. [Google Scholar] [CrossRef]
- Carcione, J. A generalization of the Fourier pseudospectral method. Geophysics 2010, 75, A53–A56. [Google Scholar] [CrossRef]
- Liu, H.; Luo, Y. Comparing four numerical stencils for elastic wave simulation. In SEG Technical Program Expanded Abstracts; Society of Exploration Geophysicists (SEG): Houston, TX, USA, 2019; pp. 3745–3749. [Google Scholar] [CrossRef]
- Liu, H.; Zhang, H. Reducing computation cost by Lax-Wendroff methods with fourth-order temporal accuracy. Geophysics 2019, 84, T109–T119. [Google Scholar] [CrossRef]
Disclaimer/Publisher’s Note: The statements, opinions and data contained in all publications are solely those of the individual author(s) and contributor(s) and not of MDPI and/or the editor(s). MDPI and/or the editor(s) disclaim responsibility for any injury to people or property resulting from any ideas, methods, instructions or products referred to in the content. |
© 2024 by the authors. Licensee MDPI, Basel, Switzerland. This article is an open access article distributed under the terms and conditions of the Creative Commons Attribution (CC BY) license (https://creativecommons.org/licenses/by/4.0/).