Abstract
Marine shales from the Niutitang Formation and marine–continental transitional shales from the Longtan Formation are two sets of extremely important hydrocarbon source rocks in South China. In order to quantitatively compare the pore complexity characteristics between marine and marine–continental transitional shales, the shale and kerogen of the Niutitang Formation and the Longtan Formation are taken as our research subjects. Based on organic petrology, geochemistry, and low-temperature gas adsorption analyses, the fractal dimension of their pores is calculated by the Frenkel–Halsey–Hill (FHH) and Sierpinski models, and the influences of total organic carbon (TOC), vitrinite reflectance (Ro), and mineral composition on the pore fractals of the shale and kerogen are discussed. Our results show the following: (1) Marine shale predominantly has wedge-shaped and slit pores, while marine–continental transitional shale has inkpot-shaped and slit pores. (2) Cylindrical pores are common in organic matter of both shale types, with marine shale having a greater gas storage space (CRV) from organic matter pores, while marine–continental transitional shale relies more on inorganic pores, especially interlayer clay mineral pores, for gas storage due to their large specific surface area and high adsorption capacity (CRA). (3) The fractal characteristics of marine and marine–continental transitional shale pores are influenced differently. In marine shale, TOC positively correlates with fractal dimensions, while in marine–continental shale, Ro and clay minerals have a stronger influence. Ro is the primary factor affecting organic matter pore complexity. (4) Our two pore fractal models show that the complexity of the shale in the Longtan Formation surpasses that of the shale in the Niutitang Formation, and type I kerogen has more complex organic matter pores than type III, aiding in evaluating pore connectivity and flow effectiveness in shale reservoirs.
1. Introduction
Shale gas refers to natural gas existing in mud shale in adsorbed, free, and dissolved states, etc. It is a large-scale, continuous, and low-abundance unconventional oil and gas resource [1,2,3]. According to different sedimentary environments, shale can be divided into marine shale, marine–continental transitional shale, and continental shale [4,5]. At present, the Sichuan Basin and its surrounding marine shale have been utilized for stable industrial gas flow, and the development and utilization of marine shale have resulted in a strategic breakthrough [6,7,8]. The production of shales in the Wufeng–Longmaxi Formation in Luzhou, Changning, the Weiyuan and Fuling areas of the Sichuan Basin, and the Niutitang Formation in Zheng, an area of Northern Guizhou, has achieved commercial breakthroughs and scale-effective development. However, the geological research of marine–continental transitional shale is still in its infancy, and no systematic research on oil and gas has been carried out.
Guizhou is located in South China on the periphery of the Sichuan Basin and has experienced multiple tectonic movements and sedimentary environment changes. From the Sinian to the Middle Triassic period, its sedimentary rocks were marine sediments dominated by carbonates. In the Upper Triassic period, its marine–continental transitional sediments were transformed from a shallow sea platform to an inland lake basin. From the Jurassic to the Tertiary period, its sedimentary rocks were a set of continental sediments dominated by clastic rocks. Therefore, Guizhou has developed a set of thick sedimentary rocks and formed multiple sets of source–reservoir–cap rock assemblages in the vertical direction. The marine Niutitang Formation and the marine–continental transitional Longtan Formation are considered to be shale gas strata with development potential [9,10,11]. However, in the geological tectonic stage of the collision between the Pacific and the Indian Plate, the Qinghai–Tibet Plateau began to rise sharply, resulting in the formation of the Yunnan–Guizhou Plateau and a large number of folded mountains. The complex pore storage space in shale gas formations is a result of intense structural evolution and substantial heterogeneity. Determining the exact location and associated conditions for shale gas enrichment poses considerable challenges due to these complexities [12,13,14].
The evaluation methods for pore structure characteristics are diverse, with commonly used ones including image analyses (scanning electron microscopy and image analysis software), experimental techniques (high-pressure mercury intrusion, low-temperature nitrogen adsorption, carbon dioxide adsorption, and small-angle scattering), and geometric fractal methods (the Menger model, Sierpinski model, BET fractal model, FHH fractal model, thermodynamic fractal model, and Langmuir fractal model, etc.). The fractal dimension is an important aspect of geometric fractals and is often utilized to describe the complexity and heterogeneity of solid material pore structures. However, different methods characterize pore diameter distributions differently. Reference [15], based on low-to-medium-grade structural coal, combined with high-pressure mercury intrusion and low-temperature nitrogen adsorption experiments, discussed the applicability of the Menger model, Sierpinski model, FHH fractal model, and thermodynamic fractal model. The authors concluded that the Menger model is not suitable for characterizing the heterogeneity of structural coal pores, the Sierpinski model is suitable for describing the nanoscale pore fractal characteristics of structural coal, and the FHH fractal model is suitable for characterizing the heterogeneity of pores in primary coal and structural coal with pore sizes of 8–100 nm. Reference [16] studied the Longmaxi Formation and Niutitang Formation shales in the southern marine areas of China, using a combination of micro-pore fractal models and FHH fractal models to calculate the fractal dimensions of their pores, and discussed the applicability of the two methods. The authors found that the micro-pore fractal model is suitable for calculating carbon dioxide adsorption data and effectively characterizes the fractal dimensions of shale micropores, while the FHH fractal model is suitable for calculating high-pressure nitrogen adsorption data and effectively characterizes the fractal dimensions of shale mesopores. To summarize previous research on the fractal dimension theory, the use of the Sierpinski model is mostly concentrated in coal and rock formations, with relatively less research on the fractal dimension of shale pore structures based on carbon dioxide adsorption experiments using the Sierpinski model.
Therefore, this study explores the development characteristics of pores in the marine shales of the Niutitang Formation and the transitional marine–continental shales of the Longtan Formation in Guizhou through nitrogen adsorption and carbon dioxide adsorption experiments. We use the FHH model and the Sierpinski model to reveal the complexity of shale and organic matter pores of different sizes and their main influencing factors. Establishing a model to explore the development of pores in the marine shales in the Niutitang Formation and the transitional marine–continental shales and organic matter in the Longtan Formation will help us predict the production of shale gas in Guizhou more accurately and optimize development strategies.
2. Samples and Methods
2.1. Samples and Preparation
In this study, 13 samples were prepared, which were taken from the black shale of the Niutitang Formation in Northern Guizhou and the black shale of the Longtan Formation in Western Guizhou (Figure 1). Among them, 2 samples of Niutitang Formation black shale belonged to platform sedimentary environment and 4 samples from slope sedimentary environment. Seven samples of the Longtan Formation black shale were from the Dahebian syncline structure, representing a transitional marine–continental depositional environment. This type of black shale is typically associated with coal and is also known as coal-bearing shale. Due to their diverse depositional environments and depths, these samples exhibit variations in mineral composition, total organic carbon (TOC) content, and organic matter maturity levels. This allows for a comprehensive analysis of shale gas occurrence states in marine and transitional marine–continental shale formations as well as an exploration of the factors controlling pore structure complexity. Consequently, prior to studying shale and organic matter’s pore structures, all black shale samples underwent detailed organic geochemical characterization and mineral composition analyses, including TOC, thermal maturity, whole-rock, and clay mineral analyses.
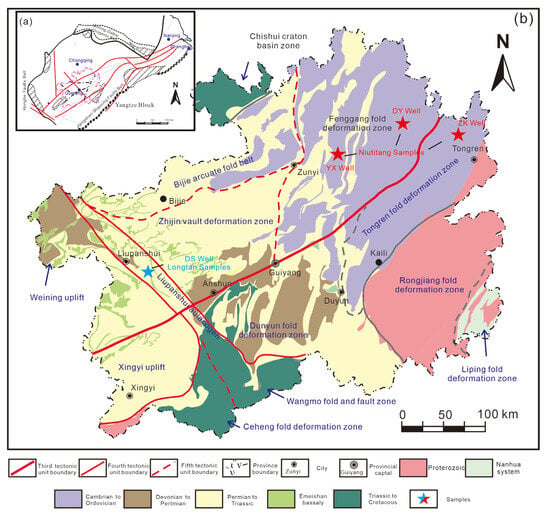
Figure 1.
Geological setting. (a) Regional location of the Upper Yangtze Platform; and (b) a geological map of Guizhou Province, showing its tectonic zones.
Organic matter is usually formed by diagenesis at the same time as shale and evolves into solid kerogen and secondary organic matter in the late diagenetic stage. The main parent material of organic matter is kerogen. In order to study the characteristics of pore development of organic matter and explore the relationship between kerogen pores and shale pores, we isolated kerogen from shale according to National Standard GB/T 19144-2010 [17]. The operation aimed to remove Al2O3, CaO, and MgO from the shale by two acid treatments, followed by the removal of the modern sediment formed after the acid treatment by NaOH. At this point, there was still pyrite in the black shale, which was removed by zinc and HCL. Finally, the experimental sample was mixed with heavy liquid (mixture of hydrogen chloride, potassium iodide, and glacial acetic acid with a relative density of 2.01~2.10 g/mL) and centrifuged to separate kerogen. Kerogen can be purified by chloroform treatment of isolated kerogen.
2.2. Field Emission Scanning Electron Microscopy (FE-SEM)
The pore development characteristics of organic matter in black shale were qualitatively observed by field emission scanning electron microscopy (FE-SEM). The experimental instrument was ZEISS SIGMA field emission scanning electron microscope, under which microscopic images magnified 20,000~100,000 times could be observed. Before the experiment, some of the samples were ion polished using argon to remove impurities and form a smooth two-dimensional plane.
2.3. Low-Pressure Gas (N2 and CO2) Adsorption
For the analysis of black samples and kerogen samples, we conducted low-pressure N2 and CO2 adsorption experiments using the Micromeritics ASAP 2460 automatic specific surface area and pore size analyzer. The N2 adsorption experiment focused on identifying pores ranging from 1.7 to 300 nm through monolayer adsorption. On the other hand, the CO2 adsorption experiment aimed to identify pores ranging from 0.35 to 1.5 nm through double-layer adsorption [18,19]. Based on the results obtained from nitrogen adsorption experiments, we utilized the Brunauer–Emmet–Teller (BET) theory and BJH model to calculate parameters such as pore size distribution, specific surface area, and pore volume. To further analyze carbon dioxide adsorption, we employed density functional theory (DFT) to calculate micropore volume and micropore specific surface area [20,21,22,23,24].
2.4. Fractal Theory
2.4.1. Frenkel–Halsey–Hill (FHH) Model
Based on low-temperature N2 adsorption, fractal models primarily include the BET model, Langmuir model, Frenkel–Halsey–Hill (FHH) model, and thermodynamic methods. Among these, the FHH model has been widely used for analyzing dimensionality in porous media materials. The fractal theory for low-temperature N2 adsorption in porous media was initially proposed by Pfeifer and Avnir in 1983 [25,26]. This theory suggests that the pore fractal dimension D can be used to characterize the complexity and heterogeneity of porous material pore structures, typically ranging between 2 and 3, where 2 indicates smooth planes and 3 indicates free space. Therefore, when D approaches 2, the pore structure in porous media tends to be simple with low surface roughness, while as D approaches 3, the pore structure becomes more complex. Shale, similar to porous materials, also exhibits typical fractal characteristics in its pore structure [27].
Previous studies have shown that the Pfeifer-corrected FHH model can effectively characterize the pore fractal dimension of shale and kerogen based on nitrogen adsorption experimental results, with a relatively high fractal dimension fitting degree (R2 exceeding 0.90), reflecting high levels of pore structure heterogeneity and complexity [14,28,29]. Thus, this study similarly opts for the Pfeifer-corrected FHH fractal model to calculate pore fractal dimensions, aiming to explore the pore structure characteristics of shale and kerogen, as shown below:
where P is the equilibrium pressure, MPa; V is the adsorption volume at equilibrium pressure P; P0 is the saturated steam pressure, MPa; C is a constant; and K is the slope of the fitted line. In this study, it was observed that the adsorption curve and desorption curve of the N2 adsorption/desorption experiment did not coincide. Hysteresis loops were observed at a relative pressure of 0.45, indicating the presence of capillary condensation during the nitrogen adsorption process. Consequently, the fractal dimension of the nitrogen adsorption was calculated using the equation D = K + 3.
2.4.2. Sierpinski Model
It is worth noting that the FHH fractal model, considering multi-layer adsorption and capillary condensation effects, is mainly suitable for calculating fractal dimensions within the mesopore range. Errors were consistently found when applying the FHH model to calculate carbon dioxide adsorption experimental data, indicating that the FHH model based on uniform plate-like molecular layer adsorption is not suitable for calculating the fractal dimensions of micropores (less than 1.5 nm) [29]. In micropores, adsorbate molecules typically undergo pore filling, a process distinct from adsorption behavior under mesoporous conditions. Additionally, there is diffusion resistance for liquid N2 molecules entering micropores at experimental temperatures. Therefore, the applicability of the FHH fractal model is limited, and the model for calculating micropore fractal dimensions should differ from that of mesopores. Considering the existence of micropore filling in CO2 (273 K) adsorption, a model based on Sierpinski fractal theory was applied by recursively describing the embedding of typical fractal volumes in three-dimensional space relative to their characteristic lengths in the Sierpinski set, as shown below [30,31,32]:
where L is length of the yardstick, m; D is volume fractal dimension; and V is the adsorption volume at equilibrium pressure P, mL.
Angulo et al. argued that fluid filling processes, such as mercury intrusion and micropore filling in CO2 (273 K) adsorption, do not follow a box counting process and adjusted Formula (2) to relate volume to pressure as shown below:
where Pt is the threshold pressure. For CO2 adsorption at 273 K, the pressure of the first point in the adsorption isotherm was regarded as Pt, MPa. D is the volume fractal dimension. When P is very close to or above Pt, V is the adsorption volume at equilibrium pressure P, mL. Here, if we apply logarithms to both sides of Equation (3), we obtain the following:
from which D can be readily derived through the physisorption data.
2.5. Calculation Method of Organic Pore Contribution
Organic matter pores are a distinct type of intergranular pore. In this paper, a calculation method (CRV and CRA) for the contribution rates of specific surface area and pore volume of organic matter is proposed. The CRV formula equation is expressed as follows:
where Vorg is the pore volume of 1.0 g of kerogen, Vshl is the pore volume of 1.0 g of black shale, TOC is the total organic carbon content of black shale, and C1 is the pore volume constant of the shale.
Shale pore development exhibits significant heterogeneity, which varies across different formations. Therefore, we suggest that the constant value (C1) representing the pore characteristics of each formation is essential for analyzing the contribution rate of organic matter pores. The calculation is predominantly contingent on data gathered from prior research, encompassing the average pore volume, average TOC content, and average organic matter pore volume of black shale in the target formation [10,33,34,35,36,37,38,39]. These parameters serve as correction constants (C1) in the study as shown below:
where is the average shale pore volume, is the average organic matter pore volume rate, and is the average organic matter pore volume.
In addition, the contribution rate of the organic matter pore surface area (CRA) of the black shale is expressed as follows:
where Sorg is the pore surface area of 1.0 g of kerogen, Sshl is the pore surface area of 1.0 g of black shale, TOC is the total organic carbon content of the black shale, and C2 is a correction constant.
C2 has a similar meaning to C1. The formula equation of C2 is expressed as follows:
where is the average specific surface area of black shale, is the average specific surface area ratio of organic matter, and is the average specific surface area of organic matter.
3. Results
3.1. Organic Geochemistry and Mineralogical Composition
3.1.1. TOC Content
The TOC can better reflect the hydrocarbon generation capacity of shale and affects the occurrence state and gas content of hydrocarbon gases [40]. The TOC content of the Niutitang Formation shale ranges from 1.0 wt% to 10.0 wt%, with an average of 6.0 wt%. The TOC content of the Longtan Formation shale ranges from 1.2 wt% to 11.3 wt%, with an average of 5.3 wt% (Table 1). According to the classification and evaluation standard of the organic matter abundance of source rocks, it can be judged that the Niutitang and Longtan Formation shales are mainly “good-best” source rocks when only using the TOC index. These indicate that the shale samples of the Niutitang Formation and Longtan Formation are rich in organic matter.

Table 1.
TOC content, Ro, kerogen type, mineralogical composition, and clay mineral content of the shales from the Niutitang Formation and Longtan Formation.
3.1.2. Thermal Maturity
Organic matter undergoes irreversible maturation evolution after deposition, resulting in variations in the occurrence form and structural characteristics of the same type of organic matter at different stages of evolution (the immature stage, mature stage, highly mature stage, and over-mature stage) [41]. The Niutitang Formation samples have an Ro range of 2.40% to 4.10%, with an average of 3.10%, indicating high maturity to over-maturity and passage through the gas window. The Longtan shale has an Ro range of 0.68% to 0.95%, with an average of 0.83%, suggesting that it is in the mature stage and has reached the gas window threshold [42,43].
3.1.3. Mineralogical Composition
Shale minerals were subjected to an XRD analysis, and the results are presented in Table 1. The dominant mineral components of the Niutitang Formation shale consist of quartz and clay minerals, accounting for over 50% of the total mineral composition. The high proportions of clay minerals and quartz in the Niutitang Formation shale suggest that sedimentation processes are primarily influenced by terrigenous clastic, biological, or hydrothermal deposition mechanisms. On the other hand, the Longtan Formation shale predominantly contains high levels of clay minerals, indicating the significant influence of terrigenous detritus during deposition [44]. The mineral compositions within the Longtan Formation shale display significant variability (Figure 2), which is particularly evident when looking at the presence of carbonate minerals and pyrite. This reflects a marine–continental transitional deposition environment in the Longtan Formation characterized by frequent water turbulence. The depositional setting was mainly composed of deltaic deposits, tidal flats, and lagoon sediments, resulting in varying shale mineral compositions [10]. According to the ternary mineral classification (Figure 2), DY-1, DS-4, and DS-6 belong to siliceous-rich clay shale (SRCS). DY-2, ZK-2, and DS-5 belong to clay-rich silicon shale (CRSS). YX-2 and DS-1 belong to silicon shale (SS). YX-1 and ZK-1 belong to a clay/silicon shale mixture (CSSM). DS-2 belongs to calcium-rich clay shale (CRCS). DS-3 belongs to clay shale (CS). DS-7 belongs to a silicon/calcium shale mixture (SCSM).
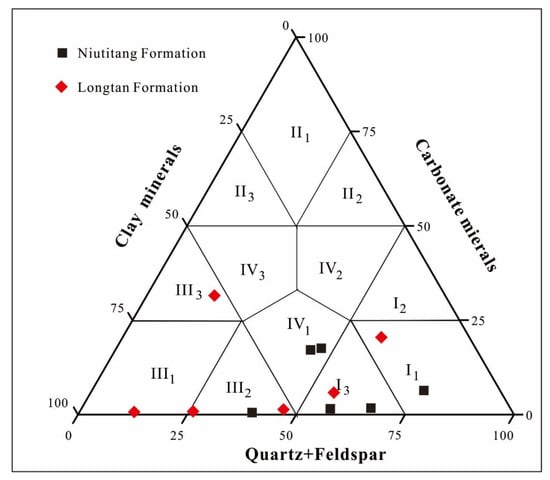
Figure 2.
Ternary diagram of mineral composition and classification.
3.2. Pore Morphology and Types
3.2.1. Inorganic Pores
The inorganic pores present in the marine shale and marine–continental transitional shale primarily consist of pyrite intergranular pores, clay mineral interlaminar pores, dissolution pores, etc. (Figure 3a–f and Figure 4a–f). Among these, the most prevalent are the interlaminar pores formed by disordered sheets, slits, or wedges of clay minerals that are susceptible to deformation or closure due to external compression. The strawberry-shaped intergranular pores of pyrite were observed through an FE-SEM analysis. Pyrite dissolution resulted in the formation of dissolution pores which were subsequently filled by clay minerals within the intergranular spaces. While clay minerals contribute a significant number of pore spaces, their high abundance can also impede shale porosity development. Dissolution pores are associated with interactions between organic acids and minerals in coal measure shales; feldspar is commonly dissolved along with quartz, calcite, and pyrite, exhibiting dissolved pore structures. Therefore, in FE-SEM images, it can be observed that inorganic pores exhibit a multitude of pore types, revealing the intricate nature of their pore structure.
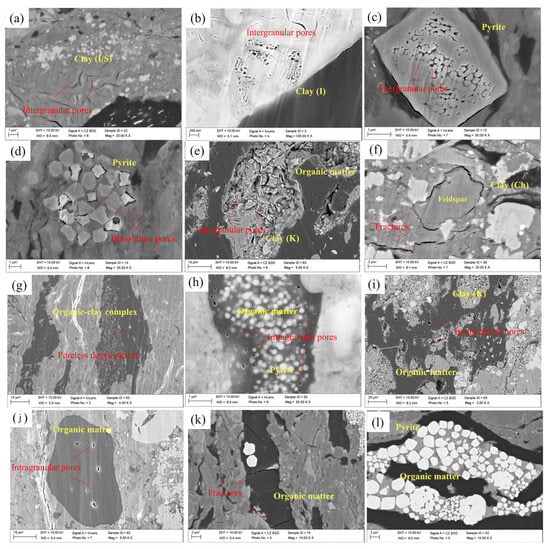
Figure 3.
The mineral composition, organic matter morphology, and pore development of Longtan Formation shale under FE-SEM. (a) Intergranular pores of illite–montmorillonite mixed layer, Longtan Formation. (b) Intergranular pores of illite, Longtan Formation. (c) Intergranular pores of pyrite, Longtan Formation. (d) Dissolution pores of pyrite, Longtan Formation. (e) Intergranular pores of kaolinite, Longtan Formation. (f) Fractures of feldspar and intergranular pores of chlorite, Longtan Formation. (g) Organic-clay complex with undeveloped pores, Longtan Formation. (h) Organic-pyrite complex with intragranular pore development. Longtan Formation. (i) Organic-clay complex developed in intragranular pores, Longtan Formation. (j) Intragranular pores of organic matter, Longtan Formation. (k) Fractures of organic matter, Longtan Formation. (l) Banded organic matter wraps pyrite, Longtan Formation.
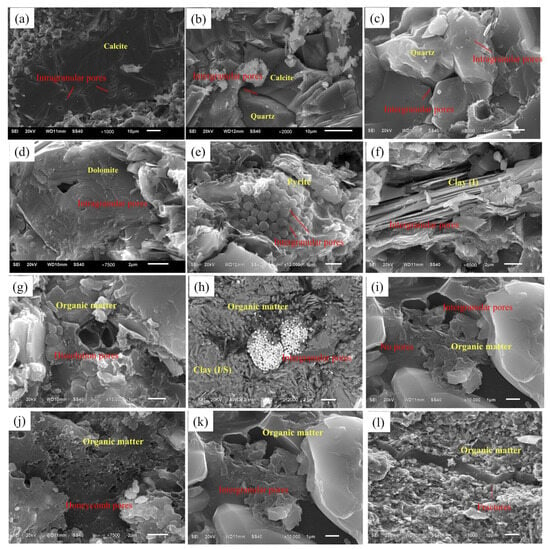
Figure 4.
The mineral composition, organic matter morphology, and pore development of Niutitang Formation shale under FE-SEM. (a) Intragranular pores of calcite, Niutitang Formation. (b) Intergranular pores of quartz and calcite, Niutitang Formation. (c) Intergranular and intragranular pores of quartz, Niutitang Formation. (d) Dissolution pores of dolomite, Niutitang Formation. (e) Intergranular pores of pyrite. (f) Intergranular pores of illite, Niutitang Formation. (g) Dissolution pores of organic matter, Niutitang Formation. (h) Organic-clay-pyrite complex with interparticle pores development. Niutitang Formation. (i) Intragranular pores are partially developed in organic matter, Niutitang Formation. (j) Honeycomb pores of organic matter, Niutitang Formation. (k) Intergranular pores of organic matter, Niutitang Formation. (l) Banded organic matter developed fractures, Niutitang Formation.
3.2.2. Organic Matter Pores
Developments in the shape, size, and number of organic matter pores can be effectively observed under FE-SEM. Organic matter pores are the most widely developed pore type in marine organic-rich shale [45,46]. However, the development of organic matter pores in marine–continental transitional shales is suboptimal.
FE-SEM revealed that the pore development of organic matter varied among the different occurrence types (Figure 3g–l and Figure 4g–l). Despite similar TOC contents in the Niutitang Formation shale and the Longtan Formation shale, the number of organic matter pores in the Niutitang Formation shale is significantly greater than that in the Longtan Formation shale [10]. The sapropelic kerogen macerals from the Niutitang Formation primarily consist of 72.00~89.70%, with an average content of 81.45%. Only a few samples contain inertinite, implying that lower aquatic organisms with algae as their primary source contribute mainly to the organic matter composition, while higher plants make up only a small portion. Type I kerogen is predominant in the Niutitang Formation. Our maceral composition analysis reveals that vitrinite constitutes most (76.80~91.00%) of the Longtan Formation shale’s macerals; however, there is a relatively low content of inertinite (4.69~15.55%) and exinite (2.06~10.94%), respectively. These results indicate that the Longtan Formation shale predominantly consists of type III kerogen. Different types of organic matter reflect distinct sedimentary environments, determining their maceral compositions [47,48].
Therefore, this discrepancy may be attributed to type III kerogen having fewer pores present in the Longtan Formation’s organic-rich shale compared to type I kerogen [49]. Additionally, the lower thermal maturity (0.68% < Ro < 0.95%) of the Longtan Formation’s organic matter relative to that of the Niutitang Formation (2.40% < Ro < 4.10%) contributes to differences in their respective pore developments. In addition, elliptical and slit pores are the predominant pore types formed by organic matter, characterized by a relatively complicated pore structure. Typically, these pores originate from hydrocarbon production channels and the self-condensation of organic matter itself.
3.3. Quantitative Characteristics of Pore Development
3.3.1. The Low-Pressure N2 Adsorption Analysis
An adsorption analysis of low-pressure gas (N2/CO2) can effectively identify pores in organic-rich shale ranging from 0.35 to 300 nm. Additionally, the amount of gas adsorbed reflects the number of pores present and the complexity of the pores. Various classification schemes exist for pore size, and in this study, we primarily adopted the pore classification scheme proposed by The International Union of Pure and Applied Chemistry (IUPAC). According to this scheme, pores are categorized into three groups: micropores with diameters less than 2 nm, mesopores with diameters between 2 nm and 50 nm, and macropores with diameters exceeding 50 nm.
Figure 5 illustrates the N2 adsorption and desorption curve under low-pressure conditions. Based on the IUPAC’s N2 adsorption and desorption curve classification system, both the Niutitang Formation shale and Longtan Formation shale exhibit typical IV curves. In contrast, their kerogen curves differ significantly from those observed in the black shale samples; they resemble type II or type III curves. Hysteresis rings resulting from the non-coincidence between the adsorption/desorption curves are commonly observed in black shale and kerogen, providing insights into their pore morphologies [50].
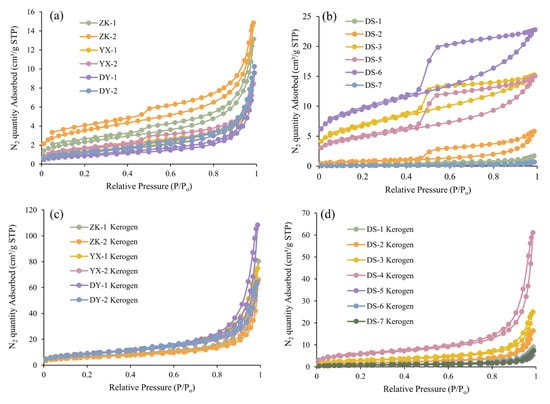
Figure 5.
Low-pressure gas N2 adsorption/desorption of the shales and the organic matter. (a) The marine Niutitang Formation shale. (b) The marine–continental transitional Longtan Formation shale. (c) The marine Niutitang Formation kerogen. (d) The marine–continental transitional Longtan Formation kerogen.
The IUPAC divides hysteretic loops into H1, H2, H3, and H4 types (Figure 6). Based on our N2 adsorption/desorption curve analysis, the pore morphology of the Niutitang Formation shale can be characterized as a combination of lamellar pores (H3 type) and slit holes (H4 type). Similarly, for the Longtan Formation shale samples, a mixture of ink-bottle-shaped pores (H2 type) and slit-shaped pores (H3 type) is observed. These findings highlight the complex nature of pore structures in both of these formations, indicating that a single classification cannot fully capture their morphological diversity. Notably, our examination under FE-SEM revealed further complexity in terms of pore types (Figure 3 and Figure 4). It is worth mentioning that the kerogen samples predominantly exhibited cylindrical pores followed by slit pores; however, only the YX-2 kerogen and DY-2 kerogen displayed hysteresis rings characteristic of H4-type behavior. This suggests that organic matter plays a significant role in shaping shale porosity with a higher adsorption capacity compared to inorganic components at equivalent masses.
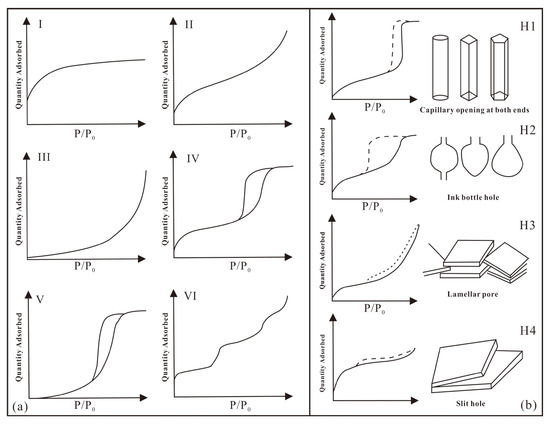
Figure 6.
Curve types of gas adsorption and pore morphology (modified for Sing., 1985 [51]). (a) Type of nitrogen adsorption curve. (b) Hysteresis loop and corresponding pore morphology.
Based on the N2 adsorption and desorption curves, the pore specific surface area and pore volume of the shale and kerogen were calculated using the BJH model [28]. The pore specific surface area of the Niutitang Formation shale ranges from 3.17 m2/g to 10.38 m2/g, with an average of 10.38 m2/g. The shale pore volume ranges from 0.0123 to 0.0222 cm3/g, with an average of 0.0161 cm3/g. The pore specific surface area of the Longtan Formation shale ranges from 0.86 to 29.27 m2/g, with an average value of 14.72 m2/g. The shale pore volume ranges from 0.0025 to 0.0351 cm3/g, with an average of 0.0202 cm3/g. The specific surface area of the Niutitang Formation kerogen pores ranges from 20.26 m2/g to 33.34 m2/g, with an average of 20.26 m2/g. The kerogen pore volume ranged from 0.0954 to ~0.1639 cm3/g, with an average of 0.1155 cm3/g. The specific surface area of the Longtan Formation kerogen pores ranges from 2.76 m2/g to 18.41 m2/g, with an average of 6.79 m2/g, and the volume of the kerogen pores ranges from 0.0077 cm3/g to 0.0916 cm3/g, with an average of 0.0311 cm3/g (Figure 7). The pore specific surface area and pore volume of the Longtan Formation shale are higher than those of the Niutitang Formation shale, and the pore specific surface area and pore volume of the Niutitang Formation kerogen are higher than those of the Longtan Formation kerogen. This shows that the inorganic pores of the Longtan Formation shale are more developed than those of the Niutitang Formation shale, and the organic matter pores of the Niutitang Formation are more developed.

Figure 7.
Pore specific surface area distribution/pore volume distribution of shale and organic matter based on N2 gas adsorption. (a) Pore specific surface area of shale and kerogen. (b) Pore volume of shale and kerogen.
3.3.2. The Low-Pressure CO2 Adsorption Analysis
CO2 adsorption can characterize the pore structure at 0.3~1.5 nm. Based on the BDDT classification scheme [21], the CO2 adsorption isotherms of the shale and kerogen samples from the Niutitang Formation and Longtan Formation all belong to type I (Figure 8). The CO2 adsorption capacity of the Longtan Formation shale is higher than that of the Niutitang Formation shale, indicating that the Longtan Formation shale has more micropores. The CO2 adsorption capacity of the Niutitang Formation kerogen is higher than that of the Longtan kerogen, indicating that the type I kerogen developed more micropores than the type III kerogen.
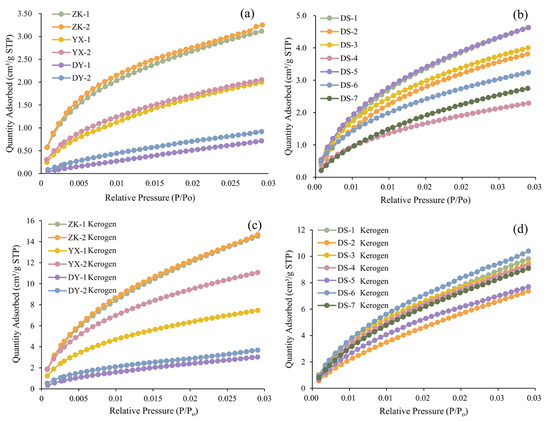
Figure 8.
Low-pressure CO2 adsorption curves of the black shales and the organic matter. (a) The marine Niutitang Formation shale. (b) The marine–continental transitional Longtan Formation shale. (c) The marine Niutitang Formation kerogen. (d) The marine–continental transitional Longtan Formation kerogen.
The specific surface area and volume of the micropores of the shale and kerogen were calculated using the DFT model [23,24]. The specific surface area of the micropores in the Niutitang Formation shale ranges from 1.10 to 12.67 m2/g, with an average of 7.11 m2/g, and the volume of the micropores ranges from 0.0004 to 0.0047 cm3/g, with an average of 0.0027 cm3/g. The specific surface area of the micropores in the Longtan Formation shale ranges from 8.76 to 18.29 m2/g, with an average of 14.23 m2/g, and the volume of the micropores ranges from 0.0046 to 0.0077 cm3/g, with an average of 0.0064 cm3/g. The specific surface area of the Niutitang Formation kerogen micropores ranges from 7.83 to 50.01 m2/g, with an average of 31.02 m2/g, and the micropore volume ranges from 0.0032 cm3/g to 0.0192 cm3/g, with an average of 0.0119 cm3/g. The specific surface area of the Longtan Formation kerogen micropores ranges from 19.65 to 30.94 m2/g, with an average of 26.43 m2/g, and the micropore volume ranges from 0.0067 to 0.0116 cm3/g, with an average of 0.0101 cm3/g (Figure 9). Similarly, in terms of micropores, the micropore specific surface area and pore volume of the Longtan Formation shale are higher than those of the Niutitang Formation shale, while those of the Niutitang kerogen are higher than those of the Longtan kerogen. This shows that the Longtan Formation shale pores are more developed, and the organic matter pores are mainly micropores.
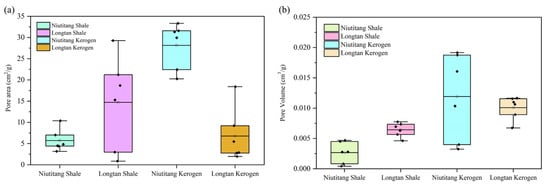
Figure 9.
Specific surface area distribution/pore volume distribution of shale and organic matter based on CO2 gas adsorption. (a) Pore specific surface area of shale and kerogen. (b) Pore volume of shale and kerogen.
3.4. Fractal Dimension Characteristics
By analyzing N2 and CO2 adsorption data, we obtained insights into the pore adsorption properties of these shales. The results indicate distinct differences between the shale pores in the Niutitang Formation and those in the Longtan Formation, with a higher level of porosity observed in the latter while an enhanced development of organic matter pores was evident in the former. Therefore, we employ the FHH model and the Sierpinski model to investigate the structural characteristics of the shale and kerogen pores in marine and transitional marine–continental facies, aiming to elucidate the primary factors controlling pore development.
3.4.1. Fractal Dimensions Calculated from the N2 Adsorption
In order to enhance our understanding of pore development complexity in the Niutang and Longtan Formations, extensive investigations have been conducted on the pores of shale and kerogen above the mesopore range. These studies have involved the calculation of the fractal dimension using Formula (1) and the examination of N2 adsorption/desorption results to assess the complexity of shale and kerogen mesopores.
Curve fitting for the N2 adsorption fractal dimension characteristics is shown in Figure 10a–d, yielding an excellent correlation coefficient (R2) ranging from 0.9845 to 0.9992, showing a strong fit between them. The fractal dimensions are mainly categorized into D1 and D2 types, reflecting two different adsorption characteristics. Fractal dimension D1 primarily represents the low-pressure region fractality (P/P0 < 0.45), reflecting the van der Waals force phenomenon of monolayer adsorption in micropores with diameters smaller than 3 nm and dominated by adsorption pores containing adsorbed gas. Fractal dimension D2 corresponds to the mid- to high-pressure region fractality (P/P0 > 0.45), indicating the spatial complexity and irregularity of mesopores and macropores with diameters larger than 3 nm, mainly composed of flow-through pores containing free gas [52].
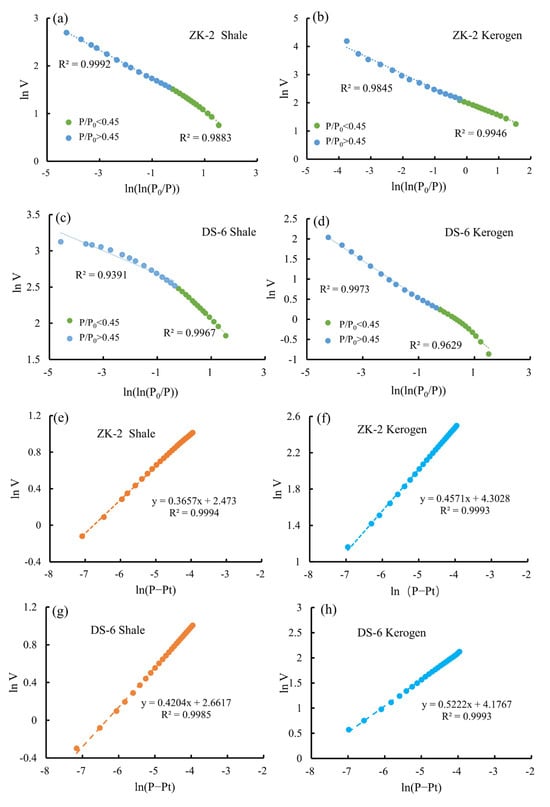
Figure 10.
Fractal characteristics of the pore structure from the shales and the organic matter based on N2 adsorption experiments. (a) Fractal dimensions of ZK-2 Shale based on the FHH model. (b) Fractal dimensions of ZK-2 Kerogen based on the FHH model. (c) Fractal dimensions of DS-6 Shale based on the FHH model. (d) Fractal dimensions of DS-6 Kerogen based on the FHH model. (e) Fractal dimensions of ZK-2 Shale based on the Sierpinski model. (f) Fractal dimensions of ZK-2 Kerogen based on the Sierpinski model. (g) Fractal dimensions of DS-6 Shale based on the Sierpinski model. (h) Fractal dimensions of DS-6 Kerogen based on the Sierpinski model.
Our calculation results show the following: The fractal dimension D1 of the Longtan Formation shale is observed to be higher than that of the Niutitang Formation shale, while the fractal dimension D2 of the Longtan Formation shale is lower than that of the Niutitang Formation shale (Table 2). This suggests a greater complexity in the micropores within the Longtan Formation compared to that of those within the Niutitang Formation and a higher complexity in mesopore development within the Niutitang Formation relative to that of the Longtan Formation. These findings further highlight differences in the evolution of pore characteristics between marine shales and marine–continental transitional shales. For kerogen, it is noted that both fractal dimensions D1 and D2 are higher for the Niutitang Formation kerogen compared to the Longtan Formation kerogen; however, this difference is not substantial, possibly due to variations caused by the low level of maturity in the Longtan Formation and the high level of maturity in the Niutitang Formation impacting organic matter pore development.

Table 2.
Fractal dimensions based on the N2 adsorption results of the shales and the organic matter.
3.4.2. Fractal Dimensions Calculated from the CO2 Adsorption
We calculated the pore fractal dimension under CO2 adsorption using Formula (4) to investigate the pore complexity of the shale and organic matter micropores. Curve fitting for the CO2 adsorption fractal dimension characteristics is shown in Figure 10e–h, yielding an excellent correlation coefficient (R2) ranging from 0.9920 to 0.9996, showing a strong fit between them. The obtained fractal dimension (Dm) values ranged between 2 and 3, suggesting varying levels of complexity in the micropores present in each sample. The similar Dm values observed for the Niutitang Formation and Longtan Formation shales imply a comparable degree of complexity in the micropores across different shale types. However, it is worth noting that the Dm value for kerogen in the Niutitang Formation group was higher compared to that in the Longtan Formation group. This discrepancy indicates that different types of kerogen exhibit diverse micropore complexities, with Type I kerogen displaying a higher level of complexity than Type III kerogen (Table 2).
Shale pores exhibit higher fractal dimensions than those of kerogen pores as they encompass various types within shale pore systems, including the intergranular pores associated with organic matter. Additionally, different mineral composition types may lead to distinct pore types and quantities within shale pore systems, which is particularly evident when examining the marine Niutitang Formation shales and marine–continental transitional Longtan Formation shales, in which their varying sedimentary facies result in differences in mineral composition, thereby influencing shale pore development.
4. Discussion
4.1. Contribution Rate of Organic Matter Pores to Shale Pore System
To investigate the contribution of organic matter pores in the shale pore system, calculations were made based on the previously described method for assessing the contribution of organic matter pores. This allowed for the determination of the contribution rates of organic matter pores in shale under different depositional environments.
According to Formula (6) and previous studies data, the C1 constants of the Niutitang Formation shale and the Longtan Formation shale are 0.93 and 1.13, respectively.
After applying Formula (5) to the gas adsorption data (Figure 11a,b), our results are as follows: the CRV value of the shale in the Niutitang Formation ranges from 6.38% to 60.91%, with an average of 36.08%; and the CRV value of the Longtan Formation shale ranges from 0.93% to 42.53%, with an average of 16.28%.
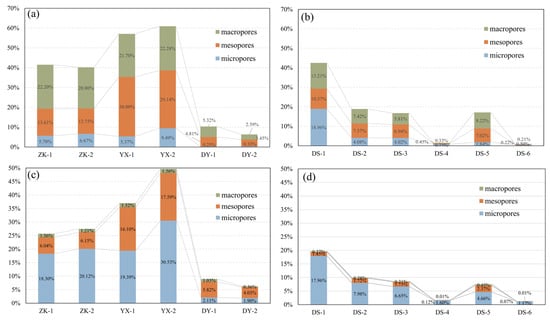
Figure 11.
Contribution rate of the organic matter pores to the pore volume (CRV) and contribution rate of organic matter pores to pore area (CRA). (a) CRV of Niutitang Formation. (b) CRV of Longtan Formation. (c) CRA of Niutitang Formation. (d) CRA of Longtan Formation.
According to Formula (8), the C2 correction constant of the Niutitang Formation and Longtan Formation is 0.9301. After applying Formula (7) to the pore specific surface area data measured by gas adsorption, the calculated CRA result is as follows: the CRA value of the Niutitang Formation is between 6.29% and 49.68%, with an average of 36.08%; and the CRA value of the Longtan Formation ranges from 1.26% to 19.68%, with an average of 8.12%.
It is obvious from the calculated contribution rate of organic matter pores that the CRV and CRA values of the Niutitang Formation are significantly higher than those of the Longtan Formation (Figure 11). This indicates that the pores of type I and II kerogen are more developed than those of type III kerogen, so the proportion of type I and II kerogen in the shale pore system increases. At the same time, the contribution of organic pores is also different due to different levels of thermal evolution maturity and the strong heterogeneity of shale.
In order to further discuss the contributions of different organic matter pore sizes, the contribution of micropores, mesopores, and macropores are calculated according to the IUPAC pore partitioning scheme. In the Niutitang Formation, organic matter mesopores are the primary contributors to the shale pore volume, followed by macropores. Organic matter micropores are the main contributors to the specific surface area of the shale pores, followed by mesopores. In the Longtan Formation, organic matter with different pore sizes contributes significantly to the shale’s overall pore volume (Figure 11a,b). The micropore specific surface area of the Niutitang Formation accounts for a maximum of 30.53% of the total specific surface area, with an average of 15.39%. For the Longtan Formation, the maximum contribution to the specific surface area by micropores is 17.96%, with an average of 7.64%. This indicates that organic matter micropores are the primary contributors to the specific surface area of the pore systems in both sets of shales (Figure 11c,d).
The contribution of different organic matter pore sizes reflects both hydrocarbon generation and storage capacity in shale gas reservoirs [53,54]. Specifically, organic matter micropores provide a substantial amount of specific surface area and serve as numerous adsorption sites for gases [55,56,57]. This study reveals that most of the Niutitang Formation samples have an organic matter specific surface area occupying over one-third of total shale porosity, providing a significant amount of specific surface area for gas adsorption primarily through its micropores’ and mesopores’ networks. Conversely, the Longtan Formation shale, which is characterized by low-maturity marine–continental transitional conditions, shows relatively small specific surface areas within its organic matter pores due to the limited development of this type of formation environment. Pore connectivity plays a crucial role in fluid migration and natural gas development within shale reservoirs; thus, high-porosity connectivity is advantageous for improving natural gas production and recovery under favorable preservation conditions [58,59]. In the Niutitang Formation shale, organic matter contributes to a significant number of mesopores and macropores, accounting for more than 10% of the pore volume and providing ample space for shale gas storage. Although the specific surface area contribution from organic matter pores in the Longtan Formation is relatively small, certain samples from this formation (DS-1, DS-3, and DS-5) exhibit substantial contributions to the organic matter pore volume, indicating a good level of connectivity within these pores. Therefore, organic matter pores play a crucial role in the shale pore system. Building upon gas adsorption experiments and geochemical analyses, we further investigate the fractal characteristics of the shale pores and kerogen pores, as well as the controlling factors influencing pore complexity.
4.2. Effect of Organic Matter Characteristics on Fractal Dimension and Pore Structure
Previous studies have shown that mineral composition, TOC, thermal evolution maturity, and kerogen type are the main factors affecting pore characteristics [60,61]. However, the influence of organic matter pore structure needs to be further explored. In this study, by examining the influence of the main factors affecting the pore structure on the fractal dimension, we explore the relationship between the pore complexity of shale with different sedimentary facies and the main influencing factors.
4.2.1. Effect of TOC on Pore Complexity
The fractal dimension (D1, D2, and Dm) of the marine Niutitang Formation shale exhibits a positive correlation with the TOC, whereas the fractal dimension of the marine–continental transitional Longtan Formation shale demonstrates a negative correlation with the TOC (Figure 12a,c). This finding contradicts previous studies [62,63,64]. This phenomenon suggests that a higher TOC content does not necessarily lead to more complex shale pore development. As the TOC content increases in the shale, the degree of organic matter enrichment rises, but the complexity of organic matter pores varies among the different types. Specifically, at lower TOC levels, the fractal dimensions of the pores in the Longtan Formation shales dominated by type III kerogen are higher than those in the Niutitang Formation shales dominated by type I kerogen. However, as the TOC content increases, the fractal dimensions of the pores in the Niutitang Formation shales dominated by type I kerogen surpass those in the Longtan Formation shales dominated by type III kerogen. This indicates that shales with different types of organic matter exhibit varying degrees of pore complexity as the TOC content increases.
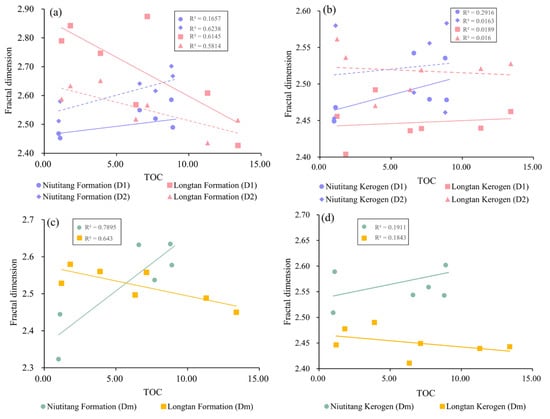
Figure 12.
The correlation between fractal dimension and TOC. (a) The relationship between fractal dimensions D1, D2, and TOC in shale. (b) The relationship between fractal dimensions D1, D2, and TOC in kerogen. (c) The relationship between fractal dimension Dm and TOC in shale. (d) The relationship between fractal dimension Dm and TOC in kerogen.
Therefore, conducting a separate correlation study of the fractal dimensions of different types of kerogen and TOC contents reveals that an increase in the TOC content does not exhibit a significant relationship with the fractal dimensions of the kerogen pores (Figure 12b,d). This suggests that the increase in TOC content may lead to an increase in the quantity of organic matter pores and exhibit a correlation, but this does not inherently relate to the complexity of pores within the organic matter. From our FE-SEM observations, it is noted that the organic matter pores dominated by type I kerogen in the Niutitang Formation are well developed and exhibit diverse morphological changes (Figure 4g–l). Conversely, in the Longtan Formation, in which type III kerogen dominates, the development of organic matter pores is poor, with only a small number of pores observed under FE-SEM, and their complexity level is low (Figure 3g–l). This also indicates that the complexity of organic matter pores is not significantly correlated with the TOC but rather with the type of organic matter. Different organic matter components possess varying capabilities for pore development.
As for how the TOC content influences the pore complexity of shales from different depositional environments, resulting in opposing correlations between the two types of shales, when considering the relationship between the kerogen pore fractal dimensions and TOC content alongside our scanning electron microscopy results, it is evident that the pore complexity of the kerogen in the Niutitang Formation is consistently higher than that in the Longtan Formation. Additionally, the level of complexity of the organic matter pores observed during our microscopic examination is also higher in the Niutitang Formation compared to that in the Longtan Formation. With an increase in TOC content, the kerogen in the Niutitang Formation positively contributes to the overall pore complexity of the shale. Conversely, in the Longtan Formation, an increase in organic matter content may result in relatively reduced contributions from other mineral components, leading to a lower level of pore complexity.
4.2.2. Effect of Ro on Pore Complexity
During the process of hydrocarbon generation from organic matter burial, the development of organic matter pores undergoes a multi-stage evolution process [45,65]. In terms of the relationship between the shale pore fractal dimension and Ro, the relationship between the fractal dimensions D2, Dm, and Ro in the Niutitang Formation shale demonstrates an initial increasing trend followed by a decrease, with the inflection point occurring at Ro = 3.5%, while D1 initially increases and then decreases with increasing Ro values. Although most of the Longtan Formation shales have a low level of maturity, it still demonstrates a weak positive correlation (Figure 13a,c). This indicates that as thermal evolution progresses, organic matter initiates hydrocarbon generation and develops varying degrees of pores.
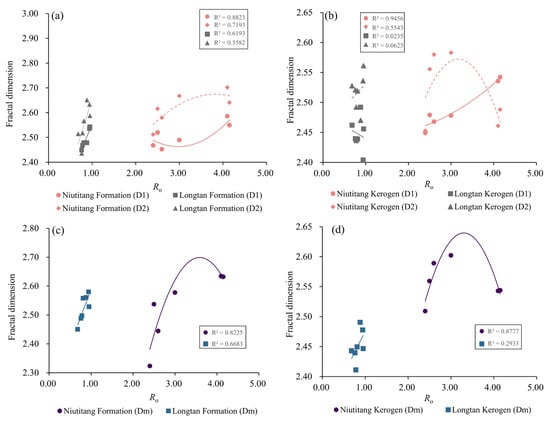
Figure 13.
The correlation between fractal dimension and Ro. (a) The relationship between fractal dimensions D1, D2, and Ro in shale. (b) The relationship between fractal dimensions D1, D2, and Ro in kerogen. (c) The relationship between fractal dimension Dm and Ro in shale. (d) The relationship between fractal dimension Dm and Ro in kerogen.
A further analysis of the complexity of kerogen pores during thermal evolution reveals a similar effect of Ro on the fractal dimension in the Niutitang Formation kerogen (Figure 13b,d). However, this phenomenon is less pronounced at the stage of the low level of maturity of the Longtan Formation kerogen. Nevertheless, it can be inferred that the pore complexity is influenced by thermal evolution. As the organic matter undergoes thermal maturation, hydrocarbon generation commences, resulting in predominantly dry gas production at high levels of maturation while continuing to develop pores. However, over-maturation leads to graphitization and the collapse of organic matter [34,40]. Therefore, the fractal dimension Dm increases first and then decreases with Ro, indicating that the organic matter begins to generate hydrocarbons and increase micropores at the low level of maturity, leading to an increase in micropore complexity. After Ro reaches 3.5%, the micropores in the organic matter start to collapse and contract, resulting in a decrease in micropore complexity. Similarly, the fractal dimension D2 represents the gradual contraction of the macropores after Ro reaches 3.5%, leading to a decrease in complexity. Meanwhile, due to the macroscopic contraction, macropores gradually transform into mesopores, which is also the reason for the increase in the fractal dimension D1 of mesopores.
4.3. Effect of Mineral Composition on Fractal Dimension and Pore Structure
4.3.1. Effect of Clay Minerals on Pore Complexity
The fractal dimension of the Niutitang Formation shale decreases with the increase in clay mineral content, while that of the Longtan Formation shale increases with the increase in clay mineral content (Figure 14a,c). The properties, occurrence, and pore size of different types of clay minerals are obviously different and have different degrees of influence on the pore structure of shale reservoirs [66,67,68]. According to the XRD clay mineral analysis conducted in this study, it was observed that illite is the predominant clay mineral in the Niutitang Formation shale, whereas kaolinite is primarily present in the Longtan Formation shale, followed by chlorite (Table 2). Previous research indicates that different clay minerals exhibit varying levels of pore complexity and adsorption capacities [69], with their adsorption capacities ranked as follows: montmorillonite > an aemon mixed layer > kaolinite > chlorite > illite [70]. Consequently, having a high illite content within marine shales negatively impacts both their fractal dimension and pore structure. Conversely, in a marine–continental transitional setting, an increase in the contents of kaolinite and an illite–montmorillonite mixed layer positively influences the fractal dimension and pore structure.
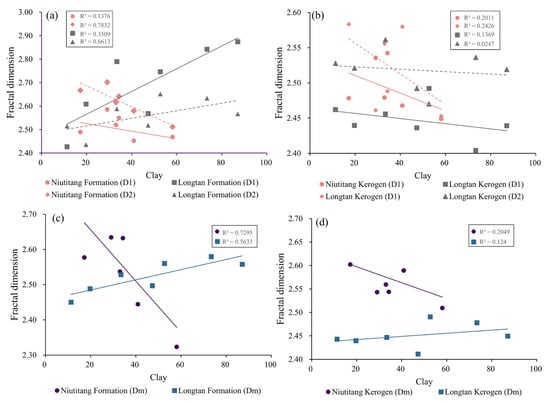
Figure 14.
Correlation between fractal dimension and clay minerals. (a) The relationship between fractal dimensions D1, D2, and clay minerals in shale. (b) The relationship between fractal dimensions D1, D2, and clay minerals in kerogen. (c) The relationship between fractal dimension Dm and clay minerals in shale. (d) The relationship between fractal dimension Dm and clay minerals in kerogen.
In the relation between the fractal dimension of kerogen and clay minerals, the fractal dimension of the kerogen of the Niutitang Formation shale is weakly negatively correlated with clay minerals, while the fractal dimension of the kerogen of the Longtan Formation shale is not correlated with clay minerals (Figure 14b,d). Under FE-SEM, it can be observed that some clay minerals in the Niutitang Formation shale combine with organic matter in an organic–clay complex, but this is rare in the Longtan Formation shale (Figure 3a–c,f and Figure 4f). The organic–clay complex can develop a certain number of pores with a high degree of pore complexity, but with the increase in clay mineral content, the organic matter content is relatively reduced, and the pores developed in the clay minerals are not enough to offset the decrease in organic matter pores developed with the same large number. However, there is no such problem in the Longtan Formation shale, because type III kerogen has fewer pores and has little relationship to clay minerals.
4.3.2. Effect of Pyrite Mineral on Pore Complexity
Pyrite has two main crystal types: strawberry pyrite and autogenous pyrite. Generally, strawberry pyrite indicates a sedimentary environment, while autogenous pyrite is mainly considered to be a product of burial processes [71,72]. In both the Niutitang Formation shale and Longtan Formation shale, strawberry organic-filled pyrite usually develops a large number of intergranular pores.
The fractal dimensions of the two sets of shales show a tendency to decrease with increasing pyrite content (Figure 15a,c). Among them, the correlation between the fractal dimension of the Niutitang Formation shale and pyrite is the strongest, while the correlation between the Longtan Formation shale and pyrite is weaker. In the relationship between the pyrite content and kerogen pore fractal dimension, the fractal dimension D1 of the kerogen in the Niutitang Formation shows a strong negative correlation with pyrite, while the relationships between the fractal dimensions Dm and D2 and the pyrite content are not significant. On the other hand, the relationship between the fractal dimension Dm of the kerogen in the Longtan Formation and pyrite shows a weaker negative correlation, while the relationships between the fractal dimensions D1 and D2 and the pyrite content are not significant (Figure 15b,d). Pyrite transforms into autopyrite during environmental changes [73,74,75]. The marine shale of the Niutitang Formation is at a thermal evolutionary stage of high maturity to over maturity, during which the strawberry pyrite transforms into autogenous pyrite, leading to a reduction in porosity and a decrease in pore complexity. Moreover, with the increase in pyrite content, autogenous pyrite becomes the dominant type of pyrite. Apart from providing abundant intergranular pores and a higher level of pore complexity, it is difficult for strawberry pyrite on its own to develop porosity.
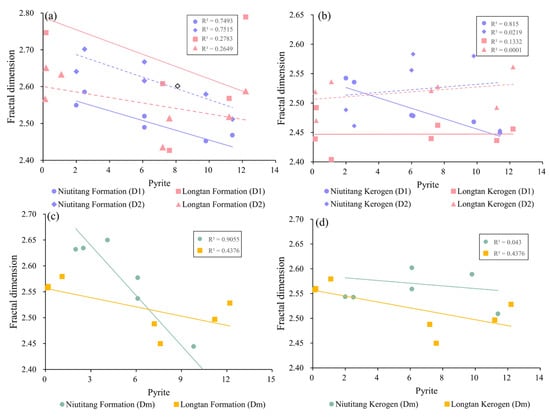
Figure 15.
Correlation between fractal dimension and pyrite minerals. (a) The relationship between fractal dimensions D1, D2, and pyrite in shale. (b) The relationship between fractal dimensions D1, D2, and pyrite in kerogen. (c) The relationship between fractal dimension Dm and clay pyrite in shale. (d) The relationship between fractal dimension Dm and pyrite in kerogen.
4.3.3. Effect of Brittle Minerals on Pore Complexity
Quartz, feldspar, and carbonate minerals are brittle minerals, but through correlation analyses, they have been found to have no obvious correlation in shale and kerogen. However, brittle minerals also develop intergranular pores, micro-fractures, and secondary dissolution pores, etc., which have an impact on pore complexity, but this impact is limited [76]. This is of great significance for the manufacturing of artificial pore and fracture networks in the mining process, and a certain content of brittle minerals in shale is a favorable condition for the mining of shale gas resources [77].
4.4. Differential Pore Developments of Marine and Marine–Continental Transitional Shales
Due to the differences in their sedimentary environment and diagenetic process, the marine Niutitang Formation shale and marine–continental transitional Longtan Formation shale have great differences in organic matter sources, organic matter content, thermal maturity, mineral composition, and other aspects, resulting in differences in pore structures and fractal dimensions between the marine shale and the marine–continental transitional shale and organic matter. Organic matter, thermal maturity, and clay minerals are the main factors affecting the pore structure and fractal dimension of shale, followed by pyrite [17,78,79]. The type of organic matter along with the content of clay minerals and pyrite that are conducive to preserving organic matter pores predominantly affect the pore structure and fractal dimension of organic matter.
Organic matter plays a pivotal role in marine shale due to its high abundance, primarily comprising solid kerogen and migrated asphalt, along with elevated maturity levels. As a result, marine shale exhibits an abundance of organic matter pores with a substantial contribution rate from such pores while also featuring intricate heterogeneous characteristics (Figure 16a). In contrast, clay minerals assume significance in marine–continental transitional shales in which kaolinite mixed beds provide numerous adsorption sites for pores. Diverging from marine shales due to their lower maturity levels coupled with different types of organic matter compositions mainly consisting of terrestrial plant detritus along with other primary components, secondary pores do not develop within the organic matter framework (Figure 16b). The pore development of secondary organic matter is insufficient, resulting in the poor porosity of organic matter in the marine–continental transitional phase, and its porosity complexity is lower than that of marine shale. However, the porosity provided by abundant clay minerals and pyrite makes the porosity of marine–continental transitional shale more complex than that of marine shale.
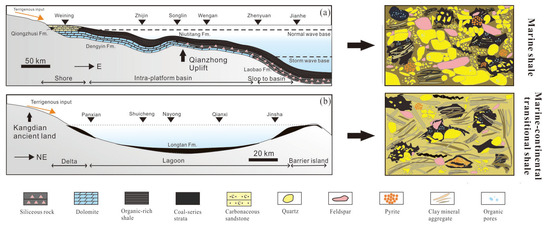
Figure 16.
Sedimentary environment and pore development model of organic-rich shale in Guizhou Province. (a) Niutitang Formation, (b) Longtan Formation.
Considering the comprehensive fractal dimensions Dm, D1, and D2 for the two different sets of shale and kerogen pore complexities, the highest fractal dimension Dm is observed in the Niutitang Formation kerogen, indicating organic micropores have the highest level of complexity in type I kerogen. The highest fractal dimension D1 is found in the Longtan Formation shale, suggesting that mesopores have the highest level of complexity in the Longtan Formation shale. The highest fractal dimension D2 is observed in the Niutitang Formation shale, indicating that macropores have the highest level of complexity in the Niutitang Formation shale. Therefore, based on our N2 and CO2 adsorption anaylses, we established two sets of pore fractal models for shale and organic matter (Figure 17). The shale pores of the Longtan Formation in the marine–continental transitional facies exhibit higher levels of complexity compared to those of the marine Niutitang Formation, providing numerous gas adsorption sites (Figure 17a,c). The organic matter pores dominated by type I kerogen in the marine Niutitang Formation show higher levels of complexity than those dominated by type III kerogen in the Longtan Formation marine–continental transitional shale (Figure 17b,d). We have identified the fractal characteristics of these two sets of shale and organic matter, along with their influencing factors, which will aid in the evaluation of subsequent reservoir development. However, further discussions are required to delve deeper into this matter.
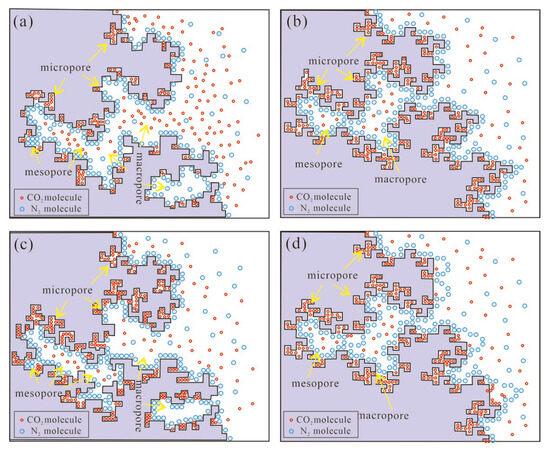
Figure 17.
Shale and kerogen pore fractal model of marine Niutitang Formation and marine–continental transitional Longtan Formation. (a) Shale pore of Niutitang Formation. (b) Organic matter pore of Niutitang Formation. (c) Shale pore of Longtan Formation. (b) Organic matter pore of Longtan Formation (modified from Seri-Levy, 1993 [80]).
5. Conclusions
In this study, the differences in the pore development of shale and organic matter in different sedimentary environments and the effects of organic geochemical characteristics and mineral components on pore structure and fractal characteristics were studied in the marine Niutitang Formation and the marine–continental transitional Longtan Formation in Guizhou. The results show that the pore complexity of the marine–continental transitional shale is slightly higher than that of the marine shale, and type I kerogen is more complex than type III kerogen. The main conclusions of this study are as follows:
(1) The predominant pore types in the marine shale are wedge-shaped pores (H3 type) and slit pores (H4 type), while inkpot-shaped pores (H2 type) and slit pores (H4 type) dominate in the marine–continental transitional shale. Cylindrical pores (H1 type) are the primary pore structure observed in the organic matter of the marine and marine–continental transitional shale, followed by slit pores (H4 type).
(2) The high CRV value can provide shale gas storage space, and the high CRA value can provide a strong adsorption capacity. In addition to CRV and CRA values, it is shown that organic matter pores contribute more to the marine Niutitang Formation shale pores, which can provide storage space for gas. In contrast, inorganic pores are the main contributors to the marine–continental transitional Longtan Formation shale, with interlayer clay mineral pores being particularly prominent. The clay mineral composition group is primarily composed of kaolinite and emmon mixed layer minerals, which can provide an abundant pore specific surface area and a high adsorption capacity.
(3) The influencing factors of the fractal characteristics of the two sets of shale and organic matter pores are clarified. For the marine shale, the fractal dimensions (Dm, D1 and D2) are positively correlated with the total organic carbon (TOC) and negatively correlated with clay minerals and pyrite. Specifically, D1 and Dm initially increase and then decrease with increasing Ro values, while D2 gradually increases. For the marine–continental transitional shale, the fractal dimensions (Dm, D1, and D2) are positively correlated with Ro and clay minerals and negatively correlated with the TOC and pyrite. Additionally, D2 of the marine–continental transitional shale is negatively correlated with Ro. It is evident that the TOC content, clay minerals, and pyrite are not the primary factors influencing the fractal changes in the organic matter pores. Instead, Ro is the primary factor affecting the fractal characteristics of organic matter pores, indicating that the complexity of the organic matter pores is influenced by their thermal maturity.
(4) Based on N2 and CO2 adsorption, two sets of pore fractal models were established for shale and organic matter. It is evident that the complexity of the Longtan Formation shale in the marine–continental transitional facies is higher than that of the Niutitang Formation marine shale. Additionally, the complexity of organic matter pores dominated by type I kerogen is higher than those dominated by type III kerogen. This study will aid in subsequent evaluations of pore connectivity and flow effectiveness in shale reservoirs.
Author Contributions
Conceptualization, P.X. and S.N.; methodology, F.H. and J.T.; formal analysis, S.N.; investigation, Y.F. and K.W.; resources, S.N. and Y.F.; data curation, S.N. and K.W.; writing—original draft preparation, S.N. and P.X.; writing—review and editing, S.N. and P.X.; visualization, Y.F.; supervision, K.W.; project administration, Y.F. and K.W. All authors have read and agreed to the published version of the manuscript.
Funding
This research was supported by the Natural Science Foundation Project of China (No. 42002166, 42162016, 42063009) and Guizhou Provincial Fund Project (Nos. (2022)ZD005).
Data Availability Statement
All of the data and models generated or used in the present study are available from the corresponding author upon request.
Conflicts of Interest
The authors declare that they have no known competing financial interests or personal relationships that could have appeared to influence the work reported in this paper.
References
- Curtis, J.B. Fractured shale-gas systems. Aapg Bull. 2002, 86, 1921–1938. [Google Scholar]
- Hu, Q.; Ewing, R.; Rowe, H. Low nanopore connectivity limits gas production in Barnett formation. J. Geophys. Res. Solid. Earth 2015, 120, 8073–8087. [Google Scholar] [CrossRef]
- Mahzari, P.; Mitchell, T.M.; Jones, A.P.; Westacott, D.; Striolo, A. Direct gas-in-place measurements prove much higher production potential than expected for shale formations. Sci. Rep. 2021, 11, 10775. [Google Scholar] [CrossRef] [PubMed]
- Liu, Q.; Li, P.; Jin, Z.; Liang, X.; Zhu, D.; Wu, X.; Meng, Q.; Liu, J.; Fu, Q.; Zhao, J. Preservation of organic matter in shale linked to bacterial sulfate reduction (BSR) and volcanic activity under marine and lacustrine depositional environments. Mar. Pet. Geol. 2021, 127, 104950. [Google Scholar] [CrossRef]
- Zou, C.; Yang, Z.; Dong, D.; Zhao, Q.; Chen, Z.; Feng, Y.; Li, J.; Wang, X. Formation, Distribution and Prospect of Unconventional Hydrocarbons in Source Rock Strata in China. Earth Sci. 2022, 47, 1517–1533. [Google Scholar]
- Dong, D.; Zou, C.; Dai, J.; Huang, S.; Zheng, J.; Wang, Y.; Li, X.; Guan, Q.; Zhang, C.; Huang, J.; et al. Suggestions on the development strategy of shale gas in China. Nat. Gas. Geosci. 2016, 27, 397–406. [Google Scholar] [CrossRef]
- Ma, Z.; Wang, Y.; Yu, B. Study on Analytical Method for Pore Size Distribution of the Lower Cambrian Niutitang Formation Shale in Southeastern Chongqing. Rock. Miner. Anal. 2018, 37, 244–255. [Google Scholar]
- Zou, C.; Zhao, Q.; Wang, H.; Xiong, W.; Dong, D.; Yu, R. The main characteristics of marine shale gas and the theory & technology of exploration and development in China. Nat. Gas. Ind. 2022, 42, 1–13. [Google Scholar]
- Yi, T.; Zhao, X. Characteristics and distribution patterns of the Lower Cambrian Niutitang Shale reservoirs in Guizhou, China. Natural Gas. Ind. 2014, 8, 976. [Google Scholar]
- Zhu, X.; Cai, J.; Wang, Y.; Liu, H.; Zhang, S. Evolution of organic-mineral interactions and implications for organic carbon occurrence and transformation in shale. Gas. Bulletin. 2019, 132, 784–792. [Google Scholar] [CrossRef]
- Zhao, F.; Sun, Z.; Sang, S.; Zhou, X.; Han, Z.; Zhao, L.; Wu, Z. Progress of coalbed methane exploration and development in Guizhou and the 14th Five-Year Plan development strategy. Nat. Gas. Ind. 2022, 42, 65–75. [Google Scholar]
- Wu, Y.; Fan, T.; Jiang, S.; Yang, X. Lithofacies and sedimentary sequence of the lower Cambrian Niutitang shale in the upper Yangtze platform, South China. J. Nat. Gas. Sci. Eng. 2017, 43, 124–136. [Google Scholar] [CrossRef]
- Jin, C.; Li, C.; Algeo, T.J.; Wu, S.; Cheng, M.; Zhang, Z.; Shi, W. Controls on organic matter accumulation on the early-Cambrian western Yangtze Platform, South China. Mar. Pet. Geol. 2020, 111, 75–87. [Google Scholar] [CrossRef]
- Jia, A.; Hu, D.; He, S.; Guo, X.; Hou, Y.; Wang, T.; Yang, R. Variations of Pore Structure in Organic-Rich Shales with Different Lithofacies from the Jiangdong Block, Fuling Shale Gas Field, SW China: Insights into Gas Storage and Pore Evolution. Energy Fuels. 2020, 34, 12457–12475. [Google Scholar] [CrossRef]
- Song, Y.; Jiang, B.; Li, F.; Yan, G.; Yao, Y. Applicability of fractal models and nanopores’ fractal characteristics for low-middle rank tectonic deformed coals. Ear Sci. 2018, 43, 1611–1622. [Google Scholar]
- Dai, F.; Hu, H.; Zhang, A. Suitability study on fractal model of organic shale pore. Coa Sci. Tech. 2019, 47, 168–175. [Google Scholar]
- Xia, P.; Li, H.; Fu, Y.; Qiao, W.; Guo, C.; Yang, Z.; Huang, J.; Mou, Y. Effect of lithofacies on pore structure of the Cambrian organic-rich shale in northern Guizhou, China. Geol. J. 2021, 56, 1130–1142. [Google Scholar] [CrossRef]
- GB/T 19144–2010; Isolation Method for Kerogen from Sedimentary Rock. Standardization Administration of the People’s Republic of China: Beijing, China, 2010; pp. 1–7.
- Okolo, G.N.; Everson, R.C.; Neomagus, H.W.J.P.; Roberts, M.J.; Sakurovs, R. Comparing the porosity and surface areas of coal as measured by gas adsorption, mercury intrusion and SAXS techniques. Fuel 2015, 141, 293–304. [Google Scholar] [CrossRef]
- Zheng, F.; Tang, X.; Yuan, K.; Lin, T.; You, M.; Niu, J.; Zi, Y.; Liang, Y. Sedimentation Models and Development Mechanisms of Organic-Rich Shales of the Lower Carboniferous Dawuba Formation: A Case Study in the Yaziluo Rift Trough, South of Guizhou Province, Southern China. Acs Omega 2022, 7, 29054–29071. [Google Scholar] [CrossRef]
- Brunauner, S.; Emmett, S.P.H.; Teller, E.J. Adsorption of gases in multimolecular layers. J. Am. Chem. Soc. 1938, 60, 309–319. [Google Scholar] [CrossRef]
- Wang, T.; Bury, W.; Gómez-Gualdrón, D.A.; Vermeulen, N.A.; Mondloch, J.E.; Deria, P.; Zhang, K.; Moghadam, P.Z.; Sarjeant, A.A.; Snurr, R.Q.; et al. Ultrahigh Surface Area Zirconium MOFs and Insights into the Applicability of the BET Theory. J. Am. Chem. Soc. 2015, 137, 3585–3591. [Google Scholar] [CrossRef]
- Klimakow, M.; Klobes, P.; Rademann, K.; Emmerling, F. Characterization of mechanochemically synthesized MOFs. Microporous Mesoporous Mat. 2012, 154, 113–118. [Google Scholar] [CrossRef]
- Han, H.; Cao, Y.; Chen, S.; Lu, J.; Huang, C.; Zhu, H.; Zhan, P.; Gao, Y. Influence of particle size on gas-adsorption experiments of shales: An example from a Longmaxi Shale sample from the Sichuan Basin, China. Fuel 2016, 186, 750–757. [Google Scholar] [CrossRef]
- Pfeifer, P.; Martin, O.; Milton, W.C. Fractal bet and FHH theories of adsorption: A comparative study. Proc. R. Soc. London A Math. Phys. Sci. 1989, 423, 169–188. [Google Scholar]
- Pfeifer, P.; Wu, Y.; Cole, M.; Krim, J. Multilayer adsorption on a fractally rough surface. Phys. Rev. Lett. 1989, 62, 1997. [Google Scholar] [CrossRef] [PubMed]
- Guan, Q.; Dong, D.; Sun, S.; Hu, L.; Qi, L.; Li, C.; Chen, C.; Chen, X. Fractal characteristics of organic-rich shale pore structure and its geological implications: A case study of the Lower Silurian Longmaxi Formation in the Weiyuan block, Sichuan Basin. Nat. Gas. Ind. 2024, 44, 108–118. [Google Scholar]
- Barrett, E.; Joyner, L.; Halenda, P. The Determination of Pore Volume and Area Distributions in Porous Substances II. J. Am. Chem. Soc. 1951, 73, 373–380. [Google Scholar] [CrossRef]
- Jaroniec, M. Evaluation of the fractal dimension of microporous activated carbons. Fuel 1990, 69, 1573–1574. [Google Scholar] [CrossRef]
- He, X.; Cheng, Y.; Hu, B.; Wang, Z.; Wang, C.; Yi, M.; Wang, L. Effects of coal pore structure on methane-coal sorption hysteresis: An experimental investigation based on fractal analysis and hysteresis evaluation. Fuel 2020, 269, 117438. [Google Scholar] [CrossRef]
- Hou, Y.; Ge, Z.; Zhou, Z.; Guan, Y.; Xiao, C.; Jia, Y. Influence of supercritical CO2 on fracture network evolution with nanopore structure linkage in high-rank anthracite matrix. Fuel 2024, 357, 129729. [Google Scholar] [CrossRef]
- Wang, H.; Wang, L.; Zheng, S.; Sun, Y.; Shen, S.; Zhang, X. Research on coal matrix pore structure evolution and adsorption behavior characteristics under different thermal stimulation. Energy 2024, 287, 129677. [Google Scholar] [CrossRef]
- Yang, F.; Ning, Z.; Wang, Q.; Zhang, R.; Krooss, B.M. Pore structure characteristics of lower Silurian shales in the southern Sichuan Basin, China: Insights to pore development and gas storage mechanism. Int. J. Coal Geol. 2016, 156, 12–24. [Google Scholar] [CrossRef]
- Wang, Y.; Dong, D.; Yang, Y.; He, L.; Wang, S.; Huang, J.; Pu, B.; Wang, S. Quantitative characterization of reservoir space in the Lower Silurian Longmaxi Shale, southern Sichuan. Sci. China Earth Sci. 2014, 57, 1348–1356. [Google Scholar] [CrossRef]
- Cao, T.; Song, Z.; Wang, S.; Xia, J. A comparative study of the specific surface area and pore structure of different shales and their kerogens. Sci. China Earth Sci. 2015, 58, 510–522. [Google Scholar] [CrossRef]
- Zhang, J.; Li, X.; Wei, Q.; Gao, W.; Liang, W.; Wang, Z.; Wang, F. Quantitative characterization of pore-fracture system of organic-rich marine-continental shale reservoirs: A case study of the Upper Permian Longtan Formation, Southern Sichuan Basin, China. Fuel 2017, 200, 272–281. [Google Scholar] [CrossRef]
- Chen, L.; Jiang, Z.; Liu, Q.; Jiang, S.; Liu, K.; Tan, J.; Gao, F. Mechanism of shale gas occurrence: Insights from comparative study on pore structures of marine and lacustrine shales. Mar. Pet. Geol. 2019, 104, 200–216. [Google Scholar] [CrossRef]
- Zhang, P.; Huang, Y.; Zhang, J.; Li, B.; Liu, H.; Yang, J. Study on shale heterogeneity in western Hunan and Hubei: A case study of the Longmaxi Formation in well Ld1. Acta Geol. Sin. 2020, 94, 1568–1577. [Google Scholar]
- Fu, Y.; Zhou, W.; Wang, H.; Qiao, W.; Ye, Y.; Jiang, R.; Wang, X.; Shu, J.; Li, D.; Xia, P. The relationship between environment and geochemical characteristics of black rock series of Lower Cambrian in northern Guizhou. Geol. J. 2021, 95, 536–548. [Google Scholar]
- Zhang, W.; Hu, W.; Borjigin, T.; Zhu, F. Pore characteristics of different organic matter in black shale: A case study of the Wufeng-Longmaxi Formation in the Southeast Sichuan Basin, China. Mar. Pet. Geol. 2020, 111, 33–43. [Google Scholar] [CrossRef]
- Tissot, B.P.; Welte, D.H. Classification of Crude Oils. In Petroleum Formation and Occurrence; Springer: Berlin/Heidelberg, Germany, 1984. [Google Scholar]
- Guo, S.; Mao, W. Division of diagenesis and pore evolution of a Permian Shanxi shale in the Ordos Basin, China. J. Pet. Sci. Eng. 2019, 182, 106351. [Google Scholar] [CrossRef]
- Song, Y.; Gao, F.; Tang, X.; Chen, L.; Wang, X. Influencing factors of pore structure differences between marine and terrestrial shale reservoirs. Acta Pet. Sin. 2020, 41, 1501–1512. [Google Scholar]
- Ning, S.; Xia, P.; Hao, F.; Tian, J.; Zhong, Y.; Zou, N.; Fu, Y. Shale facies and its relationship with sedimentary environment and organic matter of Niutitang black shale, Guizhou Province. Nat. Gas. Geosci. 2021, 32, 1297–1307. [Google Scholar]
- Mastalerz, M.; Schimmelmann, A.; Drobniak, A.; Chen, Y. Porosity of Devonian and Mississippian New Albany Shale across a maturation gradient; insights from organic petrology, gas adsorption, and mercury intrusion. Aapg Bull. 2013, 97, 1621–1643. [Google Scholar] [CrossRef]
- Xia, P.; Hao, F.; Tian, J.; Zhou, W.; Fu, Y.; Guo, C.; Yang, Z.; Li, K.; Wang, K. Depositional Environment and Organic Matter Enrichment of Early Cambrian Niutitang Black Shales in the Upper Yangtze Region, China. Energies 2022, 15, 4551. [Google Scholar] [CrossRef]
- Jiang, Z.; Song, Y.; Tang, X.; Li, Z.; Wang, X.; Wang, G.; Xue, Z.; Li, X.; Zhang, K.; Chang, J.; et al. Controlling factors of marine shale gas differential enrichment in southern China. Pet. Explor. Dev. 2020, 47, 617–628. [Google Scholar] [CrossRef]
- Gu, Y.; Li, X.; Wang, Q.; Yang, S. On the Different Characteristics of Organic Pores in Shale and Their Influencing Factors: Taking typical marine, continental, and transitional facies reservoirs in China as examples. Acta Geol. Sin. 2021, 4, 39. [Google Scholar]
- Loucks, R.; Reed, R.; Ruppel, S.; Hammes, U. Spectrum of pore types and networks in mudrocks and a descriptive classification for matrix-related mudrock pores. Aapg Bull. 2012, 96, 1071–1098. [Google Scholar] [CrossRef]
- Thommes, M.; Kaneko, K.; Neimark, A.V.; Olivier, J.P.; Rodriguez-Reinoso, F.; Rouquerol, J.; Sing, S.W.K. Physisorption of gases, with special reference to the evaluation of surface area and pore size distribution (IUPAC Technical report). Pure Appl. Chem. 2015, 87, 1051. [Google Scholar] [CrossRef]
- Sing, K.S.W. Reporting physisorption data for gas/solid systems with special reference to the determination of surface area and porosity (Recommendations 1984). Pure Appl. Chem. 1985, 54, 2201–2218. [Google Scholar] [CrossRef]
- Zou, J.; Chen, W.; Yang, D.; Yuan, J.; Jiao, Y.Y. Fractal characteristics of the anisotropic microstructure and pore distribution of low-rank coal. Aapg Bull. 2019, 103, 1297–1319. [Google Scholar] [CrossRef]
- Jarvie, D.M.; Hill, R.J.; Ruble, T.E.; Pollastro, R.M. Unconventional shale-gas systems: The Mississippian Barnett Shale of north-central Texas as one model for thermogenic shale-gas assessment. Aapg Bull. 2007, 91, 475–499. [Google Scholar] [CrossRef]
- Ma, Y.; Ardakani, O.H.; Zhong, N.; Liu, H.; Huang, H.; Larter, S.; Zhang, C. Possible pore structure deformation effects on the shale gas enrichment: An example from the Lower Cambrian shales of the Eastern Upper Yangtze Platform, South China. Int. J. Coal Geol. 2020, 217, 103349. [Google Scholar] [CrossRef]
- Ross, D.J.K.; Marc Bustin, R. The importance of shale composition and pore structure upon gas storage potential of shale gas reservoirs. Mar. Pet. Geol. 2009, 26, 916–927. [Google Scholar] [CrossRef]
- Chalmers, G.R.L.; Bustin, R.M. Lower Cretaceous gas shales in northeastern British Columbia, Part II: Evaluation of regional potential gas resources. Bull. Can. Pet. Geol. 2008, 56, 22–61. [Google Scholar] [CrossRef]
- Shang, F.; Zhu, Y.; Hu, Q.; Zhu, Y.; Wang, Y.; Du, M.; Liu, R.; Han, Y. Characterization of methane adsorption on shale of a complex tectonic area in Northeast Guizhou, China: Experimental results and geological significance. J. Nat. Gas. Sci. Eng. 2020, 84, 103676. [Google Scholar] [CrossRef]
- Slatt, R.M.; O’Brien, N.R. Pore types in the Barnett and Woodford gas shales: Contribution to understanding gas storage and migration pathways in fine-grained rocks. Aapg Bull. 2011, 95, 2017–2030. [Google Scholar] [CrossRef]
- Hu, M.; Qiu, X.; Hu, Z.; Deng, Q. Current Researches on Shale Gas Reservoirs and Existing Problems. Spec. Oil Gas. Reserv. 2015, 22, 1–7+151. [Google Scholar]
- Löhr, S.C.; Baruch, E.T.; Hall, P.A.; Kennedy, M.J. Is organic pore development in gas shales influenced by the primary porosity and structure of thermally immature organic matter? Org. Geochem. 2015, 87, 119–132. [Google Scholar] [CrossRef]
- Jiao, K.; Xie, G.; Fei, W.; Liu, S.; Liu, X.; Kang, Y.; Deng, B.; Pang, Q.; Liu, W.; Luo, C. The Control Factors and Geological Implications of the Nanopore Morphology of the Lower Paleozoic Black Shales in the Sichuan Basin, China. Geol. J. Chin. Univ. 2019, 25, 847–859. [Google Scholar]
- Mishra, S.; Mendhe, V.A.; Varma, A.K.; Kamble, A.D.; Sharma, S.; Bannerjee, M.; Kalpana, M.S. Influence of organic and inorganic content on fractal dimensions of Barakar and Barren Measures shale gas reservoirs of Raniganj basin, India. J. Nat. Gas. Sci. Eng. 2018, 49, 393–409. [Google Scholar] [CrossRef]
- Han, H.; Guo, C.; Zhong, N.; Pang, P.; Gao, Y. A study on fractal characteristics of lacustrine shales of Qingshankou Formation in the Songliao Basin, northeast China using nitrogen adsorption and mercury injection methods. J. Pet. Sci. Eng. 2020, 193, 107378. [Google Scholar] [CrossRef]
- Chang, J.; Fan, X.; Jiang, Z.; Wang, X.; Chen, L.; Li, J.; Zhu, L.; Wan, C.; Chen, Z. Differential impact of clay minerals and organic matter on pore structure and its fractal characteristics of marine and continental shales in China. Appl. Clay Sci. 2022, 216, 106334. [Google Scholar] [CrossRef]
- Kuila, U.; McCarty, D.K.; Derkowski, A.; Fischer, T.B.; Topór, T.; Prasad, M. Nano-scale texture and porosity of organic matter and clay minerals in organic-rich mudrocks. Fuel 2014, 135, 359–373. [Google Scholar] [CrossRef]
- Loucks, R.; Reed, R.; Ruppel, S.; Jarvie, D. Morphology, Genesis, and Distribution of Nanometer-Scale Pores in Siliceous Mudstones of the Mississippian Barnett Shale. J. Sediment. Res. 2009, 79, 848–861. [Google Scholar] [CrossRef]
- Gao, F.; Song, Y.; Jiang, Z.; Zhang, X.; Chen, L. Influence of Clay Minerals on Shale Storage Space and Adsorptive Capacity. Spec. Oil Gas. Reserv. 2017, 24, 1–8. [Google Scholar]
- Wang, P.; Zhang, C.; Li, X.; Zhang, K.; Yuan, Y.; Zang, X.; Cui, W.; Liu, S.; Jiang, Z. Organic matter pores structure and evolution in shales based on the he ion microscopy (HIM): A case study from the Triassic Yanchang, Lower Silurian Longmaxi and Lower Cambrian Niutitang shales in China. J. Nat. Gas. Sci. Eng. 2020, 84, 103682. [Google Scholar] [CrossRef]
- Tang, S.; Fan, E. Methane adsorption characteristics of clay minerals in organic-rich shales. Int. J. Coal Geol. 2014, 39, 1700–1706. [Google Scholar]
- Ji, L.; Qiu, J.; Xia, Y.; Zhang, T. Micro-pore characteristics and methane adsorption propertiesof common clay minerals by electron microscope scanning. Acta Pet. Sinica. 2012, 33, 249–256. [Google Scholar]
- Wei, H.; Wei, X.; Qiu, Z.; Song, H.; Shi, G. Redox conditions across the G–L boundary in South China: Evidence from pyrite morphology and sulfur isotopic compositions. Chem. Geol. 2016, 440, 1–14. [Google Scholar] [CrossRef]
- Rickard, D. Sedimentary pyrite framboid size-frequency distributions: A meta-analysis. Palaeogeogr. Palaeoclimatol. Palaeoecol. 2019, 522, 62–75. [Google Scholar] [CrossRef]
- Zhao, D.; Guo, Y.; Zhu, Y.; Wang, G.; Liu, J.; Chong, S.; Zhang, J. Micropore Characteristics and Geological Significance of Pyrite in Shale Rocks of Longmaxi Formation. Acta Sed. Sin. 2018, 36, 864–876. [Google Scholar]
- Merinero, R.; Lunar, R.; Martínez-Frías, J.; Somoza, L.; Díaz-del-Río, V. Iron oxyhydroxide and sulphide mineralization in hydrocarbon seep-related carbonate submarine chimneys, Gulf of Cadiz (SW Iberian Peninsula). Mar. Pet. Geol. 2008, 25, 706–713. [Google Scholar] [CrossRef]
- Wang, D.; Zhang, J.; Li, Z.; Tong, Z.; Niu, J.; Ding, W.; Zhang, C. Formation mechanism of framboidal pyrite and its theory inversion of paleo-redox conditions. Geol. China 2022, 49, 36–50. [Google Scholar]
- Zhang, C.; Dong, D.; Wang, Y.; Jiang, S.; Guan, Q. Research Progress on Brittleness of Shale Reservoirs. Xinjiang Pet. Geo. 2017, 38, 111–118. [Google Scholar]
- Ge, M.; Ren, S.; Guo, T.; Wang, S.; Zhou, Z. Identification Method of Marine Shale Gas ‘High-Quality Layer’ in the Lower Paleozoic Area, Southern China and Its Application. Rock. Miner. Anal. 2020, 39, 350–361. [Google Scholar]
- Milliken, K.L.; Rudnicki, M.; Awwiller, D.N.; Zhang, T. Organic matter-hosted pore system, Marcellus Formation (Devonian), Pennsylvania. Aapg Bull. 2013, 97, 177–200. [Google Scholar] [CrossRef]
- Ilgen, A.G.; Heath, J.E.; Akkutlu, I.Y.; Bryndzia, L.T.; Cole, D.; Kharaka, Y.D.; Kneafsey, T.J.; Milliken, K.L.; Pyrak-Nolte, L.J.; Suarez-Rivera, R. Shales at all scales: Exploring coupled processes in mudrocks. Earth-Sci. Rev. 2017, 166, 132. [Google Scholar] [CrossRef]
- Seri-Levy, A.; Avnir, D. Effects of heterogeneous surface geometry on adsorption. Langmuir 1993, 9, 3067–3076. [Google Scholar] [CrossRef]
Disclaimer/Publisher’s Note: The statements, opinions and data contained in all publications are solely those of the individual author(s) and contributor(s) and not of MDPI and/or the editor(s). MDPI and/or the editor(s) disclaim responsibility for any injury to people or property resulting from any ideas, methods, instructions or products referred to in the content. |
© 2024 by the authors. Licensee MDPI, Basel, Switzerland. This article is an open access article distributed under the terms and conditions of the Creative Commons Attribution (CC BY) license (https://creativecommons.org/licenses/by/4.0/).