

Fractal Analysis of the Centrifuge Vibrograms


Abstract
1. Introduction
2. Materials and Methods
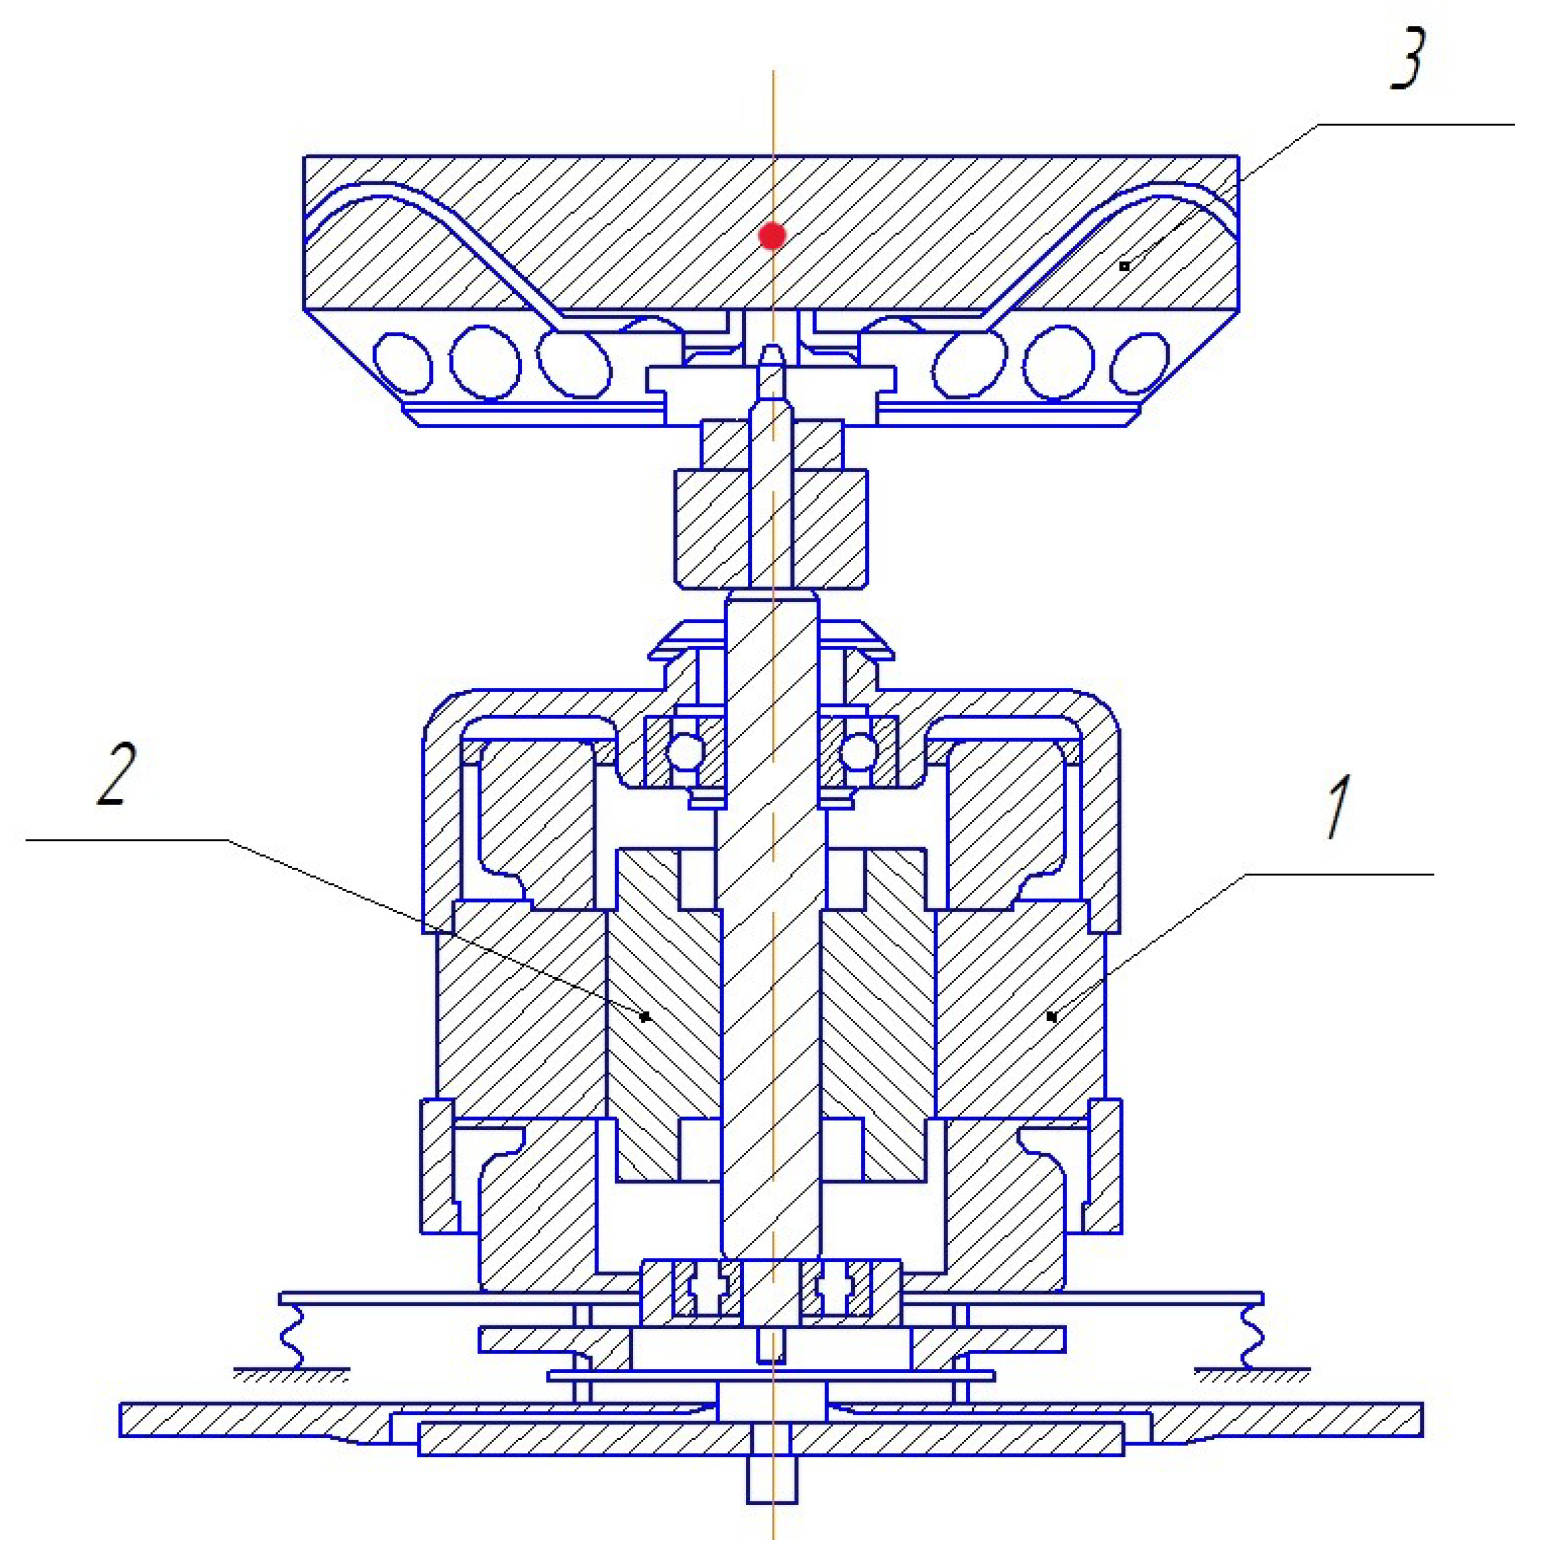
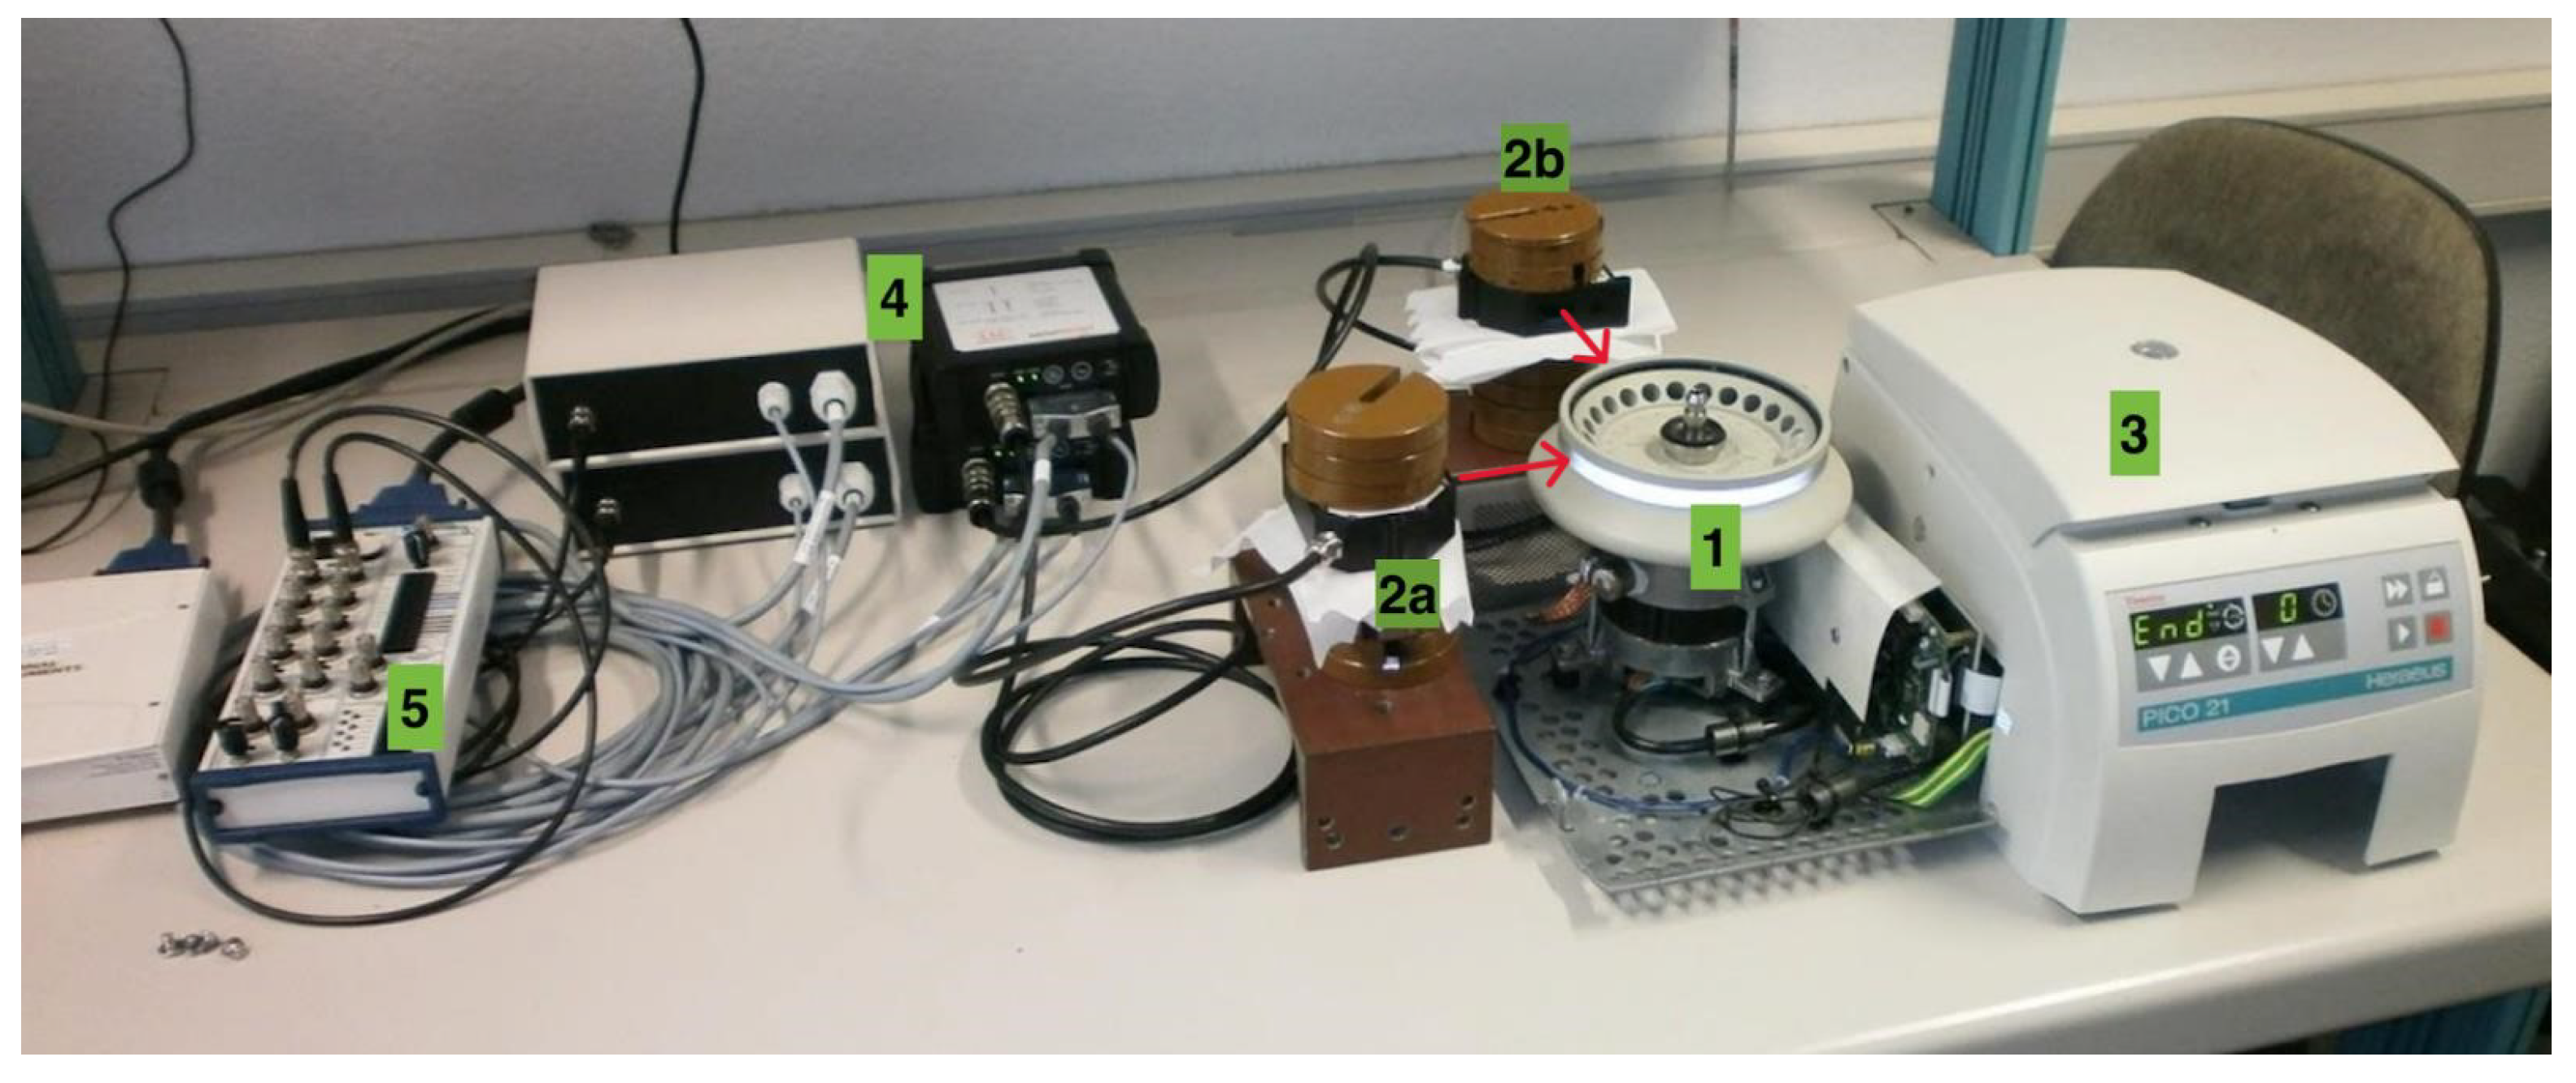
2.1. Measurement of the Centrifuge Vibrogram
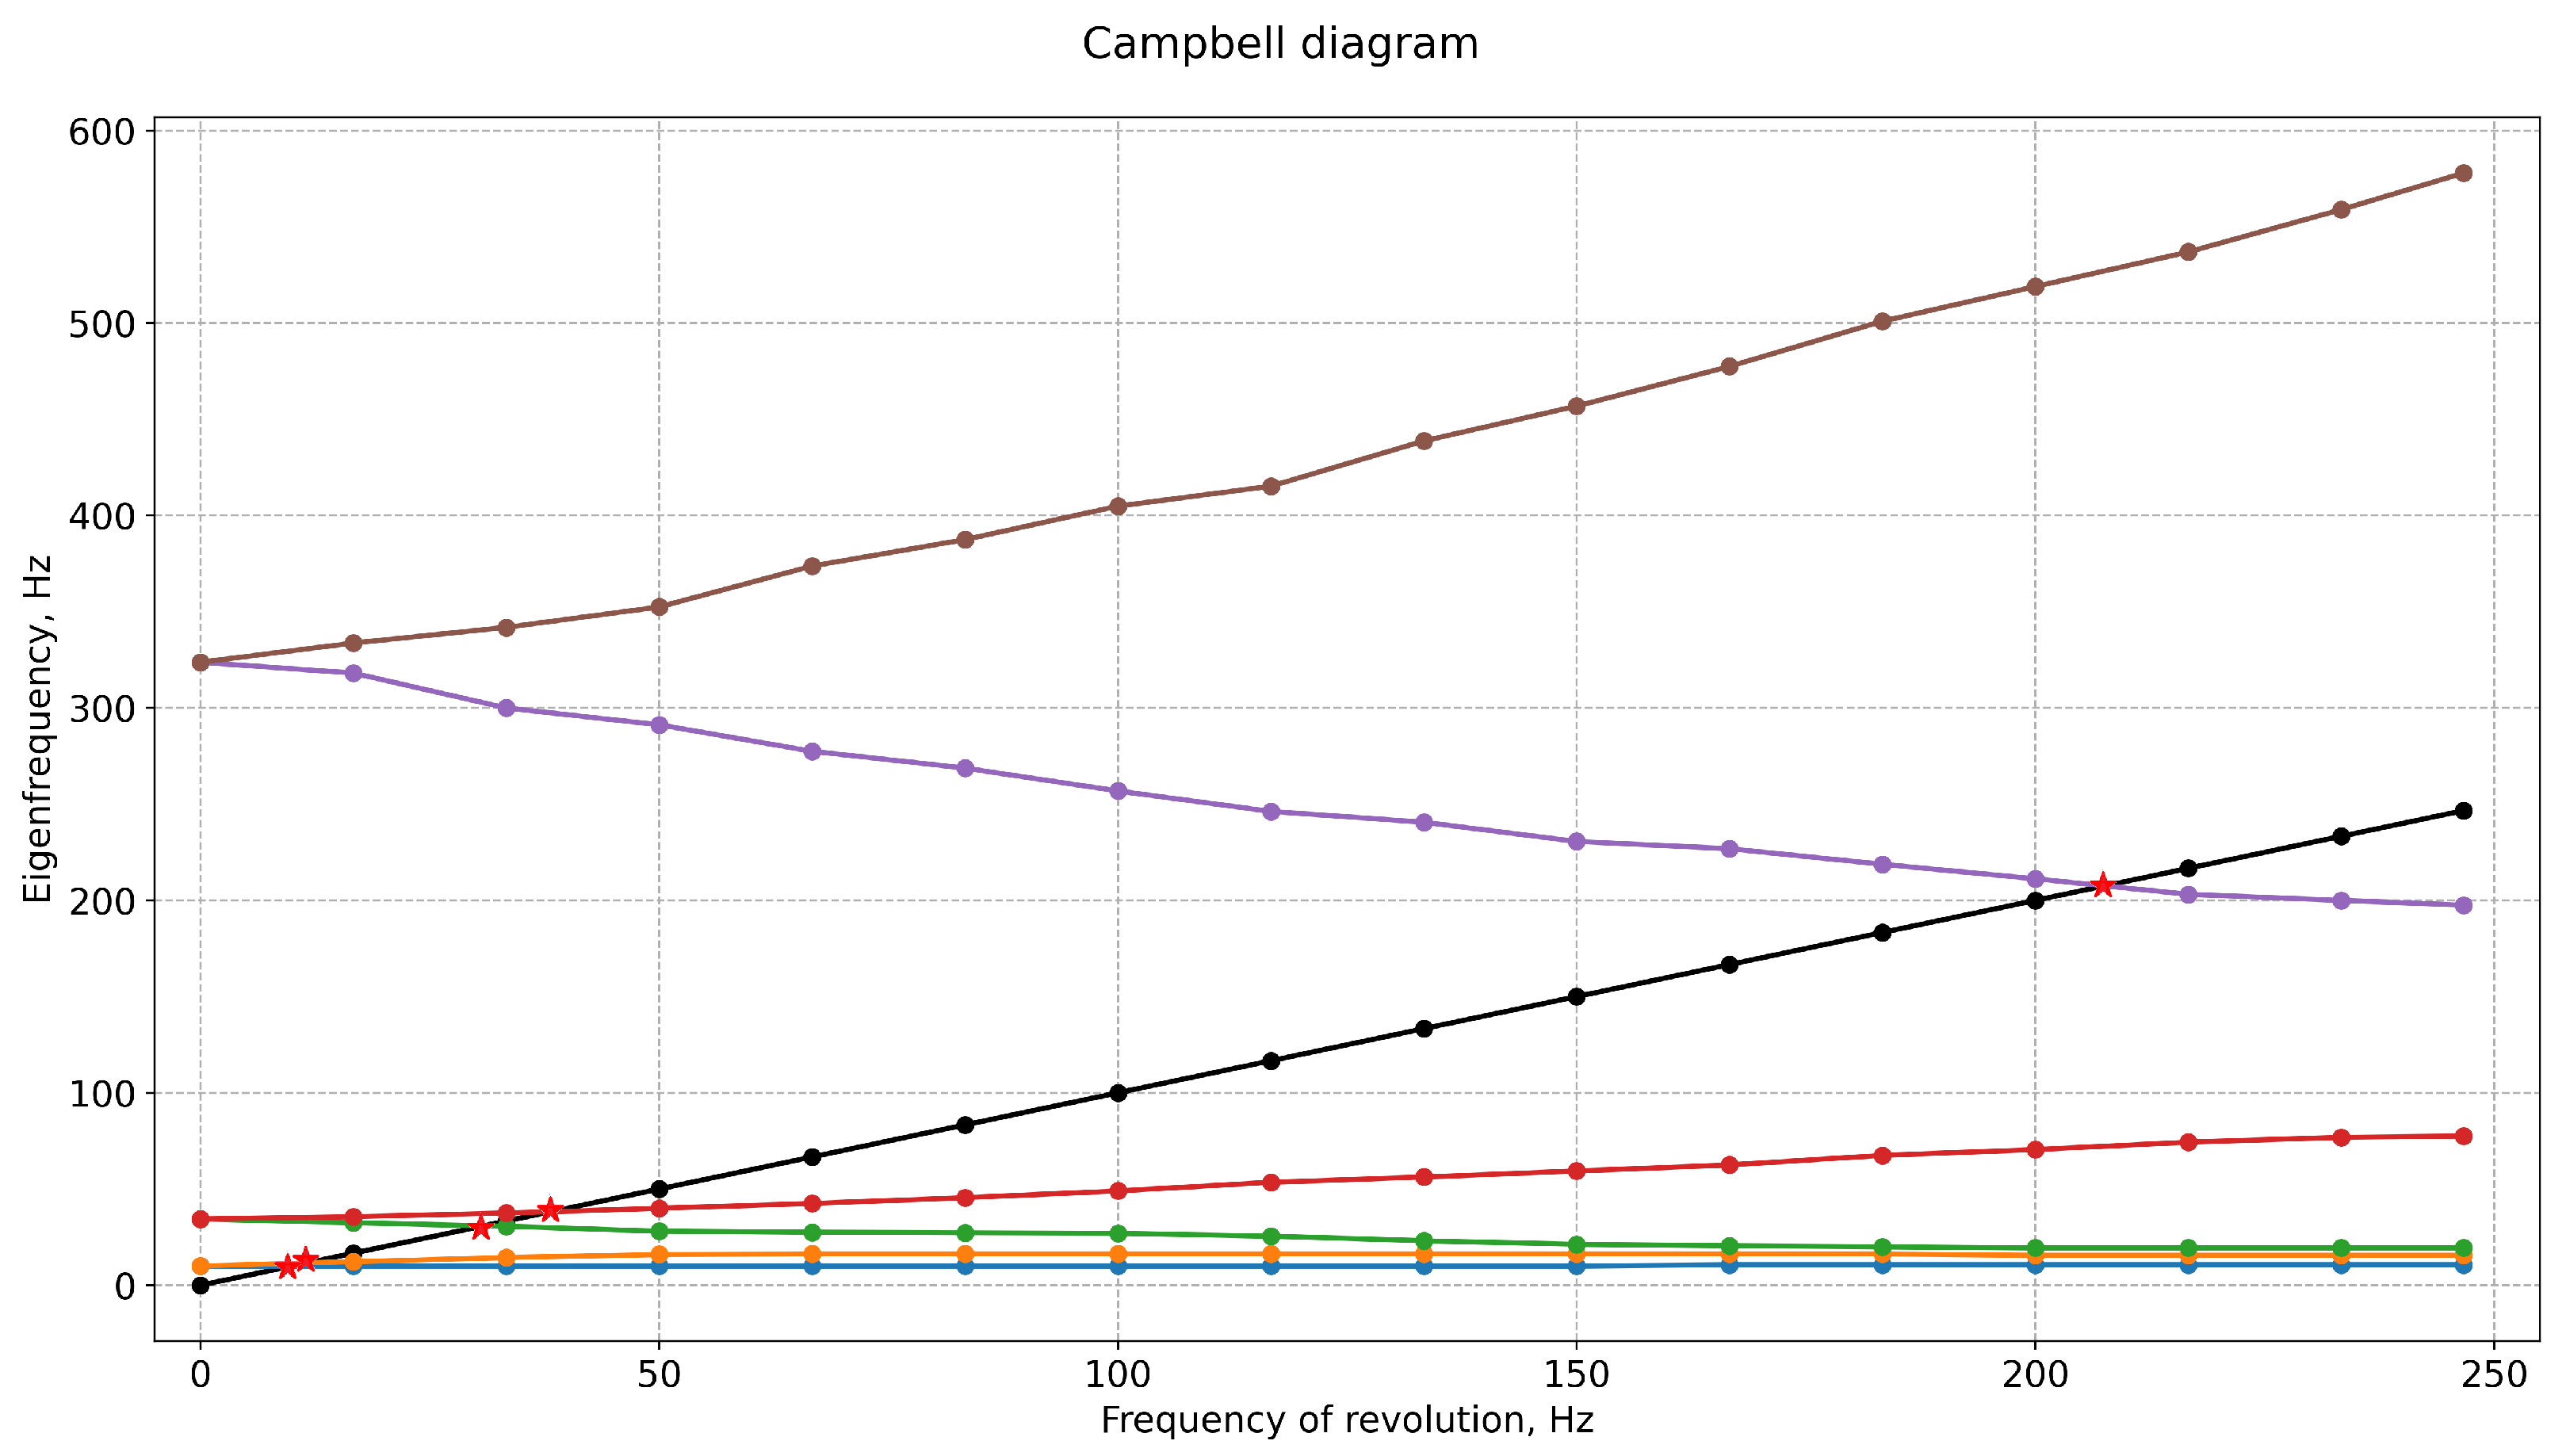
2.2. Study of Rotation at Different Frequencies
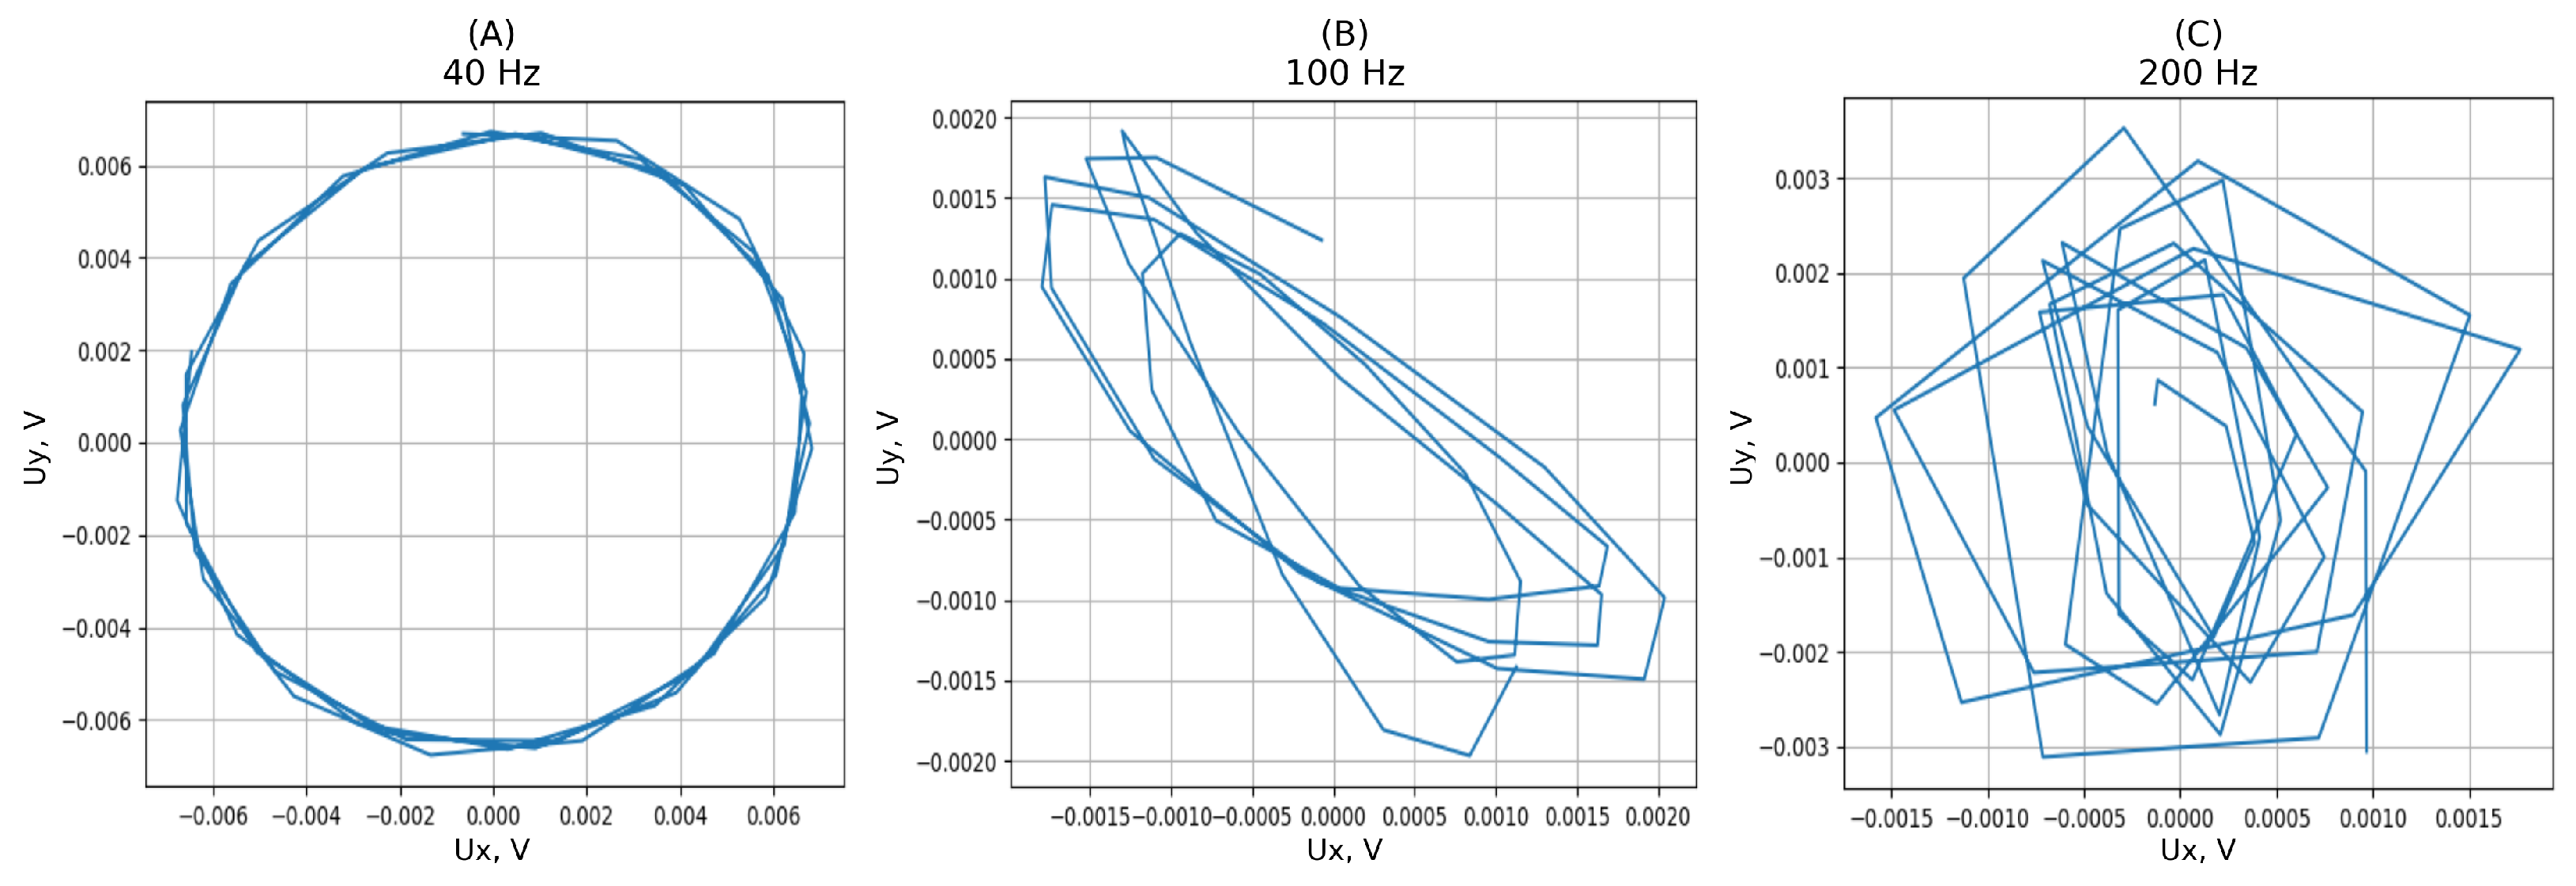
2.3. Analysis of Oscillations
2.4. Detrended Moving Average Analysis
- •
- —Long-range anticorrelated signal;
- •
- —Uncorrelated signal;
- •
- —Long-range correlated signal.
3. Results
4. Discussion
5. Conclusions
Author Contributions
Funding
Data Availability Statement
Conflicts of Interest
Appendix A

| Frequency, Hz | X, IMFO | Y, IMFO | ||
|---|---|---|---|---|
| Property | Property | |||
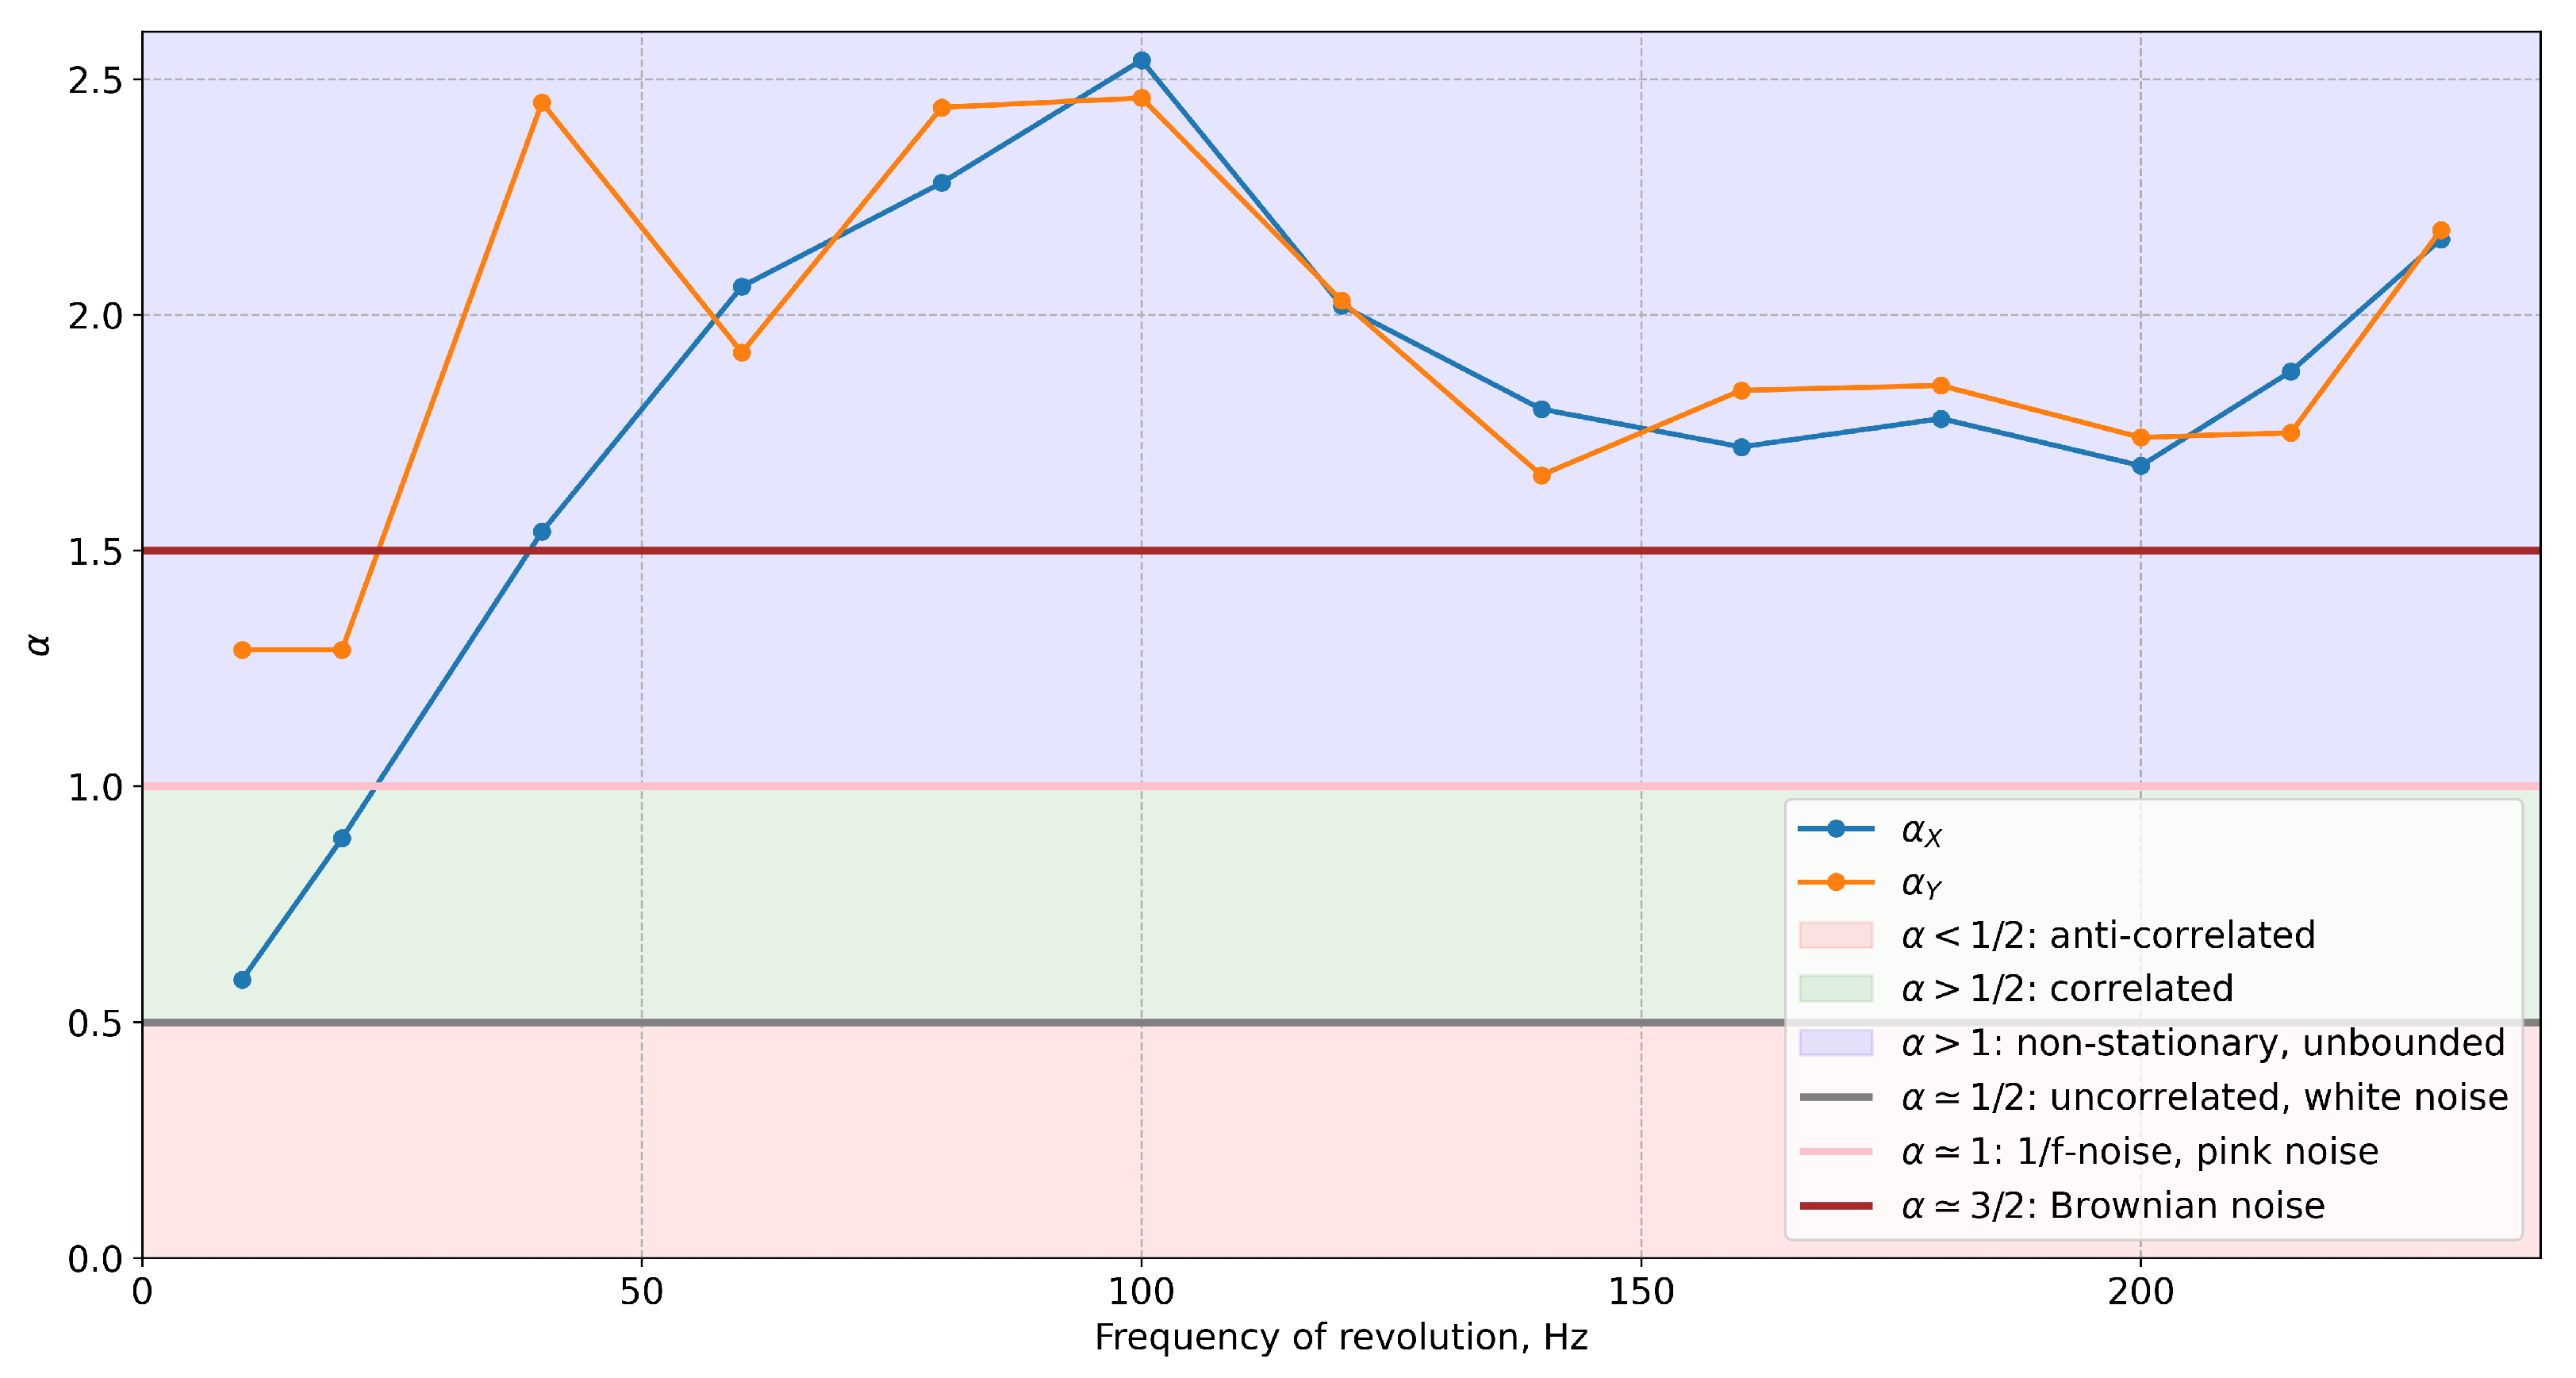
| 10 | 0.59 | Uncorrelated, white noise | 1.29 | Non-stationary, unbounded |
| 20 | 0.89 | 1/f-noise, pink noise | 1.29 | Non-stationary, unbounded |
| 40 | 1.54 | Non-stationary, unbounded | 2.45 | Non-stationary, unbounded |
| 60 | 2.06 | Non-stationary, unbounded | 1.92 | Non-stationary, unbounded |
| 80 | 2.28 | Non-stationary, unbounded | 2.44 | Non-stationary, unbounded |
| 100 | 2.54 | Non-stationary, unbounded | 2.46 | Non-stationary, unbounded |
| 120 | 2.02 | Non-stationary, unbounded | 2.03 | Non-stationary, unbounded |
| 140 | 1.8 | Non-stationary, unbounded | 1.66 | Non-stationary, unbounded |
| 160 | 1.72 | Non-stationary, unbounded | 1.84 | Non-stationary, unbounded |
| 180 | 1.78 | Non-stationary, unbounded | 1.85 | Non-stationary, unbounded |
| 200 | 1.68 | Non-stationary, unbounded | 1.74 | Non-stationary, unbounded |
| 215 | 1.88 | Non-stationary, unbounded | 1.75 | Non-stationary, unbounded |
| 230 | 2.16 | Non-stationary, unbounded | 2.18 | Non-stationary, unbounded |
| Frequency, Hz | X, IMFO | Y, IMFO | ||
|---|---|---|---|---|
| Property | Property | |||
| 10 | 2.40 | Non-stationary, unbounded | 1.32 | Non-stationary, unbounded |
| 20 | 1.89 | Non-stationary, unbounded | 0.93 | 1/f-noise, pink noise |
| 40 | 0.48 | Uncorrelated, white noise | 0.80 | 1/f-noise, pink noise |
| 60 | 1.33 | Non-stationary, unbounded | 1.01 | 1/f-noise, pink noise |
| 80 | 1.37 | Non-stationary, unbounded | 1.11 | 1/f-noise, pink noise |
| 100 | 1.31 | Non-stationary, unbounded | 1.60 | Non-stationary, unbounded |
| 120 | 1.08 | 1/f-noise, pink noise | 1.19 | 1/f-noise, pink noise |
| 140 | 1.22 | 1/f-noise, pink noise | 1.04 | 1/f-noise, pink noise |
| 160 | 1.08 | 1/f-noise, pink noise | 0.94 | 1/f-noise, pink noise |
| 180 | 0.90 | 1/f-noise, pink noise | 0.72 | Correlated |
| 200 | 1.17 | 1/f-noise, pink noise | 0.64 | Uncorrelated, white noise |
| 215 | 0.97 | 1/f-noise, pink noise | 0.69 | Uncorrelated, white noise |
| 230 | 1.14 | 1/f-noise, pink noise | 1.05 | 1/f-noise, pink noise |
References
- Fischer, J.; Strackeljan, J. Stability analysis of high speed lab centrifuges considering internal damping in rotor-shaft joints. Tech. Mech. 2006, 26, 131–147. [Google Scholar]
- De Castro, H.F.; Cavalca, K.L.; Nordmann, R. Whirl and whip instabilities in rotor-bearing system considering a nonlinear force model. J. Sound Vib. 2008, 317, 273–293. [Google Scholar] [CrossRef]
- Strackeljan, J.; Babenko, A.; Lavrenko, I. Necessary conditions of stability moving parts of rotor centrifuge. J. Mech. Eng. Natl. Tech. Univ. Ukr. Kyiv Polytech. Inst. 2014, 72, 18–23. [Google Scholar]
- Genta, G. Dynamics of Rotating Systems; Springer: New York, NY, USA, 2005. [Google Scholar]
- Babenko, A.; Lavrenko, I.; Strackeljan, J. Investigation of laboratory centrifuge motion as multibody system. J. Mech. Eng. Natl. Tech. Univ. Ukr. Kyiv Politech. Inst. 2013, 68, 186–194. [Google Scholar]
- Genta, G. On the stability of rotating blade arrays. J. Sound Vib. 2004, 273, 805–836. [Google Scholar] [CrossRef]
- Genta, G.; De Bona, F. Unbalance response of rotors: A modal approach with some extensions to damped natural systems. J. Sound Vib. 1990, 140, 129–153. [Google Scholar] [CrossRef]
- Guskov, M.; Sinou, J.-J.; Thouverez, F. Multi-dimensional harmonic balance applied to rotor dynamics. Mech. Res. Commun. 2008, 35, 537–545. [Google Scholar] [CrossRef]
- Zhang, Y.; Wang, W.; Wei, D.; Wang, G.; Xu, J.; Liu, K. Dynamic stability of unbalance-induced vibration in a turbocharger rotor-bearing system with the nonlinear effect of thermal turbulent lubricating fluid film. J. Sound Vib. 2022, 528, 116909. [Google Scholar] [CrossRef]
- Harsha, S.P. Nonlinear dynamic analysis of a high-speed rotor supported by rolling element bearings. J. Sound Vib. 2006, 290, 65–100. [Google Scholar] [CrossRef]
- Smolík, L.; Rendl, J.; Dyk, Š.; Polach, P.; Hajžman, M. Threshold stability curves for a nonlinear rotor-bearing system. J. Sound Vib. 2019, 442, 698–713. [Google Scholar] [CrossRef]
- Lee, C.-W. Evolution of Frequency-Speed Diagram in Rotating Machinery. In IUTAM Symposium on Emerging Trends in Rotor Dynamics; Springer: Dordrecht, The Netherland, 2009. [Google Scholar]
- Koutsovasilis, P. Automotive turbocharger rotordynamics: Interaction of thrust and radial bearings in shaft motion simulation. J. Sound Vib. 2019, 455, 413–429. [Google Scholar] [CrossRef]
- Patel, T.H.; Darpe, A.K. Application of Full Spectrum Analysis for Rotor Fault Diagnosis. In IUTAM Symposium on Emerging Trends in Rotor Dynamics; Springer: Dordrecht, The Netherland, 2009. [Google Scholar]
- Bonello, P. The extraction of Campbell diagrams from the dynamical system representation of a foil-air bearing rotor model. Mech. Syst. Signal Process. 2019, 129, 502–530. [Google Scholar] [CrossRef]
- Kang, Y.; Cao, S.; Hou, Y.; Chen, N. Analysis of backward whirling characteristics of a dual-rotor system caused by unbalance. Measurement 2022, 203, 111982. [Google Scholar] [CrossRef]
- Liu, Z.S.; Lu, Y.M.; Wang, Y.; Chen, E.W. Relative Coefficient Method for Rotor Balancing and Its Performing with Dynamic Signal Analyzer. Key Eng. Mater. 2004, 259–260, 751–755. [Google Scholar] [CrossRef]
- Ishida, Y.; Inoue, T.; Kagawa, T.; Ueda, M. Nonlinear Analysis and Experiments on Torsional Vibration of a Rotor with a Centrifugal Pendulum Vibration Absorber. J. Syst. Des. Dyn. 2008, 2, 715–726. [Google Scholar] [CrossRef]
- Saeed, N.A.; Eissa, M.; El-Ganini, W.A. Nonlinear oscillations of rotor active magnetic bearings system. Nonlinear Dyn. 2013, 74, 1–20. [Google Scholar] [CrossRef]
- Wang, B.; Ren, Z.; Hou, R. Study on Fault Analysis of Rotor Machinery Using Lyapunov Exponent-Fractal Dimension. In Proceedings of the International Workshop on Chaos-Fractals Theories and Applications, Shenyang, China, 6–8 November 2009; pp. 404–407. [Google Scholar] [CrossRef]
- Harsha, S.P. Nonlinear dynamic analysis of an unbalanced rotor supported by roller bearing. Chaos Solitons Fractals 2005, 26, 47–66. [Google Scholar] [CrossRef]
- Carbone, A.; Kiyono, K. Detrending moving average algorithm: Frequency response and scaling performances. Phys. Rev. E 2016, 93, 063309. [Google Scholar] [CrossRef]
- Srivastava, A.K.; Tiwari, M.; Singh, A. Identification of rotor-stator rub and dependence of dry whip boundary on rotor parameters. Mech. Syst. Signal Process. 2021, 159, 107845. [Google Scholar] [CrossRef]
- Rao, X.B.; Chu, Y.D.; Chang, Y.X.; Zhang, J.G. Fractal structures in centrifugal flywheel governor system. Commun. Nonlinear Sci. Numer. Simul. 2017, 50, 330–339. [Google Scholar] [CrossRef]
- Young, T.H.; Shiau, T.N.; Kuo, Z.H. Dynamic stability of rotor-bearing systems subjected to random axial forces. J. Sound Vib. 2007, 305, 467–480. [Google Scholar] [CrossRef]
- Drozdetskaya, O.; Fidlin, A. On the passing through resonance of a centrifugal exciter with two coaxial unbalances. Eur. J. Mech.—A/Solids 2018, 72, 516–520. [Google Scholar] [CrossRef]
- Lavrenko, I.; Khalimon, O.; Babenko, A. Dynamik und Festigkeit von hochpräzisen Zentrifugen. In Proceedings of the 12. Magdeburger Maschinenbau-Tage, Magdeburg, Germany, 30 September–1 October 2015; Otto-von-Guericke-Universität Magdeburg: Magdeburg, Germany, 2015. B5-2. [Google Scholar]
- Luo, S.; Li, J.; Li, S.; Hu, J. Dynamical analysis of the fractional-order centrifugal flywheel governor system and its accelerated adaptive stabilization with the optimality. Int. J. Electr. Power Energy Syst. 2020, 118, 105792. [Google Scholar] [CrossRef]
- Liu, Y.; Ding, D.; Ma, K.; Gao, K. Descriptions of Entropy with Fractal Dynamics and Their Applications to the Flow Pressure of Centrifugal Compressor. Entropy 2019, 21, 266. [Google Scholar] [CrossRef]
- Liu, X.; Sun, B.; Jiang, J.; Zhang, W.; Zhao, C.; Zhao, Y.; Mao, B.; Li, J.; Wang, Z. Convolution Diagnosis Model of Centrifugal Pump Based on Fractal Dimension. J. Phys. Conf. Ser. 2021, 2095, 012061. [Google Scholar] [CrossRef]
- Genta, G. A fast model technique for the computation of the Campbell diagram of multi-degree-of-freedom rotors. J. Sound Vib. 1992, 155, 385–402. [Google Scholar] [CrossRef]
- Diken, H. Non-linear vibration analysis and subharmonic whirl frequencies of the Jeffcott rotor model. J. Sound Vib. 2001, 243, 117–125. [Google Scholar] [CrossRef]
- Available online: https://docs.scipy.org/doc/scipy/reference/generated/scipy.signal.welch.html (accessed on 8 January 2024).
- Lei, Y.; Lin, J.; He, Z.; Zuo, M.J. A review on empirical mode decomposition in fault diagnosis of rotating machinery. Mech. Syst. Signal Process. 2013, 35, 108–126. [Google Scholar] [CrossRef]
- Huang, N.E.; Shen, Z.; Long, S.R.; Wu, M.C.; Shih, H.H.; Zheng, Q.; Yen, N.C.; Tung, C.C.; Liu, H.H. The empirical mode decomposition and the Hilbert spectrum for nonlinear and non-stationary time series analysis. Proc. R. Soc. Lond. A 1998, 454, 903–995. [Google Scholar] [CrossRef]
- Available online: https://pypi.org/project/emd/ (accessed on 8 January 2024).
- Seleznov, I.; Zyma, I.; Kiyono, K.; Tukaev, S.; Popov, A.; Chernykh, M.; Shpenkov, O. Detrended Fluctuation, Coherence, and Spectral Power Analysis of Activation Rearrangement in EEG Dynamics During Cognitive Workload. Front. Hum. Neurosci. 2019, 13, 270. [Google Scholar] [CrossRef]
- Qin, J.; Lin, M. Multi-scale regression based on detrending moving average and its application to seismic data. Int. J. Mod. Phys. 2023, 34, 2350030. [Google Scholar] [CrossRef]
- Ponta, L.; Carbone, A.; Cincotti, S. Detrending Moving Average Algorithm: Quantifying Heterogeneity in Financial Data. In Proceedings of the IEEE 41st Annual Computer Software and Applications Conference (COMPSAC), Turin, Italy, 4–8 July 2017; pp. 395–400. [Google Scholar] [CrossRef]
- Savitzky, A.; Golay, M.J. Smoothing and differentiation of data by simplified least squares procedures. Anal. Chem. 1964, 36, 1627–1639. [Google Scholar] [CrossRef]
- Tsujimoto, Y.; Miki, Y.; Shimatani, S.; Kiyono, K. Fast algorithm for scaling analysis with higher-order detrending moving average method. Phys. Rev. E 2016, 93, 053304. [Google Scholar] [CrossRef] [PubMed]
- Babenko, A.; Lavrenko, I.; Kurenkov, N. Influence of gyroscopic effect on fluctuations of the centrifuge shaft. J. Mech. Eng. Natl. Tech. Univ. Ukr. Kyiv Polytech. Inst. 2013, 68, 166–174. [Google Scholar]
- Rao, J.S.; Shiau, T.N.; Chang, J.R. Theoretical analysis of lateral response due to torsional excitation of geared rotors. Mech. Mach. Theory 1998, 33, 761–783. [Google Scholar] [CrossRef]
- Seleznov, I.; Popov, A.; Kikuchi, K.; Kolosova, E.; Kolomiiets, B.; Nakata, A.; Kaneko, M.; Kiyono, K. Detection of oriented fractal scaling components in anisotropic two-dimensional trajectories. Sci. Rep. 2020, 10, 21892. [Google Scholar] [CrossRef]
- Available online: https://en.wikipedia.org/wiki/Detrended_fluctuation_analysis (accessed on 8 January 2024).


| Parameters of the Centrifuge | Value |
|---|---|
| Continuous operation time, min | 99, in 1 min step |
| Dimensions (W × D × H), mm | 225 × 243 × 352 |
| Maximum acceleration value, g | 21,100 |
| Max. centrifuge volume, mL | 24 × 2 |
| Max. speed, rpm | 14,800 |
| Max. noise, dB | 56 |
| Weight, kg | 11 |
| Timer, min | 1 … 99 |
| Voltage, V | 220 |
Disclaimer/Publisher’s Note: The statements, opinions and data contained in all publications are solely those of the individual author(s) and contributor(s) and not of MDPI and/or the editor(s). MDPI and/or the editor(s) disclaim responsibility for any injury to people or property resulting from any ideas, methods, instructions or products referred to in the content. |
© 2024 by the authors. Licensee MDPI, Basel, Switzerland. This article is an open access article distributed under the terms and conditions of the Creative Commons Attribution (CC BY) license (https://creativecommons.org/licenses/by/4.0/).
Share and Cite
Lavrenko, I.; Popov, A.; Seleznov, I.; Kiyono, K. Fractal Analysis of the Centrifuge Vibrograms. Fractal Fract. 2024, 8, 60. https://doi.org/10.3390/fractalfract8010060
Lavrenko I, Popov A, Seleznov I, Kiyono K. Fractal Analysis of the Centrifuge Vibrograms. Fractal and Fractional. 2024; 8(1):60. https://doi.org/10.3390/fractalfract8010060
Chicago/Turabian StyleLavrenko, Iaroslav, Anton Popov, Ivan Seleznov, and Ken Kiyono. 2024. "Fractal Analysis of the Centrifuge Vibrograms" Fractal and Fractional 8, no. 1: 60. https://doi.org/10.3390/fractalfract8010060
APA StyleLavrenko, I., Popov, A., Seleznov, I., & Kiyono, K. (2024). Fractal Analysis of the Centrifuge Vibrograms. Fractal and Fractional, 8(1), 60. https://doi.org/10.3390/fractalfract8010060