Article

Full-Scale Pore Structure Characterization and Its Impact on Methane Adsorption Capacity and Seepage Capability: Differences between Shallow and Deep Coal from the Tiefa Basin in Northeastern China

1
State Key Laboratory for GeoMechanics and Deep Underground Engineering, Beijing 100083, China
2
School of Mechanics, Architecture and Civil Engineering, China University of Mining and Technology, Beijing 100083, China
*
Author to whom correspondence should be addressed.
Fractal Fract. 2024, 8(1), 48; https://doi.org/10.3390/fractalfract8010048
Submission received: 23 November 2023 / Revised: 21 December 2023 / Accepted: 6 January 2024 / Published: 12 January 2024

Abstract

:
Deep low-rank coalbed methane (CBM) resources are numerous and widely distributed in China, although their exploration remains in its infancy. In this work, gas adsorption (N2/CO2), mercury intrusion porosimetry, and 3D CT reconstruction were performed on five coal samples of deep and shallow low-rank coal from northeast China to analyze their pore structure. The impact of the features in the pore structure at full scale on the capacity for methane adsorption and seepage is discussed. The results indicate that there are significant differences between deep low-rank coal and shallow low-rank coal in terms of porosity, permeability, composition, and adsorption capacity. The full-scale pore distribution was dispersed over a broad range and exhibited a multi-peak distribution, with the majority of the peak concentrations occurring between 0.45–0.7 nm and 3–4 nm. Mesopores are prevalent in shallow coal rock, whereas micropores are the most numerous in deep coal rock. The primary contributors to the specific surface area of both deep and superficial coal rock are micropores. Three-dimensional CT reconstruction can characterize pores with pore size greater than 1 μm, while the dominating equivalent pore diameters (Deq) range from 1 to 10 μm. More mini-scale pores and fissures are observed in deep coal rock, while shallow coal rock processes greater total and connection porosity. Multifractal features are prevalent in the fractal qualities of all the numbered samples. An enhancement in pore structure heterogeneity occurs with increasing pore size. The pore structure of deep coal rock is more heterogeneous. Furthermore, methane adsorption capacity is favorably connected with D1 (0.4 nm < pore diameter ≤ 2 nm), D2 (2 nm < pore diameter ≤ 5 nm), micropore volume, and specific surface area and negatively correlated with D3 (5 nm < pore diameter ≤ 50 nm), showing that methane adsorption capability is primarily controlled by micropores and mesopores. Methane seepage capacity is favorably connected with the pore volume and connected porosity of macropores and negatively correlated with D4 (pore diameter > 50 nm), indicating that the macropores are the primary factor influencing methane seepage capacity.

1. Introduction

As the interest in coalbed methane (CBM) discovery has grown, deep low-rank coal has emerged as a center of inquiry due to its numerous CBM resources [1]. China possesses abundant low-rank CBM deposits, of which the deep CBM resources with a burial depth of more than 1000 m account for more than half of the total CBM, with excellent development potential. These deposits have tremendous development potential and are exemplified by the Liaoning Tiefa mining area, a typical distribution area for low-rank coal in China. On account of the complicated attributes of deep coal reservoirs, the investigation for deep low-rank coal resources is still in its nascent stages.
Low-rank coal is defined by maximum vitrinite/humus reflectance (Ro,max) < 0.65% [2]. Pores are classified by the International Union of Pure and Applied Chemistry (IUPAC) as follows: micropores (2 nm), mesopores (2–50 nm), and macropores (>50 nm) [3]. The adsorption and desorption of CBM, as well as its diffusion and seepage, are all controlled by the different sizes of the pore structure, which is a crucial element regulating gas migration [4]. Hence, accurately understanding the behavior of methane storage and seepage demands in-depth study and mastery of the full-scale coal pore structure. Moreover, the complexity of the pore structure features of deep low-rank coal surpasses those of shallow low-rank coal, which is affected by the complicated geological environment of high ground pressure, high ground temperature, and high gas pressure.
Recently, a variety of experimental methodologies have been implemented to clarify the pore structure of coal, including field-emission scanning electron microscopy (FE-SEM), X-ray computed tomography (CT), mercury intrusion porosimetry (MIP), gas adsorption (N2/CO2), and nuclear magnetic resonance (NMR) [5,6,7,8,9]. Mandelbrot introduced fractal theory in 1975 to represent the pore structure of porous media. Since then, the theory has been widely implemented to investigate the irregularities and surface roughness of reservoir rocks [10,11,12,13,14,15]. Numerous researchers have recently discovered that fractal theory can characterize pore structure heterogeneity with pore structure characterization techniques [16,17,18,19]. Moreover, methane adsorption and seepage capacity are dramatically impacted by the heterogeneity in pore structures. On the one hand, the surface fractal dimension is a critical petrophysical metric for evaluating the association between methane adsorption and pore structure [20,21]. On the other hand, the heterogeneity in and connectivity of meso- and macropores will alter the seepage capacity [7,22].
Many scholars have conducted research on coal rocks by combining pore structure characterization techniques and fractal theory, yielding a series of research findings. Song et al. [23], using gas adsorption and fractal theory, examined the pore structure and fractal features of low- to medium-rank structurally deformed coals in the Huaibei Coalfield. They found that the pore structure exhibited distinct multifractal characteristics. Jiang et al. [24] investigated the pore structure properties of five distinct medium- to high-rank coals in northern China using gas adsorption and MIP testing. Their analysis revealed that semi-anthracite coals predominantly contained nanopores, with a decreasing trend as coal rank increased. Additionally, they found that nanopores were influenced by coalification jumps. Nie et al. [25] investigated the pore structure of 11 coals exhibiting varying levels of metamorphism using N2 adsorption and SEM testing. They discovered significant differences in pore structure properties among coals that underwent different levels of metamorphism. As coalification deepened, low-rank coals experienced a reduction in the quantity of mesopores, whereas high-rank coals predominantly demonstrated an increase in the quantity of micropores. At present, scholarly investigations predominantly center on the pore structure attributes of coal rocks spanning various coal ranks. Nevertheless, comparative analyses of pore structures at diverse depths within coal rocks are conspicuously scarce. In addition, integrated visualization methods for characterization are lacking, and gas intrusion techniques are the predominant methods utilized to characterize pore structures.
This study seeks to comprehensively characterize the pore structure, pore size distribution (PSD), and fractal features of low-rank coal rocks at different depths in the Tiefu Basin using N2/CO2 adsorption, MIP, and CT techniques combined with fractal theory. It also conducts a comparative analysis of the pore structure features of deep and shallow low-rank coal rocks to clarify the influence of deep-seated effects on the pore structure of low-rank coal rocks. Additionally, this paper discusses the impact of pore structure parameters on methane adsorption and permeability. The research results can serve as a theoretical basis for future studies on coalbed gas flow and migration in this field.

2. Materials and Methods
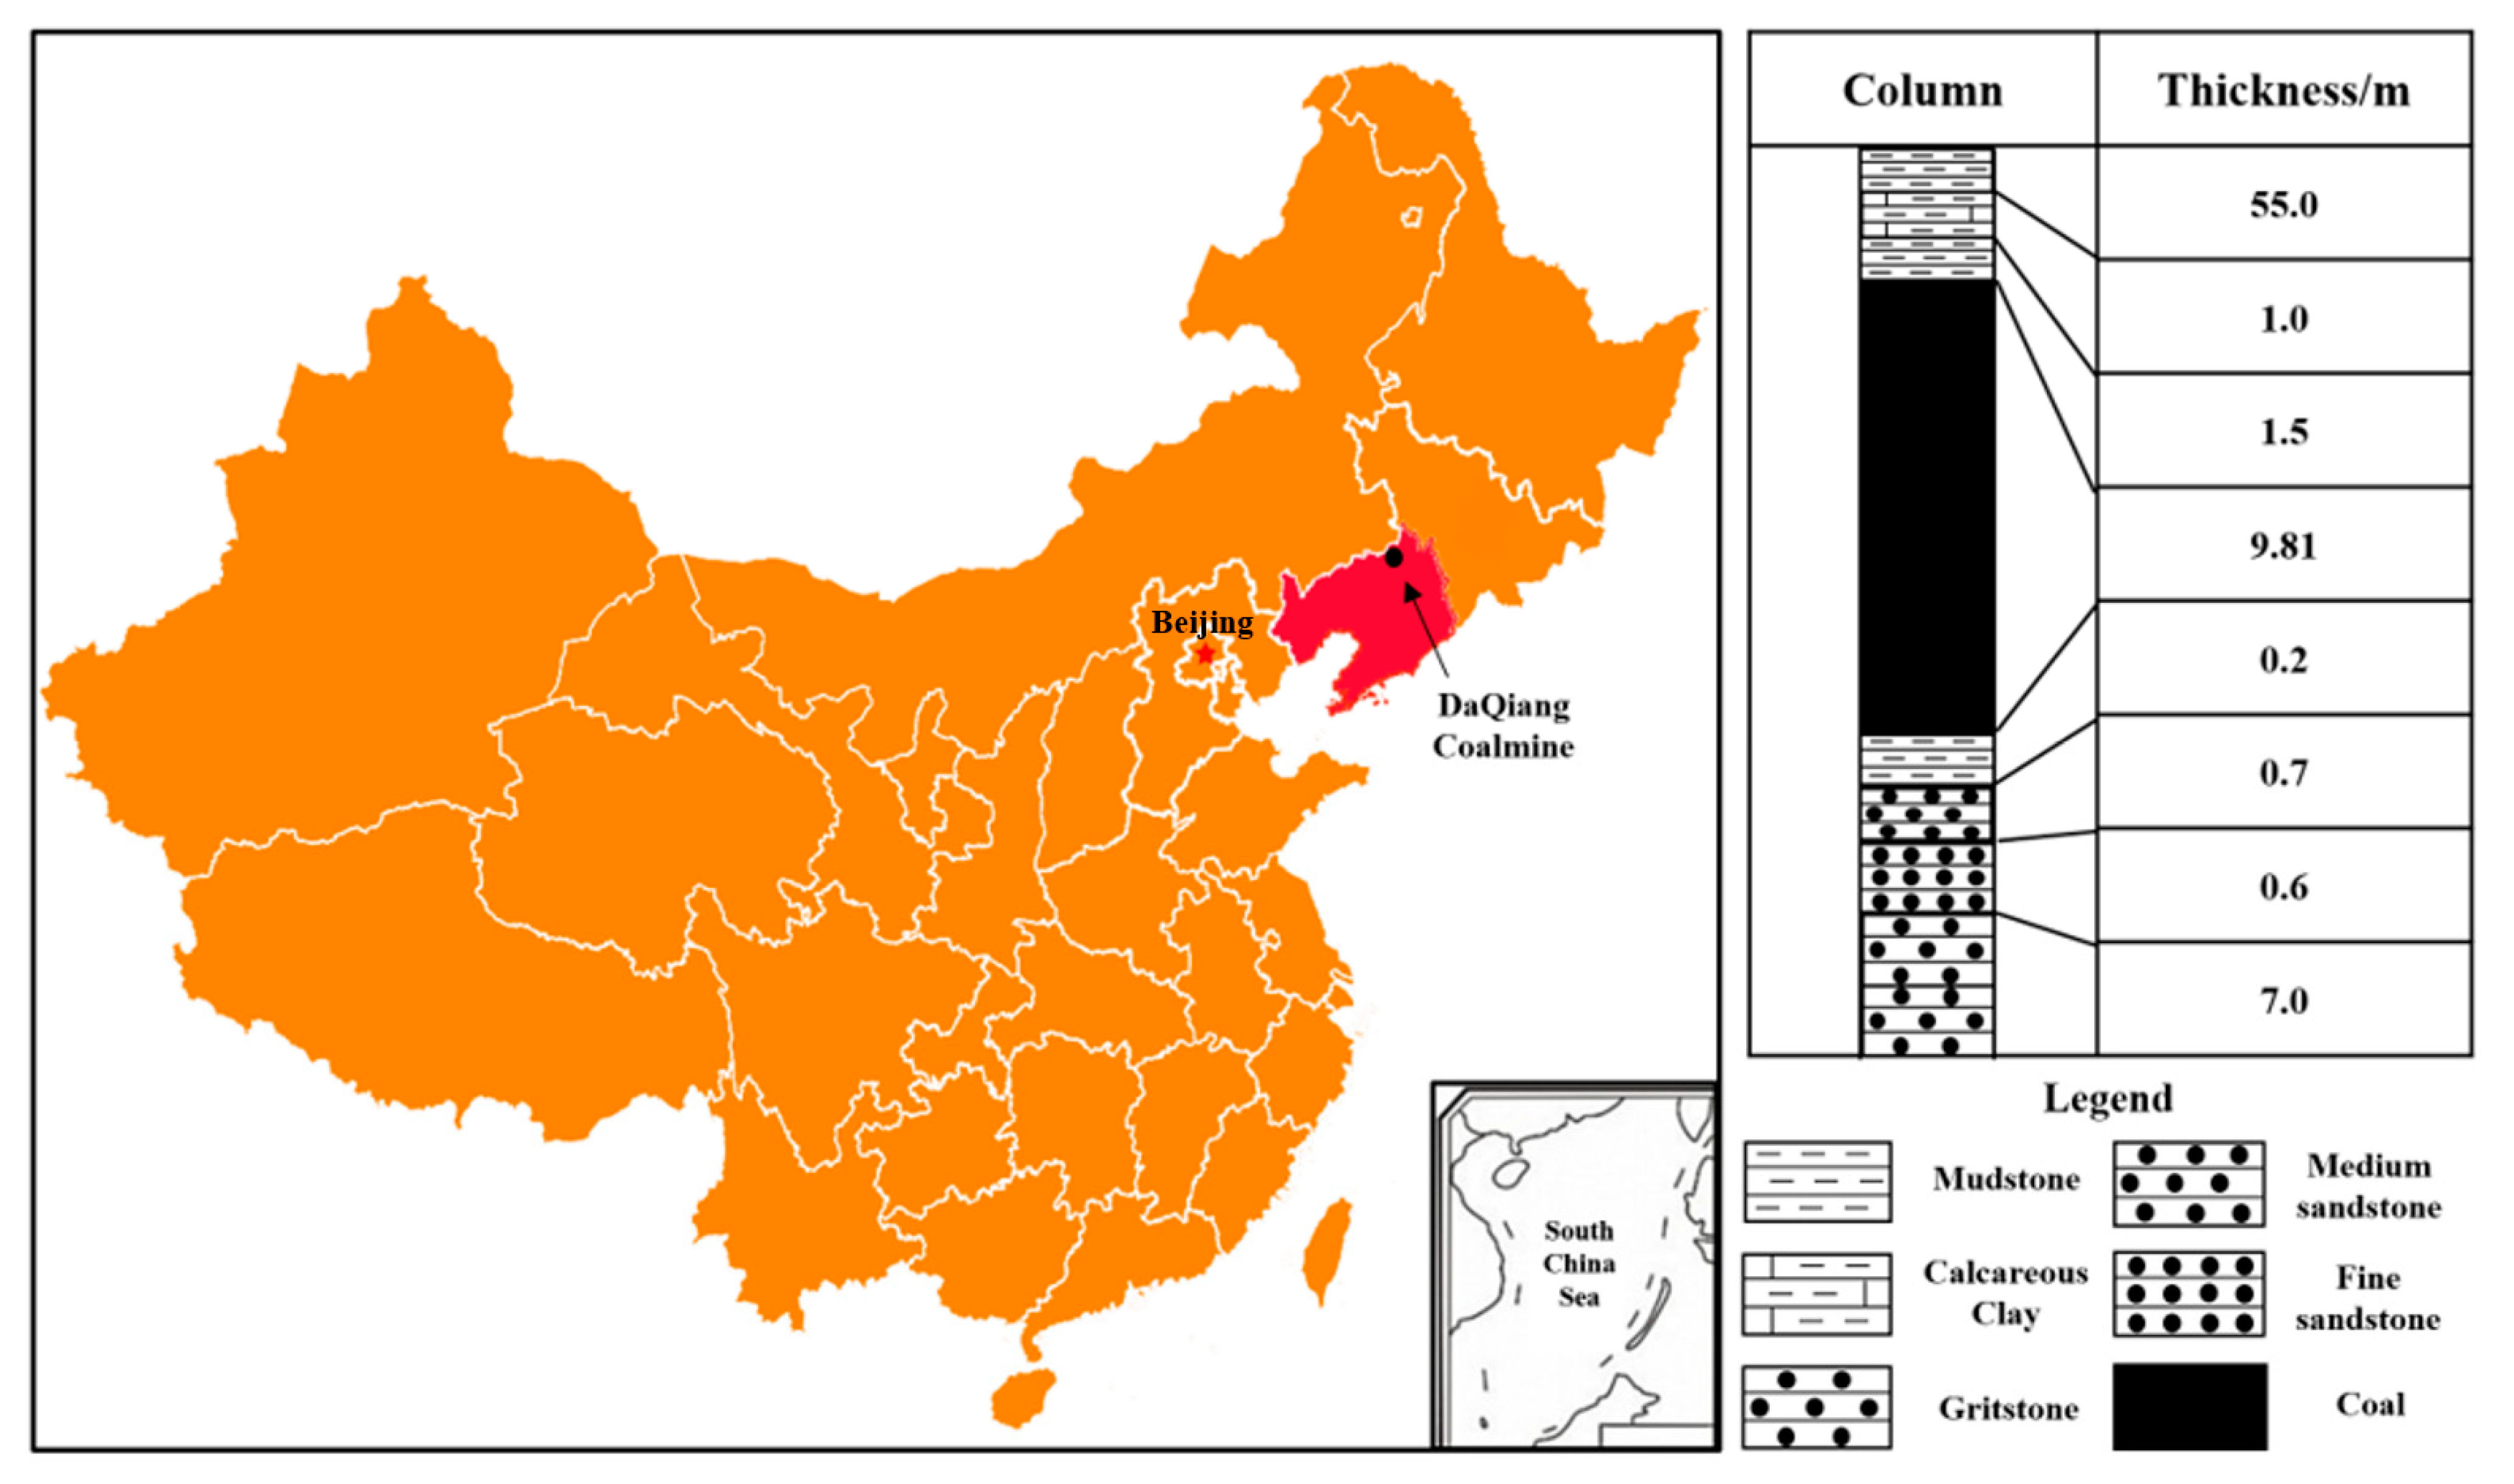
2.1. Sampling

The investigation location is shown in Figure 1, which depicts the Daqiang Coal Mine of Tiefa Coalfield in Liaoning Province, China. In the research area, five coal samples were gathered, with two deep coal strata (DQ1 and DQ2) collected from working faces buried at a depth of 1100 to 1200 m, while three shallow coal strata (DQ3, DQ4, and DQ5) were gathered from working faces buried at a depth of 400 to 500 m. Following the selection procedure, coal samples were placed in self-sealing containers and promptly filled with wax prior to their disposal on the ground.
A Leitz MPV-3 photometer microscope was utilized to evaluate the reflectance of coal maceral and vitrinite (Ro, max, %) based on China National Standards GB/T 6948-2008 [26] and GB/T 8899-2013 [27]. Based on the ISO 17246-2010 [28] standard, the proximate analysis has been carried out utilizing an Automatic Proximate Analyzer SDTGA5000, (Usetco, Bangkok, Thailand). The Vari-MICRO elemental analyzer was used to conduct elementary analysis based on China National Standards GB/T 19143-2017 [29]. The porosities (φ) were assessed using helium porosimetry as well as a permeability testing instrument to measure the permeability (K) by passing high-purity nitrogen through the coal samples, both following the China National Standards GB/T 29172-2012 [30].

2.2. N2 Adsorption/Desorption, CO2 Adsorption, and CH4 Isotherm Adsorption Analysis

The principle of the gas adsorption method is to collect an adsorption isotherm by recording the amount of gas adsorption under different pressures. Then, the surface properties and PSD can be measured according to the morphological changes in the adsorption isotherm, which is suitable for measuring micropores and mesopores [21].
Micromeritics ASAP 2460 (Micromeritics, Norcross, GA, USA) was used to conduct gas (N2/CO2) adsorption/desorption analysis based on China National Standards GB/T 21650.3-2011 [31]. The temperatures at which these analyses were carried out were 77 K and 273 K, respectively. With a relative pressure range of 0 to 0.995, which reflects pore-throat diameters of 1 nm to 100 nm, N2 adsorption isotherms were determined, and on this basis, the mesopores volume and specific surface area were inferred utilizing Barrett–Joyner–Halenda (BJH) and Brunauer–Emmett–Teller (BET) models [32], respectively.
Meanwhile, with the relative pressure of 0.0001–0.032, the CO2 adsorption isotherms were estimated, which corresponds to pore diameters from 0.35 nm to 1.5 nm. On this basis, the micropore volume and specific surface area were inferred utilizing the density functional theory (DFT) model [24]. The Langmuir volume and pressure were determined by performing a methane isotherm adsorption analysis at 30 °C and 15 Mpa using Micromeritics ASAP 2460 based on China National Standards GB/T 19560-2008 [33].

2.3. MIP Measurements and CT Measurements

MIP tests were conducted with an AutoPore IV 9500 Porosimeter (Micromeritics, Norcross, GA, USA) to measure PSD curves and other metrics. Based on the Chinese Oil and Gas Industry Standard, the numbered samples were subjected to mercury injection pressure steps ranging from 0.5 to 60,000 psia, representing pore-throat diameters spanning from 3 nm to 365 μm. Then, pore structure attributes were acquired using MIP analyses (Equation (1)).
P c = 2 σ cos θ r
where Pc refers to capillary pressure (MPa), θ refers to the contact angle (°), r refers to pore radius (μm), and σ refers to surface tension.
Xradia 520 Versa high-resolution 3D X-ray microscope CT scanning (Keyence, Osaka, Japan) equipment was used to scan the five coal samples. Prior to undertaking the CT experiment, it was essential to perform MIP experiments on the sample to acquire the pore size distribution properties. An appropriate CT resolution was selected for the three-dimensional reconstruction of the macropore structures in accordance with the outcomes of the MIP investigations. Following this, 2000 CT images with a resolution of 1 μm were obtained with a pixel size of 2500 × 2500.

2.4. Fractal Theory

The Frenkel–Halsey–Hill (FHH) model, which considers capillary coagulation and multimolecular layer adsorption, is commonly utilized to calculate the fractal dimension of mesopores [34]. This dimension is specified by Equation (2). The estimation of the fractal dimension is given in Equation (3).
ln V = C + A l n l n P 0 P
D n = A + 3
where P refers the equilibrium pressure, Mpa; P0 refers the saturation pressure of methane gases, MPa; C refers to a constant; V refers to the adsorption volume at the equilibrium pressure p, cm3/g, and A refers to the slope of the curve. Dn is the fractal dimension of mesopores and can be further divided into D2 (2 nm < pore diameter ≤ 5 nm) and D3 (5 nm < pore diameter ≤ 50 nm).
Adsorbate molecules usually undergo micropore filling in micropores, which is different from the adsorption behavior under mesoporous conditions [18]. Therefore, this paper calculates the fractal dimension of micropores using the Sierpinski fractal model. The fractal dimension was determined [23]:
ln V = 3 D 1 ln P P t + l n α
where P, Pt, V, and α refer to the experimental pressure, MPa; the threshold pressure, MPa; the adsorption volume, cm3/g; and the fitting constant. D1 is the fractal dimension of micropores.
The estimation of the fractal dimension of macropores is possible with MIP data [35], as illustrated below, in accordance with fractal geometry [11]:
S H g = r r m a x 3 D M I P
Equation (5) may be expressed in the following manner:
l o g S H g = 3 D 4 l o g r + D 4 3 l o g r m a x
where r, rmax, SHg, and D4 refer to pore size radius, μm; maximum pore size radius, μm; cumulative pore volume (<r), %; and the fractal dimension of macropores, respectively.

3. Results

3.1. Coal Characteristics

Table 1 lists the statistical table of the test results, in which the average Ro,max of coal samples is 0.61% with a range of 0.58–0.64%. The porosity of the investigated samples varies extremely, with low permeability. The average porosity as well as the permeability of deep low-rank coal are 3.51% and 0.0219 mD, respectively. In contrast, shallow low-rank coal possesses an average porosity of 12.94% and a permeability of 0.588 mD. The porosity and permeability of deep coal rock are significantly decreased when compared with those of shallow coal rock. Furthermore, substantial variations in composition can be noticed between shallow and deep coal rock. Shallow coal rock exhibits a marginally higher moisture content (Mad) in comparison with deep coal rock, whereas its volatile matter (VMad) content is marginally lower. Shallow coal rock demonstrates a notably elevated ash content (Aad) in comparison with deep coal rock, whereas its fixed carbon (FCad) content is conspicuously diminished.
Moreover, high-pressure adsorption volumetric measurements were utilized to estimate methane adsorption [35], as shown in Figure 2a. In contrast to shallow coal rock, which has an average Langmuir volume (VL) of 17.18 cm3/g and an average Langmuir pressure (PL) of 1.96 MPa, deep coal rock displays an average VL and PL of 22.57 cm3/g and 2.03 MPa, respectively. The VL and PL of deep coal rock are significantly greater in comparison with shallow coal rock. Figure 2 shows that methane adsorption capacity inconspicuously correlates with Ro,max (Figure 2b) but negatively correlates with moisture content (Figure 2c), which is related to the competitive adsorption of H2O and CH4. Due to complex geological processes occurring in the depths of the earth, there is no correlation between adsorption content and Ro,max. Although deep and shallow coal rocks contain comparable Ro,max, they differ considerably in terms of adsorption content. Methane adsorption locations are overtaken by water molecules, thereby reducing methane adsorption.
In addition, the data for W-1 to W-6 in Table 1 are derived from previous studies on Panji low-rank coal [20]. As shown in Table 1, the adsorption capacity of Panji deep low-rank coal is similar to that of Tiefa shallow low-rank coal, while Tiefa deep low-rank coal has a significantly higher micropore content and more robust methane adsorption capacity. This could be due to the more pronounced structural effects in the Tiefa Basin, which significantly impact the coal pore structure, resulting in more micropores in Tiefa deep low-rank coal and providing more advantageous binding sites for methane adsorption.

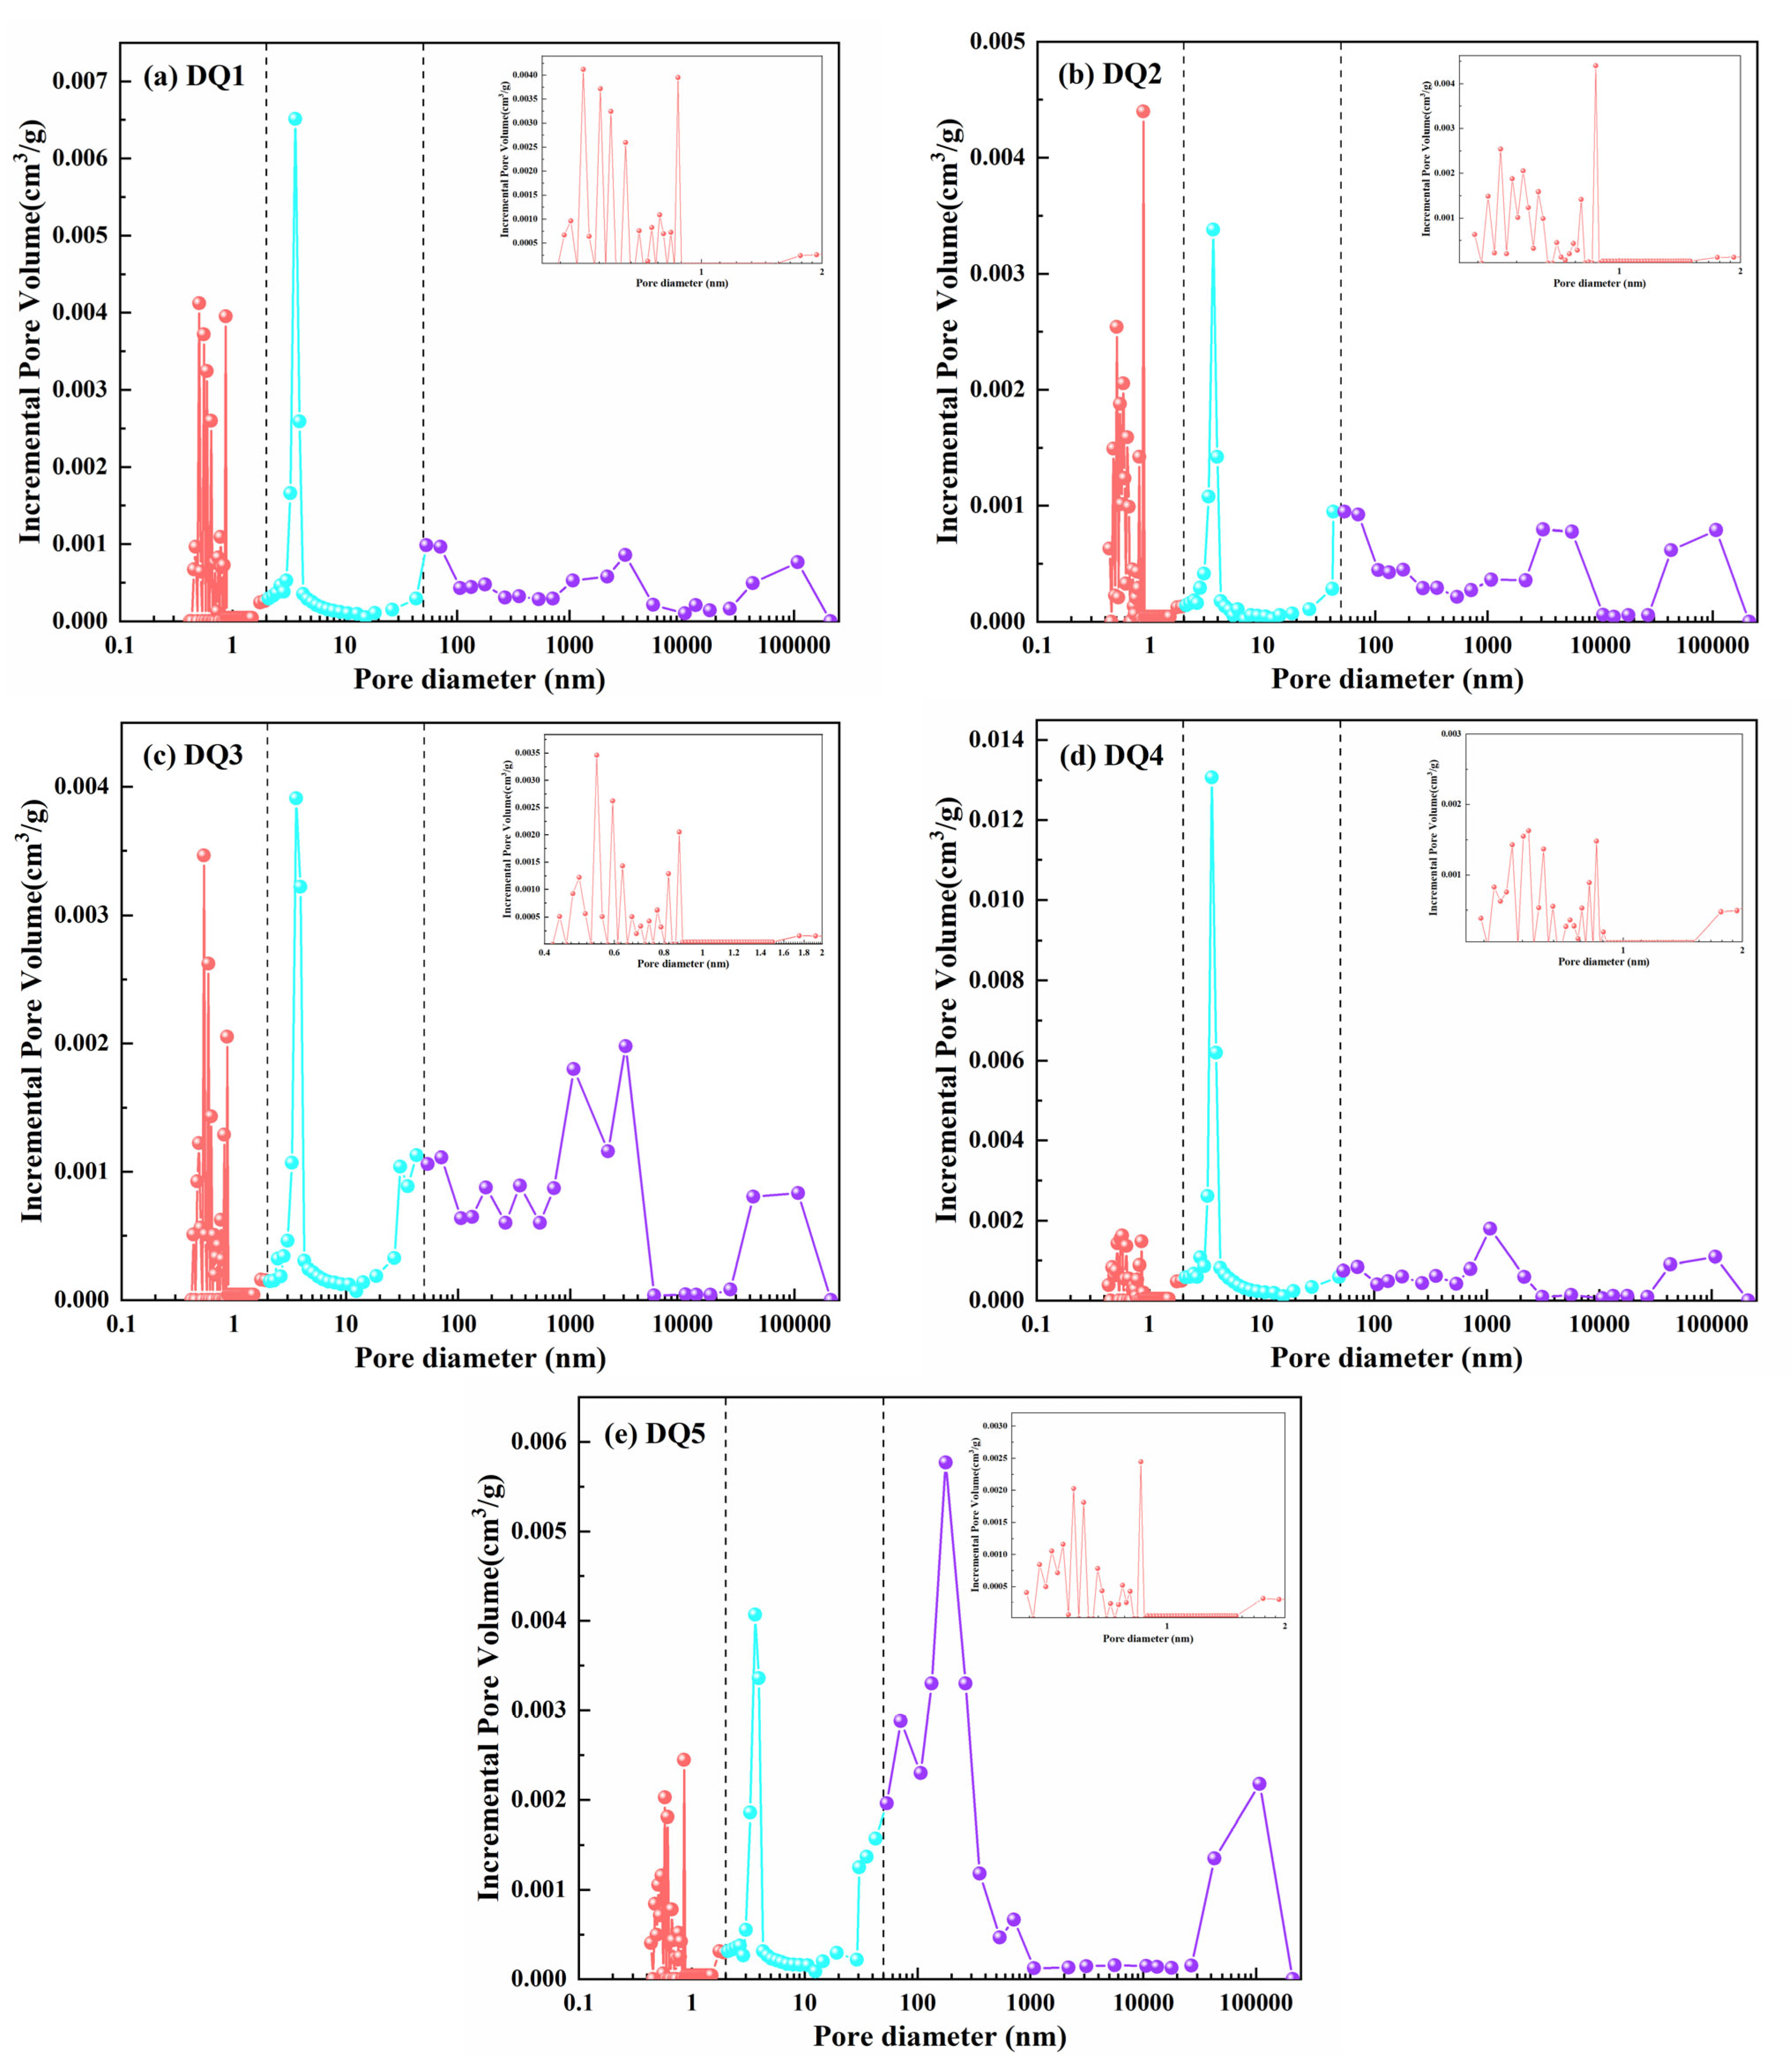
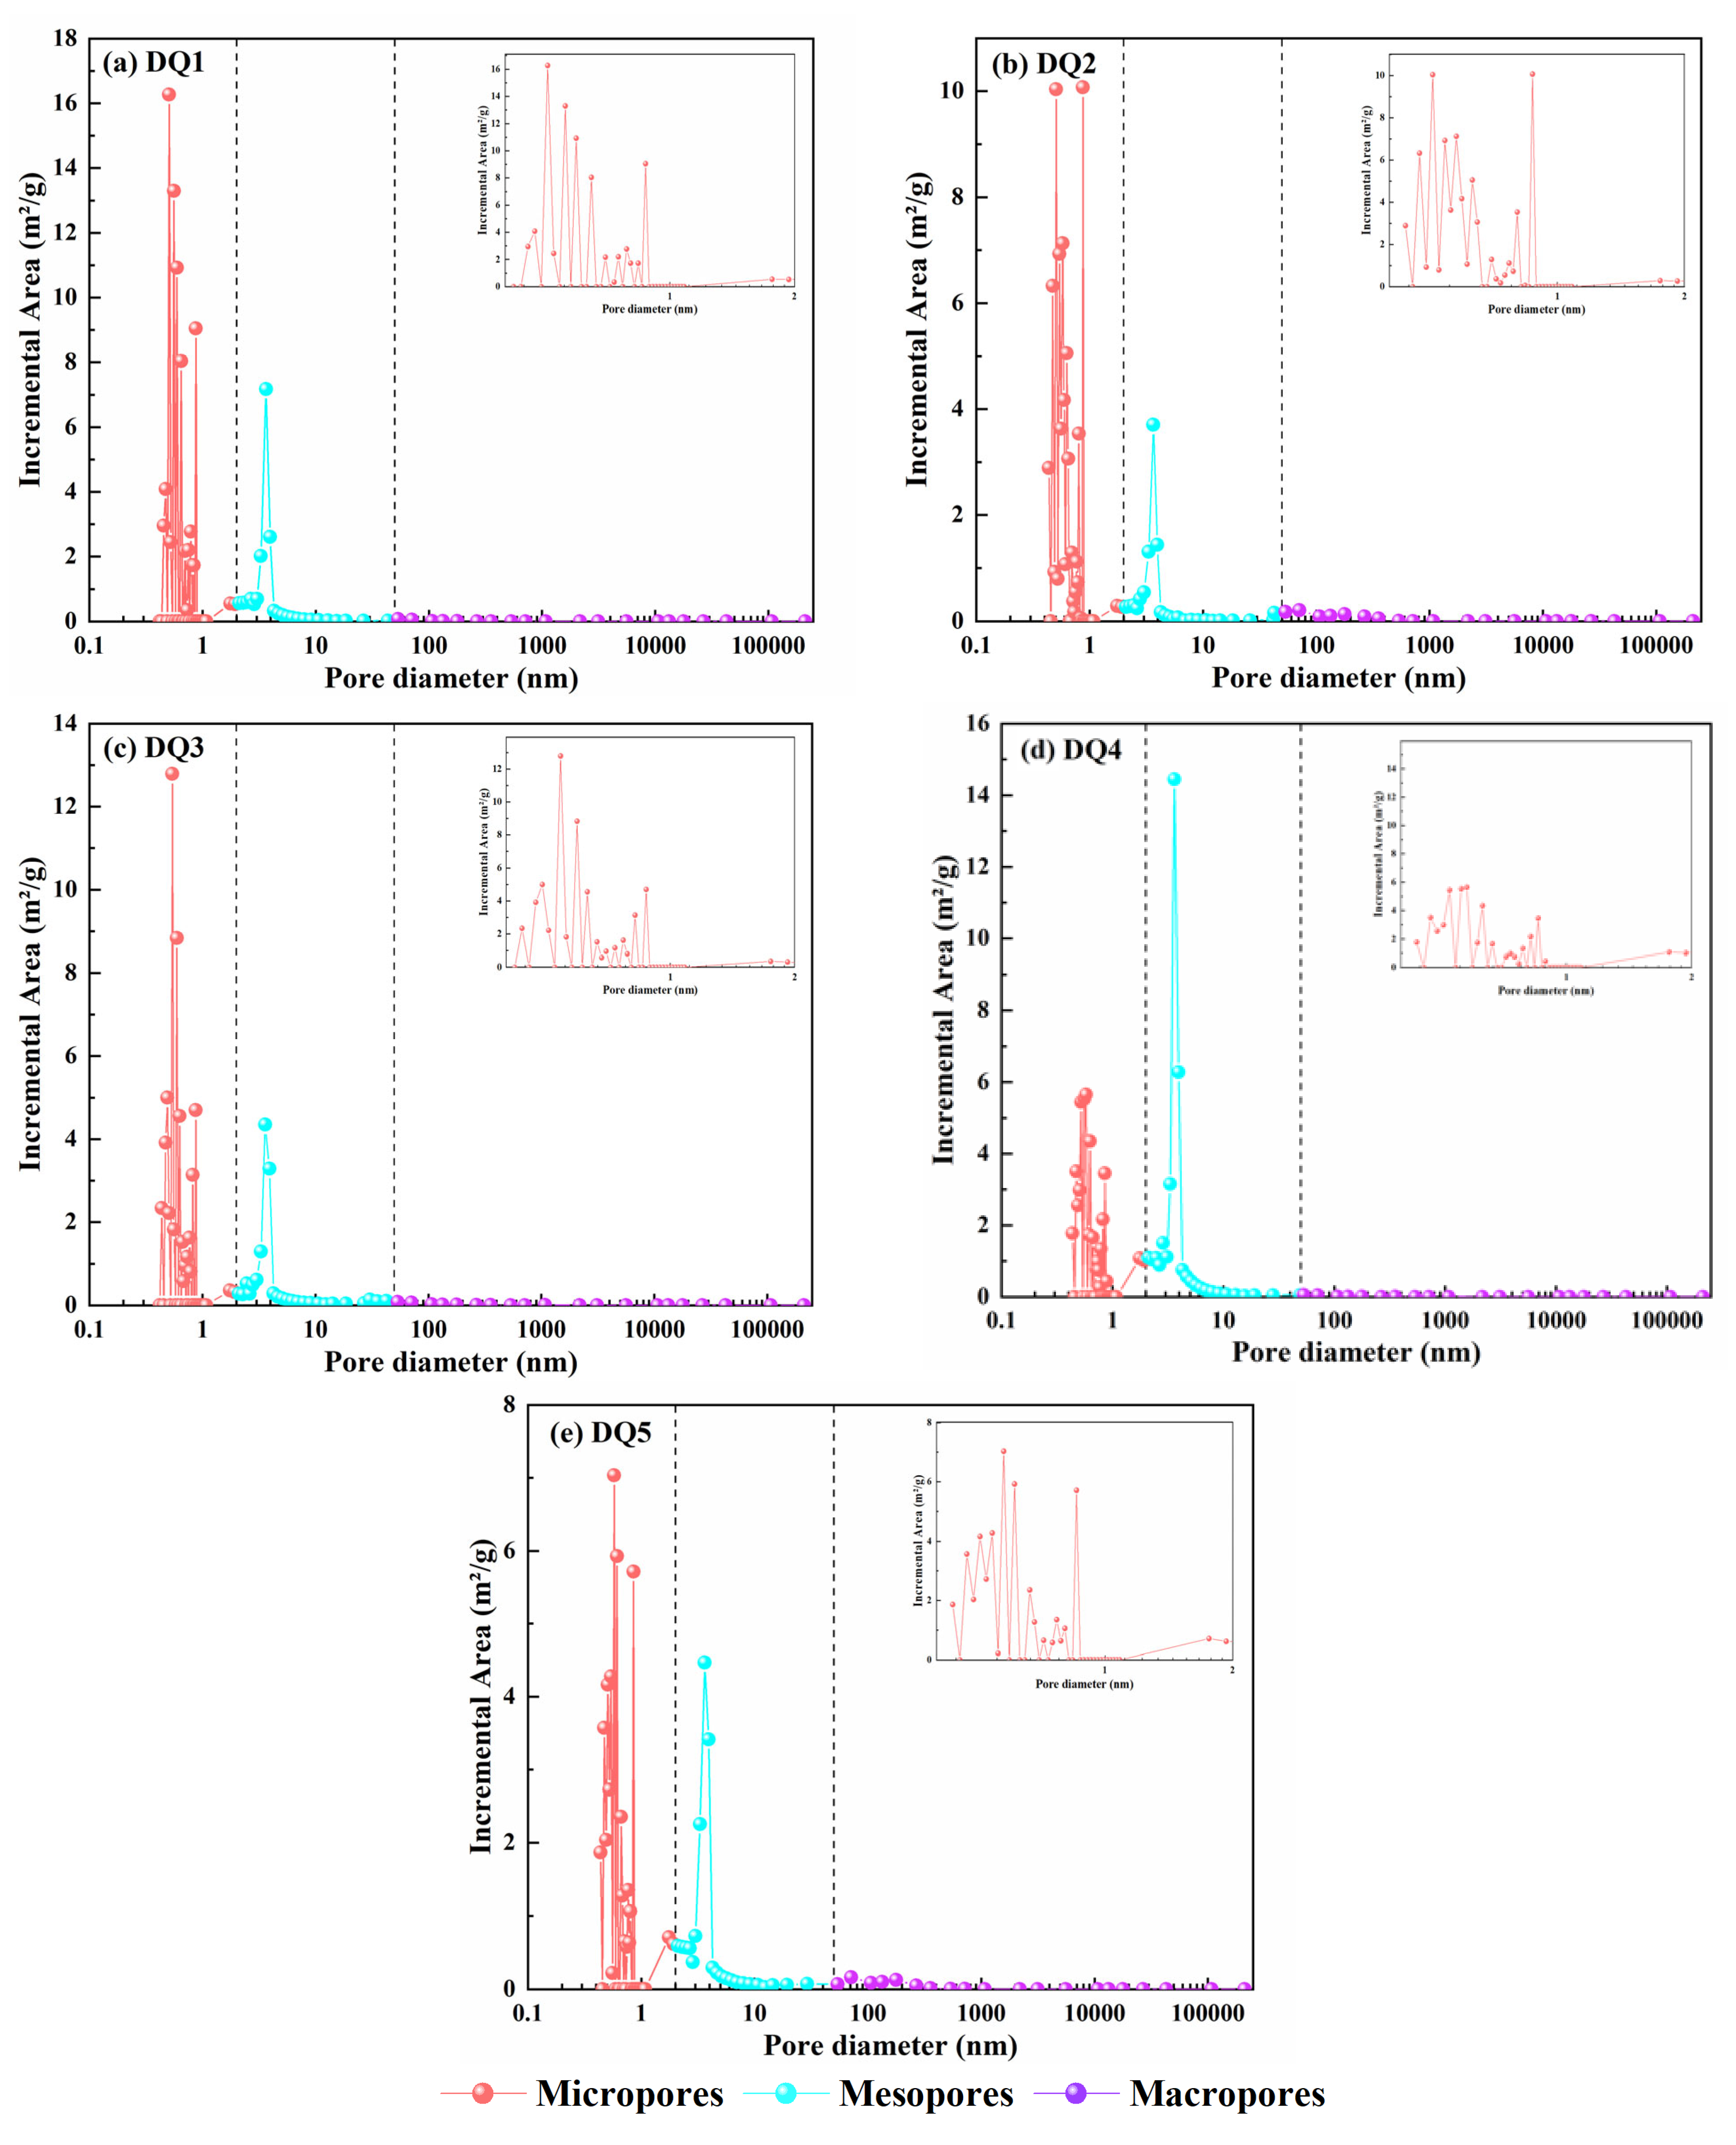
3.2. The Pore Structure Features of Daqiang Coal

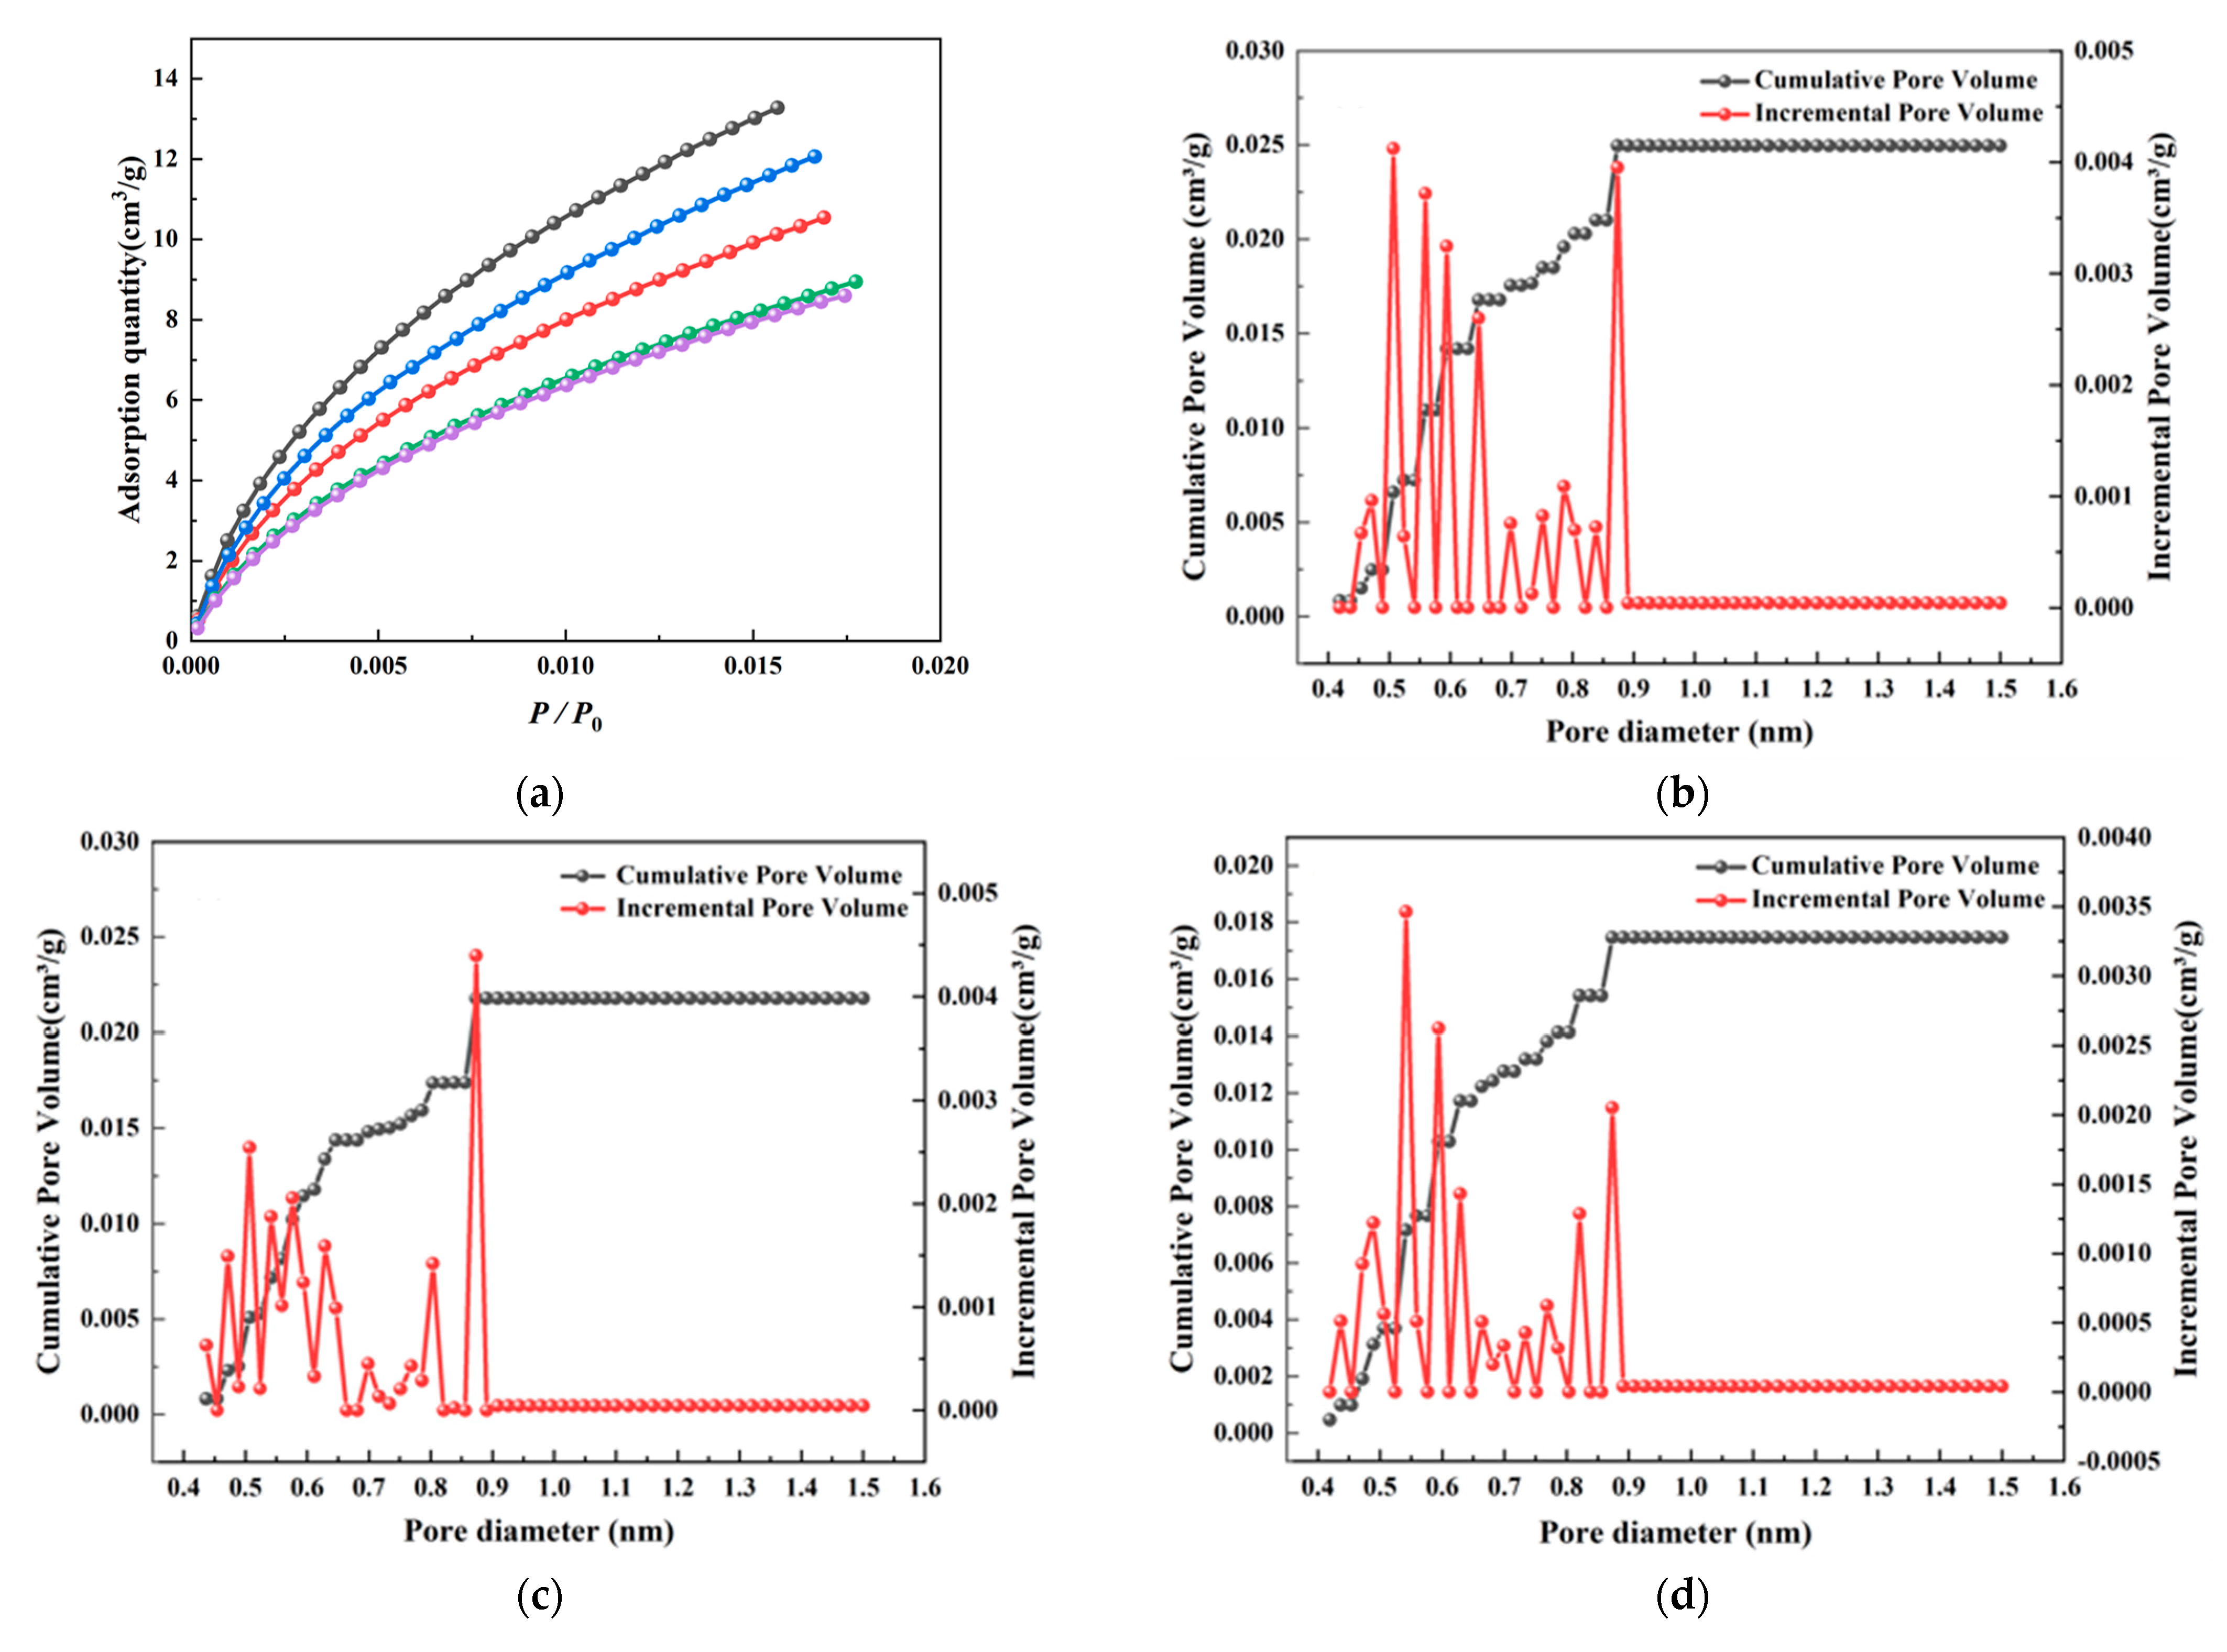
3.2.1. Micropore Structure Characteristic Determined by CO2 Adsorption

The full-scale pore structure features are shown in Table 2. CO2 adsorption analysis is a common method for analyzing micropore complexity and morphology [20,23]. Meanwhile, the CO2 adsorption isotherm and PSD of micropores determined with the DFT model are shown in Figure 3. As shown in Figure 3, the CO2 adsorption isotherm (Figure 3a) belongs to the type I isotherm, with a rapid increase in the adsorption capacity in the low relative pressure area and a slow growth in the high-pressure area, indicating open micropores exist with a pore size smaller than 2 nm [36]. DQ5 shows the lowest adsorption quantity of all the coal samples, indicating that DQ5 has the lowest micropore values. On the contrary, the CO2 adsorption quantity of DQ1 is the highest, as evidenced by its superior CO2 adsorption quantity. The CO2 adsorption quantity of deep coal rock is significantly higher compared with the amount of shallow coal rock.
Moreover, the PSD of micropores exhibits a bimodal distribution, with the primary peak at 0.45–0.7 nm and the minor spike at 0.85–0.9 nm. The micropore content of DQ1 and DQ2 was remarkably higher than those of DQ3, DQ4, and DQ5. Among them, a certain amount of micropores were developed in the bimodal range of DQ1, while DQ2 micropores tended to cluster in the 0.85–0.9 nm size range. The calculations for the micropore volume and specific surface area were executed in accordance with the DFT model (Table 2). Deep coal rock exhibits average values for specific surface area and micropore volume (0.024 cm3/g and 73.99 m2/g, respectively). In contrast, shallow coal rock demonstrates mean values of 0.021 cm3/g and 48.93 m2/g, respectively. In comparison, deep coal rock possesses more developed micropores.

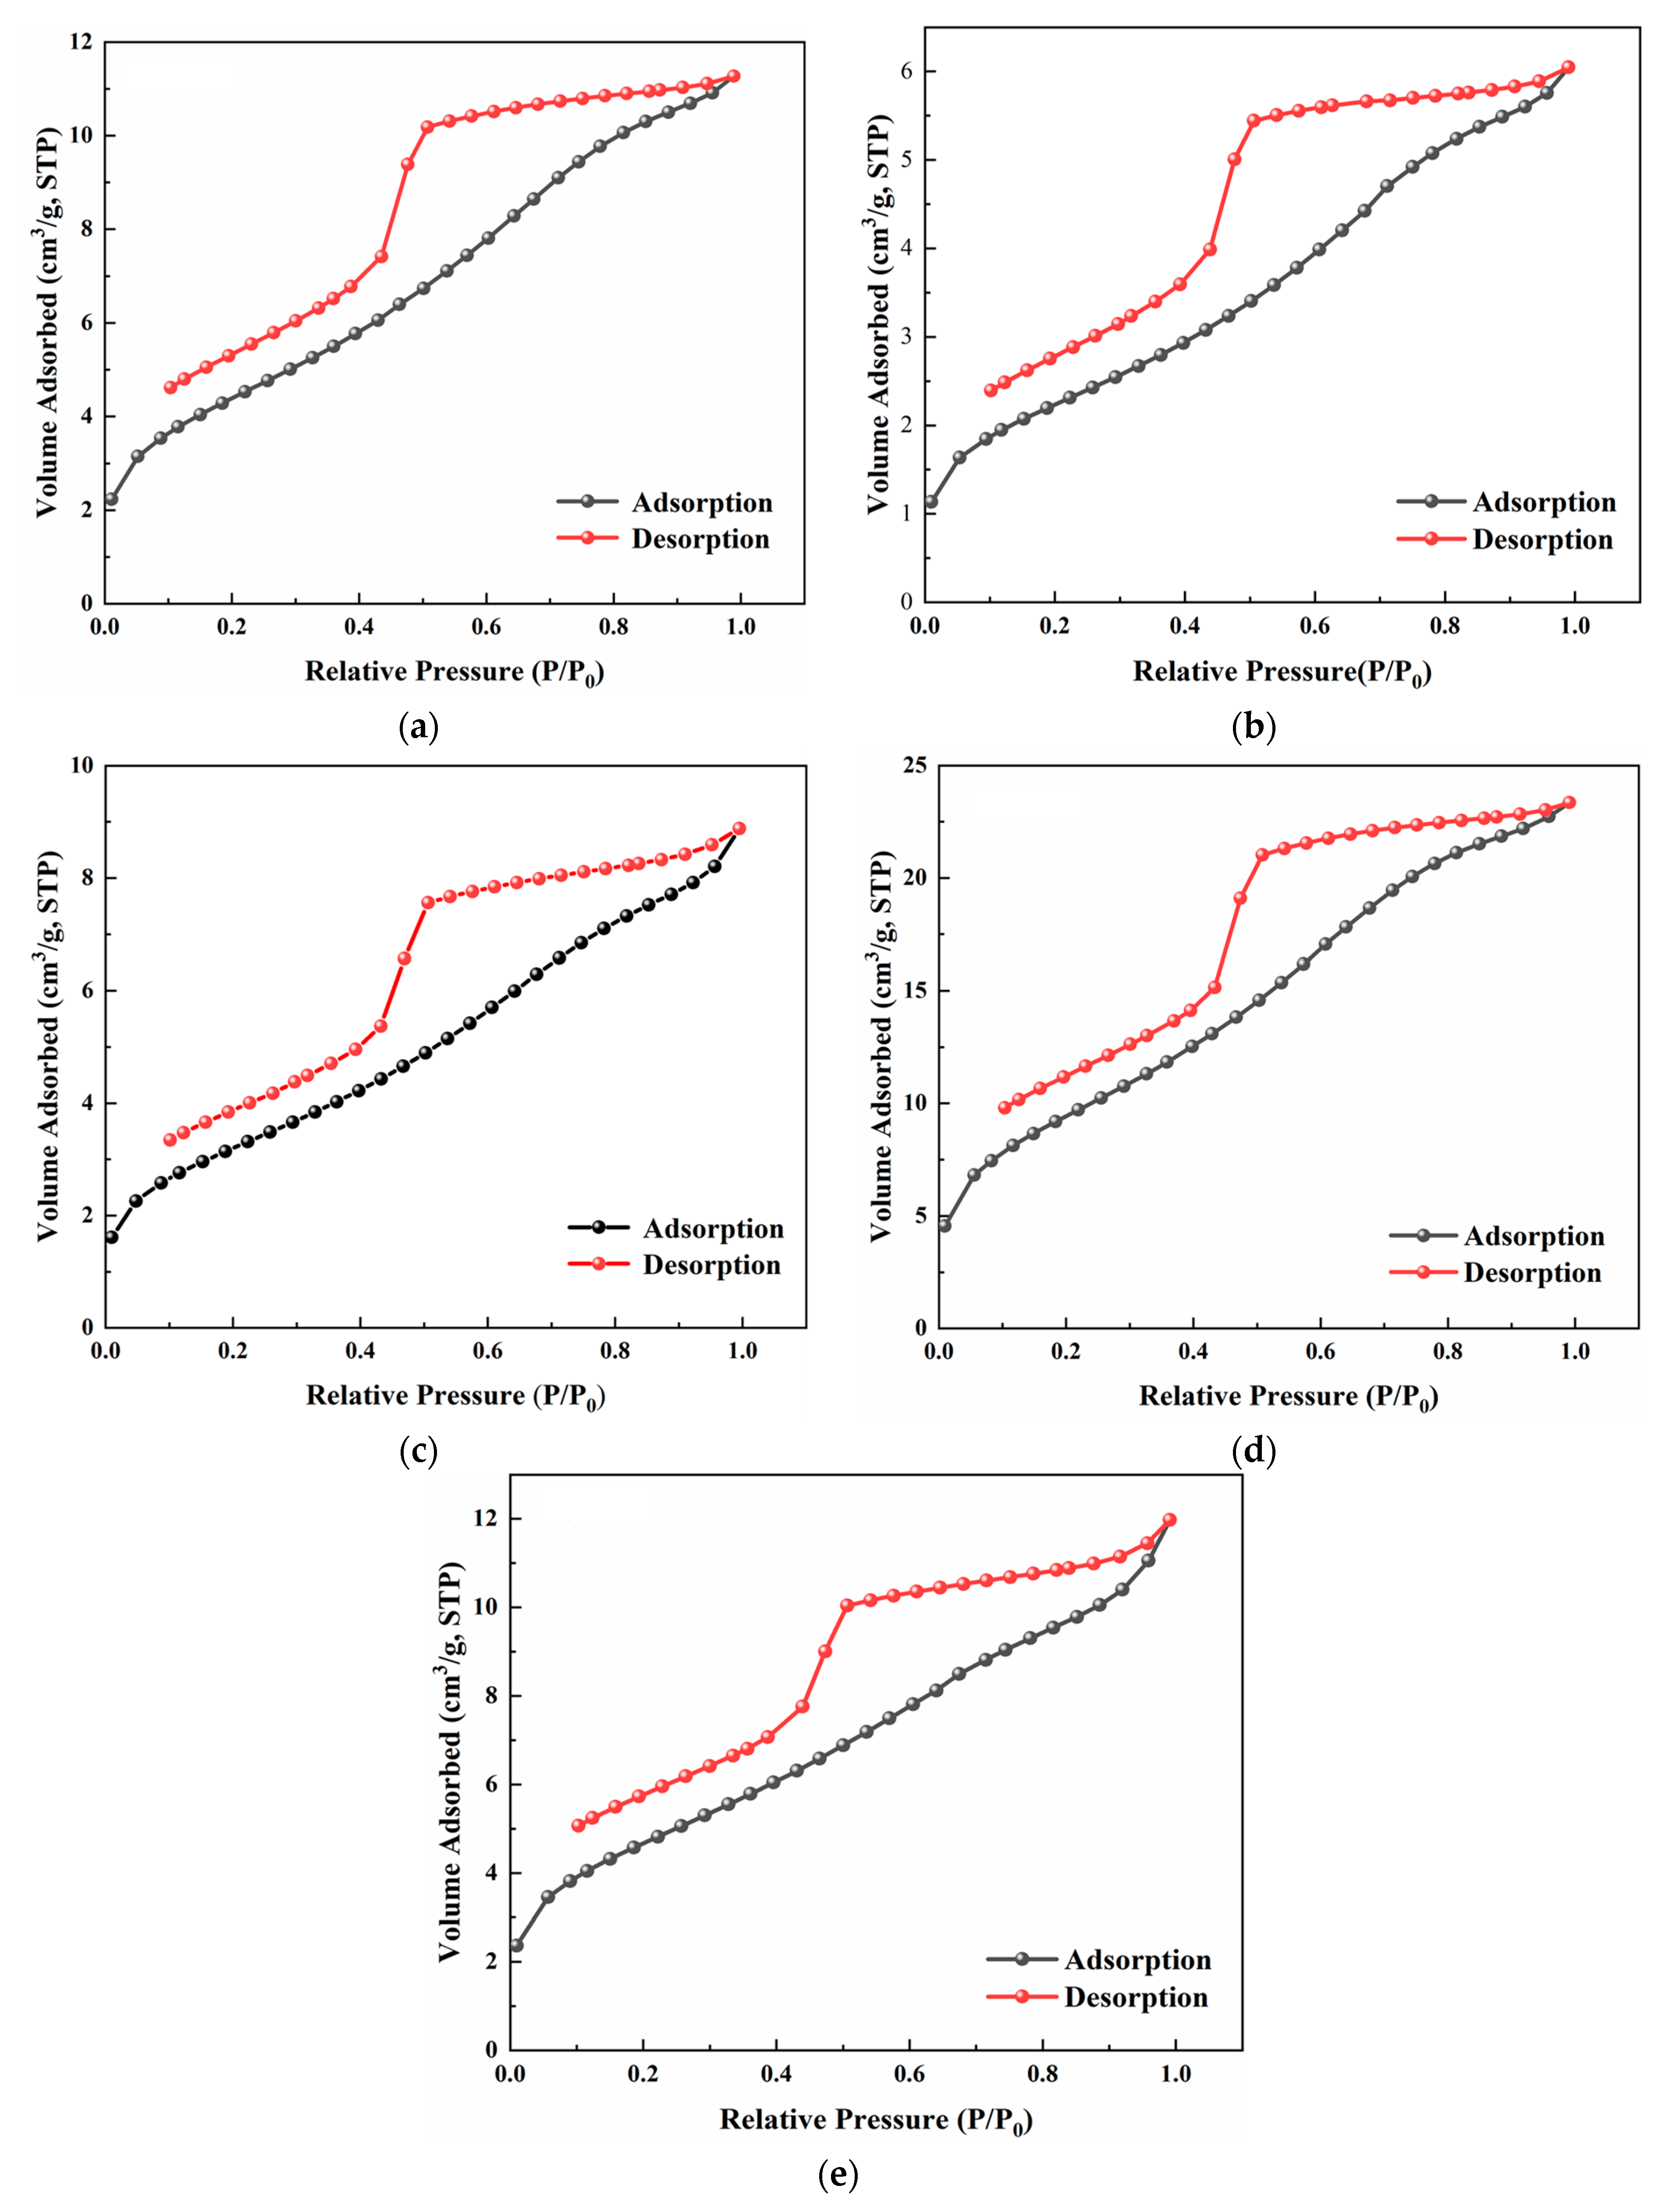
3.2.2. Mesopore Structure Characteristic Determined by N2 Adsorption

N2 adsorption is a common method for analyzing mesopore complexity and morphology [24,35]. As shown in Figure 4, following the IUPAC division principle, the N2 adsorption isotherm of mesopores is categorized as type IV, while the hysteresis loop can be defined as type H3 [36]. The shape of the hysteresis loop is determined by single-layer–multilayer free adsorption, single-layer adsorption, followed by multi-layer adsorption, and subsequently, capillary condensation all point to continual and intense pore alterations in low-rank coal [3].
Between the relative pressure (P/P0) value ranges of 0 to 0.45, the N2 adsorption/desorption isotherms overlap, indicating that the pores are closed at one end. A prominent yield point, primarily due to bottleneck and slit-shaped pores, shows on the desorption isotherm between 0.45 and 0.50 relative pressure (P/P0) [25]. Bottleneck pores and slit-shaped pores are advantageous to coalbed methane enrichment but not conducive to seepage. The curve starts rising again as the relative pressure (P/P0) is raised, which is attributed to the capillary condensation in the process of mesopore adsorption. DQ4 has the highest nitrogen adsorption volume, indicating it has the most significant mesopore values.
The PSD curves of micropores are illustrated in Figure 5. The BJH model calculations for the PSD curves indicate the presence of an isolated peak, which is observed within the wavelength range of 3.00–4.00 nm. In addition, the DFT model calculations of the pore size distribution curves show a bimodal distribution, with a significant peak ranging from 2 to 10 nm (the peak value appears at 3–4 nm) and a secondary peak ranging from 1 to 2 nm. The BJH model results are generally consistent with the DFT model results. The pore dimension predicted using the DFT model is, nevertheless, greater in magnitude than that predicted using the BJH model with regard to micropores. This is due to the fact that, as prior research has shown, the BJH model has inaccuracies when characterizing microporous materials [3]. The calculations for the mesopore volume and specific surface area were executed in accordance with the BJH and BET models (Table 2). Deep coal rock exhibits average values for specific surface area and micropore volume (0.013 cm3/g and 12.09 m2/g, respectively). In contrast, shallow coal rock demonstrates mean values of 0.021 cm3/g and 21.04 m2/g, respectively. In comparison, shallow coal rock possesses more developed mesopores.

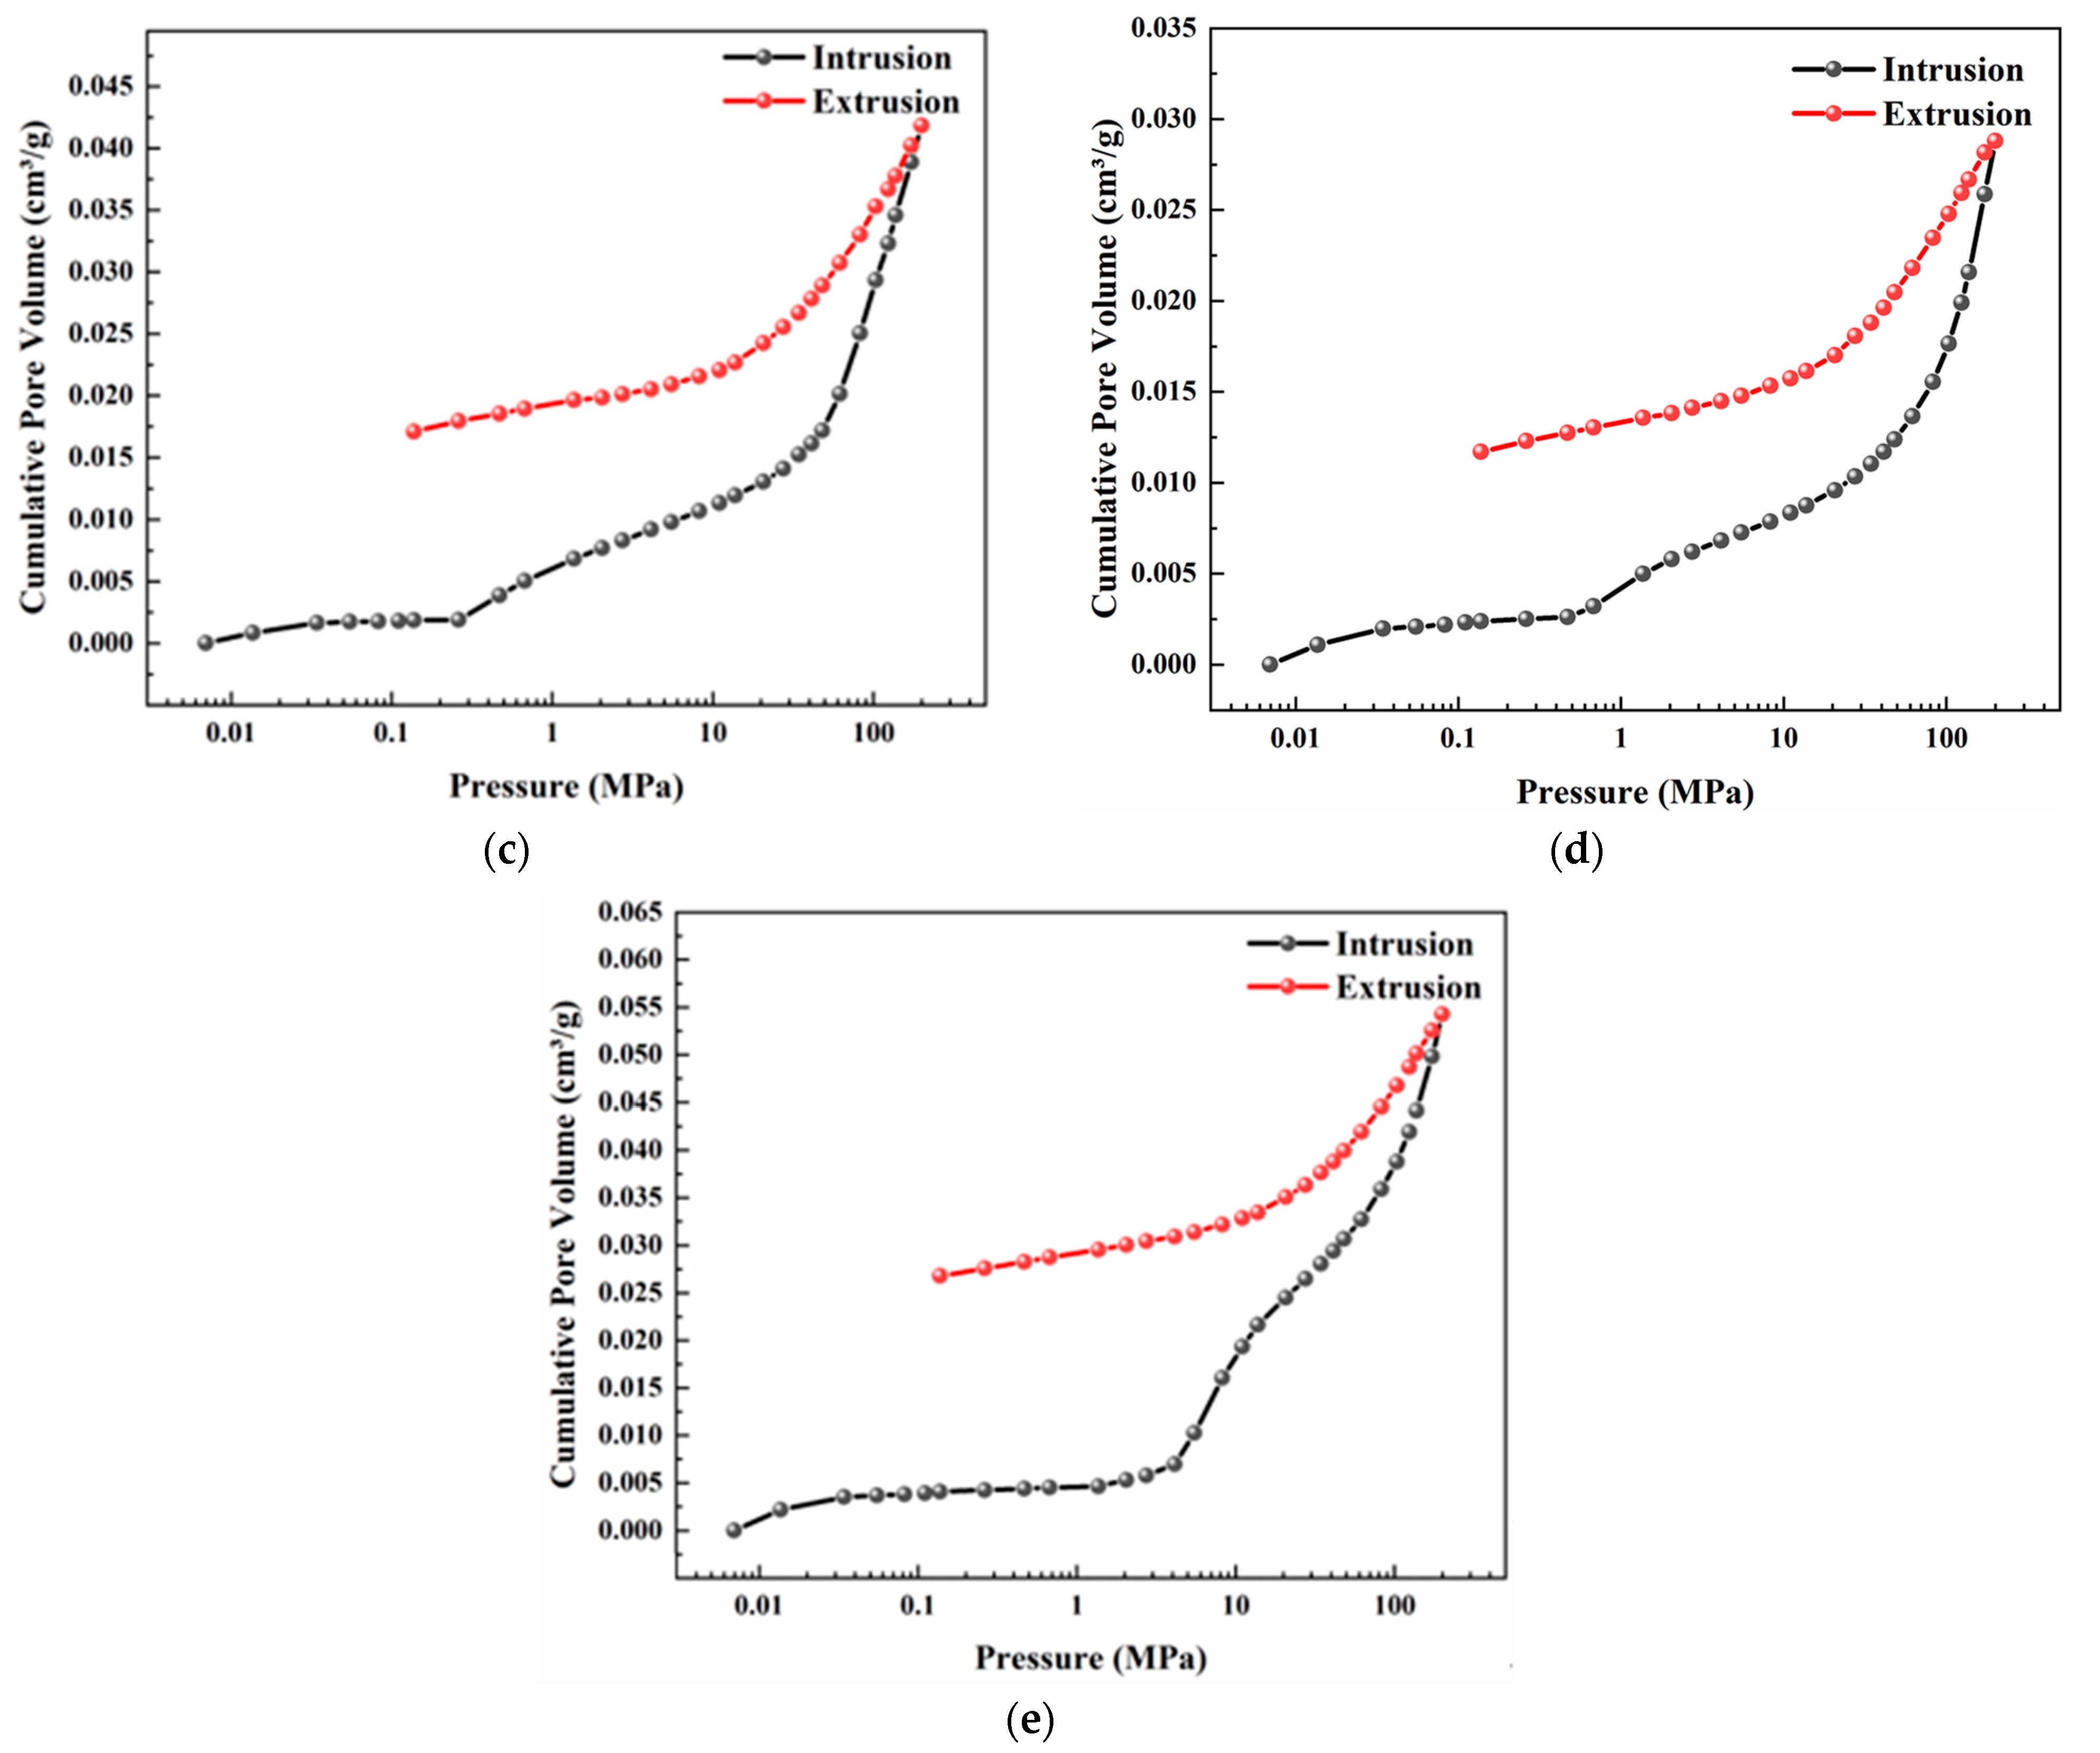
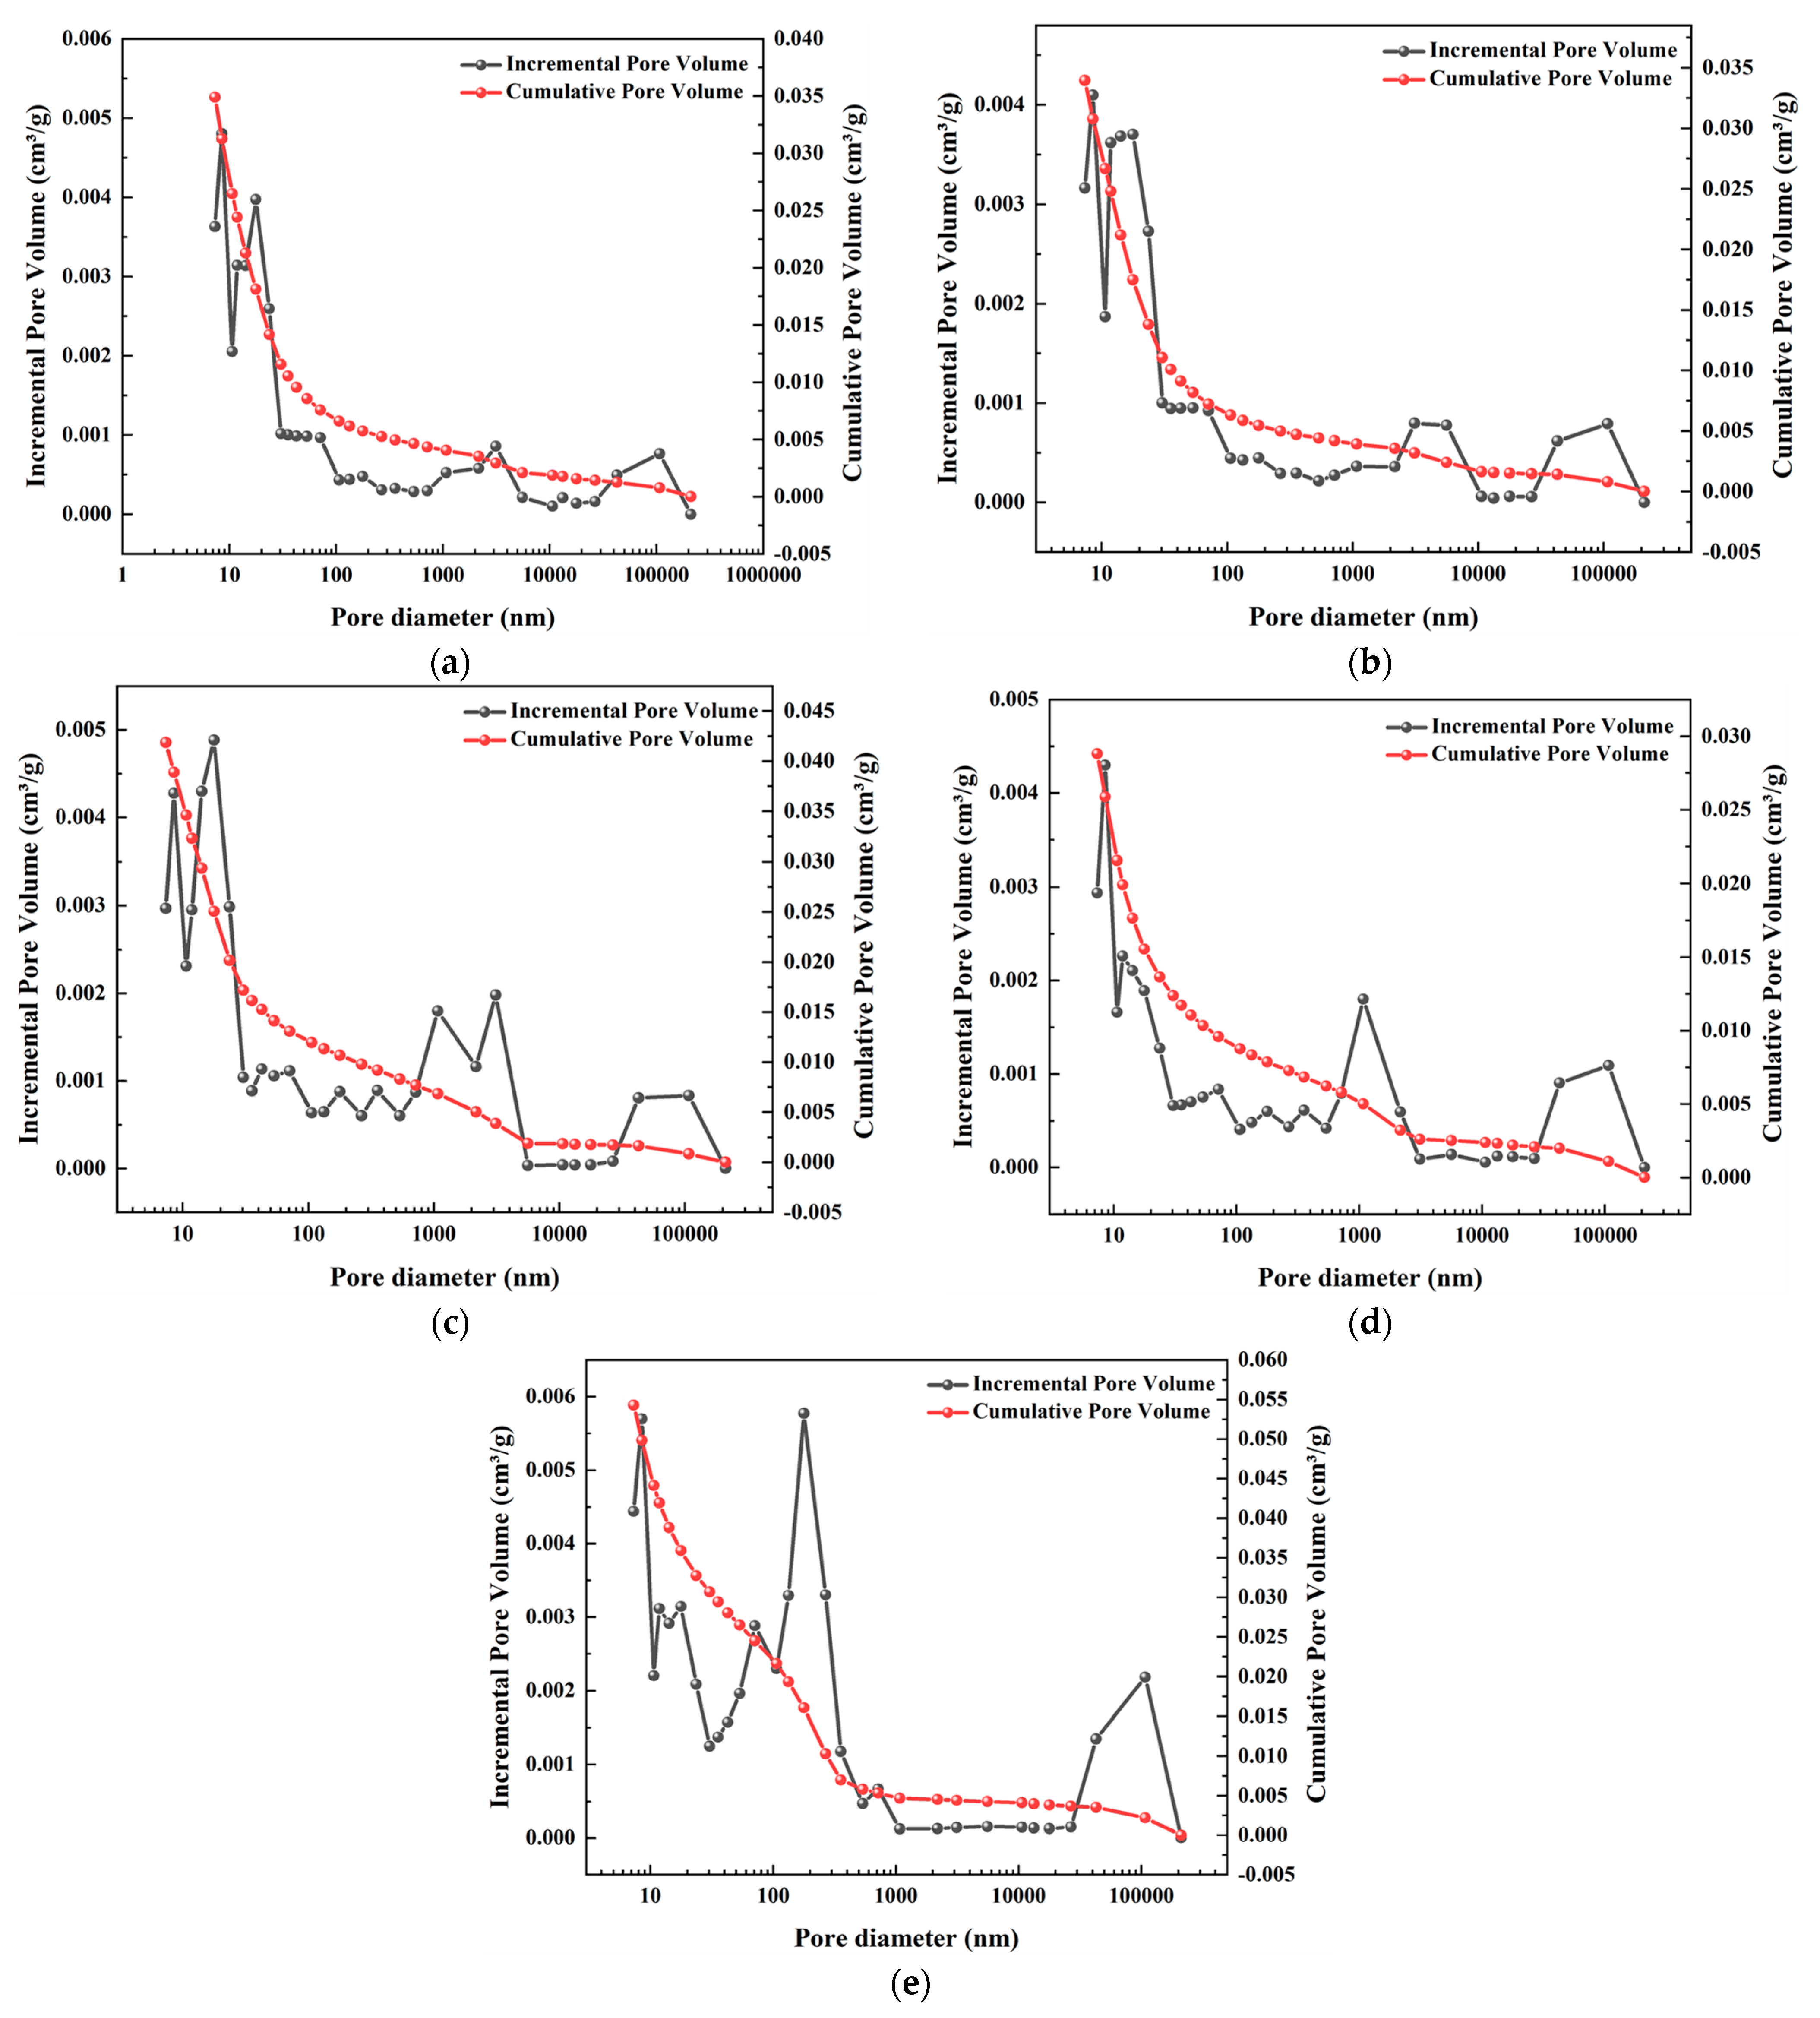
3.2.3. Macropore Structure Characteristic Determined with MIP

The mercury intrusion–rejection curves are significantly separated, and the hysteresis loops are similar but have different sizes (Figure 6). The hysteresis loops of deep coal rock are small with high mercury removal efficiency, indicating that their macropores are mainly closed and semi-open pores. Nevertheless, the hysteresis loops of shallow coal rock are large with low mercury removal efficiency, which exist in all pressure stages, indicating that they have good pore connectivity from micropores to macropores.
In Figure 7, deep coal rock exhibits average values for specific surface area and macropore volume (0.007 cm3/g and 0.27 m2/g, respectively). In contrast, shallow coal rock demonstrates mean values of 0.022 cm3/g and 0.29 m2/g, respectively. In comparison, shallow coal rock possesses more developed macropores. The multimodal peak distribution of the PSD curves, which includes the prominent peak at 3.00–4.00 nm and two peaks at 0.1–2 nm and 100 μm, suggests that the dominant pores of the numbered samples are micropores. Additionally, the peak values at 0.1–2 nm and 100μm for deep coal rock (DQ1 and DQ2) are incredibly low, indicating that their mesopores and macropores are incredibly underdeveloped. DQ3 and DQ4 develop some macropores at the pore size of 0.1–2 μm, and DQ5 exhibits the highest pore volume, implying that DQ5 has the highest macropore values.

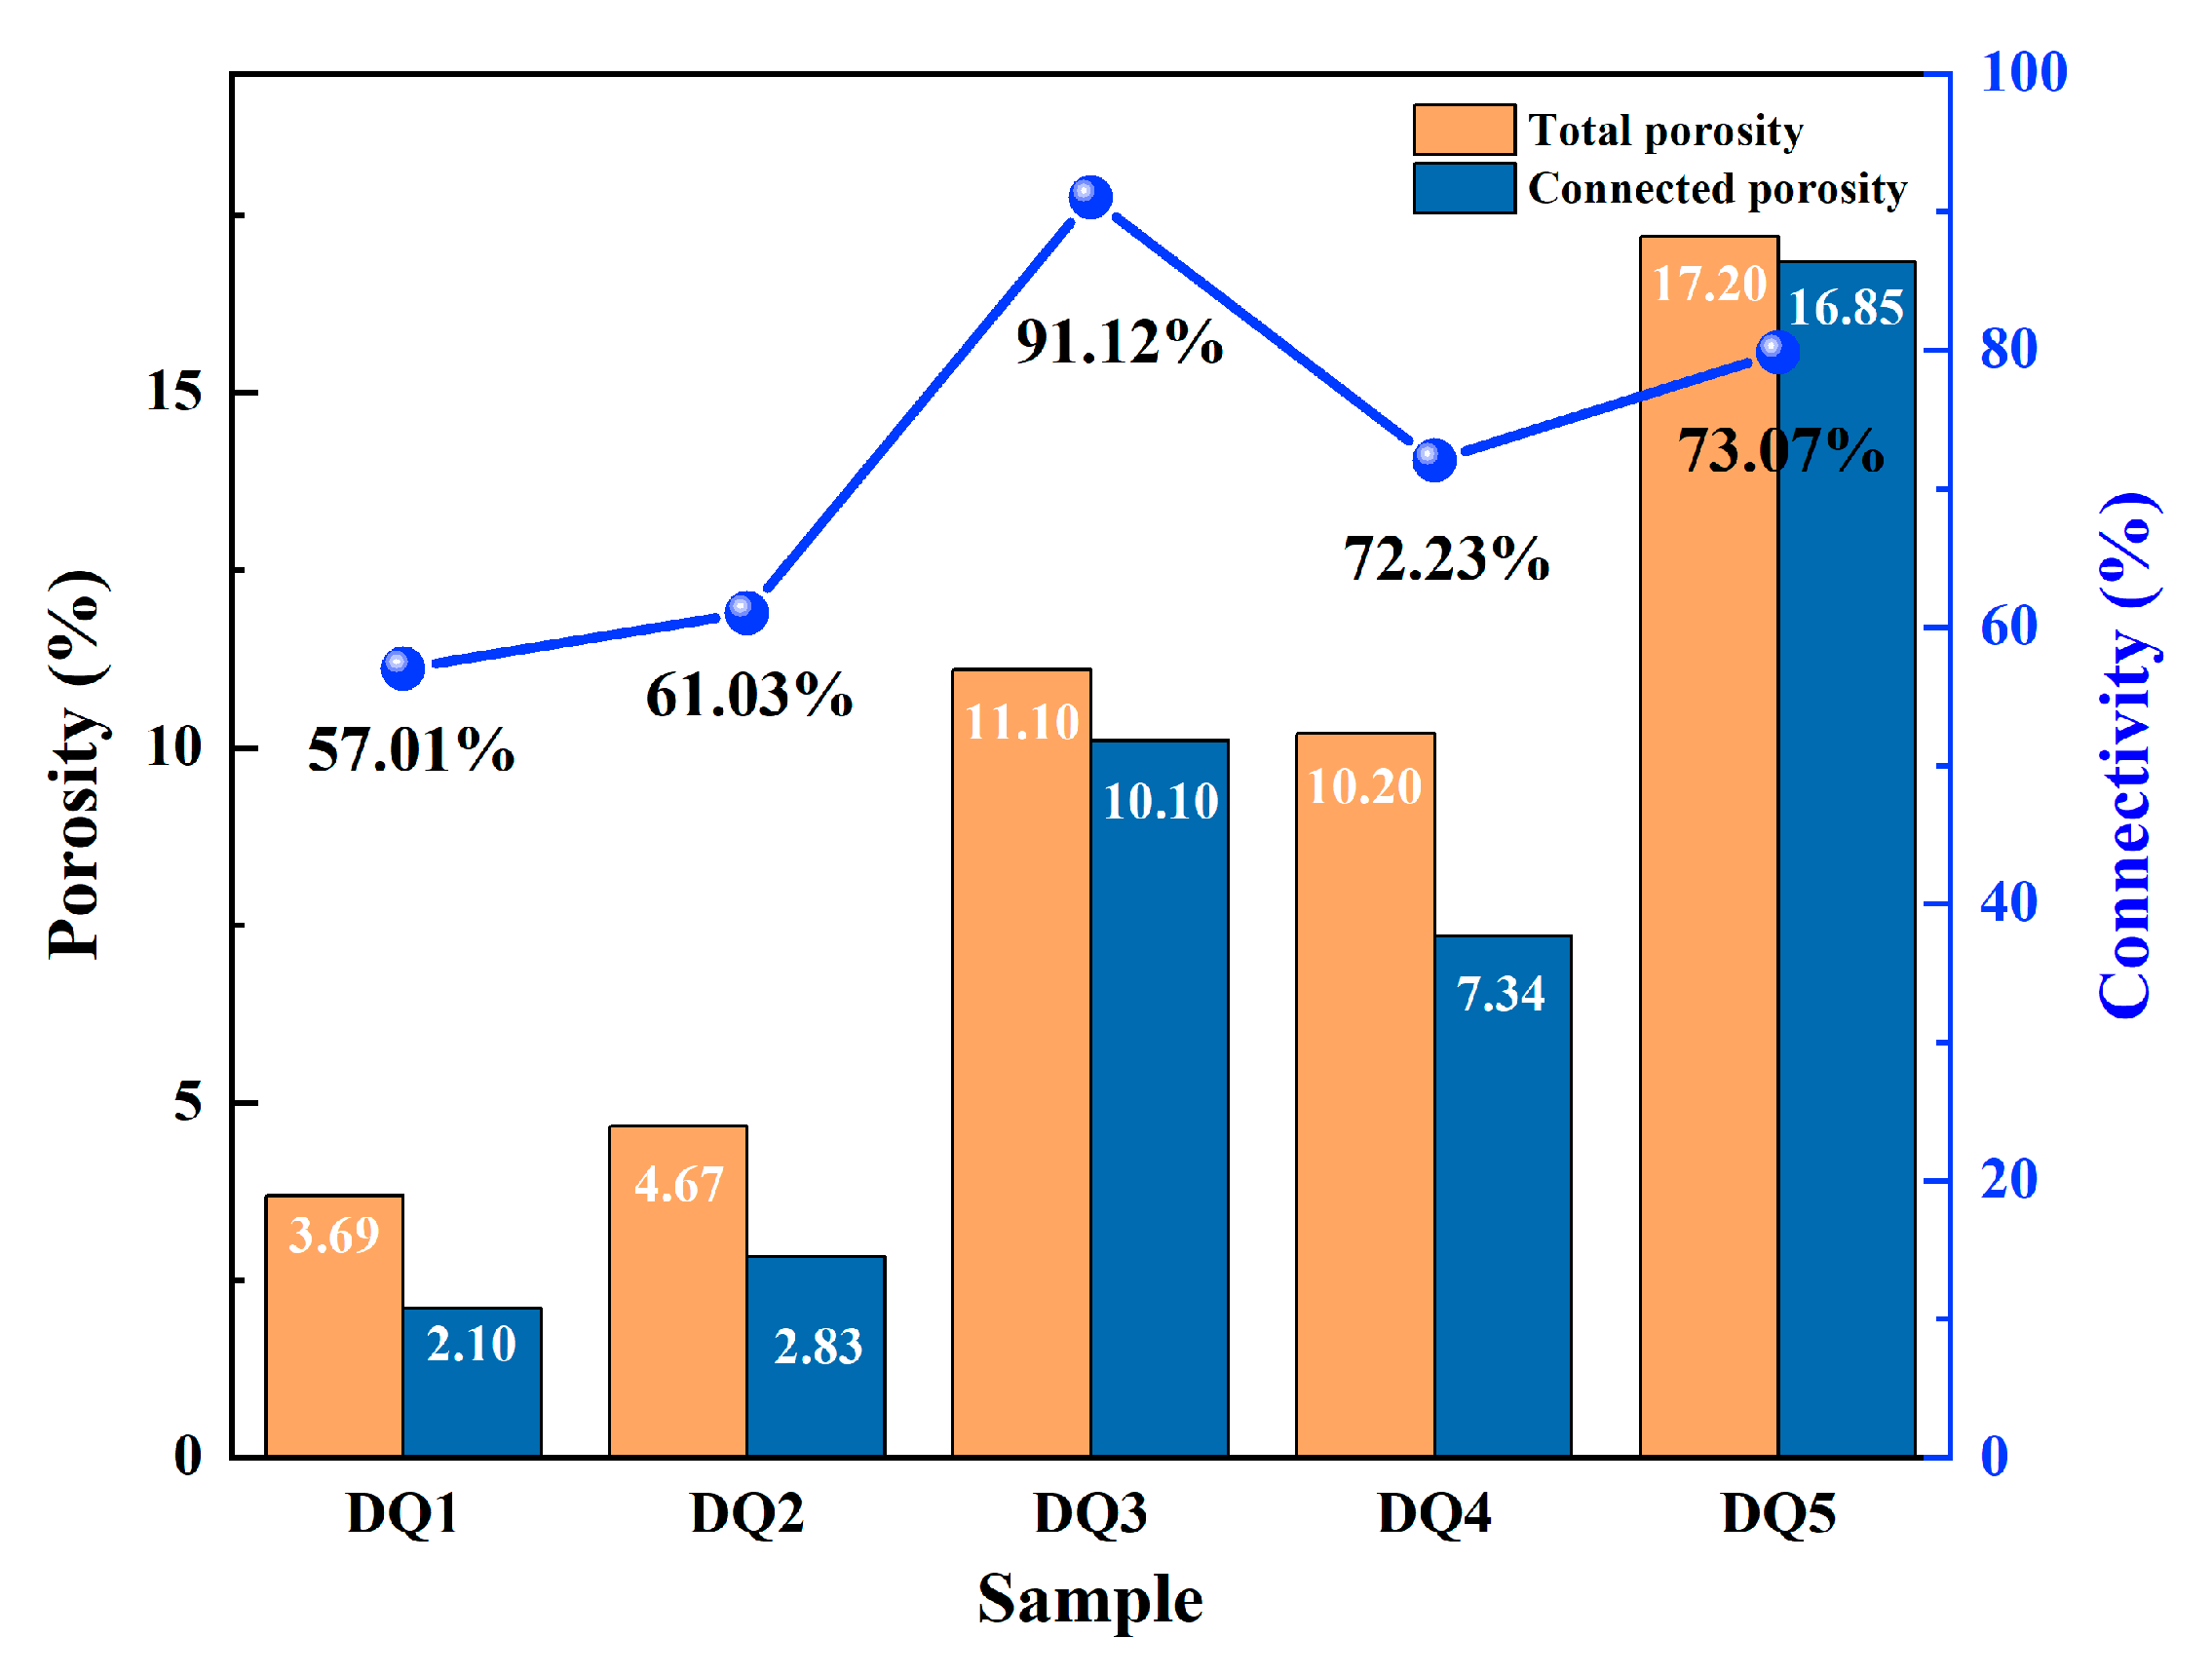
3.2.4. Spatial Distribution of Pore Structure Determined with CT

To replicate the pore structure of coal samples and to accurately and intuitively identify the internal pore and fracture structure, including pores larger than 1 μm, 3D reconstruction was performed. Firstly, image processing of CT slices was required, including data loading, filtering noise reduction, image segmentation, and 3D reconstruction. Among them, the most critical steps in pre-processing are filtering noise reduction and image segmentation. After a thorough comparison, the median filter and DTM threshold segmentation methods were chosen to handle the image. Secondly, the coal samples’ pore and fracture structures were reconstructed and visualized in AVIZO. Finally, the label analysis and volume rendering modules were then used to recreate the actual pore and fissure structures, respectively, and display the connectivity of the pore structure.
Coal contains a wide variety of sized and shaped pores and cracks. Large amounts of the same color covering adjacent pore or fracture structures in a given area indicate good connectivity between the pore or fracture structures. Conversely, the pore structure in this region is less concentrated, with pores that are more isolated and nearby pores and fractures that are colored differently. Coal samples DQ3 and DQ5 develop large macropores and a homogenous pore distribution, as illustrated in Figure 8. The directional pore distribution of DQ3 and DQ5 differs, with DQ3’s pore cracks being arranged horizontally and DQ5’s being arranged vertically. The pores in DQ1 are primarily spread on both sides, and a high number of pores exist in isolation. It is challenging to create a topological structure from isolated pores, resulting in inadequate connections. The pores and fissures of DQ2 are dispersed horizontally, and each bedding plane produces a longitudinal fissure that connects the others. DQ4 is composed of two principal fractures that exhibit a near-vertical orientation on both sides, accompanied by the formation of solitary pores within the sample’s core.
The size, distribution, and average equivalent pore diameter (Deq) for pore structures were computed after their detection using AVIZO. The AVIZO Label Analysis module provides the following formula for calculating the Deq:
D e q = 6 · V p o r e π 3
where Deq and Vpore refer to the equivalent pore diameter, μm, and pore volume, μm3, respectively.
Based on the comprehensive selection of CT voxel resolution and measured aperture, the equivalent diameter interval is divided, as shown in Table 3. Coal samples DQ1, DQ2, DQ3, DQ4, and DQ5 have an average Deq of 3.44 μm, 3.76 μm, 4.31 μm, 4.02 μm, and 5.08 μm, respectively, and the pore and fracture counts are 8137, 8350, 7224, 6758 and 8201, respectively. While the 1–10 μm range has the highest pore frequency across all five coal samples, indicating the greatest number of macropores in this interval, the volume ratio for this range is just 0.83–1.19% due to the tiny size of the sample. The majority of the five coal samples’ pore volumes is concentrated in the Deq > 50 μm interval. Despite its low pore frequency, this pore interval contributes the most to the total amount of pores and fissures, with a volume ratio of 92.51% to 96.29%. Comparing the pore volume of shallow coal rock, the majority of the volume is donated by pores with a Deq > 100 μm, whereas in deep coal rock, the contribution of 50–100μm pores and fissures is greater than that in shallow coal rock, indicating that more mini-scale pores and fissures can be observed in deep coal rock.
The pore structure contains a multitude of dead-end pores and isolated pores that are impermeable to fluid translocation. These features do not facilitate fluid migration. Consequently, the investigation of connected pore properties is essential to the analysis of coal seepage capability. In this study, AVIZO 2020 software is utilized to extract the connected porosity and the pore connectivity rate. As indicated in Figure 9, the total porosity of the five coal samples is 3.69%, 4.67%, 11.10%, 5.23%, and 17.20%, while the connected porosity is 2.10%, 2.83%, 10.10%, 3.78%, and 16.85%. The total porosity of deep coal rock is relatively modest, as are the interconnected pores. Total porosity and connection porosity are greater for shallow coal rock, indicating that their connectedness is superior.

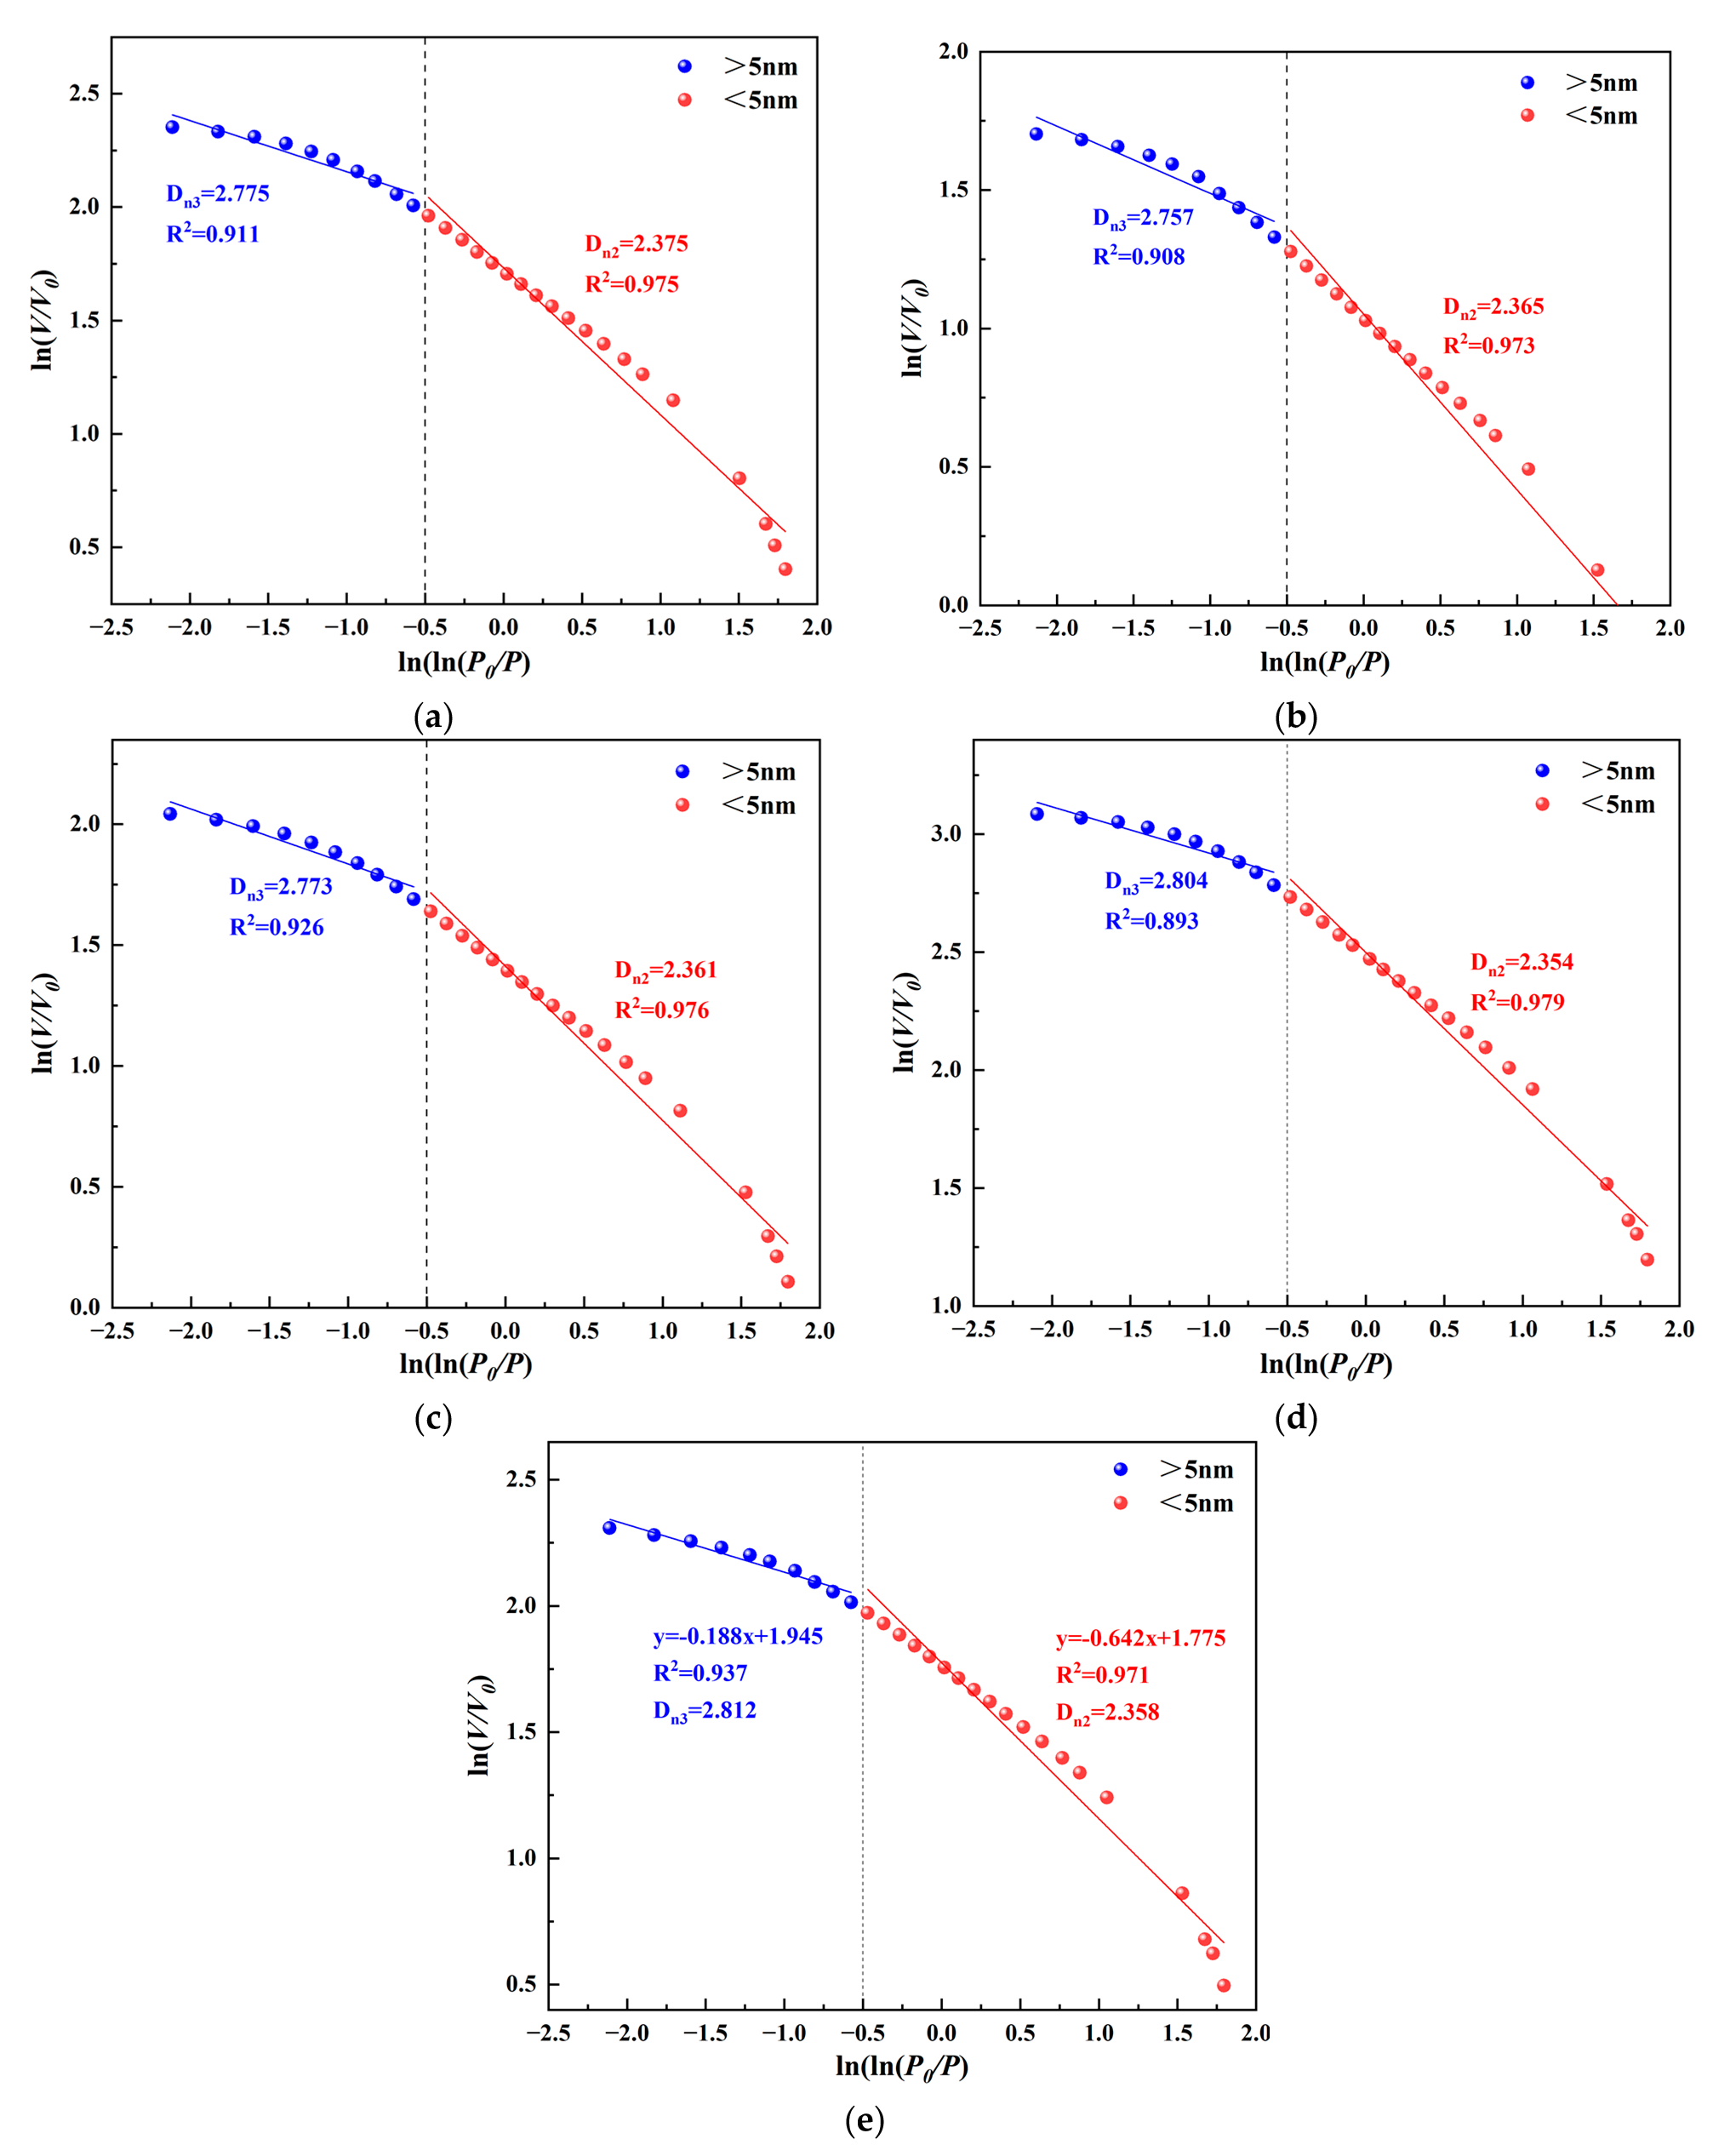
3.3. Pore Fractal Analysis

Table 4 lists the four fractal dimensions, D1, D2, D3, and D4, determined with CO2/N2 adsorption and MIP data. As illustrated in Figure 10, there is a positive linear relationship (R2 > 0.99) between lnV and ln(P–PT), showing that the micropores of the investigated samples possess desirable Sierpinski fractal properties. The ranges of D1 are 2.321 (DQ5) to 2.337 (DQ1) (avg. 2.394), denoting that the micropores exhibit good homogeneity. The relationship between ln(ln(P0/P)) and ln(V/V0) for all samples is illustrated in Figure 11. Notably, a disparity is observed in the tangential slope that separates the experimental samples’ edges in ln(ln(P0/P)) = −0.5 (equivalent pore diameter = 5 nm). Therefore, the contours are partitioned into two sections, and correspondingly, the multifractal dimensions of D2 (2–5 nm) and D3 (5–50 nm) are computed. The fractal dimensions D2 and D3 are utilized to identify the pore surface and pore structure, respectively [37,38]. The distributions of D2 and D3 are 2.354 (DQ4) to 2.375 (DQ1) (avg. 2.363) and 2.757 (DQ4) to 2.812 (DQ5) (avg. 2.784), respectively. The double logarithmic relationship among all coal samples is illustrated in Figure 12. Specifically, at r = 25 nm (pore diameter = 50 nm), there is an evident variation in the tangent slope since the coal pore structure is disrupted and the coal matrix is compressed under high mercury pressure (P > 10 Mpa) (corresponding to the micropore and mesopores), leading to measurement inaccuracies, which aligns with previous research results [1,39]. Consequently, the low-pressure section data (corresponding to the macropore) were utilized in this investigation to assess the fractal properties of the numbered samples. The D4 varies from 2.946 (DQ5) to 2.980 (DQ1) (avg. 2.963), denoting that the macropores have a strong heterogeneity. The link between fractal dimensions is D1 ≈ D2 < D3 < D4, which has prominent multifractal characteristics. It demonstrates that as pore size increases, so does the heterogeneity in coal samples. Moreover, an observation can be made that the fractal dimension of the distribution of pore sizes at full scale is slightly larger in deep coal rock compared with shallow coal rock. Deep coal rock appears to possess a more heterogeneous pore structure, as determined by this disparity.

4. Discussion

4.1. Full-Size Pore Structure Characterization

As stated previously, the three methods of CO2 adsorption, N2 adsorption, and MIP tests have their own dominant pore size sections that can properly evaluate the pore structure of this section, but each has certain limitations. When measuring nanoscale pores, the gas adsorption experiment (N2/CO2) is typically utilized, although it only delivers restricted information due to its confined testing interval [37]. MIP experiments theoretically characterize pores with a size greater than 3 nm. Nevertheless, the coal matrix will be compacted by a massive external pressure of more than 13 MPa, and part of the macropores will be ignored, limited by the experimental size [40]. To sum up, it is difficult for any single technique to adequately describe the intricate coal pore structure due to the complexity of the structure [9,22]. The experimental samples possess a complicated pore structure and a wide pore dispersion, which is difficult to characterize precisely using a single test method. To overcome the limits of individual methods and discover the greatest number of pores in coal, a methodology that associates MIP and gas adsorption analysis is required [20,25]. By combining MIP and N2/CO2 adsorption, the pore structure of the experimental samples, which were connected at 2 and 50 nm, respectively, was investigated in this study. CT experiments were used to perform three-dimensional reconstructions of macropore structures with diameters >1 μm. These reconstructions provide connectivity parameters of the macropore structures that are not attainable using the aforementioned experimental methods.
The pore volume distribution was multi-peak, with the majority of the pores being either micropores (ranging in size from 0.4 to 0.95 nm) or mesopores (ranging in size from 3 to 4 nm). The count of macropores was relatively small, and only DQ5 developed more macropores > 100 nm (Figure 13). Micropores, mesopores, and macropores of deep coal rock contribute an average pore volume of 0.043, 0.024, and 0.013 cm3/g, respectively. Total pore volume is contributed to at the following rates: micropore (avg. 55.32%) > mesopore (avg. 29.31%) > macropore (avg. 15.37%) (Table 2). Moreover, micropores, mesopores, and macropores of shallow coal rock contribute an average pore volume of 0.051, 0.015, and 0.014 cm3/g, respectively. Total pore volume is contributed to at the following rates: mesopore (avg. 40.80%) > micropore (avg. 30.92%) > macropore (avg. 28.27%) (Table 2). Deep coal rock has the highest micropore content and contains a certain amount of mesopores, while the content of macropores is relatively low. On the contrary, shallow coal rock exhibits the greatest abundance of mesopores, while its quantities of micropores and macropores are comparable. This phenomenon occurs because the pressure exerted on deep coal rock significantly reduces the volume of mesopores and macropores. The application of pressure induces the conversion of these sizable pores into micropores, thereby augmenting the proportion of micropore volume.
The specific surface area distribution is a bimodal distribution, mainly distributed within the spectrum of micropores and mesopores. Micropores, mesopores, and macropores of deep coal rock contribute an average specific surface areas of 73.99, 12.09, and 0.27 cm3/g (Figure 14), respectively. Total specific surface area is contributed to at the following rates: micropore (avg. 85.97%) > mesopore (avg. 13.70%) > macropore (avg. 0.33%) (Table 2). Moreover, micropores, mesopores, and macropores of shallow coal rock contribute average specific surface areas of 48.93, 21.04, and 0.19 cm3/g, respectively. Total pore volume is contributed to at the following rates: mesopore (avg. 72.24%) > micropore (avg. 29.14%) > macropore (avg. 0.28%) (Table 2). The specific surface area of both deep and shallow coal rock is primarily contributed by micropores, with the micropores’ specific surface area in deep coal rock being marginally greater than that in shallow coal rock.
Based on the findings from the characterization of the full-scale pore structure, it is apparent that the Tiefa shallow low-rank coal has a less developed micropore structure compared with the deeper low-rank coal, which exhibits a more developed mesopore-to-macropore structure. Furthermore, compared with shallow low-rank coal, the fractal dimensions of the full-scale pore size distribution in deep low-rank coal are larger, indicating a greater heterogeneity in the pore structure of Tiefa deep low-rank coal.
Compared with previous research results, the characterization of particle coal pore structure reveals that with increasing metamorphic degree, the micropore content of particle coal increases and is mainly dominated by ultra-micropores [24]. The size of micro- to mesopores undergoes a process of initial enlargement followed by reduction, and a significant change in pore structure occurs at the coalification transition. The characterization results of pore structure in the deep low-rank coal of the Panji Coalfield in Huainan show various pore types and firm heterogeneity [20]. The Panji deep low-rank coal has abundant meso- and macropores. The specific surface area is mainly contributed by micropores, while meso- and macropores primarily contribute to pore volume.
In the Tiefa Basin, the content of meso- to macropores is relatively high in shallow low-rank coal. In contrast, deep low-rank coal is predominantly characterized by a micropore structure, with the specific surface area mainly contributed by micropores. The pore size distribution in the deep low-rank coal of the Panji Basin is similar to that in the shallow low-rank coal of the Tiefa Basin. In contrast, the deep, low-rank coal of the Tiefa Basin has a significantly higher micropore content. This may be attributed to the more pronounced tectonic activity in the Tiefa Basin, which has a more significant impact on coal pore structure.

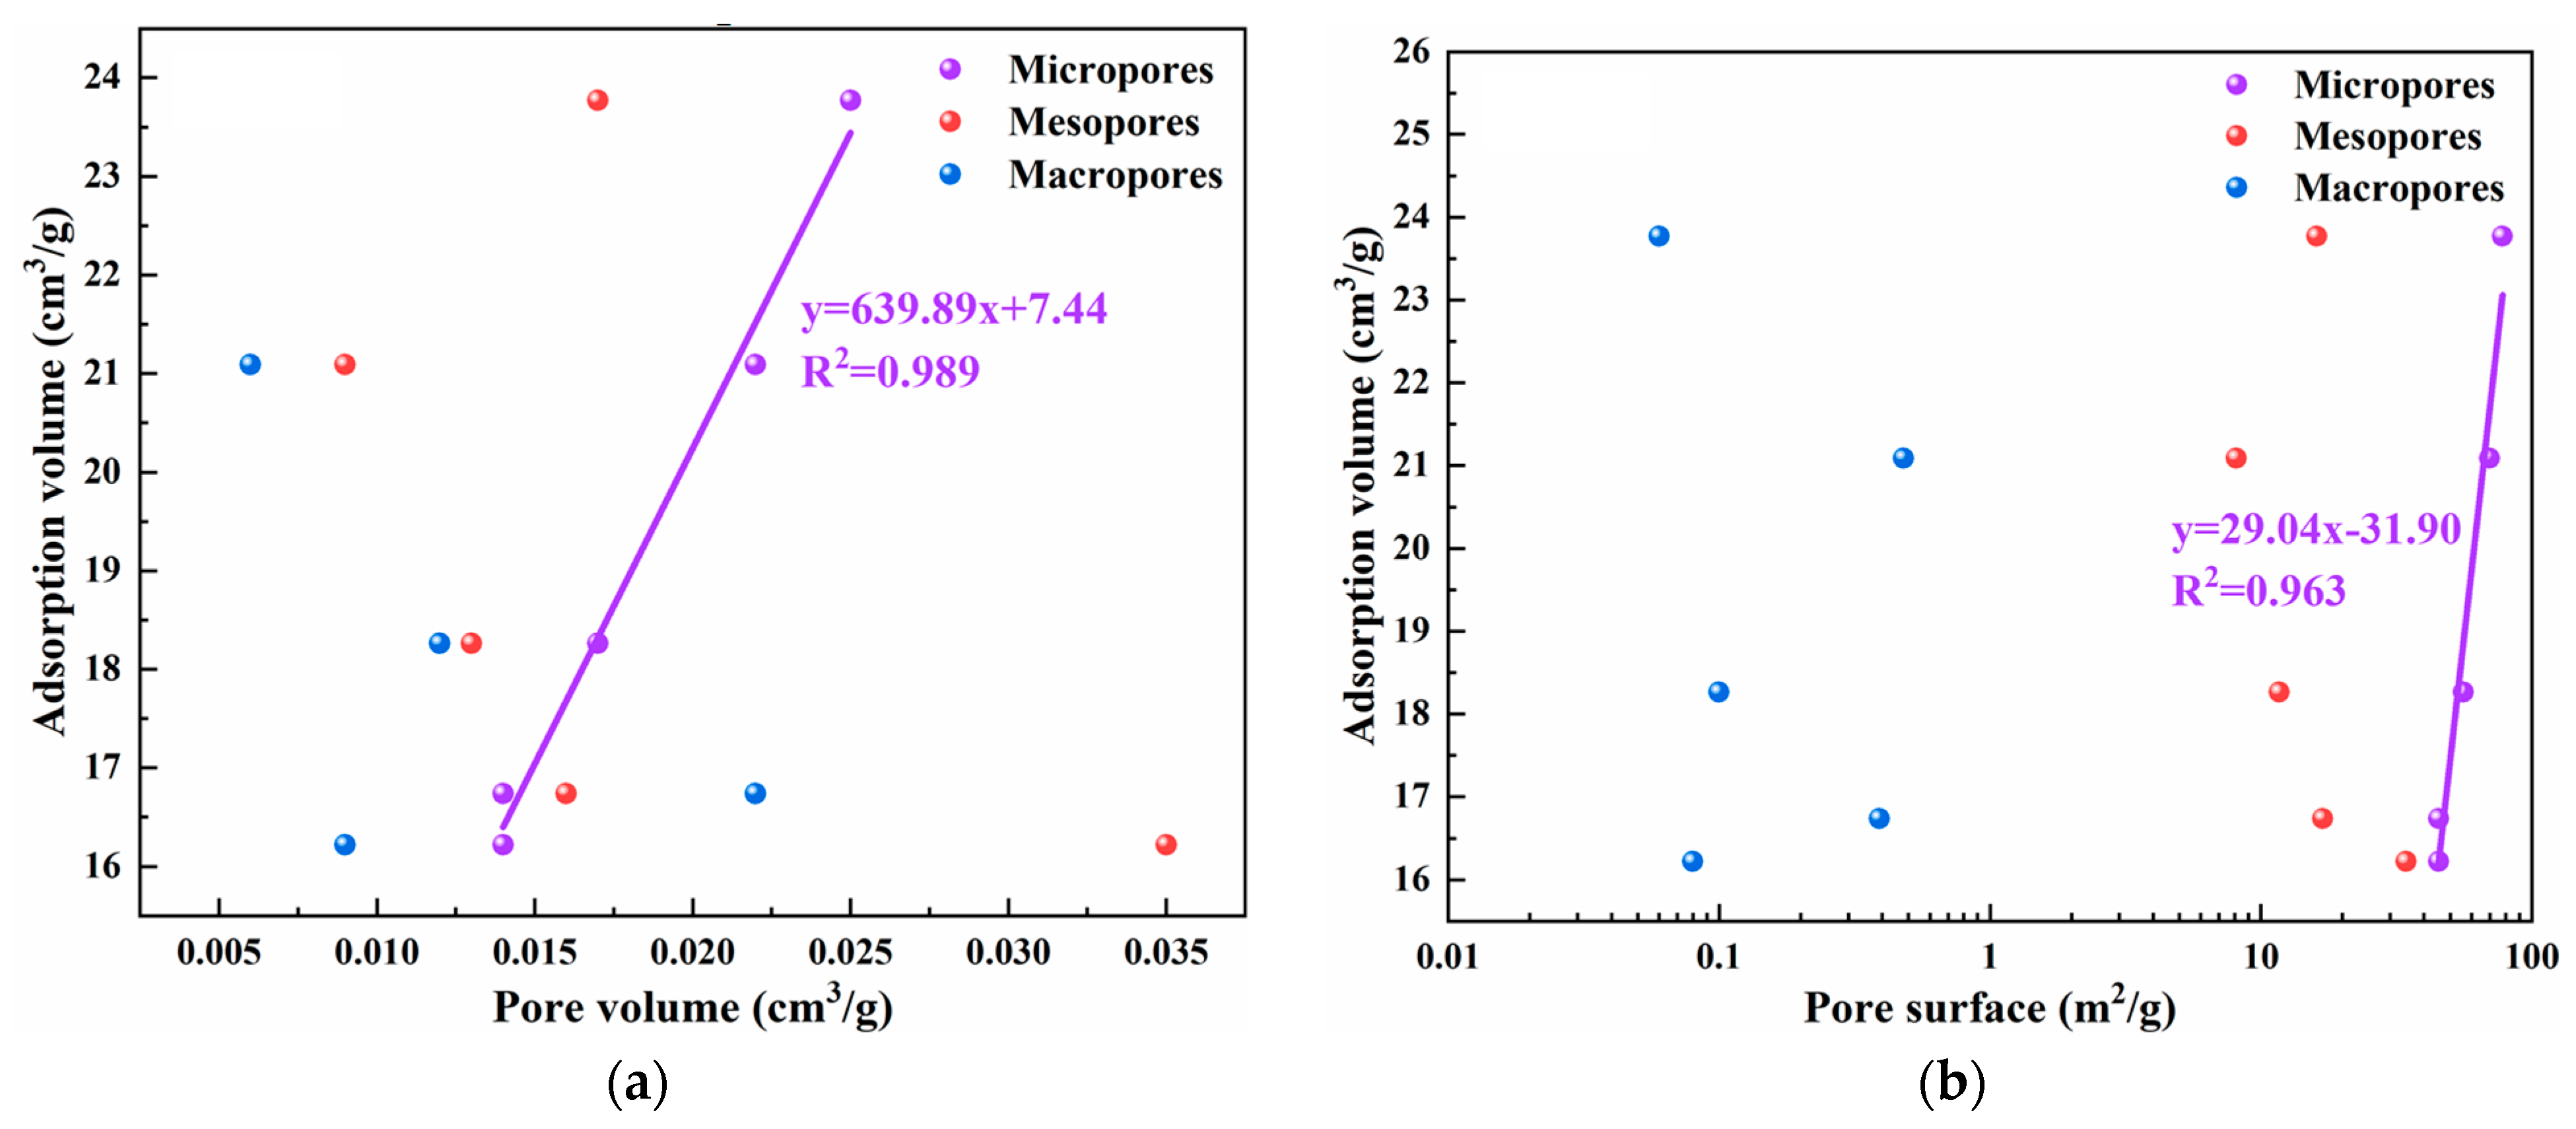
4.2. Influences of Pore Structure on the Capacity of Methane Adsorption

The methane migration process is significantly impacted by the pore structure of coal [20,22,39]. Figure 15 illustrates the correlation between methane adsorption and pore structure characteristics. The results indicate a significant positive correlation between the methane adsorption capacity and both the micropore volume (R2 = 0.989) and micropore-specific surface area (R2 = 0.963) but not with the volume and specific surface area of macropores and mesopores.
The adsorption of methane within and onto the surface of micropores is primarily facilitated through volume filling, single-layer adsorption, and multi-layer adsorption. Due to the abundance of efficient methane absorption sites within micropores, adsorption expands in proportion to the volume and specific surface area of the micropore. In contrast, seepage and diffusion predominate in the migration of methane through macropores and mesopores. Thus, there was no significant relationship between the pore volume and specific surface area of mesopores and macropores and their methane adsorption capacity. It is feasible to conclude that the volume and specific surface area of micropores largely determine the methane adsorption capacity of the experimental samples.
Compared with previous research results [20], while the capacity of deep low-rank coal in Pianji to adsorb methane is not significantly influenced by mesopores and macropores, it has a positive correlation with micropore-specific surface area and pore volume. The observed correlation points to the micropores’ function as favorable locations for the adsorption of methane. The observed positive correlation between the fractal dimension of micropores and the quantity of methane adsorption implies that an increase in the surface irregularity of the pore structure corresponds to a higher capacity for methane adsorption. The resemblance between these results and those obtained for low-rank coal in the Tiefa Basin indicates that adsorption capacity is primarily determined by the micropore structure.

4.3. Influences of Fractal Dimension on the Capacity of Methane Adsorption

The capacity for methane adsorption depends on coal rank, components, and environmental conditions [41,42]. However, there is a scarcity of reported observations regarding the impact of fractal dimensions on the capacity for methane absorption. As illustrated in Figure 16, the capacity of methane adsorption is significantly influenced by the three fractal dimensions calculated above. Among them, the adsorption capacity positively correlates with D1 (R2 = 0.872) and D2 (R2 = 0.888) but negatively correlates with D3 (R2 = 0.784).
Since micropores can be characterized by CO2 adsorption tests, D1 can be utilized to represent the asymmetry in micropore pore structure. More methane can be absorbed if the D1 value is high, which indicates that the micropore structure is highly irregular. In addition, as indicated above, two distinct patterns of gas adsorption features were seen in the 0–0.5 and 0.5–1.0 relative pressure ranges during N2 adsorption experiments. D2 and D3 are frequently used to illustrate the heterogeneity in the pore surface and structure, respectively [1,38]. The higher the D2, the more irregular the surface, which offers more space for gas adsorption, and the greater the methane adsorption capacity. Moreover, D3 reflects capillary condensation and seepage in the coal matrix. The larger D3 suggests a more heterogeneous pore structure and an increased gas surface friction, causing a lower methane adsorption volume.

4.4. Influences of Pore Structure and Fractal Dimension on the Capacity of Methane Seepage

Permeability indicates the mass transfer capacity of porous rock, which is primarily determined by many factors such as rock porosity, pore connectivity, and pore heterogeneity [22]. As shown in Figure 17, methane seepage capability is significantly affected by the macropores’ structural features. Among them, adsorption capacity has a positive correlation with macropor volume (R2 = 0.761) and connected porosity (R2 = 0.702) but negatively correlates with D3 (R2 = 0.888).
The principal sites of methane seepage are macropores. Growing macropores provide for more space for gas movement, and the permeability increases, indicating enhanced methane seepage capability. Furthermore, the connection of macropores has a massive impact on controlling permeability. In coal, connected pores are primarily responsible for the seepage capacity, while isolated pores, closed pores, and blind pores can supply a certain pore volume but do not contribute to seepage capacity [6,7,43]. Methane seepage capacity increases as connection porosity rises. Meanwhile, D4 reflects the heterogeneity in macroporous pore structure. An enhancement in D4 indicates that the macropore structure is more diverse and complex. A complex pore structure is not favorable to gas transport, resulting in decreased permeability.

5. Conclusions

Pore structure features and their effects on the capacity of methane adsorption and seepage of deep and shallow low-rank coal from Daqiang Coal Mine in Tiefa Coalfield, northeast China, were explored using MIP, CT, and gas (N2/CO2) adsorption tests. The following findings were reached.
(1) In terms of porosity, permeability, composition, and adsorption content, deep low-rank coal rock differs substantially from shallow low-rank coal rock. Deep low-rank coal rock processes lower porosity, permeability, and Mad and Aad content and higher VMad and FCad content, Langmuir volume, and pressure.
(2) A combination of MIP and N2/CO2 adsorption assays was utilized to examine the full-scale pore structure of the numbered samples. Mesopores are prevalent in shallow coal rock, whereas micropores are the most numerous in deep coal rock. The primary contributors to the specific surface area of both deep and superficial coal rock are micropores.
(3) A 3D reconstruction was carried out to precisely and intuitively describe the pore structure of pores larger than 1μm. More mini-scale pores and fissures can be observed in deep coal rock. The total porosity of deep coal rock is relatively modest, as are the interconnected pores.
(4) N2/CO2 adsorption and MIP data reveal that the pore structure of the numbered samples shows noticeable multipartite features. Moreover, the relationship D1 ≈ D2 < D3 < D4 indicates that the heterogeneity in the coal samples grows as pore size rises.
(5) Deep low-rank coal, located at a depth of 1000 m, is predominantly affected by pressure, in contrast to shallow low-rank coal. Under pressure, the volumes of mesopores and macropores diminish considerably, and they reorganize into micropores. As a consequence, there is an enhancement in the magnitude of micropores, heightened variability in the overall distribution of pore sizes, and decreased connectivity.
(6) The primary determinant of methane adsorption capacity is the pore structure of micropores and mesopores. The adsorption capacity is positively correlated with the D1 and D2 dimensions and the volume and specific surface area of the micropores and is negatively correlated with D3. Furthermore, the capacity of methane to permeate through pores is predominantly influenced by the pore structure of macropores. The pore structure is positively correlated with the volume and connected porosity of the macropores but negatively correlated with the D4.

Author Contributions

Conceptualization, N.Z.; methodology, S.W.; software, J.W.; validation, Z.L. and X.W.; resources, N.Z.; writing—original draft preparation, S.W.; writing—review and editing, S.W.; funding acquisition, N.Z. All authors have read and agreed to the published version of the manuscript.

Funding

Funding for this study was provided by the National Natural Science Foundation of China (42277195), the Innovation Fund Research of China University of Mining & Technology, Beijing (2016YFC0600901), the Fundamental Research Funds for the Central Universities of China (2021YJSSB10), and the Undergraduate Innovation Program of China University of Mining & Technology, Beijing (C202006968).

Data Availability Statement

No new data were created or analyzed in this study.

Conflicts of Interest

The authors declare no conflict of interest.

References

  1. Fu, H.; Tang, D.; Xu, T.; Xu, H.; Tao, S.; Li, S.; Yin, Z.; Chen, B.; Zhang, C.; Wang, L. Characteristics of pore structure and fractal dimension of low-rank coal: A case study of Lower Jurassic Xishanyao coal in the southern Junggar Basin, NW China. Fuel 2017, 193, 254–264. [Google Scholar] [CrossRef]
  2. Xin, F.; Xu, H.; Tang, D.; Yang, J.; Chen, Y.; Cao, L.; Qu, H. Pore structure evolution of low-rank coal in China. Int. J. Coal. Geol. 2019, 205, 126–139. [Google Scholar] [CrossRef]
  3. Thommes, M.; Kaneko, K.; Neimark, A.V.; Olivier, J.P.; Rodriguez-Reinoso, F.; Rouquerol, J.; Sing, K.S.W. Physisorption of gases, with special reference to the evaluation of surface area and pore size distribution (IUPAC Technical Report). Pure Appl. Chem. 2015, 87, 1051–1069. [Google Scholar] [CrossRef]
  4. Gan, H.; Nandi, S.P.; Walker, P.L. Nature of the porosity in American coals. Fuel 1972, 51, 272–277. [Google Scholar] [CrossRef]
  5. Li, X.; Kang, Y.; Haghighi, M. Investigation of pore size distributions of coals with different structures by nuclear magnetic resonance (NMR) and mercury intrusion porosimetry (MIP). Measurement 2018, 116, 122–128. [Google Scholar] [CrossRef]
  6. Liu, W.; Wang, G.; Han, D.; Xu, H.; Chu, X. Accurate characterization of coal pore and fissure structure based on CT 3D reconstruction and NMR. J. Nat. Gas Sci. Eng. 2021, 96, 104242. [Google Scholar] [CrossRef]
  7. Wang, G.; Han, D.; Qin, X.; Liu, Z.; Liu, J. A comprehensive method for studying pore structure and seepage characteristics of coal mass based on 3D CT reconstruction and NMR. Fuel 2020, 281, 118735. [Google Scholar] [CrossRef]
  8. Clarkson, C.R.; Solano, N.; Bustin, R.M.; Bustin, A.M.M.; Chalmers, G.R.L.; He, L.; Melnichenko, Y.B.; Radliński, A.P.; Blach, T.P. Pore structure characterization of North American shale gas reservoirs using USANS/SANS, gas adsorption, and mercury intrusion. Fuel 2013, 103, 606–616. [Google Scholar] [CrossRef]
  9. Okolo, G.N.; Everson, R.C.; Neomagus, H.W.J.P.; Roberts, M.J.; Sakurovs, R. Comparing the porosity and surface areas of coal as measured by gas adsorption, mercury intrusion and SAXS techniques. Fuel 2015, 141, 293–304. [Google Scholar] [CrossRef]
  10. Guo, X.; Huang, Z.; Zhao, L.; Han, W.; Ding, C.; Sun, X.; Yan, R.; Zhang, T.; Yang, X.; Wang, R. Pore structure and multi-fractal analysis of tight sandstone using MIP, NMR and NMRC methods: A case study from the Kuqa depression, China. J. Pet. Sci. Eng. 2019, 178, 544–558. [Google Scholar] [CrossRef]
  11. Wang, F.; Yang, K.; You, J.; Lei, X. Analysis of pore size distribution and fractal dimension in tight sandstone with mercury intrusion porosimetry. Results. Phys. 2019, 13, 102283. [Google Scholar] [CrossRef]
  12. Wang, F.; Yang, K.; Cai, J. Fractal characterization of tight oil reservoir pore structure using nuclear magnetic resonance and mercury intrusion porosimetry. Fractals 2018, 26, 1840017. [Google Scholar] [CrossRef]
  13. Song, Z.; Liu, G.; Yang, W.; Zou, H.; Sun, M.; Wang, X. Multi-fractal distribution analysis for pore structure characterization of tight sandstone—A case study of the Upper Paleozoic tight formations in the Longdong District, Ordos Basin. Mar. Pet. Geol. 2018, 92, 842–854. [Google Scholar] [CrossRef]
  14. Yan, J.; Zhang, S.; Wang, J.; Hu, Q.; Wang, M.; Chao, J. Applying Fractal Theory to Characterize the Pore Structure of Lacustrine Shale from the Zhanhua Depression in Bohai Bay Basin, Eastern China. Energ. Fuel. 2018, 32, 7539–7556. [Google Scholar] [CrossRef]
  15. Lai, J.; Wang, G. Fractal analysis of tight gas sandstones using high-pressure mercury intrusion techniques. J. Nat. Gas Sci. Eng. 2015, 24, 185–196. [Google Scholar] [CrossRef]
  16. Turlapati, V.Y.; Prusty, B.K.; Bakshi, T. Detailed Pore Structure Study of Damodar Valley and Upper Assam Basin Shales Using Fractal Analysis. Energ. Fuel. 2020, 34, 14001–14011. [Google Scholar] [CrossRef]
  17. Zhang, J.; Li, X.; Wei, Q.; Sun, K.; Zhang, G.; Wang, F. Characterization of Full-Sized Pore Structure and Fractal Characteristics of Marine–Continental Transitional Longtan Formation Shale of Sichuan Basin, South China. Energ. Fuel. 2017, 31, 10490–10504. [Google Scholar] [CrossRef]
  18. Zhou, L.; Kang, Z. Fractal characterization of pores in shales using NMR: A case study from the Lower Cambrian Niutitang Formation in the Middle Yangtze Platform, Southwest China. J. Nat. Gas Sci. Eng. 2016, 35, 860–872. [Google Scholar] [CrossRef]
  19. Yao, Y.; Liu, D.; Che, Y.; Tang, D.; Tang, S.; Huang, W. Petrophysical characterization of coals by low-field nuclear magnetic resonance (NMR). Fuel 2010, 89, 1371–1380. [Google Scholar] [CrossRef]
  20. Wei, Q.; Li, X.; Zhang, J.; Hu, B.; Zhu, W.; Liang, W.; Sun, K. Full-size pore structure characterization of deep-buried coals and its impact on methane adsorption capacity: A case study of the Shihezi Formation coals from the Panji Deep Area in Huainan Coalfield, Southern North China. J. Pet. Sci. Eng. 2019, 173, 975–989. [Google Scholar] [CrossRef]
  21. Zhu, J.; Zhang, Y.; Zhang, R.; Zhang, B.; Tang, J.; He, F. Surface fractal dimensions as a characterization parameter for methane adsorption–induced coal strains. Arab. J. Geosci. 2020, 13, 997. [Google Scholar] [CrossRef]
  22. Cai, Y.; Liu, D.; Pan, Z.; Yao, Y.; Li, J.; Qiu, Y. Pore structure and its impact on CH4 adsorption capacity and flow capability of bituminous and subbituminous coals from Northeast China. Fuel 2013, 103, 258–268. [Google Scholar] [CrossRef]
  23. Yu, S.; Bo, J.; Fengli, L.; Jiegang, L. Structure and fractal characteristic of micro- and meso-pores in low, middle-rank tectonic deformed coals by CO2 and N2 adsorption. Micropor. Mesopor. Mat. 2017, 253, 191–202. [Google Scholar] [CrossRef]
  24. Jiang, J.; Yang, W.; Cheng, Y.; Zhao, K.; Zheng, S. Pore structure characterization of coal particles via MIP, N2 and CO2 adsorption: Effect of coalification on nanopores evolution. Powder Technol. 2019, 354, 136–148. [Google Scholar] [CrossRef]
  25. Nie, B.; Liu, X.; Yang, L.; Meng, J.; Li, X. Pore structure characterization of different rank coals using gas adsorption and scanning electron microscopy. Fuel 2015, 158, 908–917. [Google Scholar] [CrossRef]
  26. GB/T 6948-2008; Method of Determining Microscopically the Reflectance of Vitrinite in Coal. Standardization administration: Beijing, China, 2008.
  27. GB/T 8899-2013; Determination of Maceral Group Composition and Minerals in Coal. Standardization administration: Beijing, China, 2013.
  28. ISO 17246:2010; Coal Proximate Analysis. International Organization for Standardization: Geneva, Switzerland, 2010.
  29. GB/T 19143-2017; Analytical Method of Element for Carbon, Hydrogen, Oxygen and Nitrogen in Rock Organics. Standardization administration: Beijing, China, 2017.
  30. GB/T 29172-2012; Practices For core Analysis. Standardization administration: Beijing, China, 2012.
  31. GB/T 21650.3-2011; Pore Size Distribution and Porosity of Solid Materials Bymercury Porosimetry and Gas Adsorption—Part 3 Analysis of Micropores by Gas Adsorption. Standardization administration: Beijing, China, 2011.
  32. Qi, L.; Tang, X.; Wang, Z.; Peng, X. Pore characterization of different types of coal from coal and gas outburst disaster sites using low temperature nitrogen adsorption approach. Int. J. Min. SCI. Technol. 2017, 27, 371–377. [Google Scholar] [CrossRef]
  33. GB/T 19560-2008; Experimental Method of High-Pressure Isothermal Adsorption to Coal. Standardization administration: Beijing, China, 2008.
  34. Qi, H.; Ma, J.; Wong, P.-z. Adsorption isotherms of fractal surfaces. Colloids Surfaces A 2002, 206, 401–407. [Google Scholar] [CrossRef]
  35. Yao, Y.; Liu, D.; Tang, D.; Tang, S.; Huang, W. Fractal characterization of adsorption-pores of coals from North China: An investigation on CH4 adsorption capacity of coals. Int. J. Coal. Geol. 2008, 73, 27–42. [Google Scholar] [CrossRef]
  36. Rouquerol, J.; Avnir, D.; Fairbridge, C.W.; Everett, D.H.; Haynes, J.M.; Pernicone, N.; Ramsay, J.D.F.; Sing, K.S.W.; Unger, K.K. Recommendations for the characterization of porous solids. Pure Appl. Chem. 1994, 66, 1739–1758. [Google Scholar] [CrossRef]
  37. Liu, X.; Kong, X.; Nie, B.; Song, D.; He, X.; Wang, L. Pore Fractal Dimensions of Bituminous Coal Reservoirs in North China and Their Impact on Gas Adsorption Capacity. Nat. Resour. Res. 2021, 30, 4585–4596. [Google Scholar] [CrossRef]
  38. Li, Z.; Lin, B.; Gao, Y.; Cao, Z.; Cheng, Y.; Yu, J. Fractal analysis of pore characteristics and their impacts on methane adsorption of coals from Northern China. Int. J. Oil. Gas. Coal. T. 2015, 10, 306–324. [Google Scholar] [CrossRef]
  39. Yao, Y.; Liu, D.; Tang, D.; Tang, S.; Huang, W.; Liu, Z.; Che, Y. Fractal characterization of seepage-pores of coals from China: An investigation on permeability of coals. Comput. Geocsi-UK 2009, 35, 1159–1166. [Google Scholar] [CrossRef]
  40. Mahamud, M.; López, Ó.; Pis, J.J.; Pajares, J.A. Textural characterization of coals using fractal analysis. Fuel Process. Technol. 2003, 81, 127–142. [Google Scholar] [CrossRef]
  41. Zhang, S.; Tang, S.; Tang, D.; Pan, Z.; Yang, F. The characteristics of coal reservoir pores and coal facies in Liulin district, Hedong coal field of China. Int. J. Coal. Geol. 2010, 81, 117–127. [Google Scholar] [CrossRef]
  42. Wu, S.; Tang, D.; Li, S.; Meng, Y.; Lin, W. Evaluation of pore development in different coal reservoirs based on centrifugation experiment. J. Pet. Sci. Eng. 2017, 157, 1095–1105. [Google Scholar] [CrossRef]
  43. Yao, Y.; Liu, D.; Cai, Y.; Li, J. Advanced characterization of pores and fractures in coals by nuclear magnetic resonance and X-ray computed tomography. Sci. China. Earth. SCI. 2010, 53, 854–862. [Google Scholar] [CrossRef]
Figure 1. Geographic map and stratigraphic column of the Daqiang Coal Mine.
Fractalfract 08 00048 g001
Figure 2. Methane adsorption isotherms (30 °C) and the correlation between (a) Ro,max (b), moisture content (c), and Langmuir volumes.
Fractalfract 08 00048 g002
Figure 3. (a) CO2 adsorption isotherm and PSD curves of (b) DQ1, (c) DQ2, (d) DQ3, (e) DQ4, (f) DQ5.
Fractalfract 08 00048 g003aFractalfract 08 00048 g003b
Figure 4. N2 adsorption and desorption isotherm of (a) DQ1, (b) DQ2, (c) DQ3, (d) DQ4, (e) DQ5.
Fractalfract 08 00048 g004
Figure 5. Pore size distribution curves of N2 adsorption of (a) DQ1, (b) DQ2, (c) DQ3, (d) DQ4, (e) DQ5.
Fractalfract 08 00048 g005
Figure 6. Mercury intrusion and extrusion curves of (a) DQ1, (b) DQ2, (c) DQ3, (d) DQ4, (e) DQ5.
Fractalfract 08 00048 g006aFractalfract 08 00048 g006b
Figure 7. PSD curves of MIP of (a) DQ1, (b) DQ2, (c) DQ3, (d) DQ4, (e) DQ5.
Fractalfract 08 00048 g007
Figure 8. Three-dimensional CT reconstructed images of (a) DQ1, (b) DQ2, (c) DQ3, (d) DQ4, (e) DQ5 (The different colors in the figure represent different pores).
Fractalfract 08 00048 g008
Figure 9. Total porosity and connected porosity.
Fractalfract 08 00048 g009
Figure 10. Fractal dimensions of micropores of (a) DQ1, (b) DQ2, (c) DQ3, (d) DQ4, (e) DQ5 (D1: 0.4 nm < fractal dimensions of pore diameter ≤ 2 nm).
Fractalfract 08 00048 g010
Figure 11. Fractal dimensions of mesopores of (a) DQ1, (b) DQ2, (c) DQ3, (d) DQ4, (e) DQ5 (D2: 2 nm < fractal dimensions of pore diameter ≤ 5 nm; D3: 5 nm < fractal dimensions of pore diameter ≤ 50 nm).
Fractalfract 08 00048 g011
Figure 12. Fractal dimensions of micropores of (a) DQ1, (b) DQ2, (c) DQ3, (d) DQ4, (e) DQ5 (D4: fractal dimensions of pore diameter > 50 nm).
Fractalfract 08 00048 g012
Figure 13. PSD curves of the full-scale pore volumes of (ae).
Fractalfract 08 00048 g013
Figure 14. PSD curves of the full-scale specific surface areas of (ae).
Fractalfract 08 00048 g014
Figure 15. Relationship between pore volume (a) and specific surface area (b) and adsorption volume.
Fractalfract 08 00048 g015
Figure 16. Relationship between fractal dimensions D1 (a), D2 (b), and D3 (c) and adsorption volume.
Fractalfract 08 00048 g016
Figure 17. Relationship between macropore volume (a), connected porosity (b), and fractal dimensions D4 (c) and permeability.
Fractalfract 08 00048 g017
Table 1. Statistical table of test samples from the Daqiang Coal Mine in the Tiefa Basin [20].
No.Ro,max
(%)
Porosity
φ (%)
Permeability
K (mD)
Proximate Analysis (%)Coal Composition (%)Methane Isothermal Adsorption
Moisture ContentAsh YieldVolatile MatterFixed CarbonVitrinite/
Huminite
InertiniteExiniteVL
(cm3/g)
PL
(MPa)
DQ10.624.140.0206.233.4638.1551.9284.1711.614.2223.922.02
DQ20.582.870.0246.284.3138.3950.3289.846.803.3621.222.03
DQ30.6010.980.2746.6127.1131.3134.5783.528.647.8418.472.06
DQ40.6311.700.5436.9821.7835.5836.1391.915.622.4716.341.92
DQ50.6416.150.9487.2123.2831.9938.7783.4514.571.9816.741.89
W-10.814.54/1.4919.7337.39/80.0410.787.1011.662.39
W-20.734.48/1.258.8642.62/68.7321.327.6413.512.72
W-30.753.07/1.4110.6841.15/83.1513.431.6512.981.16
W-40.7224.24/1.4032.1043.67/38.4129.785.5615.422.50
W-50.7411.12/1.4320.7342.07/71.0012.586.6523.441.08
W-60.8017.33/1.0815.2038.22/75.4646.547.6517.743.11
VL: Langmuir volume, PL: Langmuir pressure.
Table 2. Pore structure characteristics of the full pore diameter section of coal samples.
Sample No.Vtotal/
(cm3·g−1)
Volume/
(cm3·g−1)
Volume ratio/
(%)
Stotal/
(m2·g−1)
Specific Surface Area/
(m2·g−1)
Specific Surface Area ratio/(%)
V1V2V3V1V2V3S1S2S3S1S2S3
DQ10.0480.0250.0170.00751.5534.6913.7694.1578.0316.060.0682.8817.060.06
DQ20.0370.0220.0090.00659.0923.9316.9878.5469.948.120.4889.0510.340.61
DQ30.0420.0170.0130.01241.7429.9028.3667.7955.9811.710.1087.5717.280.15
DQ40.0580.0140.0350.00924.2560.5515.2079.8945.3634.450.0856.7843.130.09
DQ50.0520.0140.0160.02226.7831.9641.2662.7145.4616.960.3972.3827.010.61
Vtotal: total pore volume, Stotal: total specific surface area, V1: pore volume (r ≤ 2 nm), V2: pore volume (2 nm < r ≤ 50 nm), V3: pore volume (r > 50 nm), S1: specific surface area (r ≤ 2 nm), S2: specific surface area (2 nm < r ≤ 50 nm), S3: specific surface area (r > 50 nm).
Table 3. Pore volume and proportion.
Sample No.Equivalent Diameter/μmEquivalent Diameter Interval/μmStatistical FrequencyPorosity Ratio
/%
DQ13.441 < dep ≤ 1079020.97
10 < dep ≤ 502146.52
50 < dep ≤ 1001773.22
dep > 100419.29
DQ23.761 < dep ≤ 1081090.95
10 < dep ≤ 502165.23
50 < dep ≤ 1002275.22
dep > 100318.61
DQ34.311 < dep ≤ 1070160.94
10 < dep ≤ 501723.21
50 < dep ≤ 1002516.12
dep > 1001179.73
DQ44.021 < dep ≤ 1065631.19
10 < dep ≤ 501612.52
50 < dep ≤ 1002220.73
dep > 1001075.56
DQ55.081 < dep ≤ 1079650.83
10 < dep ≤ 501943.21
50 < dep ≤ 1002510.23
dep>1001785.73
Table 4. Calculation results for fractal dimensions of full-scale pores.
Sample No.D1
(0.4–2 nm)
D2
(2–5 nm)
D3
(5–50 nm)
D4
(>50 nm)
DQ12.3372.3752.7752.980
DQ22.3352.3652.7572.971
DQ32.3302.3612.7732.951
DQ42.3242.3542.8042.957
DQ52.3212.3582.8122.946
Disclaimer/Publisher’s Note: The statements, opinions and data contained in all publications are solely those of the individual author(s) and contributor(s) and not of MDPI and/or the editor(s). MDPI and/or the editor(s) disclaim responsibility for any injury to people or property resulting from any ideas, methods, instructions or products referred to in the content.

