Article

Geochemical Characteristics of Deep-Sea Sediments in Different Pacific Ocean Regions: Insights from Fractal Modeling

1
Key Laboratory of Marine Mineral Resources, Ministry of Natural Resources, Guangzhou Marine Geological Survey, China Geological Survey, Guangzhou 511458, China
2
National Engineering Research Center for Gas Hydrate Exploration and Development, Guangzhou 511458, China
3
School of Earth Sciences and Engineering, Sun Yat-sen University, Zhuhai 519000, China
*
Author to whom correspondence should be addressed.
Fractal Fract. 2024, 8(1), 45; https://doi.org/10.3390/fractalfract8010045
Submission received: 25 November 2023 / Revised: 3 January 2024 / Accepted: 9 January 2024 / Published: 11 January 2024
(This article belongs to the Special Issue Fractals in Geology and Geochemistry)

Abstract

:
Exploration of mineral resources in the deep sea has become an international trend. However, deep-sea mineral exploration faces challenges such as complex offshore drilling and the weak and mixed signals of ore deposits. Therefore, studying methods for identifying weak and mixed anomalies and extracting composite information in the deep sea is crucial for innovative prediction and evaluation of deep-sea mineral resources. In this study, the Central Pacific Ocean, Northwestern Pacific Ocean, and Eastern Pacific Ocean were selected as research areas. Drawing upon the fractal self-similarity exhibited by rare earth minerals in the deep-sea sediments within the Pacific Ocean, we conducted an analysis and comparison of the fractal geochemical characteristics in various regions of the Pacific Ocean’s deep-sea sediments. Thereafter, we studied the spatial distribution of rare earth elements (REEs) in deep-sea sediments in these regions to explore the mechanisms responsible for rare earth enrichment in the Pacific Ocean. The results revealed that the geochemical fractal characteristics of deep-sea sediments in the Northwestern Pacific Ocean Basin and the Central Pacific Ocean Basin were similar, whereas there were slight differences in the fractal characteristics observed in the Eastern Pacific Ocean Basin. By calculating the singularity index of CaO/P2O5, it was found that the singularity index in the Central and Northwestern Pacific Ocean basins was lower than that in the Eastern Pacific Ocean Basin, suggesting that the phosphorus content in the Eastern Pacific Ocean Basin was lower than that in the Central and Northwestern Pacific Ocean basins. In the Eastern Pacific Ocean, we found that phosphorus content in deep-sea sediments was the primary controlling factor for REE enrichment. Conversely, in the Central and Northwestern Pacific Ocean, both the phosphorus and calcium content in deep-sea sediments played significant roles in REE enrichment.

1. Introduction

There has been a significant amount of research conducted by domestic and international scholars on deep-sea rare earth mineral resources [1,2]. Most scholars have analyzed the rich rare earth sediments from a mineralogical and geochemical perspective [1,3,4,5,6,7]. In terms of material sources, experts have concluded that hydroxides of Fe may be an important source of rare earth sediments in the Pacific Ocean, based on studies of deep-sea sediments in various regions [1,8]. However, laser ablation mass spectrometry results indicate that rare earth elements (REEs) in sediments are primarily associated with phosphorite derived from seawater [4]. Additionally, contributions from continental dust are also possible [2]. Regarding enrichment mechanisms, there are different opinions. Some experts believe that REEs are enriched in clay sediments containing a large amount of zeolite [3]. However, other experts argue that REEs are not highly enriched in calcium-cross zeolite and cannot adsorb REEs from seawater [9]. High concentrations of REEs may also exist in low sedimentation rate sediments that are not diluted [1]. Furthermore, Furthermore, the presence of phosphorite in fish bones significantly contributes to the enrichment of REEs within deep-sea sediments [10,11]. Abundant geochemical evidence suggests a close correlation between REEs and phosphorus [2,4,5,6,7,8]. There have been numerous reports on the geochemical traits of REE sediments in various regions of the Pacific Ocean [4,6,7,8]. However, these studies primarily focus on the correlation between REEs and mineral elements, with little mention of the nonlinear differences in the geochemical properties of sediments in distinct areas of the Pacific Ocean. In particular, there is a lack of quantitative studies on the spatial distribution characteristics of REEs in different marine areas, as well as the sources and enrichment mechanisms of REY (REEs and yttrium) from a quantitative perspective. Furthermore, there is limited research comparing the occurrence of REEs in sediments from different regions, such as the Central and Northwestern Pacific Ocean basins and the Eastern Pacific Ocean Basin. In this study, we systematically analyze and summarize the fractal characteristics of the deep-sea sediment geochemistry in different Pacific Ocean regions. We investigate the spatial variations in the occurrence of REEs in different marine areas and identify the main factors influencing REE enrichment. By employing multifractal spectrum and singularity theory, we study the spatial distribution characteristics of REEs in different marine areas, aiming to provide a theoretical basis for the future exploration and development of deep-sea REE resources.
Previous studies have shown that the REE-rich sediments in the Central and Northwestern Pacific Ocean basins mainly consist of zeolite clay and deep-sea clay. In addition to zeolite clay and deep-sea clay, the Eastern Pacific Ocean Basin also contains abundant polymetallic mud, which is primarily distributed in the Bowers Basin of the Eastern Pacific [1,12]. Furthermore, recent studies have confirmed that biogenic phosphates are the most likely REE occurrence phase in the REE-rich sediments of the Central and Northwestern Pacific Ocean basins [4]. It has also been demonstrated that the phosphate in sediments is mainly in the form of apatite [13]. For the Eastern Pacific Ocean Basin, the enrichment of REEs perhaps is associated with the precipitation of iron-manganese compounds [1], and some scholars have pointed out that their main occurrence phase is Fe-Mn hydroxide [14].
Previous studies have paid little attention to the distribution of REEs in the Eastern Pacific Ocean Basin. Especially, there have been few studies on the spatial occurrence status of REEs in deep-sea sediments in different regions. In addition, the sources and enrichment mechanisms of rare earth-rich sediments in different regions are not clear, which also affects further exploration and development of the rare earth resources in deep-sea sediments. Therefore, one of the issues that this study needs to address is the differences in the occurrence status of REEs in sediments from the Central and Northwestern Pacific Ocean and the Eastern Pacific Ocean, and whether they can be distinguished quantitatively.

2. Geochemical Background

The samples in the study area were collected from four regions (Figure 1): the Northwestern Pacific Ocean Basin, the Central Pacific Ocean Basin, the Eastern Pacific Ocean Bowers Basin, and the Eastern Pacific Ocean Tiki Basin.
The Northwestern Pacific Ocean study area is characterized by a series of intraplate hot spot-related seamounts, including the Marcus–Wake Seamount region, the Magellan Seamount region, the Marshall Islands Seamount region–Gilbert Ridge, and the Caroline Islands Seamount region. The Marcus–Wake Seamount region is located north of the Pika Feta Basin, with the Magellan Seamount group to the south and the Central Pacific Ocean Seamount group to the east. It is a discontinuous extension of submarine volcanic chain structures formed by intraplate volcanic hot spots, with only Nanshima Island exposed above sea level. The seamount chain extends northwest for nearly 1200 km. The water depth of the intermountain deep-sea basin in the Marcus–Wake Seamount region is 5000–6500 m. The Magellan Seamount region is located on the northeastern margin of the Eastern Mariana Basin and is a discontinuous extension of submarine volcanic chain structures formed by intraplate volcanic hot spots. The seamount chain extends in the NNW direction, stretching for nearly 1200 km. It is mainly composed of relatively independent flat-topped seamounts, adjacent to deep-sea basins with depths ranging from 5000 m to 6500 m. The Pigafetta Basin is located between the Marcus–Wake Seamount Zone and the Magellan Seamount Zone, with a depth of 5000 to 6500 m and a southeastward distribution. The ocean drilling data indicate that the shallow sediment in the Northwestern Pacific Ocean Basin is mainly composed of deep-sea clay, ranging in age from the Cretaceous to the Quaternary, with small amounts of volcanic ash and chert.
The Central Pacific Ocean Basin is situated north of the Manihiki Plateau, west of the Line Islands Seamounts, south of the Central Pacific Ocean Seamounts, and east of the Marshall Islands Seamounts and the Gilbert Ridge. The depth of this basin mostly ranges between 5000 and 6000 m. Analysis of ocean drilling cores shows that the shallow sediment in this region is mainly composed of brown deep-sea clay and radiolarian ooze, ranging in age from the Quaternary to the Cretaceous.
The Southeastern Pacific Ocean Basin includes the Tiki Basin and the Ball Basin. The Tiki Basin is located east of the Tuamotu Archipelago, south of the Marquesas Fault Zone, and north of the Australian Fault Zone. Its eastern edge is adjacent to the western margin of the Eastern Pacific Ocean Rise (EPR) at 19° S, with a depth of 4000 to 5000 m. The Ball Basin is located east of the EPR at 10° S, west of the Galapagos Rise, and its western side is the Wilkes Fault Zone, with a depth of 4000 to 5000 m. The crust in the Southeastern Pacific Ocean region is relatively young (possibly later than the Oligocene), located on the western margin and eastern side of the EPR. The sediment thickness in the basins is not significant, generally consisting of sediments since the Miocene. The shallow sediment is significantly influenced by hydrothermal activity from the EPR, resulting in high REE content, but the thickness of the sediment rich in REEs is not significant.

3. Geochemical Data

A systematic geochemical comparative analysis was conducted on 3369 samples from the Northwestern Pacific Ocean Basin, 2176 samples from the Central Pacific Ocean Basin, 504 samples from the Eastern Pacific Ocean Bower Basin, and 421 samples from the Eastern Pacific Ocean Tiki Basin. The basic information of each region is compared in Table 1.
We analyzed the major elements in the sediments using an X-ray fluorescence spectrometer with a detection limit ranging from 0.01% to 0.1% and a precision level of relative standard deviation (RSD) ≤ 2%. We conducted assays for trace elements and REEs using an ICP-MS instrument, which had a detection limit ranging from 0.01 to 0.1 μg/g and a precision level of RSD ≤ 2%. The sample preparation process involved weighing approximately 0.1 g of the sample, placing it in a Teflon digestion vessel, adding a drop of ultrapure water to wet the sample, and then adding 4 mL of 50% HCl, 10 mL of HF, and 2 mL of HClO4. The mixture was shaken and heated on a hot plate to evaporate the solution. Then, 4 mL of 50% HCl was added and shaken until complete dissolution. The container walls were rinsed with ultrapure water, heated until the solution became clear and transparent, and then cooled and transferred to a 25 mL volumetric flask. All samples were tested at the Laboratory of the Guangzhou Marine Geological Survey Bureau. Further details on data sampling and chemical analysis can be found in the study by Wang et al. [12].
First, we conducted univariate statistical analysis on the geochemical data obtained from the Eastern, Central, and Northwestern Pacific Ocean regions. Table 1 presents the main descriptive statistical parameters for each element. The range of the data sets can be inferred from the maximum and minimum values, indicating a relatively large variation in all datasets. Furthermore, we calculated the coefficient of variation (CV) between the sample mean and standard deviation, and the results are presented in Table 1. The CV is used to characterize the variation in element concentrations. When the CV is less than 25%, the element is considered to be uniformly distributed in the sediment, indicating a relatively single depositional source. If the CV is greater than 50%, it suggests significant variations in element concentrations, indicating a complex origin rather than a result of a single geological process. If the CV is greater than 25% but less than 50%, it indicates that the element belongs to the weakly differentiated transitional type, suggesting that its accumulation source comes from one or more. According to Table 1, the CV values of sedimentary elements in the Eastern Pacific Ocean Bower Basin and the Tiki Basin are generally higher, indicating a stronger anisotropic distribution. In contrast, the CV values for the Northwestern Pacific Ocean and Central Pacific Ocean basins are relatively lower compared to the Eastern Pacific Ocean Basin, indicating a relatively uniform distribution of sedimentary elements in the Northwestern Pacific Ocean and Central Pacific Ocean basins compared to the Eastern Pacific Ocean.

4. Methodology

4.1. Multifractal Spectrum Analysis

Fractals are commonly used to describe irregular objects in nature. Fractal and multifractal models have been successfully used to describe self-similarity in various scientific fields [15]. The distribution pattern of a single fractal has the same characteristics. In addition, a multifractal can be separated into sub-patterns, each characterized by distinct singularity indices. These sub-patterns quantify their fractal behavior, which, in turn, relates to the local scale of the entire system. The characterization of multifractal patterns typically involves the use of various indices that represent their scaling properties across different scales [16]. In this regard, multifractal patterns, consisting of various sub-patterns, are often quantified using the function f(α) denoting the fractal dimension of the specific sub-pattern characterized by the local Hurst index α. Initially, the singularity indices is extracted, followed by the calculation of the multifractal spectrum using the moment method [17].
The objective of processing geochemical data is to identify spatial relationships and recognize anomalies. The advantage of fractal methods is that they consider spatial relationships that traditional methods do not consider. The moment method is useful for local singularity and provides a description of the spatial distribution pattern of variables. In general, the local singularity index is obtained by determining the maximum modulus of the original data at each spatial point. Subsequently, the scale of the partition function χq(ε) is estimated, which involves summing the qth power of the maximum modulus of the concentration values at the ε scale [18]. On a small scale,
χ q ε = i = 1 N μ i q ε ε τ q
where ε represents the size of the box to be estimated, and μ i ε donates the total concentration of a geochemical element in the ith box. When q is greater than 0, χq(ε) reflects strong singularity, while when q is less than 0, χq(ε) reflects weak singularity. The scaling exponent τ(q) can be employed to gain insights into the diversity within spatial distribution patterns. In general, monofractals display a linear τ(q) spectrum (i.e., τ(q) = αq-1, where α represents the singularity index), whereas multifractals exhibit a nonlinear τ(q) spectrum (i.e., τ(q) = αq − f(α), where α, not constant, is related to τ(q) through the Legendre transformation [19].
f(α) = αq − τ(q)
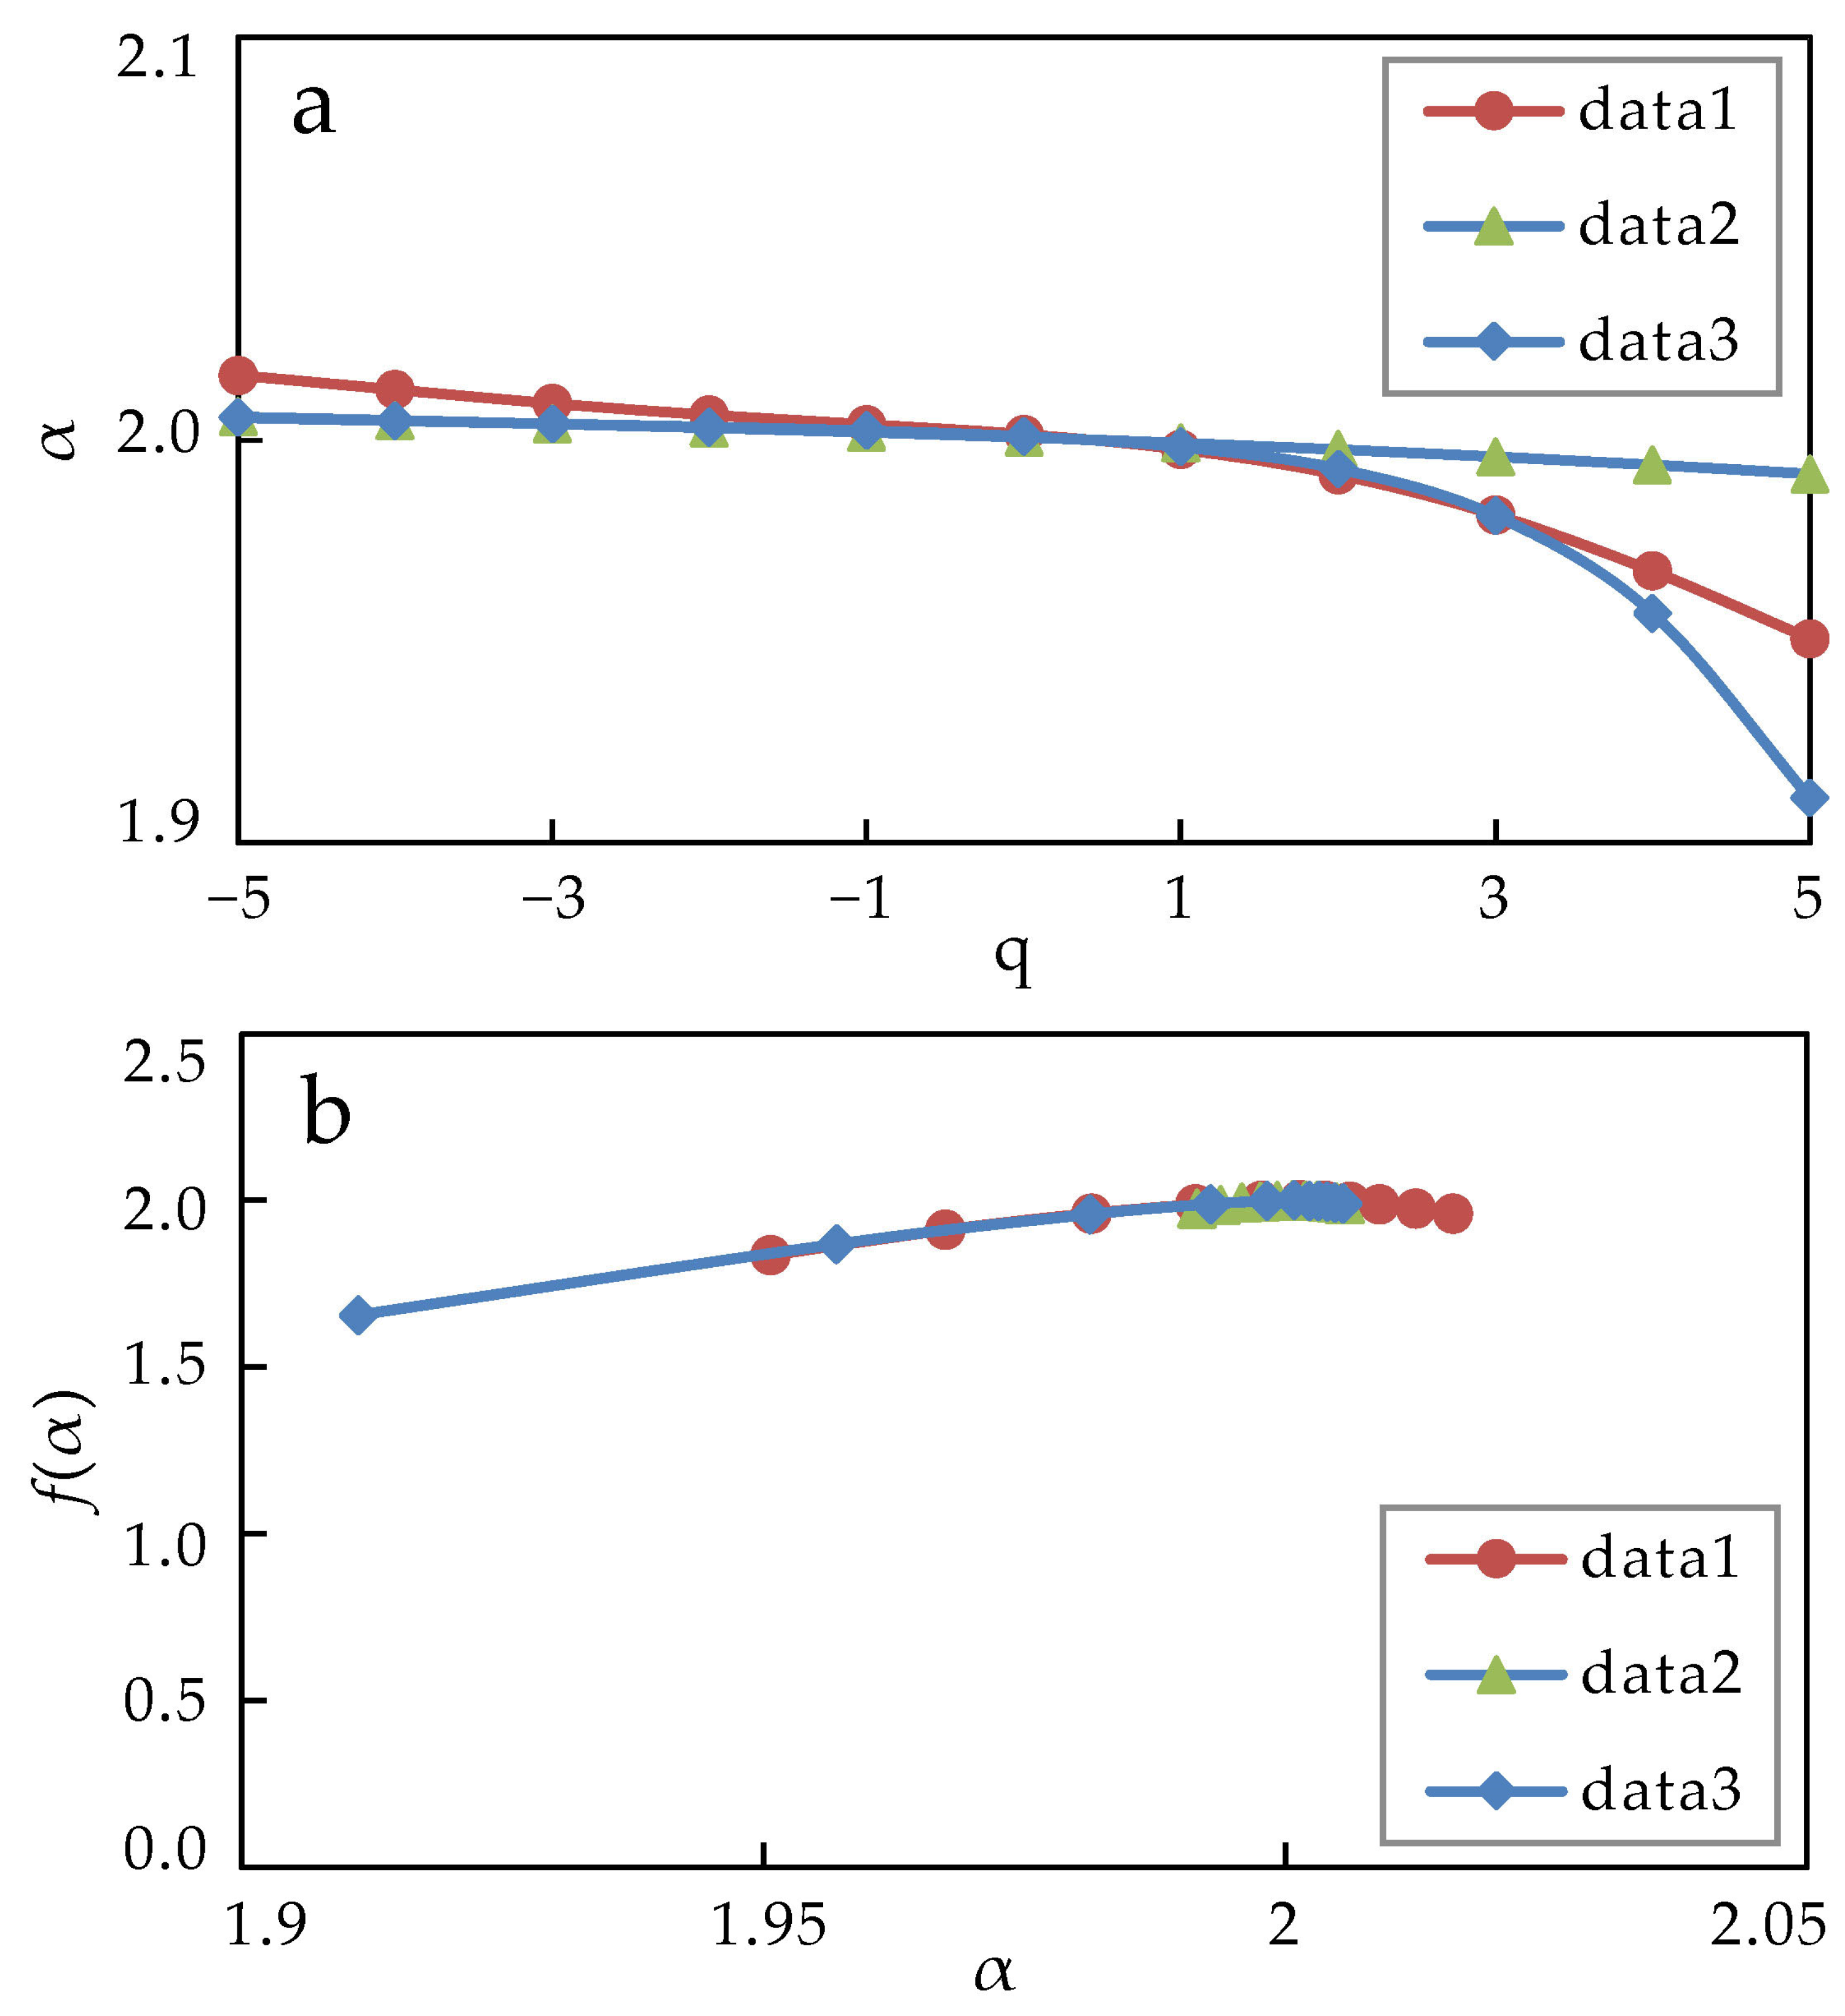
Figure 2 illustrates the process of calculating the multifractal spectrum function of rare earth data using the moment method (using the Central Pacific Ocean as an example). In Figure 2a, the range of q values for constructing the partition function is −5 to 5, with an interval of 0.25. When ε is small, χq(ε) − ε is linear. The slope of the line is fitted using the least squares approach, with a standard error of less than 0.05, as shown in Figure 2b. The singularity index α(q) is shown in Figure 2c. The multifractal spectrum f(α) is estimated through the Legendre transformation, as shown in Figure 2d. The asymmetry index, proposed by Xie and Bao [20], is utilized to quantify the extent of deviation from the symmetric multifractal spectrum curve, R ranging from −1 to 1:
R = (ΔαL − ΔαR)/(ΔαL + ΔαR)
The value of R depends on the magnitudes of ΔαL and ΔαR (Figure 2d). When ΔαL < ΔαR, the curve of multifractal spectrum shifts to the right; when ΔαL > ΔαR, the curve of multifractal spectrum shifts to the left; when ΔαL = ΔαR, the curve of multifractal spectrum has no shift [21,22].
The asymmetry index of the REEs presented here is mainly used to indicate the mineralization potential of REEs in the Pacific Ocean sediments. In addition, Δα can also be used to represent the distribution pattern of the elements. The larger the Δα value, the stronger the multifractality of the elements, and the multifractal spectrum curve may span a larger range.

4.2. S-A Fractal Model

Cheng et al. [23] established the rock geochemical “density-area” (C-A) fractal model:
A(C > υ)∝υ
where A(C > υ) represents the area of the region, in which the element content (density C) is greater than a certain threshold value υ, β is the exponent, and α represents proportionality. As the value of υ increases, A always decreases accordingly, and the variation pattern of A with υ depends on the magnitude of the exponent β. The exponent β represents the complexity of the variation of geochemical element content within this scale-free region. In the double logarithmic plot, the different slopes correspond to the background and anomaly values, and the boundary values corresponding to different line segments can be used as critical values to distinguish between the background and the anomaly. Due to the arbitrariness of the shape of area A, the C-A model can measure the anisotropic self-similarity of density and area.
Furthermore, Cheng extended the C-A concept to the frequency domain and established the “spectral density-area” (S-A) fractal model for multifractal fields [24,25].
A(S > s)∝s
where A(S > s) represents the area of the region where the spectral density S is greater than a certain value s, β is the exponent, and α represents the proportionality. As the value of s increases, A decreases accordingly, and the variation pattern of A with s depends on the magnitude of the exponent β. This model not only measures the generalized self-similarity of spatiotemporal complex patterns but also forms fractal filtering techniques based on different generalized self-similarities. By using fractal filtering techniques to decompose spatial patterns, the purpose of separating anomaly and background patterns can be achieved.

4.3. Correlation Coefficient Analysis

Correlation coefficient analysis is a commonly used statistical method for assessing the strength of the relationship between two variables [26,27,28]. The correlation coefficient provides insights into the linear relationship between the two variables, revealing the extent of their mutual influence. In this study, the Pearson correlation coefficient is utilized to measure the correlation magnitude between a pair of geochemical elements. It is calculated as:
r = i = 1 n x i x ¯ y i y ¯ i = 1 n x i x ¯ 2 i = 1 n y i y ¯ 2
where x and y represent the content values of two elements, respectively. The value of r ranges from −1 to 1, where an absolute value closer to 1 indicates a stronger linear relationship between the two variables, and an absolute value closer to 0 indicates a weaker linear relationship. A positive correlation coefficient signifies a positive relationship between the two variables, while a negative correlation coefficient signifies a negative relationship.

5. Results and Discussion

5.1. Spatial Distribution of REEs

To examine the vertical distribution patterns of REEs in the deep-sea sediments of the Northwestern Pacific Ocean, Central Pacific Ocean, and Eastern Pacific Ocean basins, we calculated vertical distribution maps for each region (Figure 3). The maps reveal that in the Central and Northwestern Pacific Ocean basins, there is a decreasing trend in the vertical distribution pattern of REEs from top to bottom. Conversely, in the Eastern Pacific Ocean Basin, the vertical distribution of REEs demonstrates an increasing trend from top to bottom.
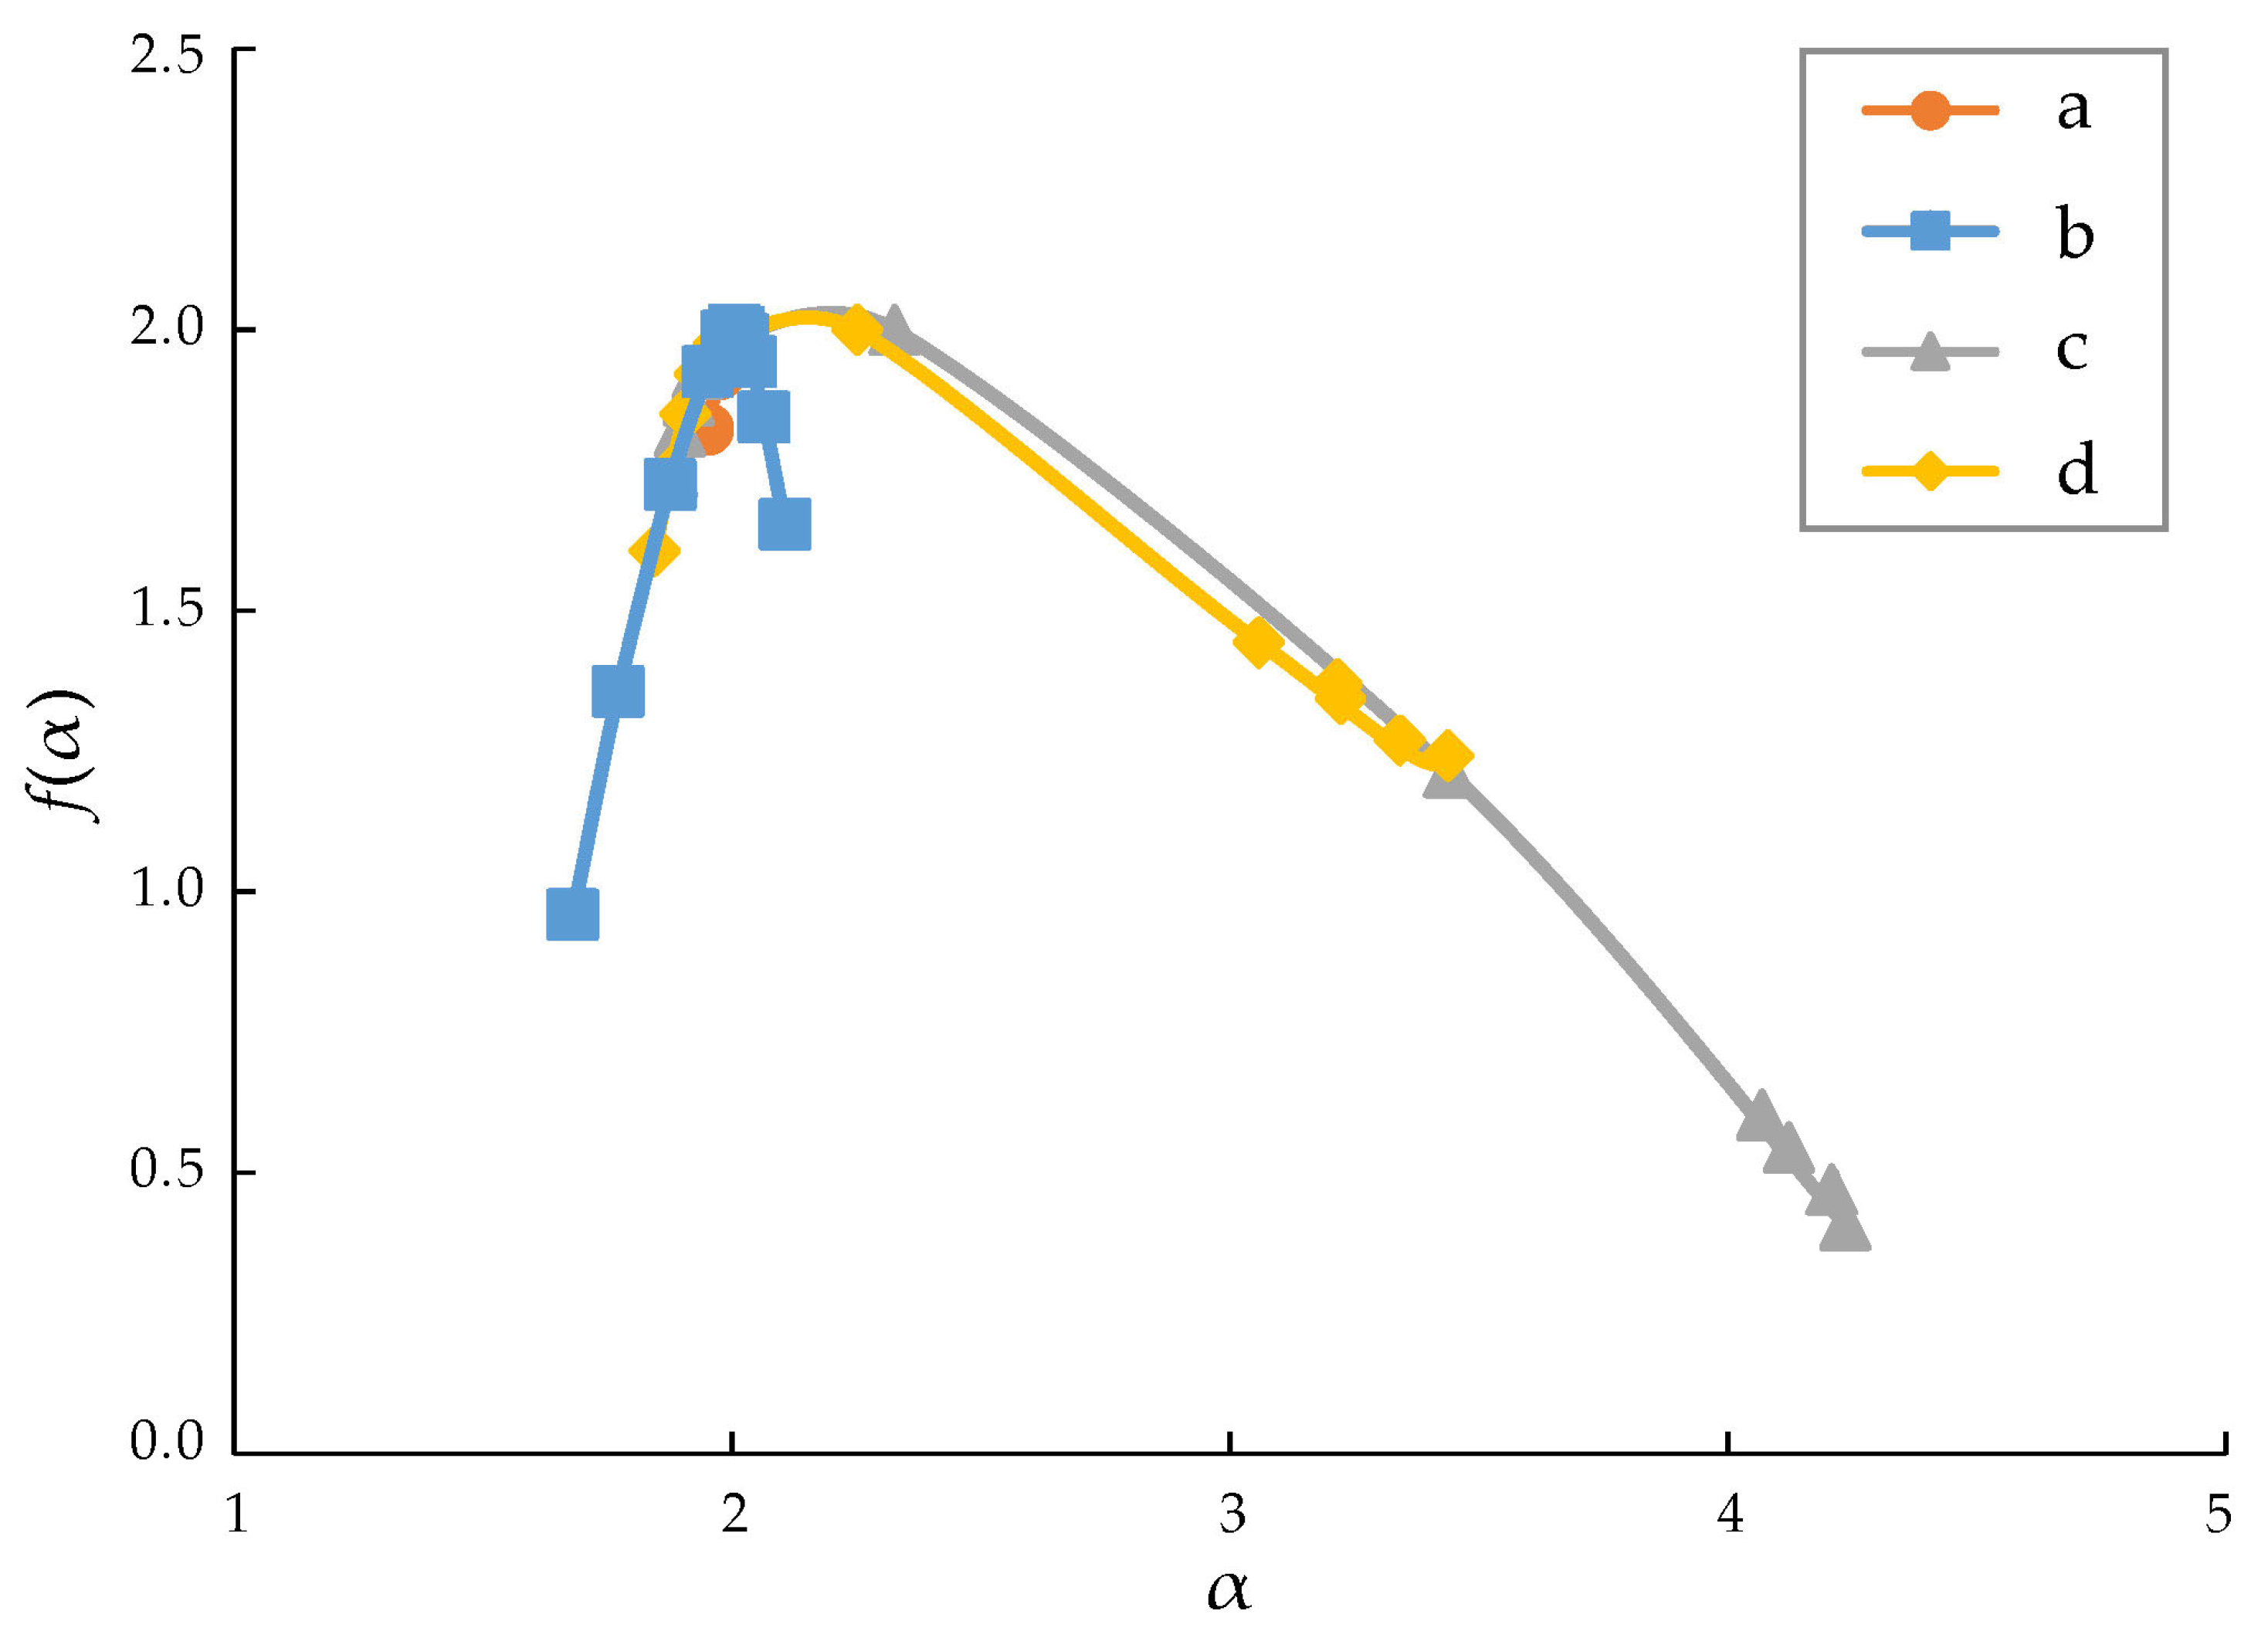
Furthermore, from the distribution maps of the anomaly index α-f(α) (Figure 4), it shows that the α-f(α) curves for the Bowers and Tiki basins in the Eastern Pacific Ocean are right-skewed, while the α-f(α) curves for the Central Pacific and Northwestern Pacific Ocean basins are left-skewed. This indicates that the REE occurrence states in the Central Pacific Ocean and Northwestern Pacific Ocean basins are similar, and the REE occurrence states in the Bowers and Tiki basins are also similar. However, there are significant differences between the Central and Northwestern Pacific Ocean basins and the Eastern Pacific Ocean Basin.
For the Bowers and Tiki basins, which belong to the Eastern Pacific Ocean, the spatial distribution of REEs (multifractal inverse distance weighting method [24,25], half window length is 3, attenuation coefficient is 1) (Figure 5) shows that the overall REE content in the Tiki Basin is higher than that in the Bowers basin, suggesting a decreasing trend of REE content from west to east in the sediments of the Eastern Pacific Ocean.
Previous studies have shown [13] that there is a robust positive correlation between REY and P2O5 (phosphorus pentoxide) and CaO (calcium oxide) in the deep-sea sediments of the Central and Northwestern Pacific Ocean basins. This suggests a close relationship between REY and the content of P2O5 (phosphorus-bearing substances) and confirms that apatite is the main carrier of REEs in these basins [12]. In contrast, the enrichment of REEs in the Eastern Pacific Ocean Basin is not only closely related to phosphorus-bearing substances but also associated with iron-manganese oxides/hydroxides. This difference between the Central and Northwestern Pacific Ocean basins and the Eastern Pacific Ocean Basin is reflected in the differences in their fractal spectrum function curves (Figure 4).

5.2. Fractal Modeling of Deep-Sea Sediments Geochemical Data

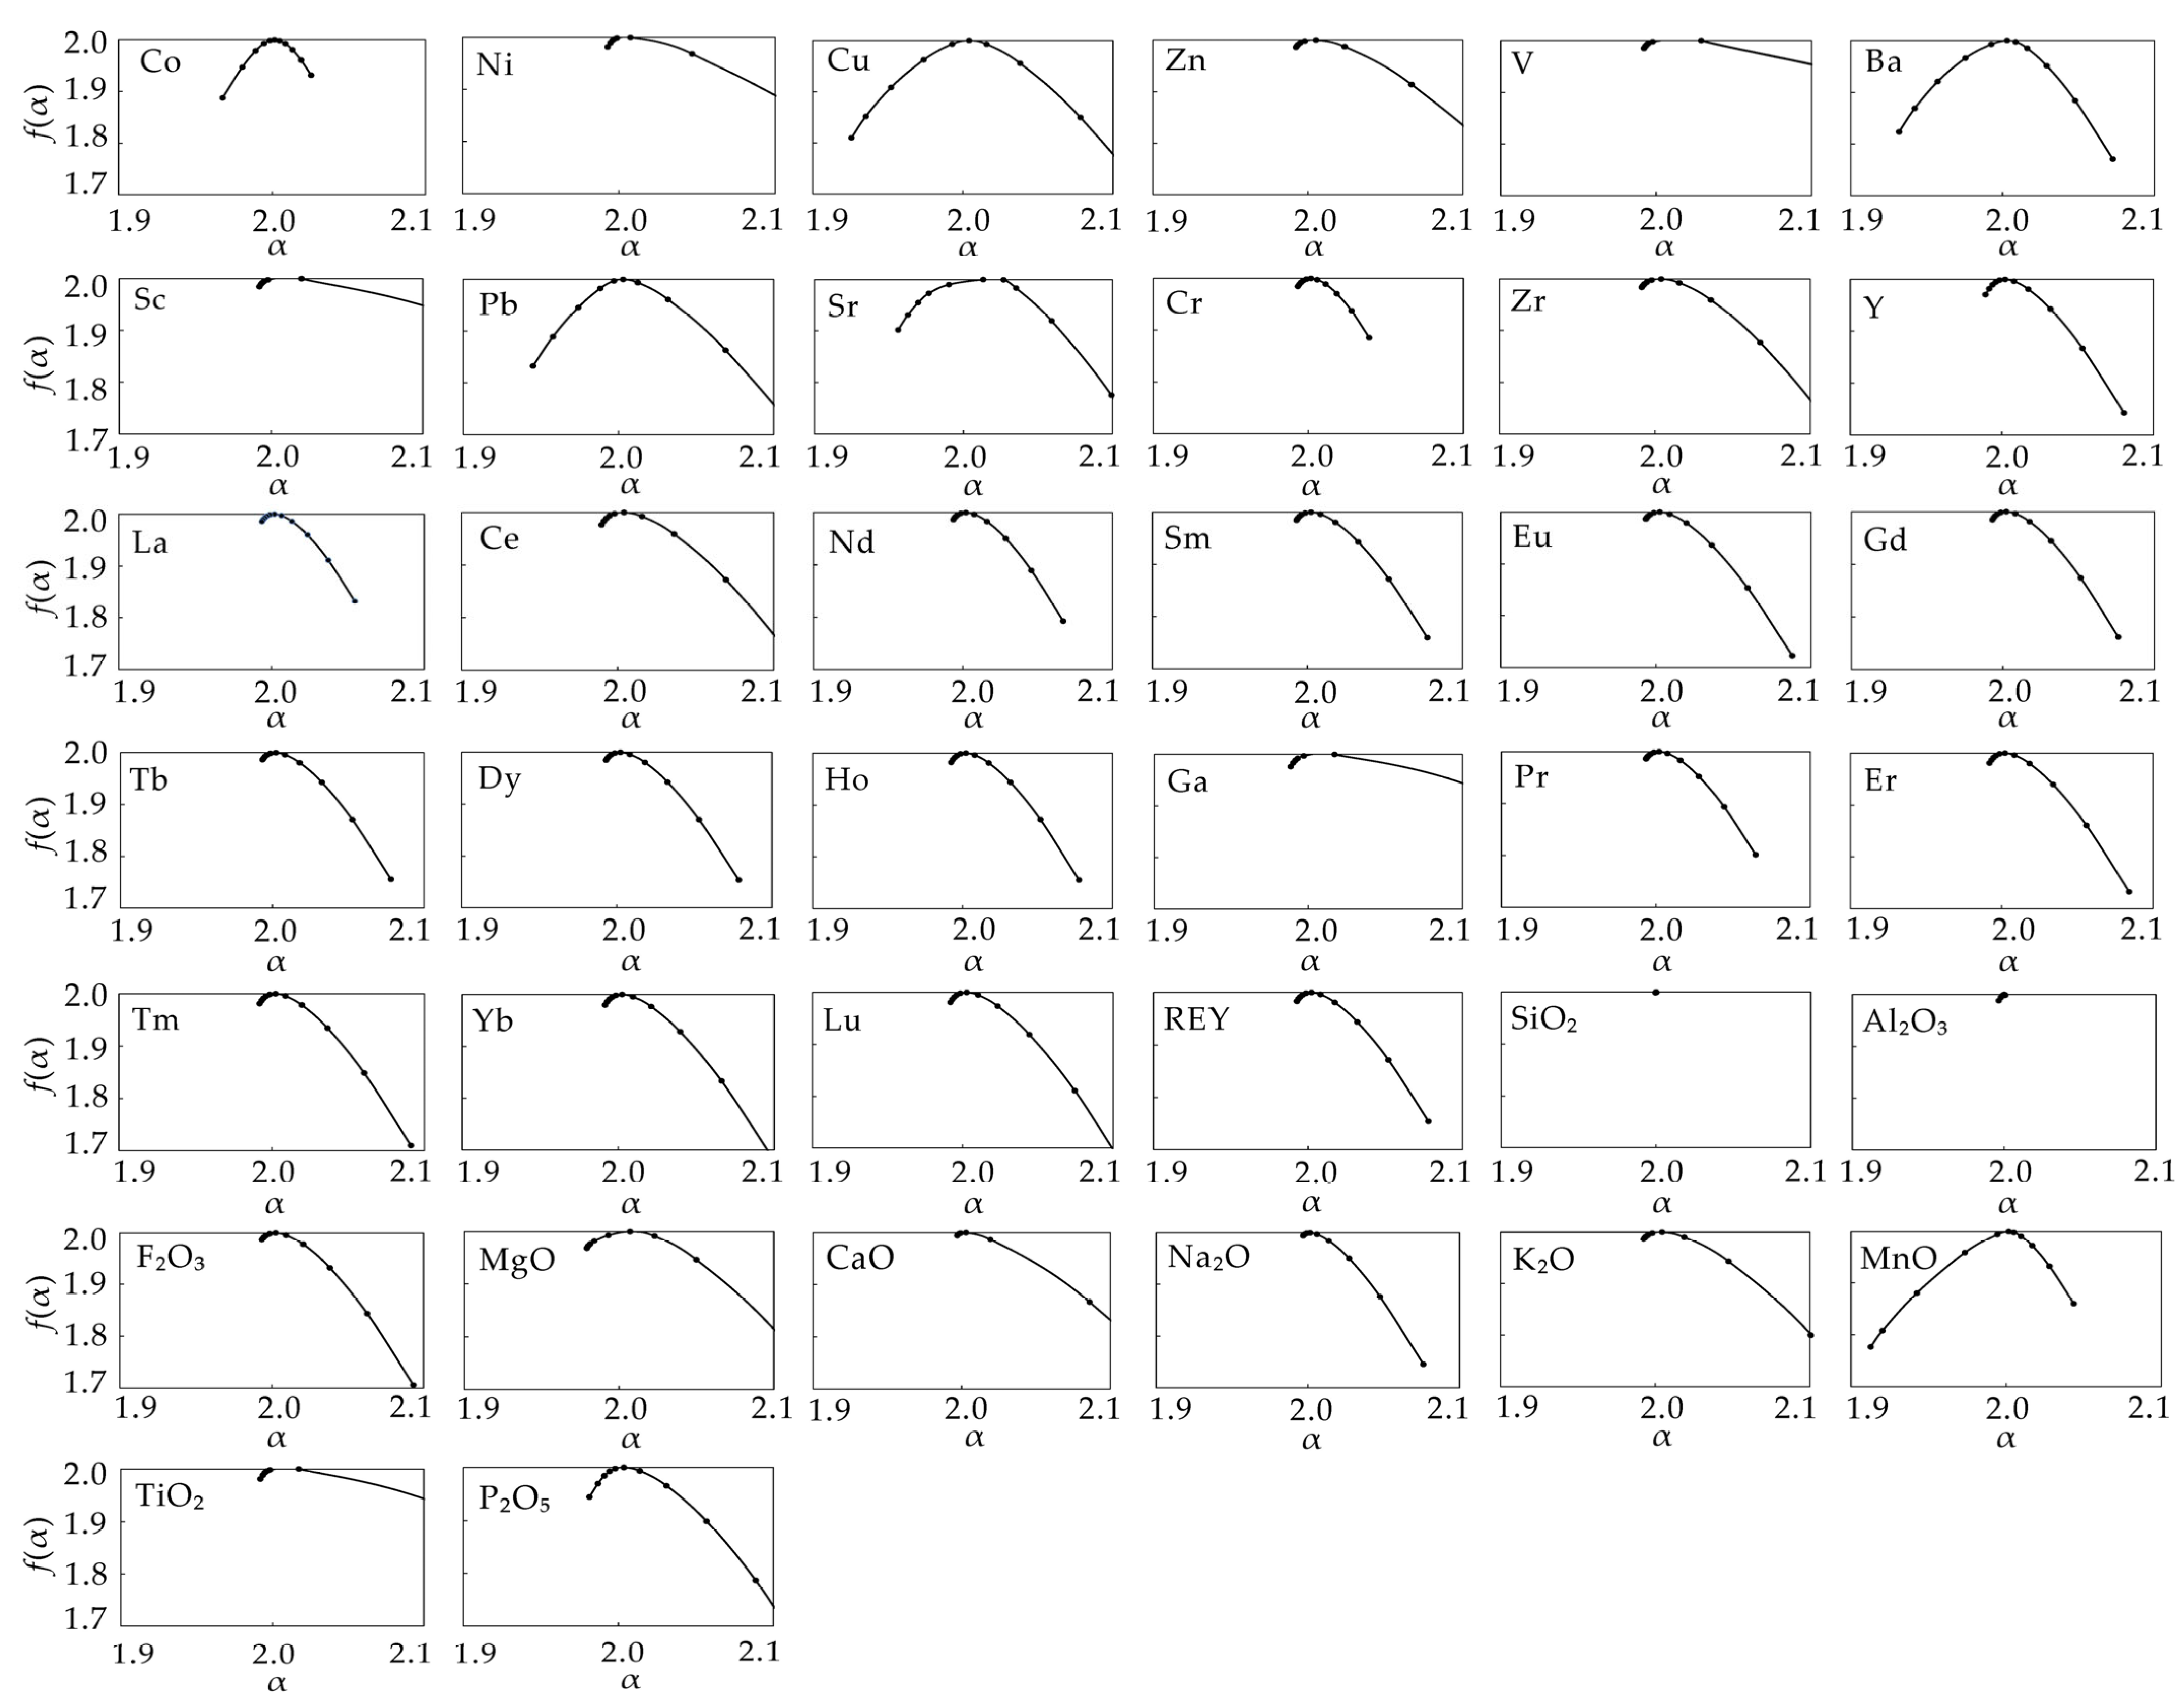
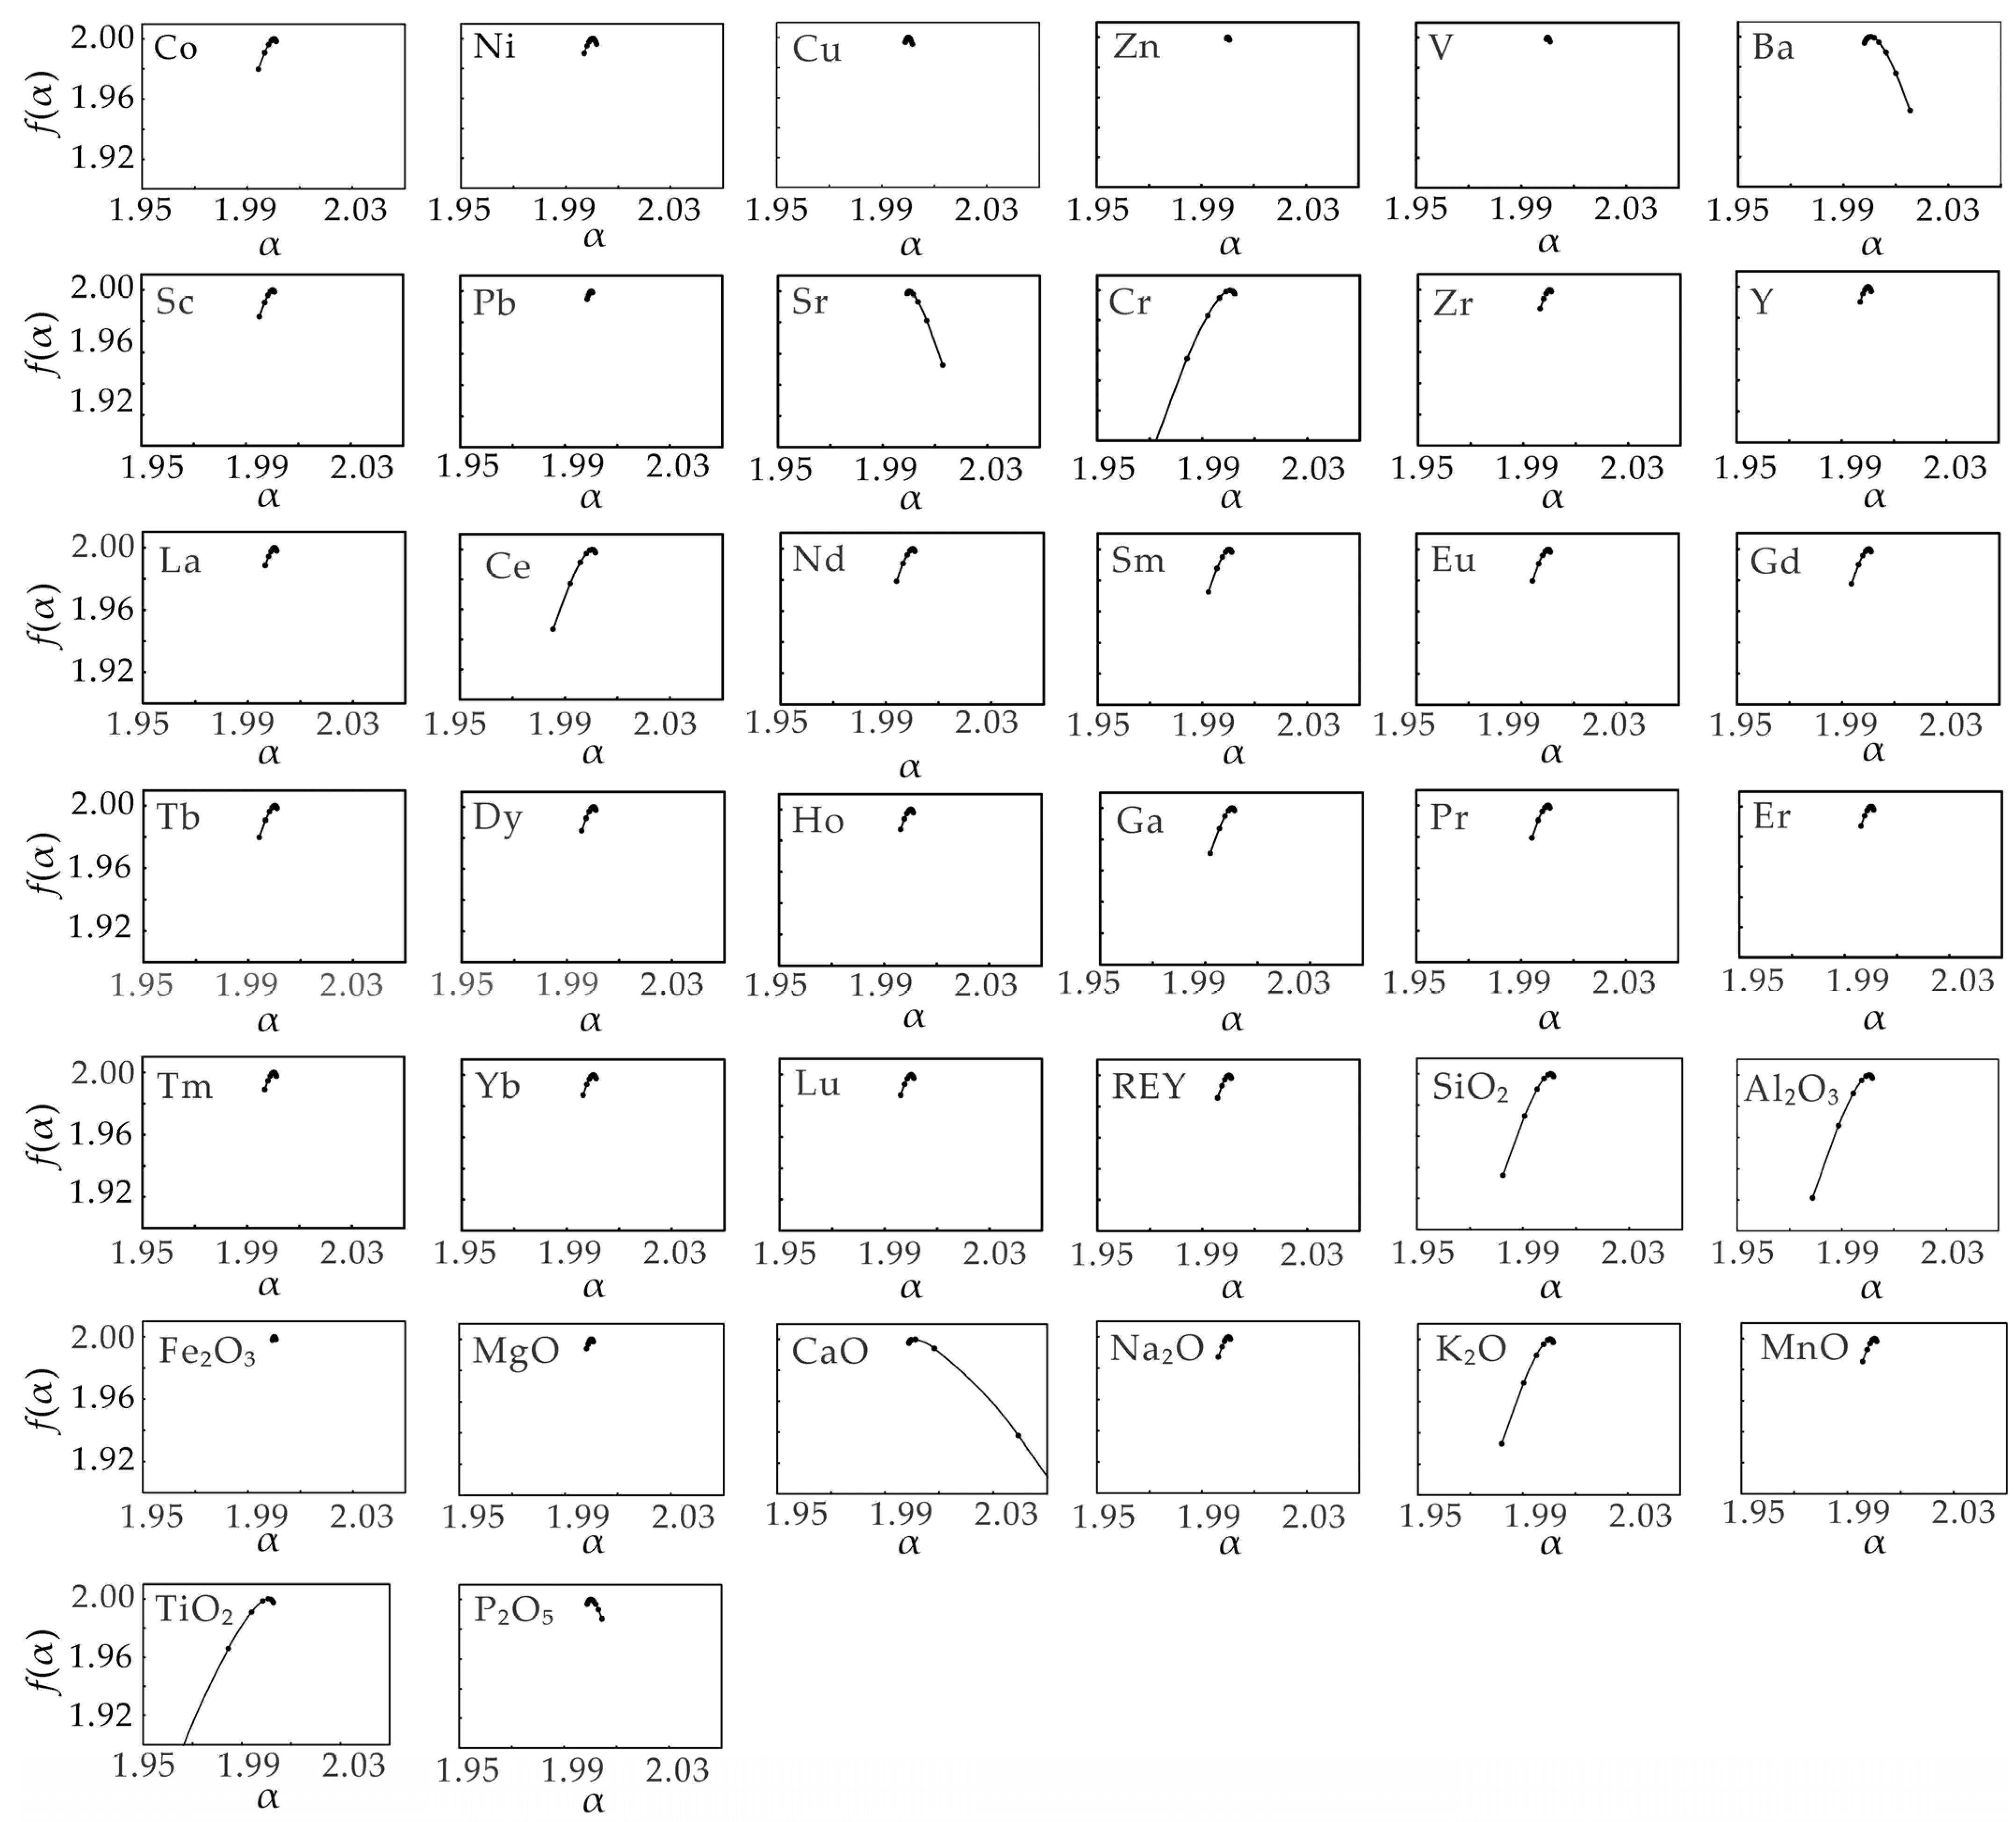
The text summarizes the computation of multifractal spectrum functions for geochemical elements within the deep-sea sediments across various regions of the Pacific Ocean. The curve shapes are shown in the figures below. Figure 6 shows the multifractal spectrum results in the Northwestern Pacific Ocean. It reveals that the data can be classified into three groups. The first group comprises P2O5, Na2O, Ba, Dy, Sc, Y, La, Nd, Sm, Eu, Gd, Tb, Ho, Pr, Er, Tm, Yb, Lu, and REY. The second group includes Al2O3, Fe2O3, MnO, SiO2, TiO2, Co, Ce, Cr, Pb, Ga, Cu, and V. The third group consists of CaO, MgO, K2O, Ni, Sr, Zn and Zr. Figure 7 shows the results in the Central Pacific Ocean, the multifractal spectrum curve (Figure 7) reveals that the data can be categorized into two groups. The first group encompasses Fe2O3, SiO2, Al2O3, K2O, TiO2, P2O5, Ni, Cu, Zn, V, Ba, Sc, Ga, Pb, Sr, Cr, Zr, Y, La, Ce, Pr, Nd, Sm, Eu, Gd, Tb, Dy, Ho, Er, Tm, Yb, Lu, and REY. The second group is composed of MgO, CaO, Na2O, MnO, and Sr. Figure 8 and Figure 9 show the results in the Ball Basin and Tiki Basin of the Eastern Pacific Ocean, respectively. Taking the Ball Basin in the Eastern Pacific Ocean as an example, the multifractal spectrum curve (Figure 8) shows the data exhibit a clear division into two groups. The first group includes Fe2O3, MgO, CaO, Na2O, K2O, TiO2, P2O5, Ni, Cu, Zn, V, Ba, Sc, Ga, Pb, Sr, Cr, Zr, Y, La, Ce, Pr, Nd, Sm, Eu, Gd, Tb, Dy, Ho, Er, Tm, Yb, Lu, and REY. The second group includes SiO2, Al2O3, MnO, and Co.
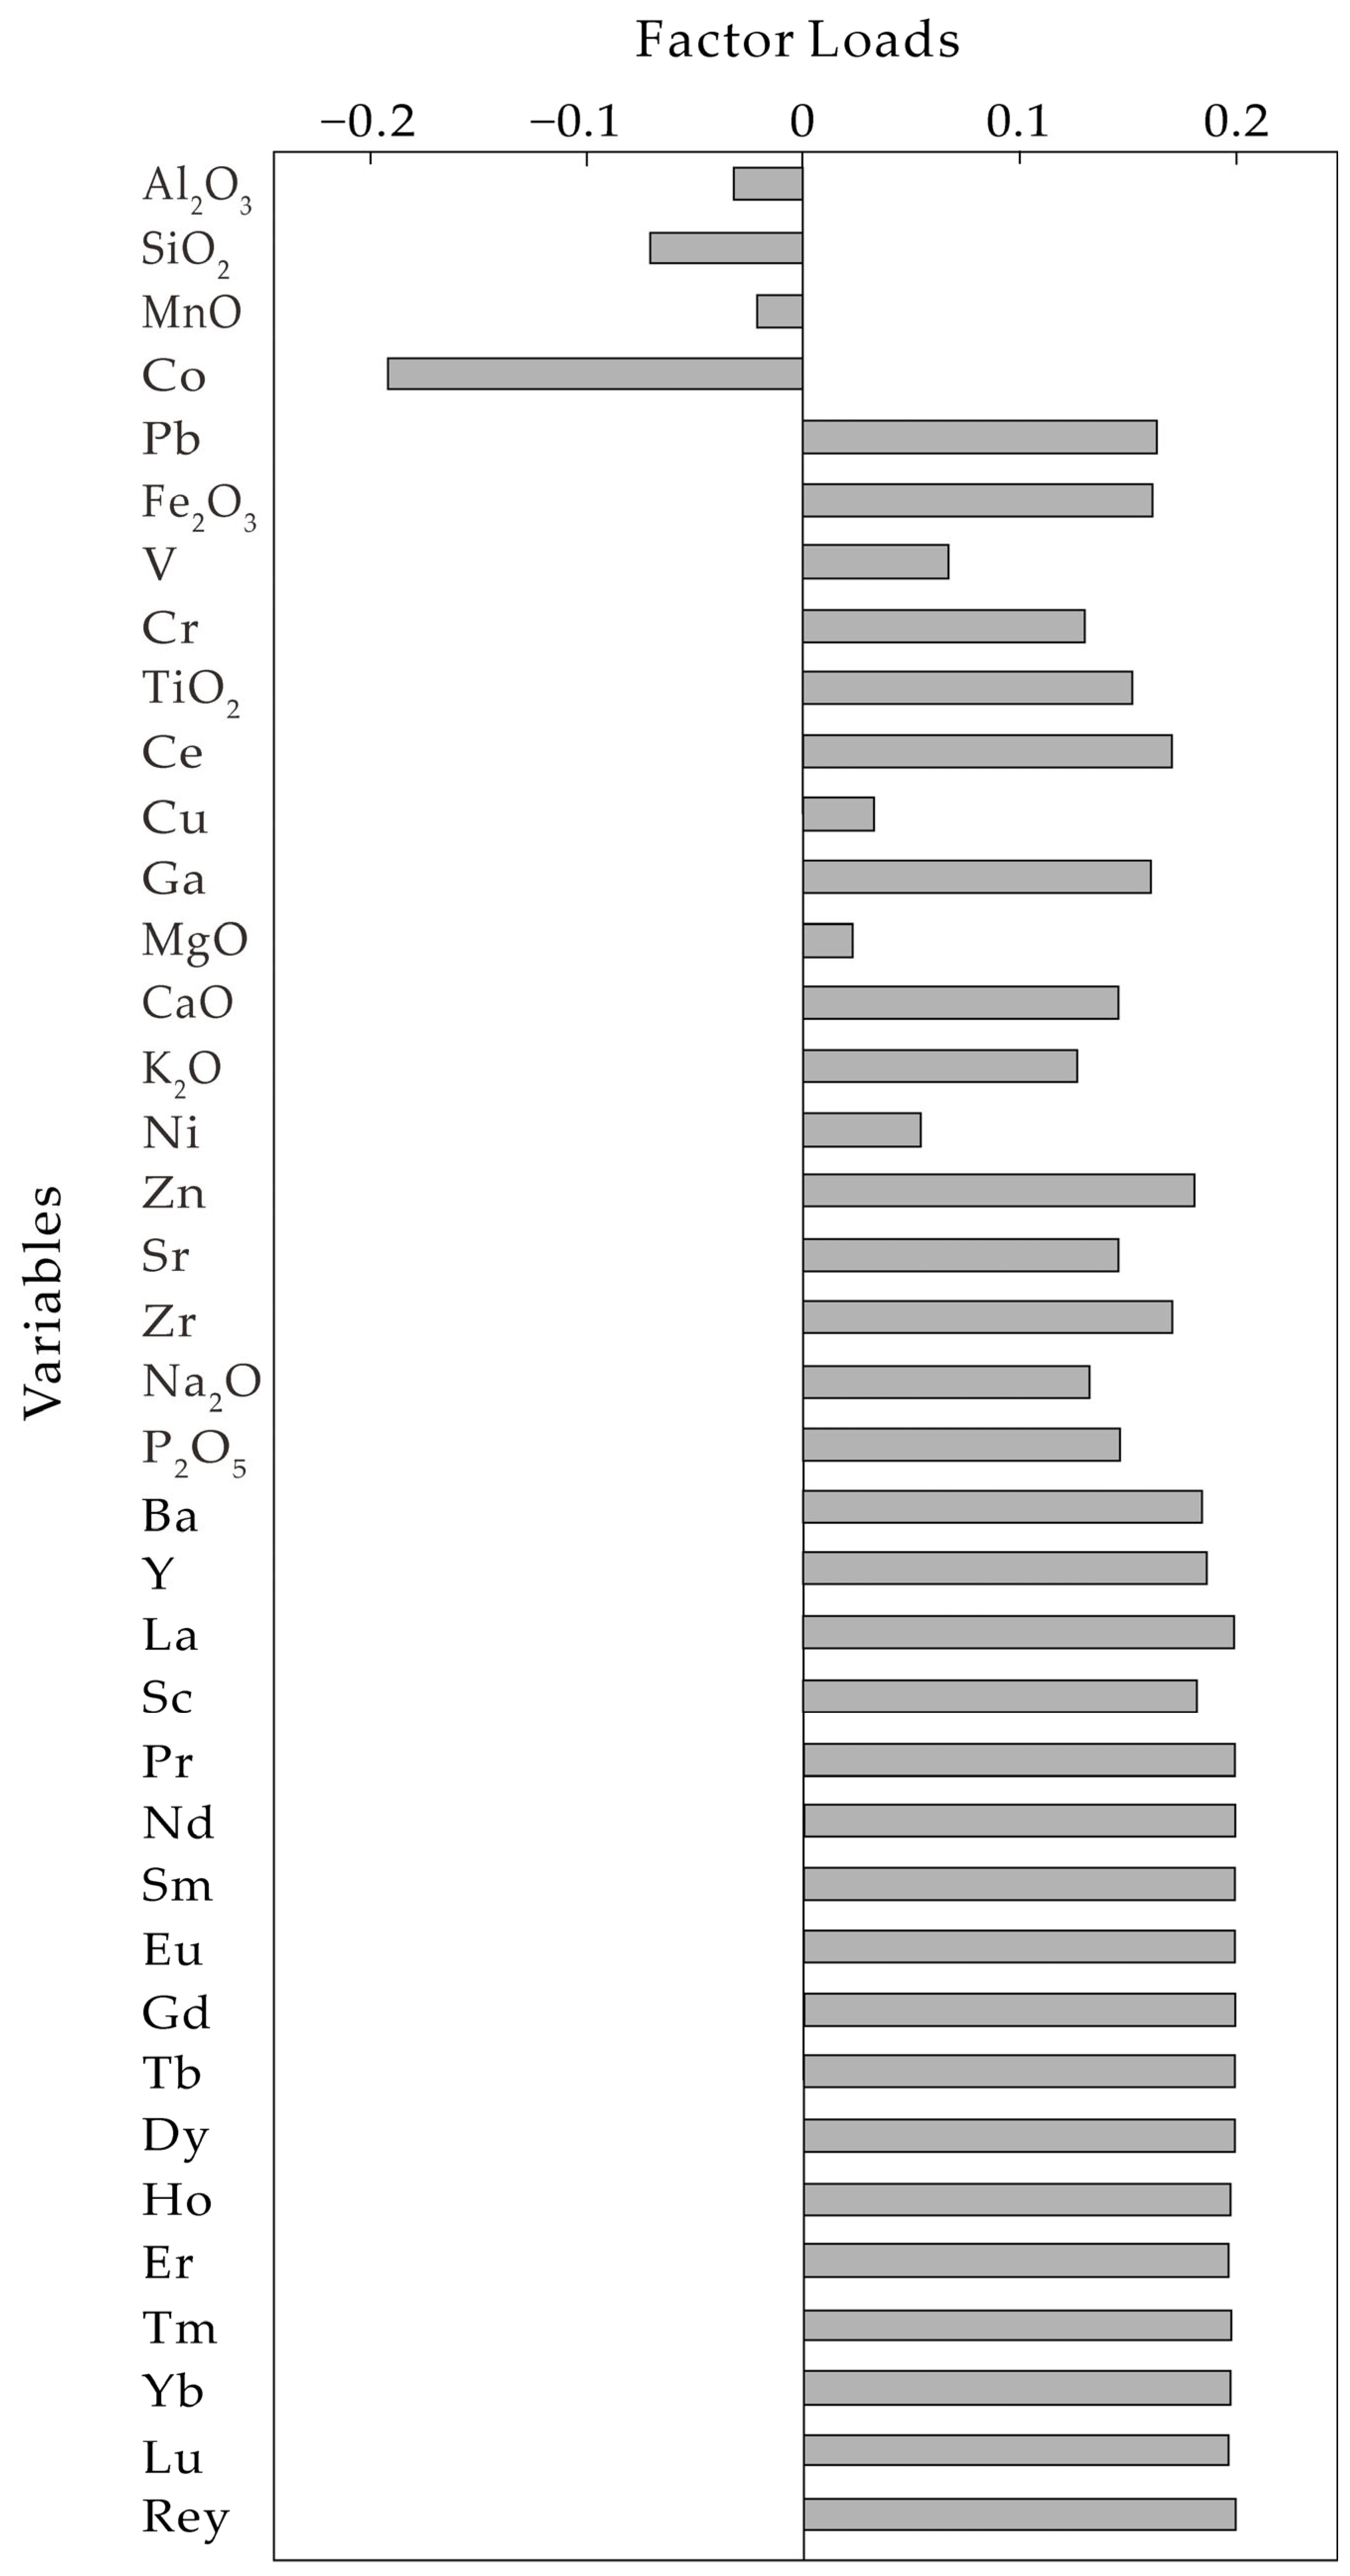
Using principal component analysis, the variables were analyzed for the Baoer Basin in the Eastern Pacific Ocean. The results are shown in Figure 10, and the data can be classified into two groups. The first group comprises Fe2O3, MgO, CaO, Na2O, K2O, TiO2, P2O5, Ni, Cu, Zn, V, Ba, Sc, Ga, Pb, Sr, Cr, Zr, Y, La, Ce, Pr, Nd, Sm, Eu, Gd, Tb, Dy, Ho, Er, Tm, Yb, Lu, and REY. The second group contains SiO2, Al2O3, MnO, and Co. These results are consistent with the multifractal analysis.
In order to explore the spatial correlation between the distribution pattern of the multifractal spectrum and the geochemical data of deep-sea sediments, we conducted the experiment depicted in Figure 11. For example, taking REY as an example, it was divided into constant intervals of 10. The division results had no impact on the shape of the multifractal spectrum. The width Δα and the asymmetry index R of the multifractal spectrum were also not affected by the division. Similarly, the variance parameter remained unaffected as long as the relatively high and low values remained spatially unchanged. Therefore, the multifractal spectrum function effectively reflects the intrinsic spatial structure of the geochemical field in deep-sea sediments.
In addition, a significant positive correlation was observed between REY and P2O5 [12]. The calculated correlation coefficients using the Equation (6) for the Central Pacific Ocean, Northwestern Pacific Ocean, and Eastern Pacific Ocean basins were 0.8, 0.76, and 0.7, respectively. Furthermore, the fractal spectrum function curves (Figure 6, Figure 7, Figure 8 and Figure 9) indicated that the fractal spectrum curves of REY and P2O5 in the Central and Northwestern Pacific Ocean basins were more similar compared to those in the Eastern Pacific Ocean Basin. This suggests that the enrichment of REEs in the Eastern Pacific Ocean Basin is not only closely related to phosphorus substances but may also be associated with other substances such as iron-manganese oxides/hydroxides.
A strong positive correlation was also found between P2O5 and CaO content, as their fractal spectrum function curves exhibited similar shapes. The shapes of their respective fractal spectrum function curves further confirmed their similarity.

5.3. Sources and Enrichment Mechanisms of REY

Based on the RE--P2O5 correlation analysis and the CaO–REY correlation analysis [12,29], it is found that in the Eastern Pacific Ocean, the phosphorus (P) content in the deep-sea sediments is the primary factor controlling REE enrichment, while in the Central and Northwestern Pacific Ocean, the REE enrichment is predominantly influenced by the phosphorus (P) and calcium (Ca) content in deep-sea sediments. Previous studies have used the analysis of Ce anomalies in sediments to determine the redox conditions [30], and it has been found that organic matter, phosphates, and silicates related to marine organisms are the main sources of negative Ce anomalies in marine sediments [30,31,32]. In addition, experts have concluded through anomaly studies that biogenic materials such as P and Ca are the main carriers of REEs in sediments [30,32].
Previous studies have comprehensively analyzed the CaO/P2O5 ratio, Ce anomalies, and Y anomalies to determine the importance of apatite in REE enrichment in sediments [13]. The polymetallic mud in the Eastern Pacific Ocean has low δCe values and Y anomalies, but the CaO/P2O5 ratio deviates from that of apatite, and the REE content is not high. It can be said that the deep-sea sediments in the Central and Northwestern Pacific Ocean were formed under strong oxidizing conditions and with sufficient phosphorus supply, resulting in the abnormal enrichment of REEs in this region. Conversely, in the Eastern Pacific Ocean, despite its oxidizing environment, there is a deficiency in phosphorus supply within the polymetallic mud, leading to lower REE content when compared to the zeolite clay in the Central and Northwestern Pacific Ocean [12].
By calculating the multifractal spectrum function of CaO/P2O5 (Figure 12), it is found that the singularity index of the Central and Northwestern Pacific Ocean basin is lower than that of the Eastern Pacific Ocean, indicating that the phosphorus content in the Eastern Pacific Ocean Basin is lower than that in the Central and Northwestern Pacific Ocean basin. In general, there is a positive correlation between the REY (REEs and yttrium) and P (phosphorus) contents in the sediments of the Central-Northwestern Pacific Ocean Basin and the Eastern Pacific Ocean Basin [12]. As the REY content increases, the CaO/P2O5 ratio tends to be to the to approach the CaO/P2O5 ratio of apatite (approximately 1.3). Thus, apatite serves as the primary reservoir for REY in REY-rich deep-sea sediments. On the other hand, although the polymetallic nodules in the Eastern Pacific Ocean Basin are in an oxidizing environment, they lack sufficient phosphorus supply, resulting in lower REY contents compared to the zeolite clay in the Central-Northwestern Pacific Ocean Basin. This is consistent with the higher CaO/P2O5 anomaly index calculated for the Eastern Pacific Ocean Basin compared to the Central-Northwestern Pacific Ocean Basin (low anomaly index corresponds to high element content area).

6. Conclusions

This study has investigated and compared the fractal characteristics of the geochemical data for the deep-sea sediments in the four regions of the Pacific Ocean: these are, the Northwestern Pacific Ocean Basin, the Central Pacific Ocean Basin, the Eastern Pacific Ocean Bowers Basin, and the Eastern Pacific Ocean Tiki Basin. There are four main conclusions that can be drawn:
(1) The fractal characteristics of geochemical elements within deep-sea sediments across the Central-Northwestern Pacific Ocean Basin, the Central Pacific Ocean Basin, and the Eastern Pacific Ocean Basin were analyzed. The results indicate that the fractal characteristics of the Central-Northwestern Pacific Ocean Basin and the Central Pacific Ocean Basin are similar, while the fractal characteristics of the Eastern Pacific Ocean Basin are slightly different from the former two.
(2) The lower anomaly index of CaO/P2O5 in the Central-Northwestern Pacific Ocean Basin compared to the Eastern Pacific Ocean Basin suggests that the phosphorus content in the Eastern Pacific Ocean Basin is lower than that in the Central-Northwestern Pacific Ocean Basin.
(3) The phosphorus content in the deep-sea sediments of the Eastern Pacific Ocean Basin is the main controlling factor for the enrichment of REEs, while both phosphorus and calcium contents in the deep-sea sediments of the Central-Northwestern Pacific Ocean Basin are the main controlling factors for the enrichment of REEs.
(4) Taking the Boll Basin in the Eastern Pacific Ocean as an example, using multifractal modeling and principal component analysis, the studied elemental indices can be categorized into two groups. The first group comprises Fe2O3, MgO, CaO, Na2O, K2O, TiO2, P2O5, Ni, Cu, Zn, V, Ba, Sc, Ga, Pb, Sr, Cr, Zr, Y, La, Ce, Pr, Nd, Sm, Eu, Gd, Tb, Dy, Ho, Er, Tm, Yb, Lu, REY. The second group includes SiO2, Al2O3, MnO, Co.

Author Contributions

Data processing and writing—original draft preparation, Y.Z.; conceptualization and project administration, G.H.; supervision—review and editing, F.X.; data curation and discussion, Y.Y.; formal analysis and discussion, F.W.; discussion, Y.L. All authors have read and agreed to the published version of the manuscript.

Funding

This study was funded by the National Science Foundation of China (U2244222, 42072324), projects of the China Geological Survey (DD20230068, DD20190629), Guangdong Province Introduced Innovative R&D Team of Big Data—Mathematical Earth Sciences and Extreme Geological Events Team (2021ZT09H399), Guangzhou Science and Technology Planning Project (202201011434), Guangdong Major project of Basic and Applied Basic Research (No. 2020B0301030003), and National Key Research and Development Program of China (No. 2021YFC2800901).

Data Availability Statement

No new data were created or analyzed in this study.

Conflicts of Interest

The authors declare no conflict of interest.

References

  1. Kato, Y.; Fujinaga, K.; Nakamura, K.; Takaya, Y.; Kitamura, K.; Ohta, J.; Toda, R.; Nakashima, T.; Iwamori, H. Deep-sea mud in the Pacific Ocean as a potential resource for rare-earth elements. Nat. Geosci. 2011, 4, 535–539. [Google Scholar] [CrossRef]
  2. Yasukawa, K.; Liu, H.; Fujinaga, K.; Machida, S.; Haraguchi, S.; Ishii, T.; Nakamura, K.; Kato, Y. Geochemistry and mineralogy of REY-rich mud in the eastern Indian Ocean. J. Asian Earth Sci. 2014, 93, 25–36. [Google Scholar] [CrossRef]
  3. Liu, J.; Zhang, L.; Liang, H. The REE geochemistry of sediments in core CC48 from the east Pacific Ocean. Oceanol. Limnol. Sin. 1994, 25, 13–22. [Google Scholar]
  4. Kon, Y.; Hoshino, M.; Sanematsu, K.; Morita, S.; Tsunematsu, M.; Okamoto, N.; Yano, N.; Tanaka, M.; Takagi, T. Geochemical Characteristics of Apatite in Heavy REE-rich Deep-Sea Mud from Minami-Torishima Area, Southeastern Japan. Resour. Geol. 2014, 64, 47–57. [Google Scholar] [CrossRef]
  5. Emsbo, P.; McLaughlin, P.I.; Breit, G.N.; du Bray, E.A.; Koenig, A.E. Rare earth elements in sedimentary phosphate deposits: Solution to the global REE crisis? Gondwana Res. 2015, 27, 776–785. [Google Scholar] [CrossRef]
  6. Ren, J.; Yao, H.; Zhu, K.; He, G.; Deng, X.; Wang, H.; Liu, J.; Fu, P.; Yang, S. Enrichment mechanism of rare earth elements and yttrium in deep-sea mud of Clarion-Clipperton Region. Earth Sci. Front. 2015, 22, 200–211. [Google Scholar]
  7. Wang, F.; He, G.; Yang, Y.; Zhao, T. The host of REE+Y elements in deep-sea sediments from the Pacific Ocean. Acta Petrol. Sin. 2016, 32, 2057–2068. [Google Scholar]
  8. Zhu, K.; Ren, J.; Wang, H.; Lu, H. Enrichment mechanism of REY and geochemical characteristics of REY-Rich pelagic clay from the central Pacific. Earth Sci. 2015, 40, 1052–1060. [Google Scholar]
  9. Dubinin, A.V. Geochemistry of rare earth elements in oceanic Phillipsites. Lithol. Miner. Resour. 2000, 35, 101–108. [Google Scholar] [CrossRef]
  10. Arrhenius, G.; Bramlette, M.N.; Picciotto, E. Localization of Radioactive and Stable Heavy Nuclides in Ocean Sediments. Nature 1957, 180, 85–86. [Google Scholar] [CrossRef]
  11. Toyoda, K.; Nakamura, Y.; Masuda, A. Rare earth elements of Pacific pelagic sediments. Geochim. Cosmochim. Acta 1990, 54, 1093–1103. [Google Scholar] [CrossRef]
  12. Wang, F.; He, G.; Ren, J.; Yong, Y.; Deng, X. Comparative study on the geochemical characteristics of rare earth elements in deep-sea sediments from different regions of the Pacific Ocean. Acta Petrol. Sin. 2023, 39, 719–730. [Google Scholar] [CrossRef]
  13. Liao, J.; Sun, X.; Li, D.; Sa, R.; Lu, Y.; Lin, Z.; Xu, L.; Zhan, R.; Pan, Y.; Xu, H. New insights into nanostructure and geochemistry of bioapatite in REE-rich deep-sea sediments: LA-ICP-MS, TEM, and Z-contrast imaging studies. Chem. Geol. 2019, 512, 58–68. [Google Scholar] [CrossRef]
  14. Yang, Y.M.; Zeng, Z.G.; Yin, X.B.; Rong, K.B.; Shu, Y.C. Advances in research on the host and the enrichment mechanism of REY-rich mud in deep-sea Sediments. Mar. Sci. 2019, 43, 93–107. [Google Scholar]
  15. Cheng, Q. Multifractality and spatial statistics. Comput. Geosci. 1999, 25, 949–961. [Google Scholar] [CrossRef]
  16. Ftiti, Z.; Jawadi, F.; Louhichi, W.; Madani, M. On the relationship between energy returns and trading volume: A multifractal analysis. Appl. Econ. 2019, 51, 3122–3136. [Google Scholar] [CrossRef]
  17. Jensen, M.H.; Kadanoff, L.P.; Procaccia, I.; Shraiman, B.I.; Halsey, T.C. Fractal measures and their singularities: The characterization of strange sets. Phys. Rev. A 1986, 33, 1141–1151. [Google Scholar]
  18. Agterberg, F. Multifractal Simulation of Geochemical Map Patterns. In Comp Ap Ear; Merriam, D.F., Davis, J.C., Eds.; Springer: Boston, MA, USA, 2001; pp. 327–346. [Google Scholar]
  19. Evertz, C.J.G.; Mandelbort, B.B. Chaos and Fractals; Peigen, H.O., Jurgens, H.D.S., Eds.; Springer: New York, NY, USA, 1992; pp. 922–953. [Google Scholar]
  20. Xie, S.; Bao, Z. Fractal and Multifractal Properties of Geochemical Fields. Math. Geol. 2004, 36, 847–864. [Google Scholar] [CrossRef]
  21. Lei, L.; Xie, S.; Chen, Z.; Carranza, E.J.M.; Bao, Z.; Cheng, Q.; Yang, F. Distribution patterns of petroleum indices based on multifractal and spatial PCA. J. Pet. Sci. Eng. 2018, 171, 714–723. [Google Scholar] [CrossRef]
  22. Zhang, Y.; Zhang, L.; Zhou, J.; Zhu, J.; Tang, L.; Zhou, Y. Multifractal properties of oil and gas indices in the Songnan Low Uplift of the Qiongdongnan Basin deepwater area. Geochem. Explor. Environ. Anal. 2022, 22, geochem2021-092. [Google Scholar] [CrossRef]
  23. Cheng, Q.; Agterberg, F.P.; Ballantyne, S.B. The separation of geochemical anomalies from background by fractal methods. J. Geochem. Explor. 1994, 51, 109–130. [Google Scholar] [CrossRef]
  24. Cheng, Q.; Xu, Y.; Grunsky, E. Integrated Spatial and Spectrum Method for Geochemical Anomaly Separation. Nat. Resour. Res. 2000, 9, 43–52. [Google Scholar] [CrossRef]
  25. Cheng, Q. A New Model for Quantifying Anisotropic Scale Invariance and for Decomposition of Mixing Patterns. Math. Geol. 2004, 36, 345–360. [Google Scholar] [CrossRef]
  26. Davis, J.C. Statistics and Data Analysis in Geology; John Wiley & Sons: New York, NY, USA, 2002. [Google Scholar]
  27. Xiao, F.; Wang, Z.H. Geological interpretation of Bouguer gravity and aeromagnetic data from the Gobi-desert covered area, Eastern Tianshan, China: Implications for porphyry Cu-Mo polymetallic deposits exploration. Ore Geol. Rev. 2017, 80, 1042–1055. [Google Scholar] [CrossRef]
  28. Xiao, F.; Chen, W.L.; Wang, J.; Oktay, E. A hybrid logistic regression: Gene expression programming model and its application to mineral prospectivity mapping. Nat. Resour. Res. 2022, 31, 2041–2064. [Google Scholar] [CrossRef]
  29. Deng, Y.; Ren, J.; Guo, Q.; Cao, J.; Wang, H.; Liu, C. Geochemistry characteristics of REY-rich sediment from deep sea in Western Pacific, and their indicative significance. Acta Petrol. Sin. 2018, 34, 733–747. [Google Scholar]
  30. Guo, Q.; Deng, Y.; Hippler, D.; Franz, G.; Zhang, J. REE and trace element patterns from organic-rich rocks of the Ediacaran–Cambrian transitional interval. Gondwana Res. 2016, 36, 94–106. [Google Scholar] [CrossRef]
  31. Pi, D.; Liu, C.; Shields-Zhou, G.A.; Jiang, S. Trace and rare earth element geochemistry of black shale and kerogen in the early Cambrian Niutitang Formation in Guizhou province, South China: Constraints for redox environments and origin of metal enrichments. Precambrian Res. 2013, 225, 218–229. [Google Scholar] [CrossRef]
  32. Deng, Y.; Guo, Q.; Zhu, M.; Zhang, J. REE geochemistry of kerogen from Early Cambrian black rock series in western Hunan. Earth Sci. 2014, 39, 283–292. [Google Scholar]
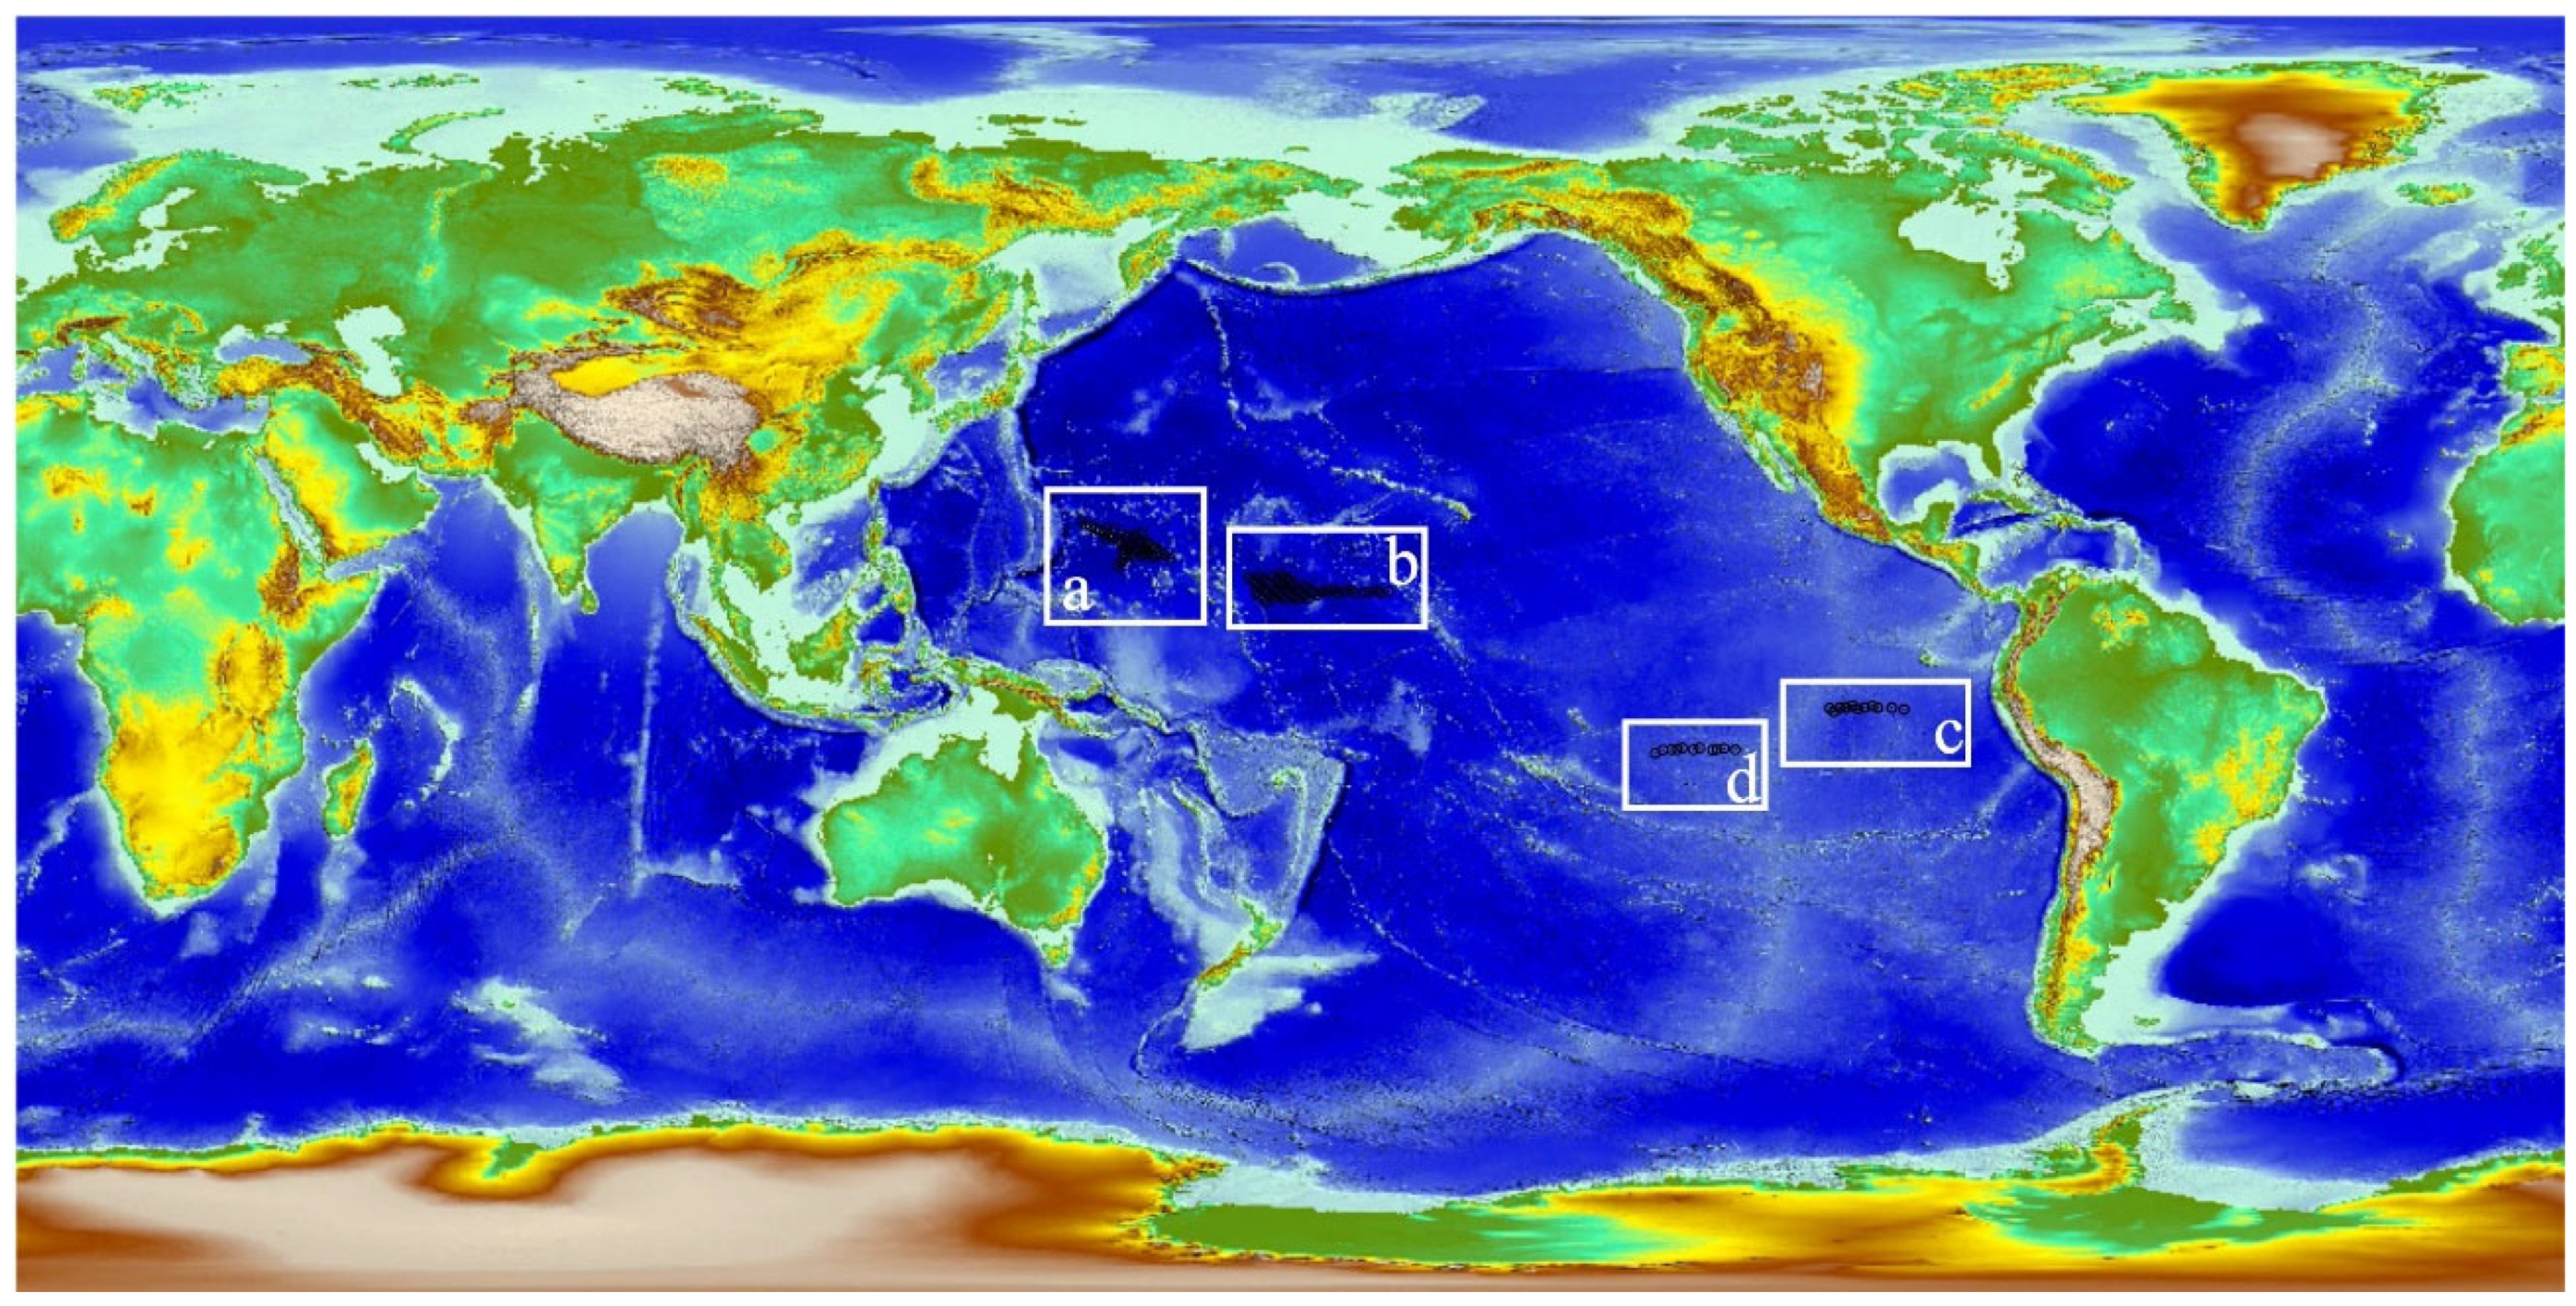
Figure 1. Sketch map showing the locations of the studied areas within the Pacific Ocean. (a) The Northwestern Pacific Ocean Basin area, (b) the Central Pacific Ocean Basin area, (c) the Eastern Pacific Ocean Bowers Basin, and (d) the Eastern Pacific Ocean Tiki Basin area.
Fractalfract 08 00045 g001
Figure 2. Plot showing the steps for calculating the multifractal spectrum of Pacific Ocean’s REY using the box-counting method. (a) The double logarithmic plot of the mass distribution function χq(ε) of REY concentration values as a function of scale length ε; (b) The relationship between the mass exponent τ(q) and the variable q; (c) The dependence of singularity exponent α on the variable q; and (d) The interrelationship between multifractal spectrum value f(α) and the singularity exponent α.
Fractalfract 08 00045 g002
Figure 3. Spatial distribution of REEs in the various regions. (a) Western Pacific Ocean Basin; (b) Central Pacific Ocean Basin; (c) Eastern Pacific Ocean Tiki Basin; and (d) Eastern Pacific Ocean Ball Basin.
Fractalfract 08 00045 g003
Figure 4. Distribution of REY singularity indices α-f(α) in various regions. (a) Western Pacific Ocean Basin; (b) Central Pacific Ocean Basin; (c) Eastern Pacific Ocean Tiki Basin; and (d) Eastern Pacific Ocean Ball Basin.
Fractalfract 08 00045 g004
Figure 5. Spatial distribution of REEs in the Eastern Pacific Ocean.
Fractalfract 08 00045 g005
Figure 6. Plot showing multifractal spectrum curves of the analyzed indices in the Northwestern Pacific Ocean.
Fractalfract 08 00045 g006
Figure 7. Plot showing multifractal spectrum curves of the analyzed indices in the Central Pacific Ocean Basin.
Fractalfract 08 00045 g007
Figure 8. Plot showing multifractal spectrum curves of the analyzed indices in the Eastern Pacific Ocean Ball Basin.
Fractalfract 08 00045 g008
Figure 9. Plot showing multifractal spectrum curves of the analyzed indices in the Eastern Pacific Ocean Tiki Basin.
Fractalfract 08 00045 g009
Figure 10. Principal component analysis results of the Eastern Pacific Ocean Ball Basin.
Fractalfract 08 00045 g010
Figure 11. Plot showing multifractal spectrum curves of the reshuffling data of REY: (a) the relationship between the singularity exponent α(q) and the variable q; and (b) the interrelationship between the multifractal spectrum value f(α) and the singularity exponent α.
Fractalfract 08 00045 g011
Figure 12. Multifractal spectrum curves of CaO/P2O5 in the four regions’: (a) Western Pacific Ocean Basin; (b) Central Pacific Ocean Basin; (c) Eastern Pacific Ocean Tiki Basin; and (d) Eastern Pacific Ocean Ball Basin.
Fractalfract 08 00045 g012
Table 1. Descriptive statistics of original of the Pacific Ocean geochemical data.
Min.Max.MeanStd.VarianceSkewnessKurtosisCV%ΔαR
SiO2a6.571.149.55.125.9−5.240.810.30.0−1.0
b1.683.849.79.589.8−2.714.319.10.0−0.4
c3.240.025.19.081.3−0.6−0.635.90.00.2
d0.638.917.913.4180.20.1−1.675.10.00.9
Al2O3a2.319.115.91.83.3−4.625.911.50.0−0.9
b0.217.313.63.310.7−2.66.524.10.0−0.4
c0.27.83.11.42.1−0.4−0.847.10.00.7
d0.111.65.03.814.50.2−1.576.90.00.9
Fe2O3a2.219.88.61.21.3−1.89.713.40.0−0.7
b0.310.86.21.62.5−2.04.925.40.0−0.2
c1.836.016.58.471.40.1−1.151.30.1−0.8
d0.230.712.97.150.1−0.1−0.954.90.00.1
MgOa0.67.32.40.90.90.70.338.70.00.0
b0.46.53.10.80.7−0.71.026.40.00.0
c0.06.70.81.42.02.55.7189.30.3−0.8
d0.33.21.50.80.6−0.1−1.452.50.00.5
CaOa1.046.54.14.419.07.560.5107.40.3−0.3
b0.553.74.58.572.34.822.1187.90.30.3
c1.748.913.914.9220.80.8−0.9106.80.7−1.0
d3.854.025.818.6346.10.1−1.672.10.5−1.0
Na2Oa0.16.92.51.62.60.5−1.564.00.00.6
b0.310.05.01.11.3−1.56.222.20.00.6
c1.311.56.22.24.9−0.4−0.535.70.1−0.9
d0.57.33.42.14.40.1−1.661.50.00.7
K2Oa0.24.51.51.11.20.5−1.471.20.1−0.2
b0.14.73.00.90.8−1.21.929.60.0−0.4
c0.414.53.82.35.40.4−0.461.70.3−0.9
d0.14.01.61.21.50.2−1.575.60.00.9
MnOa0.14.12.61.01.0−0.7−1.039.00.2−0.8
b0.08.41.30.50.31.219.039.60.00.1
c0.28.81.31.31.83.311.3106.70.10.4
d0.15.52.71.73.0−0.2−1.563.50.00.7
TiO2a0.54.82.21.01.1−0.3−1.546.80.1−0.8
b0.02.10.50.20.00.37.832.00.0−0.1
c0.05.52.71.52.1−0.5−0.854.70.9−0.9
d0.01.10.20.20.01.42.092.60.10.9
P2O5a0.110.01.00.70.56.053.067.40.40.6
b0.15.91.50.80.60.71.154.00.0−0.5
c0.23.31.40.70.50.40.052.60.1−0.7
d0.17.21.91.31.80.3−0.571.70.0−0.5
Coa9.0556.0143.648.92390.30.93.434.00.1−0.6
b4.4940.0123.646.82186.02.747.437.80.0−0.3
c15.6165.052.124.9618.11.32.947.70.10.2
d4.7365.0164.3117.413,773.60.1−1.671.40.00.7
Nia20.5749.0242.796.99383.01.64.639.90.10.1
b8.71904.0252.692.68576.12.547.436.70.0−0.2
c49.21455.0818.9340.9116,202.6−0.50.241.60.6−0.9
d6.01293.0487.8379.0143,626.40.1−1.377.70.00.3
Cua45.1590.0355.471.05041.1−1.12.520.00.0−0.7
b14.31481.0455.7145.221,086.7−0.52.631.90.00.0
c10.51720.0224.5346.3119,909.72.97.7154.20.3−0.5
d28.31456.0706.8431.6186,274.1−0.2−1.461.10.0−0.1
Zna25.4343.0155.722.2493.2−0.87.914.30.00.0
b13.5355.0163.244.41974.7−0.33.327.20.0−0.1
c36.73821.0465.9304.392,603.92.727.965.30.4−0.9
d25.2457.0219.8102.910,580.8−0.1−1.146.80.0−0.2
Va34.7275.0160.327.2738.8−1.43.017.00.0−0.8
b6.2249.0100.231.4988.3−0.71.331.40.0−0.3
c37.822,337.09489.25555.630,864,143.2−0.5−1.058.51.4−0.9
d4.6536.0207.9118.614,056.40.0−0.857.00.0−0.3
Baa12.04453.0178.5270.873,353.94.444.8151.70.10.9
b37.010,470.0384.9489.4239,466.17.195.7127.10.1−0.1
c82.320,524.02093.23679.413,537,714.33.08.7175.80.10.0
d77.19092.02054.71740.53,029,176.01.32.484.70.0−0.7
Sca3.91469.048.4115.513,332.55.946.1238.40.50.8
b6.211,590.0973.21511.42,284,362.43.213.7155.30.0−0.2
c3.7668.0244.3146.321,415.9−0.2−0.959.91.0−0.9
d1.034.916.211.2126.20.0−1.669.60.00.7
Gaa4.186.735.713.2173.00.20.036.80.1−0.7
b2.347.126.39.182.6−0.5−0.234.50.0−0.5
c2.6661.0159.7135.318,310.31.11.284.71.2−1.0
d0.414.56.64.318.6−0.1−1.665.40.00.8
Pba11.2358.0150.386.27436.6−0.4−1.557.40.2−0.7
b0.879.122.510.7115.40.70.347.70.1−0.1
c2.492.219.016.1259.52.56.484.70.1−1.8
d11.769.339.616.3266.9−0.1−1.541.20.00.6
Sra19.11954.0460.0334.0111,552.31.73.372.60.9−0.4
b4.4638.084.687.87709.01.20.2103.70.10.7
c1.41308.0150.8345.3119,198.42.33.8229.00.2−0.4
d345.01867.0910.5437.3191,210.10.3−1.348.00.0−0.9
Cra20.7160.072.518.8354.6−0.4−0.126.00.1−0.8
b1.4203.041.120.0398.91.03.948.60.0−0.1
c0.958.619.79.896.30.2−0.249.90.0−0.6
d0.678.520.913.4178.31.22.064.00.00.9
Zra39.21015.0182.831.71004.55.5149.417.30.0−0.2
b0.2324.0153.835.01224.8−2.26.222.80.0−0.2
c39.6576.0260.3136.518,639.8−0.1−1.252.40.2−0.9
d16.7539.0248.7150.622,689.70.0−1.560.60.00.7
Ya17.51877.0173.1126.015,875.15.350.472.80.30.7
b16.1725.0236.8103.710,759.10.30.743.80.0−0.2
c41.1324.0170.672.15192.3−0.3−1.042.20.1−0.7
d10.4939.0376.1289.683,895.20.2−1.477.00.00.4
Laa13.0953.0102.562.43896.75.552.660.90.30.8
b10.2386.0128.652.42742.60.31.340.70.00.0
c18.9150.088.234.31175.7−0.6−1.038.90.1−0.7
d7.4401.0174.8128.716,566.20.2−1.473.60.00.6
Cea12.21209.0114.135.01223.610.7298.030.70.1−0.6
b5.6357.094.625.5651.8−0.99.227.00.0−0.4
c5.978.140.219.5381.5−0.2−1.048.60.2−0.8
d2.4131.054.738.71495.30.2−1.570.70.00.8
Pra2.8263.027.017.3299.15.451.364.10.30.7
b2.498.733.612.9167.30.00.738.50.0−0.2
c2.827.216.16.441.4−0.6−1.040.00.1−0.8
d1.382.033.524.6604.70.1−1.573.40.00.8
Nda12.41180.0121.779.36296.35.248.065.20.30.7
b10.6443.0151.359.33518.40.10.639.20.0−0.2
c12.5131.075.630.5929.7−0.6−1.040.30.1−0.8
d5.7393.0157.3115.813,413.10.1−1.573.60.00.8
Sma2.6271.026.918.0324.55.349.067.10.30.7
b2.199.634.013.1172.80.00.638.60.0−0.3
c2.526.115.26.339.8−0.5−1.041.40.1−0.8
d1.279.931.723.5554.30.1−1.674.20.00.8
Eua0.858.46.03.915.65.146.465.60.30.8
b0.625.07.82.98.60.01.237.50.0−0.2
c1.19.55.52.25.0−0.6−1.040.30.1−0.8
d0.320.58.05.833.90.1−1.672.90.00.7
Gda2.7285.028.719.3371.45.247.067.20.30.7
b2.4110.036.414.4207.10.00.539.50.0−0.3
c3.335.019.78.064.4−0.6−1.040.80.1−0.8
d1.5100.039.629.5868.00.1−1.574.40.00.8
Tba0.447.14.63.19.95.450.668.00.40.7
b0.418.06.02.45.70.00.539.60.0−0.3
c0.65.63.31.31.8−0.6−1.140.80.1−0.8
d0.216.36.54.923.60.1−1.674.40.00.7
Dya2.6268.027.218.3334.55.044.867.20.30.6
b2.1104.035.214.0197.30.00.439.90.0−0.3
c3.837.821.68.978.5−0.6−1.141.10.1−0.8
d1.4108.042.131.4985.40.1−1.574.60.00.7
Hoa0.661.46.14.217.25.147.067.90.30.6
b0.523.07.93.210.20.00.440.60.0−0.4
c1.010.15.42.25.0−0.5−1.041.20.1−0.8
d0.325.510.67.962.90.1−1.575.20.00.6
Era1.5164.016.110.8117.15.350.867.20.30.7
b1.563.321.28.673.30.00.440.40.0−0.3
c3.128.015.26.339.8−0.5−1.041.50.1−0.8
d0.972.729.922.5508.10.2−1.575.30.00.6
Tma0.222.52.31.52.35.350.066.30.30.7
b0.28.93.01.21.40.00.440.20.0−0.3
c0.54.12.20.90.9−0.5−1.141.80.1−1.3
d0.110.14.33.210.30.1−1.575.10.00.5
Yba1.3134.013.98.979.95.350.764.10.30.6
b1.253.118.47.353.70.00.439.70.0−0.4
c2.826.114.05.935.2−0.5−1.142.40.1−0.8
d0.862.526.419.8391.30.1−1.575.00.00.6
Lua0.220.02.11.31.75.451.563.50.30.6
b0.27.72.71.11.2−0.10.339.90.0−0.5
c0.44.02.10.90.8−0.5−1.142.80.1−0.8
d0.110.24.03.09.30.1−1.575.50.00.6
REYa70.85983.2672.4397.1157,681.05.248.559.10.30.7
b57.82311.3817.6310.696,494.40.00.738.00.0−0.3
c102.2864.9494.9199.939,979.8−0.6−1.040.40.1−0.8
d34.12297.2999.5743.6552,953.10.1−1.574.40.00.7
Note: The units of major elements are %, and others are μg/g.
Disclaimer/Publisher’s Note: The statements, opinions and data contained in all publications are solely those of the individual author(s) and contributor(s) and not of MDPI and/or the editor(s). MDPI and/or the editor(s) disclaim responsibility for any injury to people or property resulting from any ideas, methods, instructions or products referred to in the content.