Article

Study on the Characteristics of Composite Recycled Aggregate Concrete Based on Box–Behnken Design Response Surface Model

1
School of Resources and Environmental Engineering, Shandong University of Technology, Zibo 255000, China
2
Key Laboratory for Liquid-Solid Structural Evolution & Processing of Materials of Ministry of Education, Shandong University, Jinan 250061, China
3
Shantian Abrasive Co., Ltd., Linyi 276700, China
4
School of Civil Engineering and Geomatics, Shandong University of Technology, Zibo 255000, China
*
Author to whom correspondence should be addressed.
Fractal Fract. 2023, 7(9), 648; https://doi.org/10.3390/fractalfract7090648
Submission received: 23 June 2023 / Revised: 19 August 2023 / Accepted: 20 August 2023 / Published: 25 August 2023

Abstract

:
This study investigates the influence of recycled fine aggregates (RFA) and waste concrete powder (WCP) on the compressive strength of concrete. The response surface methodology is employed, considering three factors: the content of WCP, the water–cement ratio, and the replacement ratio of recycled fine aggregates. Compressive tests are conducted at different ages (3 days, 28 days, and 90 days). A statistical approach is used to establish a response surface model for compressive strength and to verify its fitting with experimental results. By combining qualitative and quantitative analyses, including morphological analysis of SEM images, stratified binarization statistics, and fractal dimension calculations, the mechanisms of the effects of singly and doubly mixed RFA and WCP on the compressive strength of concrete are analyzed. The results show that an increase in the content of WCP from 5% to 15% gradually improves the compressive strength of the concrete. The water–cement ratio significantly affects the compressive strength, with an optimal ratio of 0.43. Replacement with less than 33% fine aggregates does not significantly reduce the compressive strength of the concrete. The concrete specimens with singly mixed fine aggregates exhibit the largest pore area after stratified grayscale binarization, while those with doubly mixed aggregates have the largest area of hydrated calcium silicate. Fractal analysis of the binarized images confirms a positive correlation between the fractal dimension of hydrated calcium silicate and compressive strength and a negative correlation between the fractal dimension of pores and compressive strength.

1. Introduction

The global demolition of retired concrete structures generates a significant amount of construction waste each year, posing a severe threat to the human living environment [1]. At the same time, the construction of new concrete buildings requires a considerable amount of natural sand and gravel as aggregates, leading to an increasing demand for non-renewable resources [2,3]. These two prominent issues in the construction industry converge at a common point, where the crushing and grading treatment of old concrete buildings enables the matching of corresponding levels of waste particles to replace natural aggregates. This approach, which involves the low-cost and high-efficiency recycling of construction waste, serves as an effective method for addressing environmental pollution and preventing resource depletion [4].
According to different sources, construction waste can be divided into waste concrete, waste brick and tile, old mortar, and waste residue. Statistics show that concrete waste accounts for 65% of all construction waste [5]. Waste concrete is usually divided into two types after crushing: the first type is made of particles with a diameter greater than 4.75 mm, accounting for about 30–40% of the total mass of waste concrete. Particles of this diameter usually comprise the natural aggregate that encapsulates the old mortar. After simple treatment, the waste concrete has high strength and good quality and can replace the genuine article [6]. The second category is made of particles with a particle size of less than 4.75 mm, which account for about 60% to 70% of the total mass of discarded concrete. It may contain natural sand, mortar powder, and unhydrated mineral particles, and the composition is very complex. In this kind of waste concrete, particles with particle grading between 0.075 mm and 4.75 mm can replace fine aggregates. It is worth noting that the waste concrete crushing process also produces particles with a particle size below 0.075 mm, usually called waste concrete powder (WCP) [7]. The total weight of the regenerated micro-powder is about 20–30% of the second type of waste concrete [8]. Since the recycled micro-powder may increase the mixed concrete’s water requirement, the fluidity, mechanical properties, and even durability of the concrete solid are affected [9,10]. Therefore, code stipulates that the recycled fine aggregate crushed by waste concrete must remove particles with a particle size below 75 μm. The process of sieving to remove recycled micro-powder increases the cost of construction waste treatment, and there are technical difficulties [11]. Therefore, recycled WCP is a bottleneck problem in the field of concrete waste.
Scholars have primarily focused their research on the preparation of recycled coarse and fine aggregates in the context of utilizing waste concrete, and significant progress has been made in this area [12,13]. However, research on WCP is still in the exploratory stage, with overall utilization rates remaining relatively low. The WCP produced from crushed waste concrete consists primarily of cement, along with SiO2 generated from the crushing of coarse and fine aggregates [14,15]. Relevant studies have shown that WCP can be appropriately incorporated into concrete as a mineral admixture, serving as a supplementary cementitious material to replace a portion of cement. Research on the performance and application of WCP demonstrates that it exhibits a certain level of hydration activity and can be blended into raw materials as an auxiliary cementitious material. The reaction between WCP and the calcium hydroxide produced by the cementitious material system effectively promotes cement hydration [16], leading to improvements in pore structure and significant enhancements in the mechanical and durability properties of concrete [17,18]. However, the WCP particles produced by conventional crushing processes tend to be larger and exhibit lower reactivity when used as auxiliary cementitious materials [19]. To unleash their full reactivity, the WCP must undergo processes such as calcination or thorough grinding, which consume significant energy and generate a substantial amount of pollution gases. The emissions of large quantities of CO2 from the grinding process are considered a significant contributor to the current global greenhouse effect, rendering such treatment methods unable to achieve the original intention of harmless treatment of construction waste [20,21].
Based on the current research status mentioned above, the utilization of waste particles with a diameter smaller than 4.75 mm remains a bottleneck in the harmless disposal of concrete. There are several factors that can influence the compressive strength of concrete with recycled fine aggregates. The most important factors include the content of WCP, the water–cement ratio, and the content of recycled fine aggregates. Considering all these factors and their interactions requires a significant number of experiments to be conducted. Moreover, experimental errors can affect the accuracy of the conclusions. To overcome these issues, experimental design methods are needed. In some studies, advanced design methods have been used for the optimal mixture design of concrete materials. For example, Kumar R utilized response surface methodology to design structural-grade lightweight cellular concrete containing micro-fine stone sludge [22]. Sharaky I A constructed a cube strength equation for concrete using Central Composite and Box–Behnken designs, accurately predicting the effects of steel fiber content, high kaolin clay content, and curing time on compressive strength [23]. Shaheen N optimized the formulation of a microorganism cementitious composite using the Taguchi approach of experimental design, considering factors such as water–cement ratio, type of cement, and effective microorganism technology [24]. Zhang Q optimized the mix proportion of recycled aggregate pervious concrete using response surface methodology and established the response of void content for different gradations of recycled aggregates using a simplex–centroid design [25]. To address the two major issues of fully utilizing fine aggregates and harmless disposal of WCP, this study replaces the fine aggregates with particles ranging from 0.075 mm to 4.75 mm, which are obtained by crushing waste concrete. The WCP below 0.075 mm are used as inert fillers to prepare recycled aggregate concrete. The Box–Behnken method is employed to design and assess the effects of three factors, namely the content of WCP, water–cement ratio, and content of recycled fine aggregates, on the compressive strength of concrete. The interactions among these three factors are evaluated. Using the aforementioned factors as independent variables, response models for the compressive strength of concrete at 3 days, 28 days, and 90 days are constructed. The models are evaluated and validated using variance analysis and R2. By plotting three-dimensional response surfaces, the optimal mixture conditions for achieving the highest strength in recycled concrete are determined. Finally, the changes in concrete strength due to the addition of WCP and recycled fine aggregates are quantitatively described from a microscopic perspective through the characterization of morphological features and calculation of fractal dimensions based on SEM micrographs. This reveals the mechanisms through which each factor affects the strength. These findings provide a basis for further enhancing the utilization efficiency of recycled micro-powder, as well as expanding its functionality and application scenarios.

2. Experimental Section
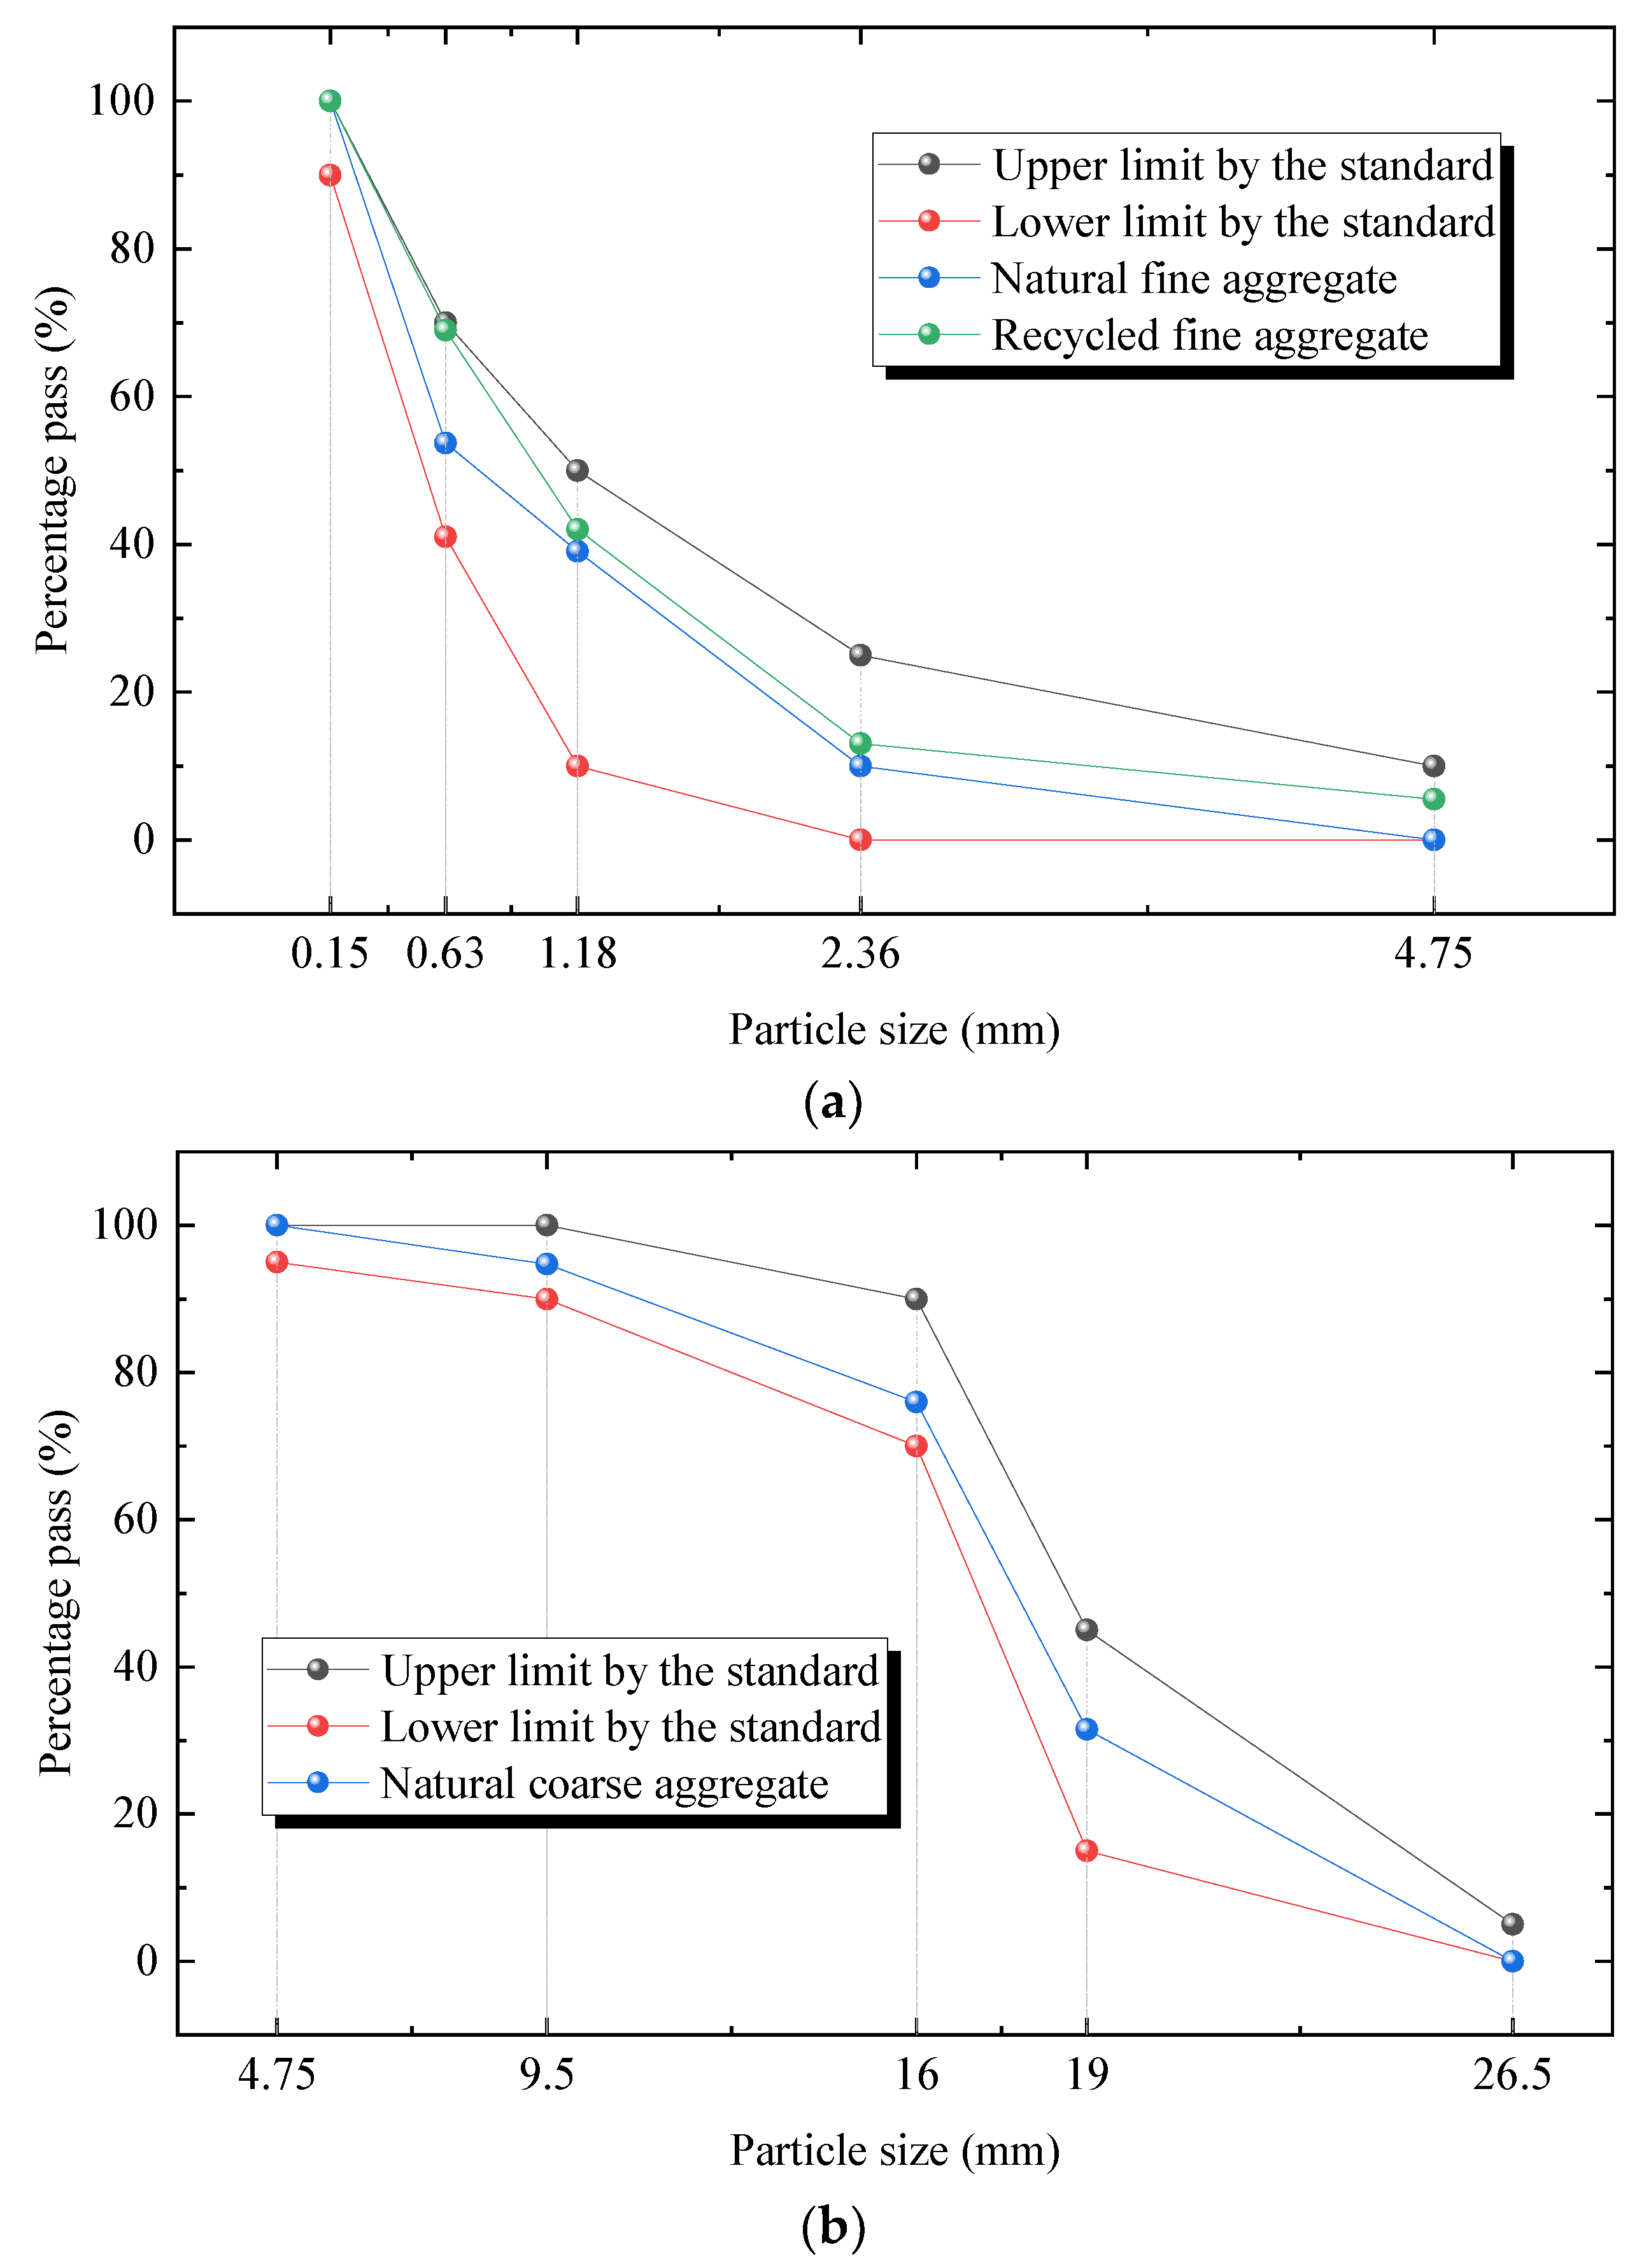
2.1. Raw Materials

The experimental cement material used in the study was 42.5-grade Portland cement, with a clinker content of 88.7% and a density of 2980 kg/m3, in accordance with Chinese standard GB175-2007 [26].
The natural coarse aggregate (NCA) was crushed limestone, with a continuous particle size ranging from 5 mm to 20 mm. The testing was conducted following the Chinese standard “Construction Use Gravel and Crushed Stone” (GB/T 14685-2011) [27].
The natural fine aggregate (NFA) was river sand, with a fineness modulus of 2.6, falling within the category of medium sand.
The recycled fine aggregate (RFA) was obtained by crushing laboratory waste concrete specimens, which were originally made with C45 concrete blocks. After crushing, recycled fine aggregate with the same particle size distribution as the natural fine aggregate was separated using a sieve shaker. The aggregate grading can be seen in Figure 1.
According to the relevant provisions of the standard “Quality and Testing Methods for Sands and Stones Used in Ordinary Concrete” JGJ 52-2006 [28], the physical properties of each aggregate were measured, including the water absorption rate, apparent density, and moisture content of the recycled coarse and fine aggregates, as shown in Table 1.
Admixture was performed with high-performance polycarboxylic acid-series water-reducing agent (the amount is 0.5% of the amount of cement), the purpose of which was to ensure the workability of mixing concrete. The indexes of the water-reducing agent are shown in Table 2.
Mixing with water was conducted using tap water, in line with the JGJ 63-2006 standard requirements [29].

2.2. WCP

2.2.1. Screening Test

The discarded concrete was broken by impact and then subjected to secondary crushing in a jaw crusher. After electric sieving, the mass was measured. The results showed that the mass of particles with a diameter less than 0.075 mm accounted for 11.3% of the mass of particles with a diameter below 4.75 mm. These particles can be considered as WCP, as depicted in Figure 2. WCP exhibits a micro-aggregate effect and may also possess reactivity, which can influence the strength of freshly mixed concrete. The particle size distribution of the WCP was analyzed using a Mastersizer 2000 in this study. The particle sizes of the WCP mainly ranged from 0.25 μm to 200 μm, with d(0.1) at 1.172 μm, d(0.5) at 26.136 μm, and d(0.9) at 74.218 μm. The density of the prepared WCP was 2570 kg/m3. The high specific surface area of the WCP may result in a higher water demand and decrease the flowability of freshly mixed cementitious materials.

2.2.2. Oxide Content

To investigate the oxide content in the raw material of WCP, a semi-quantitative (qualitative) analysis of the samples was performed using X-ray spectroscopy. A loose sample of 50 mg of WCP was taken and dried at a constant temperature of 60% °C for 48 h in a vacuum drying oven. The oxide content was measured using an X-ray fluorescence spectrometer, model Brook S2 RANGER. The results are presented in Table 3.
As shown in the Table 3, the main components of the WCP were CaO, SiO2, and Al2O3, which are very similar to the main components of cement. During the process of crushing waste concrete, natural aggregates are rarely crushed into WCP, while cement paste is more easily crushed into WCP. The high content of SiO2 and Al2O3 gives the WCP a potential pozzolanic effect, which is consistent with the findings of the study in reference [30].

2.3. Experimental Design and Methods

In previous studies, the impact of variations in a single factor on compressive strength was often considered. However, in reality, changes in one factor can simultaneously induce changes in other factors, and the interaction effects may influence the indicators of compressive strength. This is known as “response effect”. Based on this, this study utilizes the compressive strength indicators at 3 d, 28 d, and 90 d to evaluate the short-, middle-, and long-term strength of concrete. The response surface methodology was employed to analyze the significant effects of both single and interaction factors on the evaluation indicators.

2.3.1. Basic Mixing Ratio

According to the design code JGJ55-2011 “Code for Design of Concrete Mix Proportions” [31], the cement dosage was set at 406 kg/m3. All coarse aggregates were natural aggregates with a dosage of 1290 kg/m3. The total amount of fine aggregates was 695 kg/m3, with the recycled fine aggregates replacing the natural fine aggregates in equivalent mass. The WCP was added separately based on a percentage of the mass of the fine aggregates. The dosage of the water-reducing agent was 4.87 kg/m3.
The water absorption rate of the RFA was significantly higher than that of the corresponding natural aggregates. In this study, the water absorption rate of the RFA used was 11 times that of the NFA after 24 h. The 70% additional water method was adopted, where the calculation was based on the difference between 70% of the water absorption capacity of the RFA (product of water absorption rate and mass) and the moisture content of the RFA (product of moisture content and mass). This difference was added as additional water to the freshly mixed concrete.

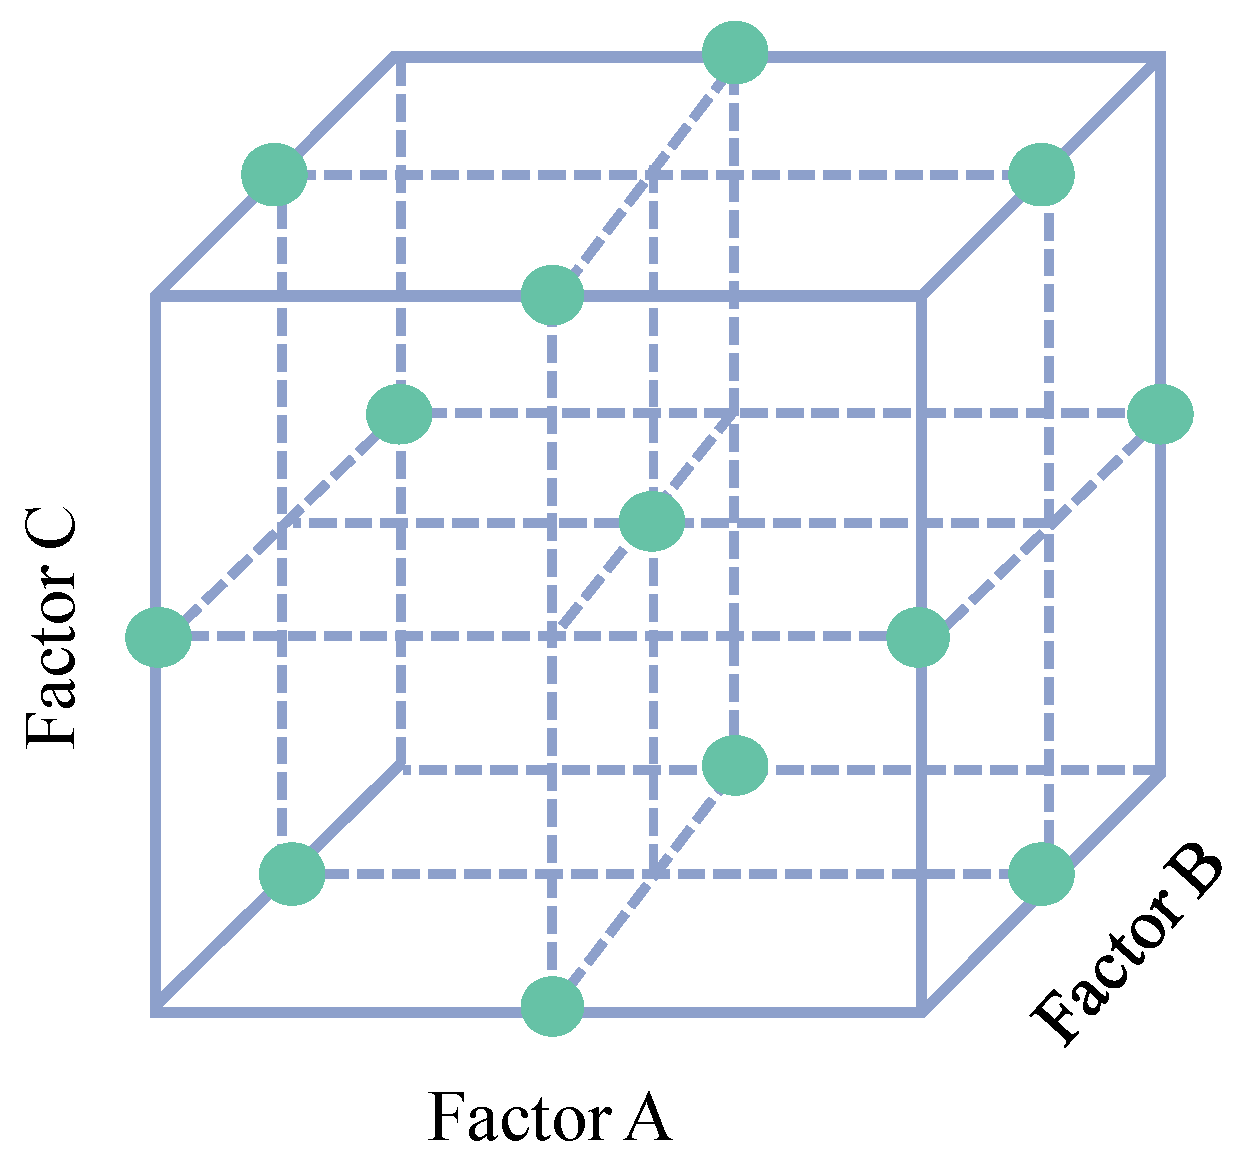
2.3.2. BBD Trial Protocol

The Box–Behnken design (BBD) used in response surface analysis are a type of 3-level experimental design method. The experiment adopts an incomplete block design, where the designed experiment does not include all possible combinations of the three factors. However, each factor has at least one opportunity to run at the same time with each level of the other factors, forming an experimental plan. BBD can effectively utilize each experimental unit without generating excessive experimental groups [32]. Figure 3 represents a schematic diagram of factor-level coding in BBD.
As shown in Figure 3, the three selected factors in the experiment can be combined to form a cube. When conducting optimal combinations using BBD, the endpoints of the cube are not included. All selected points can only be located on a spherical surface or at the center of the sphere. Therefore, when an experiment requires the design of multiple factors with different levels, and conducting endpoint experiments is either cost-prohibitive or physically unfeasible, the use of BBD design is highly advantageous [22]. The optimization design of concrete mix proportions falls under the category of experimental design with interactions among multiple factors at different levels. Parallel experiments cannot accurately identify the endpoints, making BBD design suitable in this case. The variable factors chosen were the dosage of WCP, water–cement ratio, and replacement rate of RFA, with the levels of these factors listed in Table 4.
The BBD scheme was designed with a total of 17 different mix proportion combinations, with three specimens tested for each group, and the average value was taken as the result. Please refer to Table 5 for the concrete compressive strength tests conducted based on the design table. The compressive strength performance of the concrete was tested at 3 days, 28 days, and 90 days, and the obtained data are shown in the Figure 4. The relationship between the compressive strength of the composite recycled aggregate concrete and the influencing factors was established based on characteristic parameters.

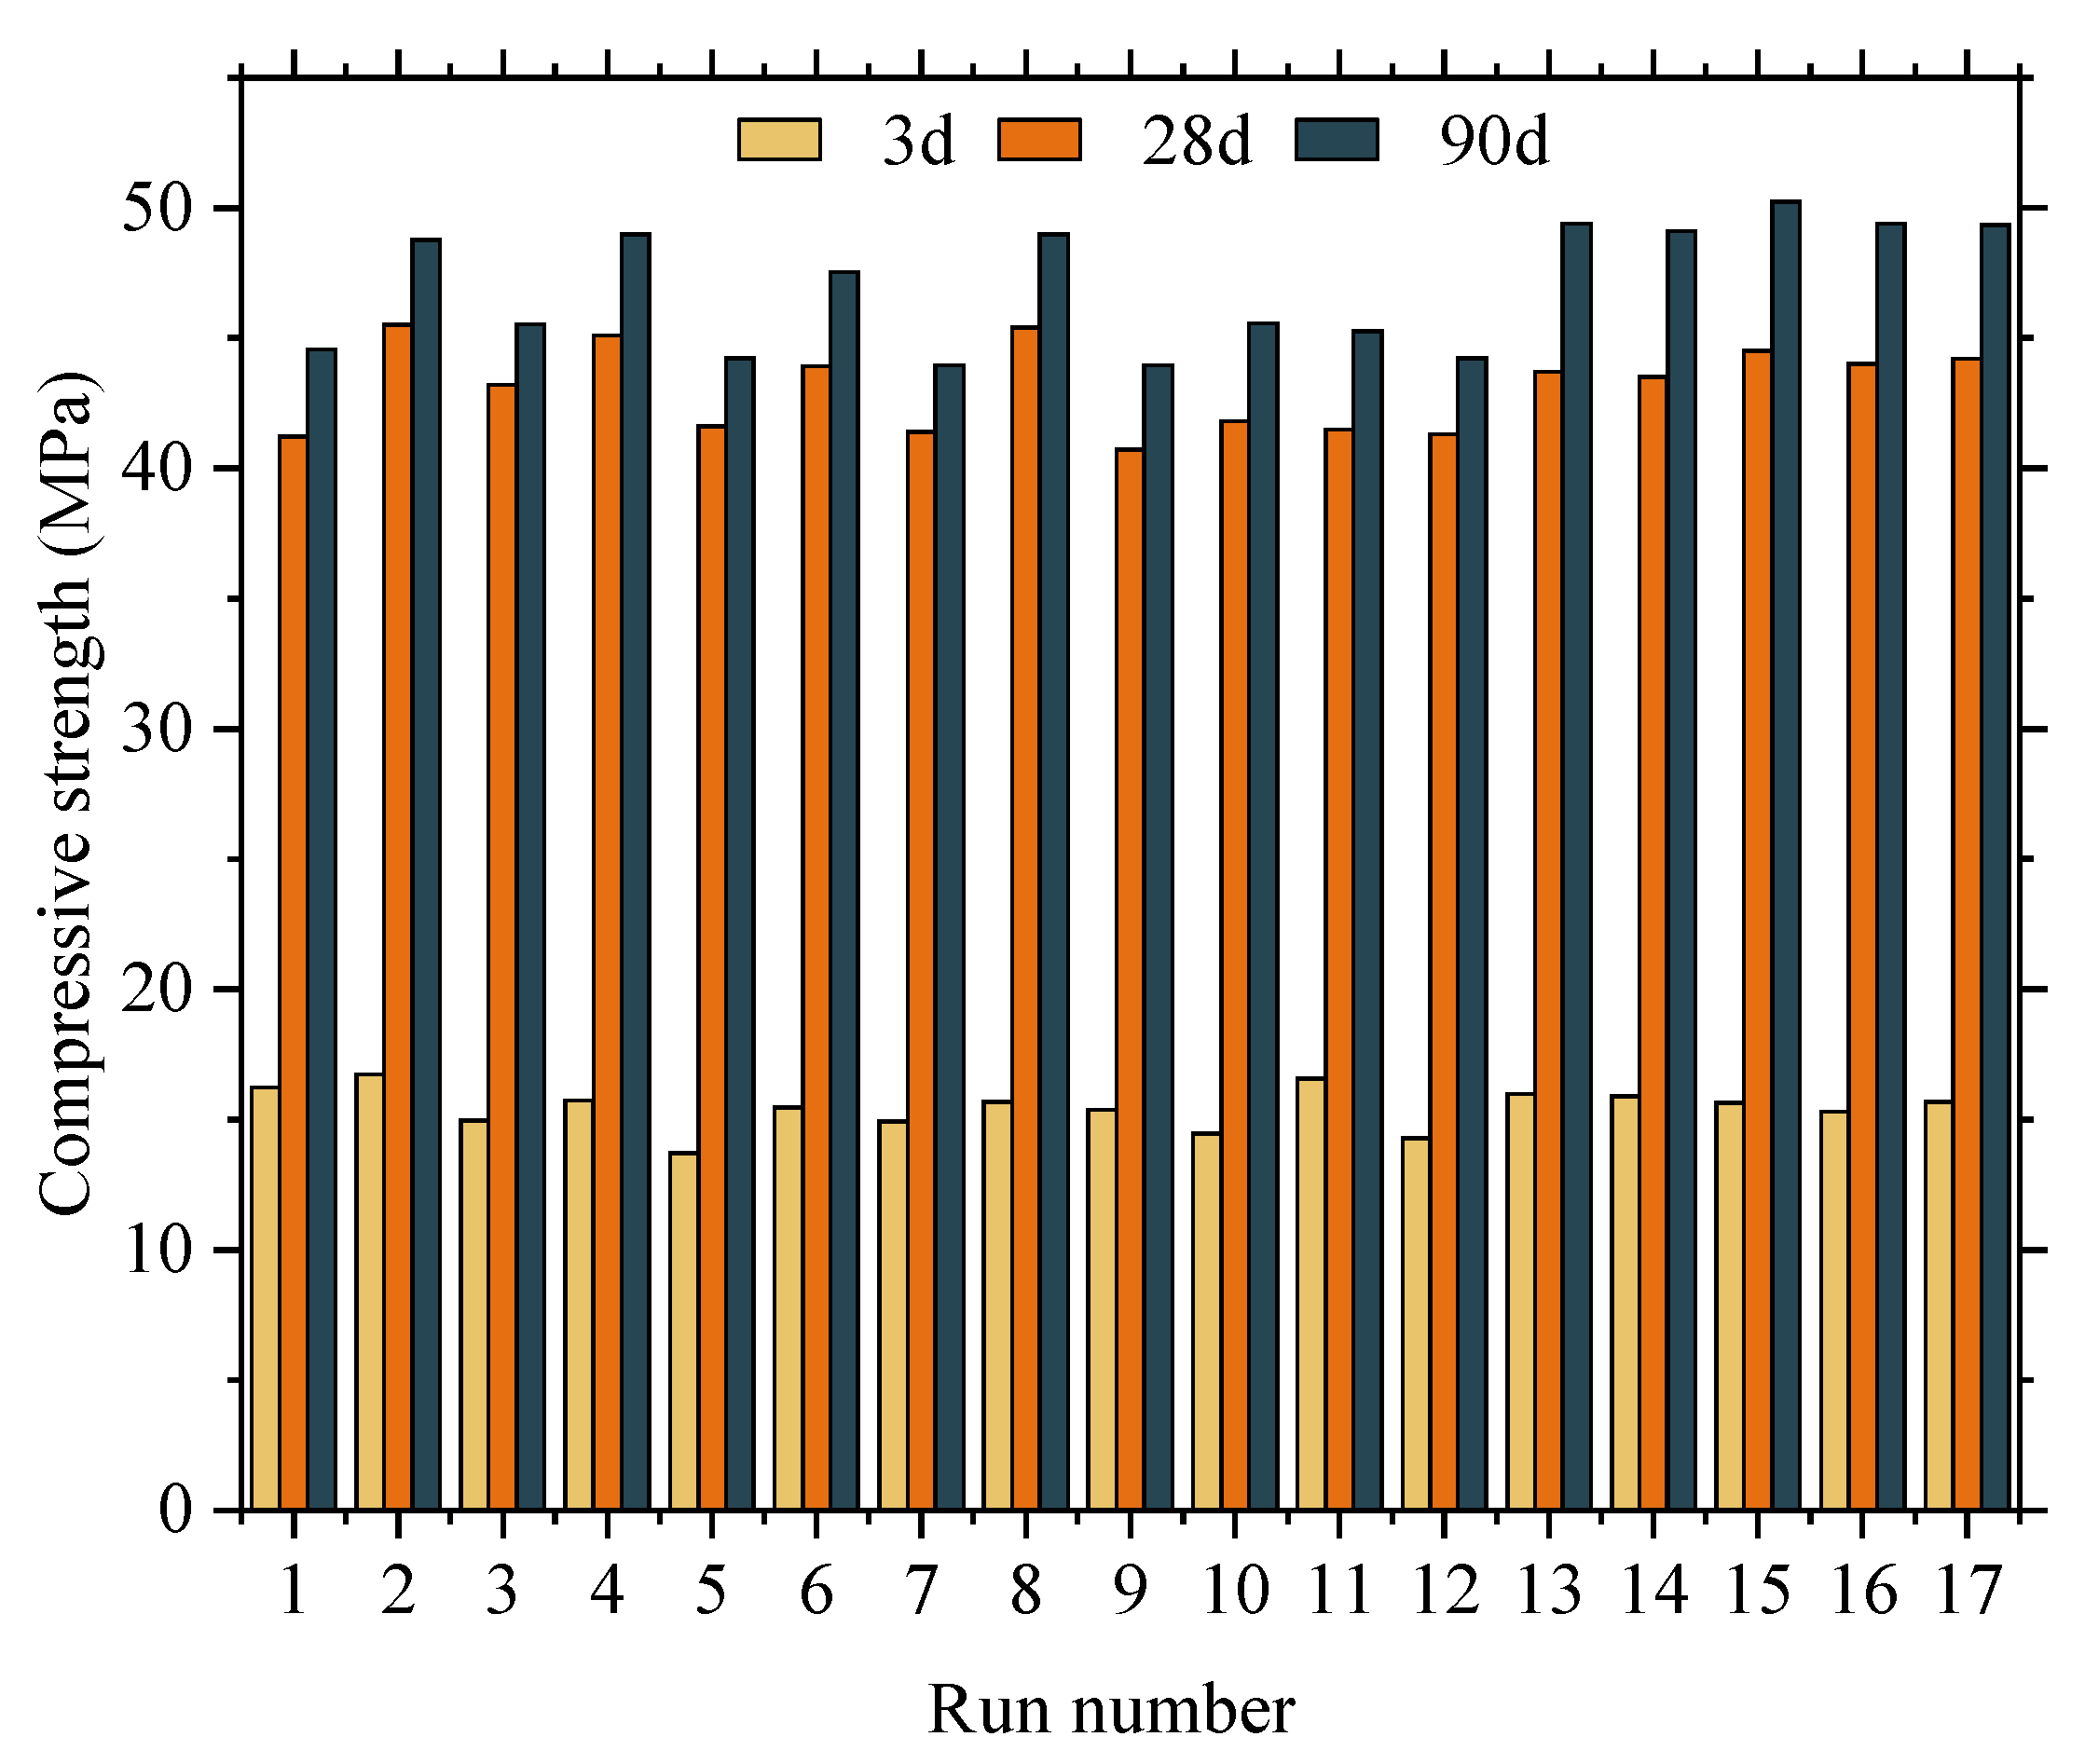
2.3.3. Compressive Strength Test

The cube compressive strength tests were conducted in accordance with the “Standard Test Methods for Mechanical Properties of Ordinary Concrete” (GB/T 50081-2016) [33]. The specimen dimensions were 150 mm × 150 mm × 150 mm. After demolding, the specimens were placed in a standard curing room at a temperature of 20 ± 2 °C and a relative humidity of at least 95%. The compressive strength was tested after curing for the specified length of time. The loading rate for the compressive strength test was set at 5 kN/s. The average value of the compressive strength was calculated from three specimens for each mix proportion. The compressive strength test pictures are shown in the Figure 5.

2.3.4. SEM Test

The experiment was conducted using a Quanta250 scanning electron microscope, manufactured by FEI Company in the United States. This equipment allows for the observation of the morphological structure of high-molecular-polymer materials. The technical parameters of the Quanta250 scanning electron microscope are as follows:
  • Magnification: 20–3 × 10⁵;
  • Acceleration voltage: 0.2–30 kV;
  • Beam current: maximum 2 µA and continuously adjustable;
  • Moving range of the sample table: X = Y = 50 mm.
Prior to analysis, the specimens were crushed after curing for the specified length of time, and flat fragments of approximately 1 cm without sharp edges were selected as the test objects. The fragments were soaked in anhydrous ethanol to halt cement hydration. When ready for measurement, the samples were taken out and vacuum dried at 50 °C for 48 h. Before imaging, a conductive layer of approximately 15 mm was formed on the samples by sputtering with gold (Au) to enhance conductivity and prevent electron accumulation from affecting the imaging quality. The accelerating voltage of the instrument was set to 15 kV, with a working distance of approximately 10 mm. The SEM test pictures are shown in the Figure 6.

3. Response Surface Result Analysis

3.1. Model Establishment

For response surface analysis, if Quadratic Programming fitting is adopted,
q X 1 , X 2 , X 3 = c 0 + i = 1 3 c i X i + i = 1 3 j = 1 3 c i j X i j + ϖ
where c 0 , c i , and c i j are the coefficients to be determined, and the total number of coefficients is 10. That is, c = c 0 , c 1 , c 10 . ϖ is the error. Let q X be related to X1, X2, and X3. For a set of determined values of the independent variables X1, X2, and X3, there exists a distribution of q X . If a mathematical expectation of q X exists, q X is a function of X1, X2, and X3, and we call it a regression of X1, X2, and X3. Let (X11, X12, X13, q1), (X21, X22, X23, q2), and (X31, X32, X33, q3) be three samples.
The maximum likelihood estimation method is used for parameter estimation: taking c ^ 0 , c ^ 1 , c ^ 2 , and c ^ 3 , such that when c 0 = c ^ 0 , c 1 = c ^ 1 , c 2 = c ^ 2 , and c 3 = c ^ 3 , the existence of takes a minimum, that is, its inverse is 0.
If we take the partial derivative of c 0 , c 1 , c 2 , and c 3 with respect to Y and set it equal to 0, we obtain:
X X C = X Q
X = 1             X 11             X 12             X 13 1             X 21             X 22             X 23 1             X 31             X 32             X 33 ,   C = c 1 c 2 c 3
Multiply both sides of X X C = X Q times the inverse of X X , X X 1 , and we obtain
C ^ = c ^ 1             c ^ 2             c ^ 3 1 = X X 1 X Q
Equation (3) is the solution equation for BBD.
The compressive strength of concrete is determined by the content of WCP, water–cement ratio, and replacement rate of RFA. Based on Equation (3), a multi-parameter fitting equation was derived from Table 5 to describe the response of different factors on the compressive strength of concrete at 3 days, 28 days, and 90 days. Terms with coefficients smaller than 10−9 were omitted from the equation. The resulting compressive strength prediction model is presented in Table 6.
Y3d is the compressive strength at 3 days, representing the short-term strength of concrete; Y28d is the 28-day compressive strength, meaning the middle-term compressive strength. Y90 is the 90-day compressive strength and represents the long-term compressive strength.

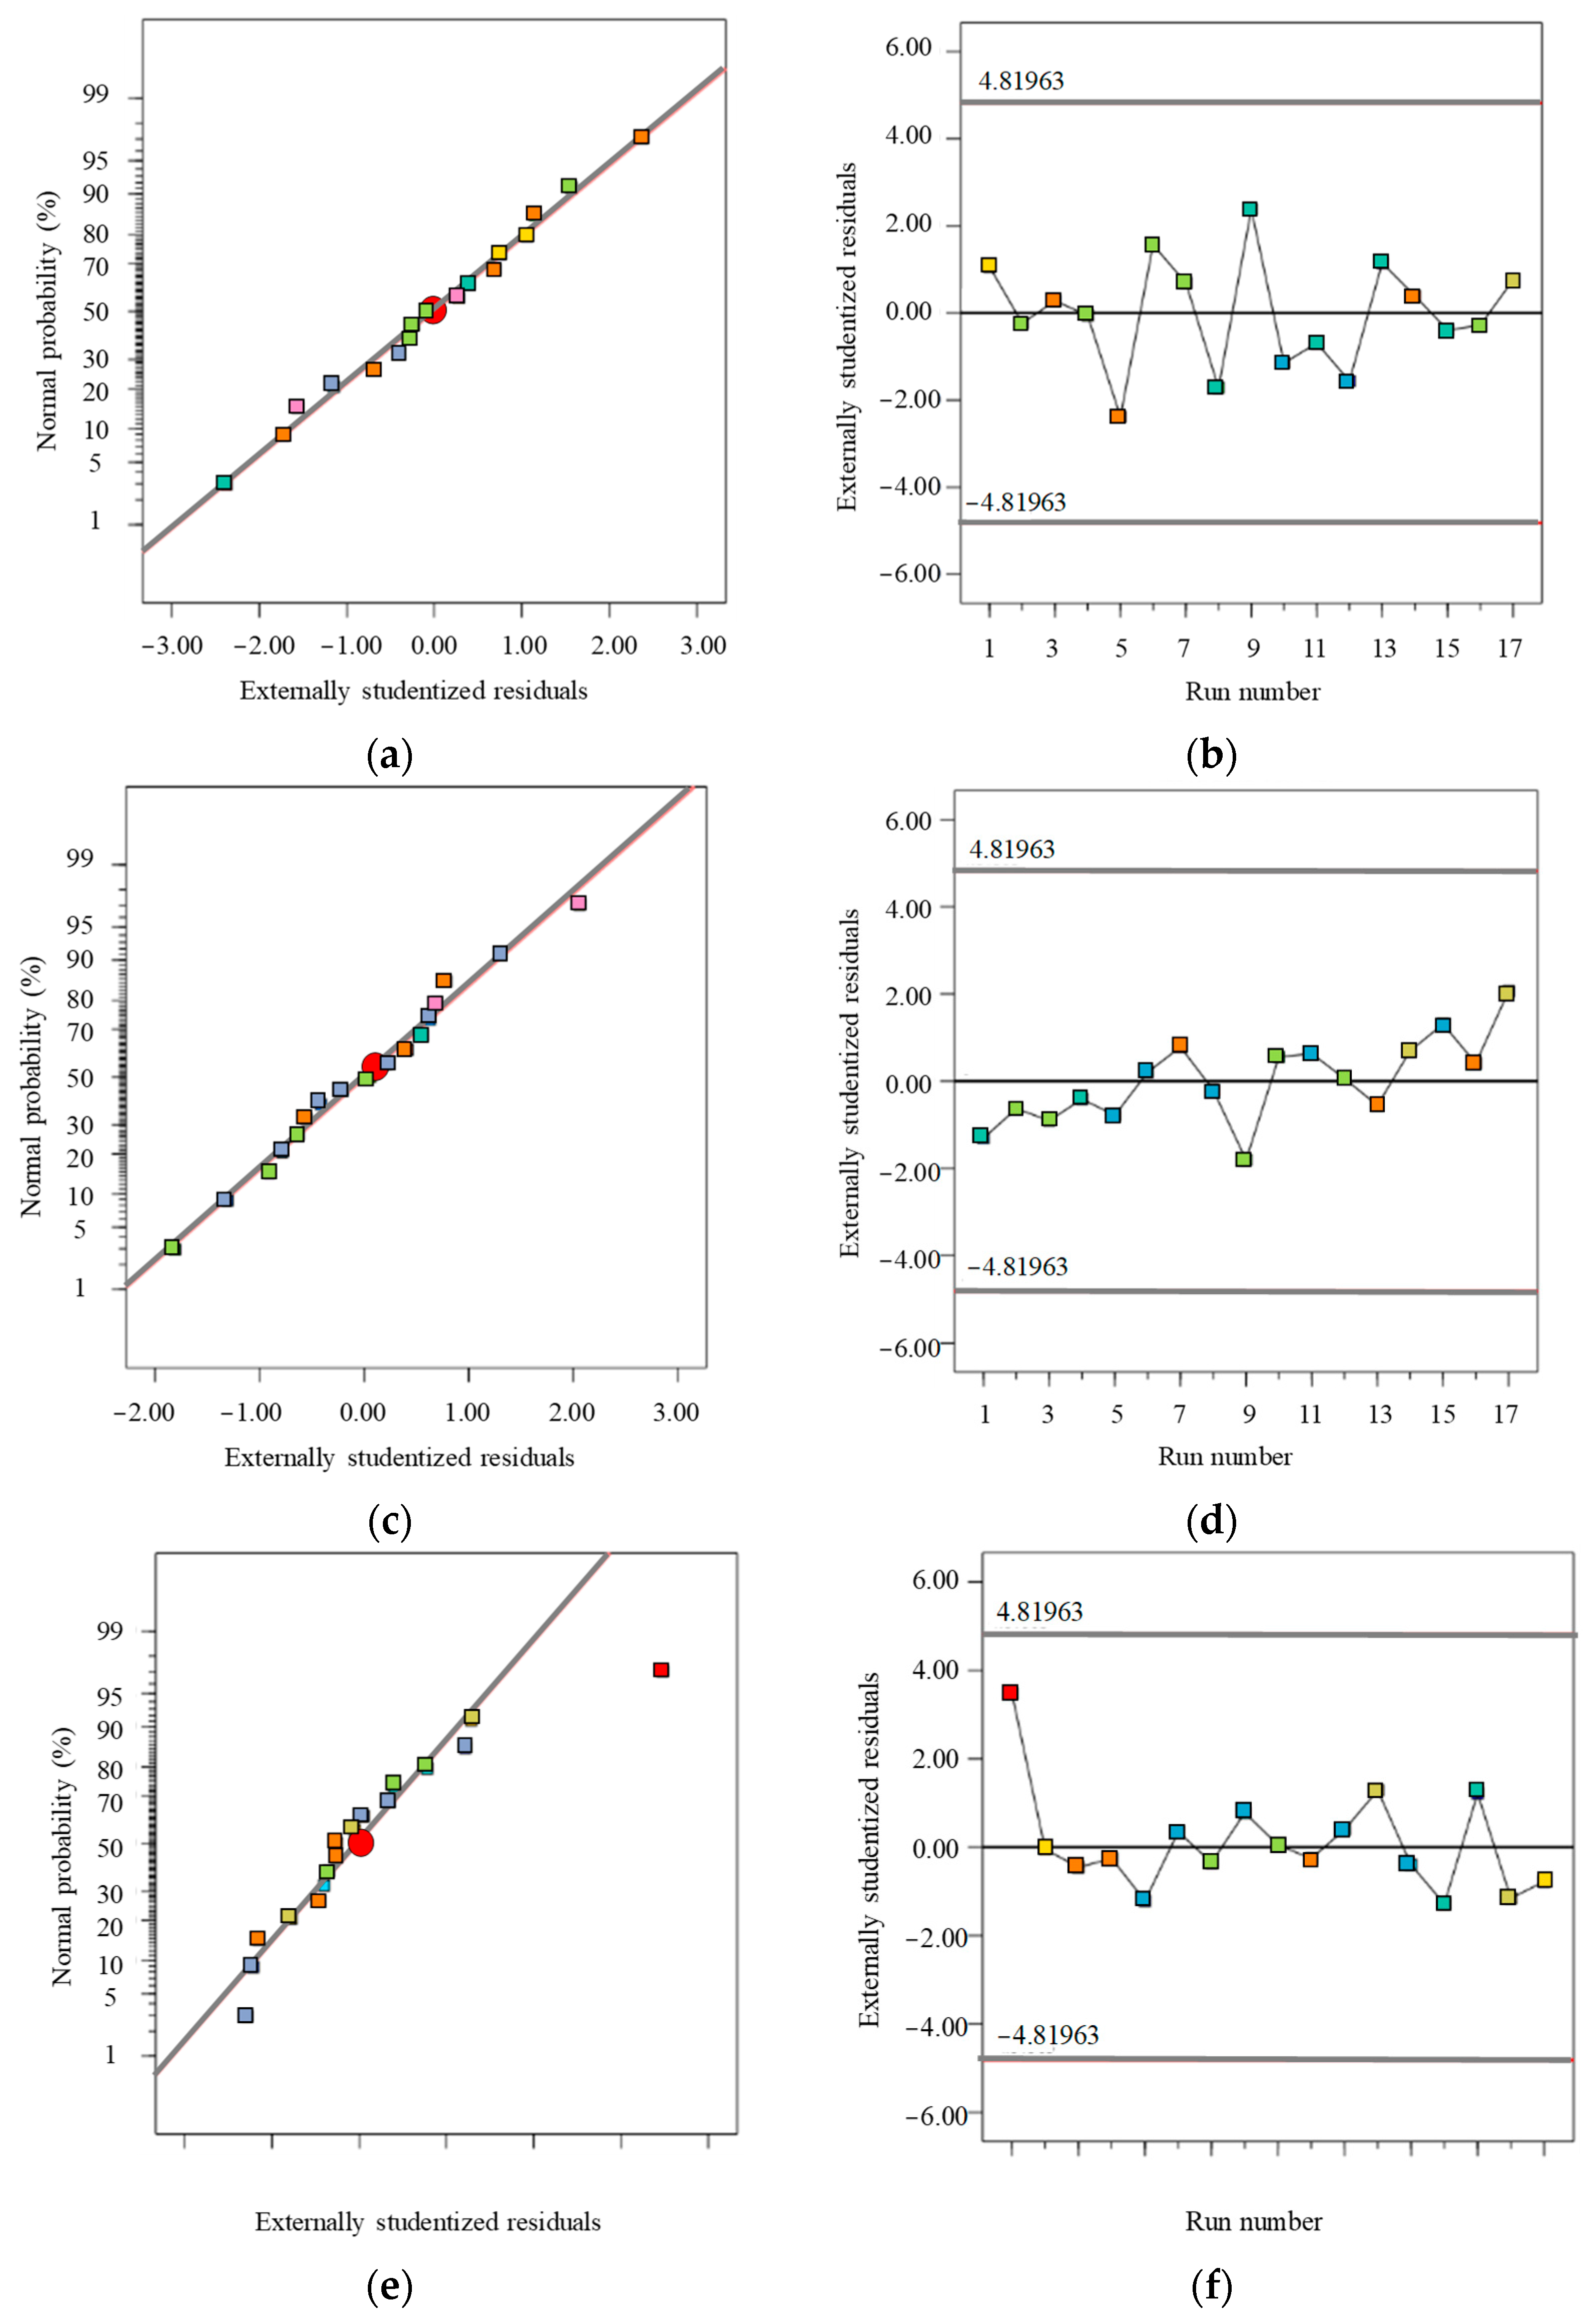
3.2. Model Verification of Response Surface Analysis

The response surface model essentially represents the implicit functional relationship between the independent variables and the response variable. To address the question of whether there exists a statistically significant relationship between the independent variables and the response variable, it is necessary to conduct significance tests, analysis of variance, and precision tests on the model designed in this study. These tests aim to determine the goodness of fit of the regression results [25].
The coefficient of determination R2 (R-Squared) is used to evaluate the model’s goodness of fit and describe the degree to which the input variables explain the output variables. The closer R2 is to 1, the better the model is. The calculation method is as follows:
R 2 = 1 s = 1 S x s m n x s c 2 s = 1 S x s c x ¯ s 2
where S is the number of verification points in the design space; x s c is the target value calculated on the response surface of the s group parameters; x s m n is the target value calculated by the finite element model with the s parameter; and x ¯ s is the average of the results calculated by the finite element model analysis. The R2 determination coefficient represents the degree of difference between the response surface and the actual value. It takes values between 0 and 1, where a value of 1 indicates that they are entirely consistent.
The corrected coefficient of determination (Radj) increased the model’s simplicity. It ensured the reliability of the model by eliminating the number of terms that did not improve the accuracy of the model. It is usually analyzed together with the prediction determination coefficient (Rpred), which reflects the prediction ability of the model and requires that the difference between the two does not exceed 0.2, as shown in Equation (5):
RadjRpred < 0.2
where Radj is between 0 and 1—the more prominent, the better. The value close to 1 may lead to overfitting situations.
p-values were used for hypothesis testing. If the p-value is less than 0.05, the factor is significant in the model; otherwise, it is insignificant. The p-value of less than 0.01 indicates that the element is highly effective in the model. The F-test method was used to test the hypothesis, as shown in Equation (6):
F = S S R / p S S E / m p 1
where SSR is the sum of regression squares of R; p is the number of non-constant terms of the response surface function; and p and m p 1 are the degrees of freedom for SSR and SSE, respectively. For a given confidence level α , the response surface model is considered significant when F > F α ( p ,   m p 1 ) .
The results calculated according to the above method are listed in Table 7.
The predicted R2 values for the compressive strength at 3 days, 28 days, and 90 days were 0.8565, 0.9057, and 0.9380, respectively. These values, along with the adjusted R2 values of 0.8658, 0.9558, and 0.9744, respectively, have adjustment differences less than 0.2, indicating reasonable consistency. The Adeq Precision signal-to-noise ratios were measured as 13.8164, 19.5297, and 19.8009, respectively, all of which are greater than 4. This demonstrates that the model established in this study can represent the variation pattern of compressive strength for this specific mix proportion of concrete. The F-values for the models were 12.47, 39.47, and 68.75, indicating the significance of the model. The p-values for all models were less than 0.01, indicating high reliability and statistical significance. The model’s adjusted determination coefficients were 0.8658, 0.9558, and 0.9744, respectively, indicating that the models can explain 86.58%, 95.58%, and 97.44% of the variation in the compressive strength response. The model’s predicted determination coefficients were 0.8565, 0.9057, and 0.9380, respectively, with coefficients of variation (C.V) less than 10%, indicating a good fit between the models and the actual data. Therefore, the aforementioned models can be used for subsequent analysis and optimization.
Figure 7 shows the residual plots for compressive strength at 3 d, 28 d, and 90 d.
From Figure 7, it can be observed that in the compressive strength models at 3 days, 28 days, and 90 days, the normal probability distribution of residuals (a), (c), and (e) aligns along a straight line, while the distribution of residuals with predicted values (b), (d), and (f) appears irregular. Both the measured values and predicted values are located near a straight line. These results indicate that the models have good fitness.

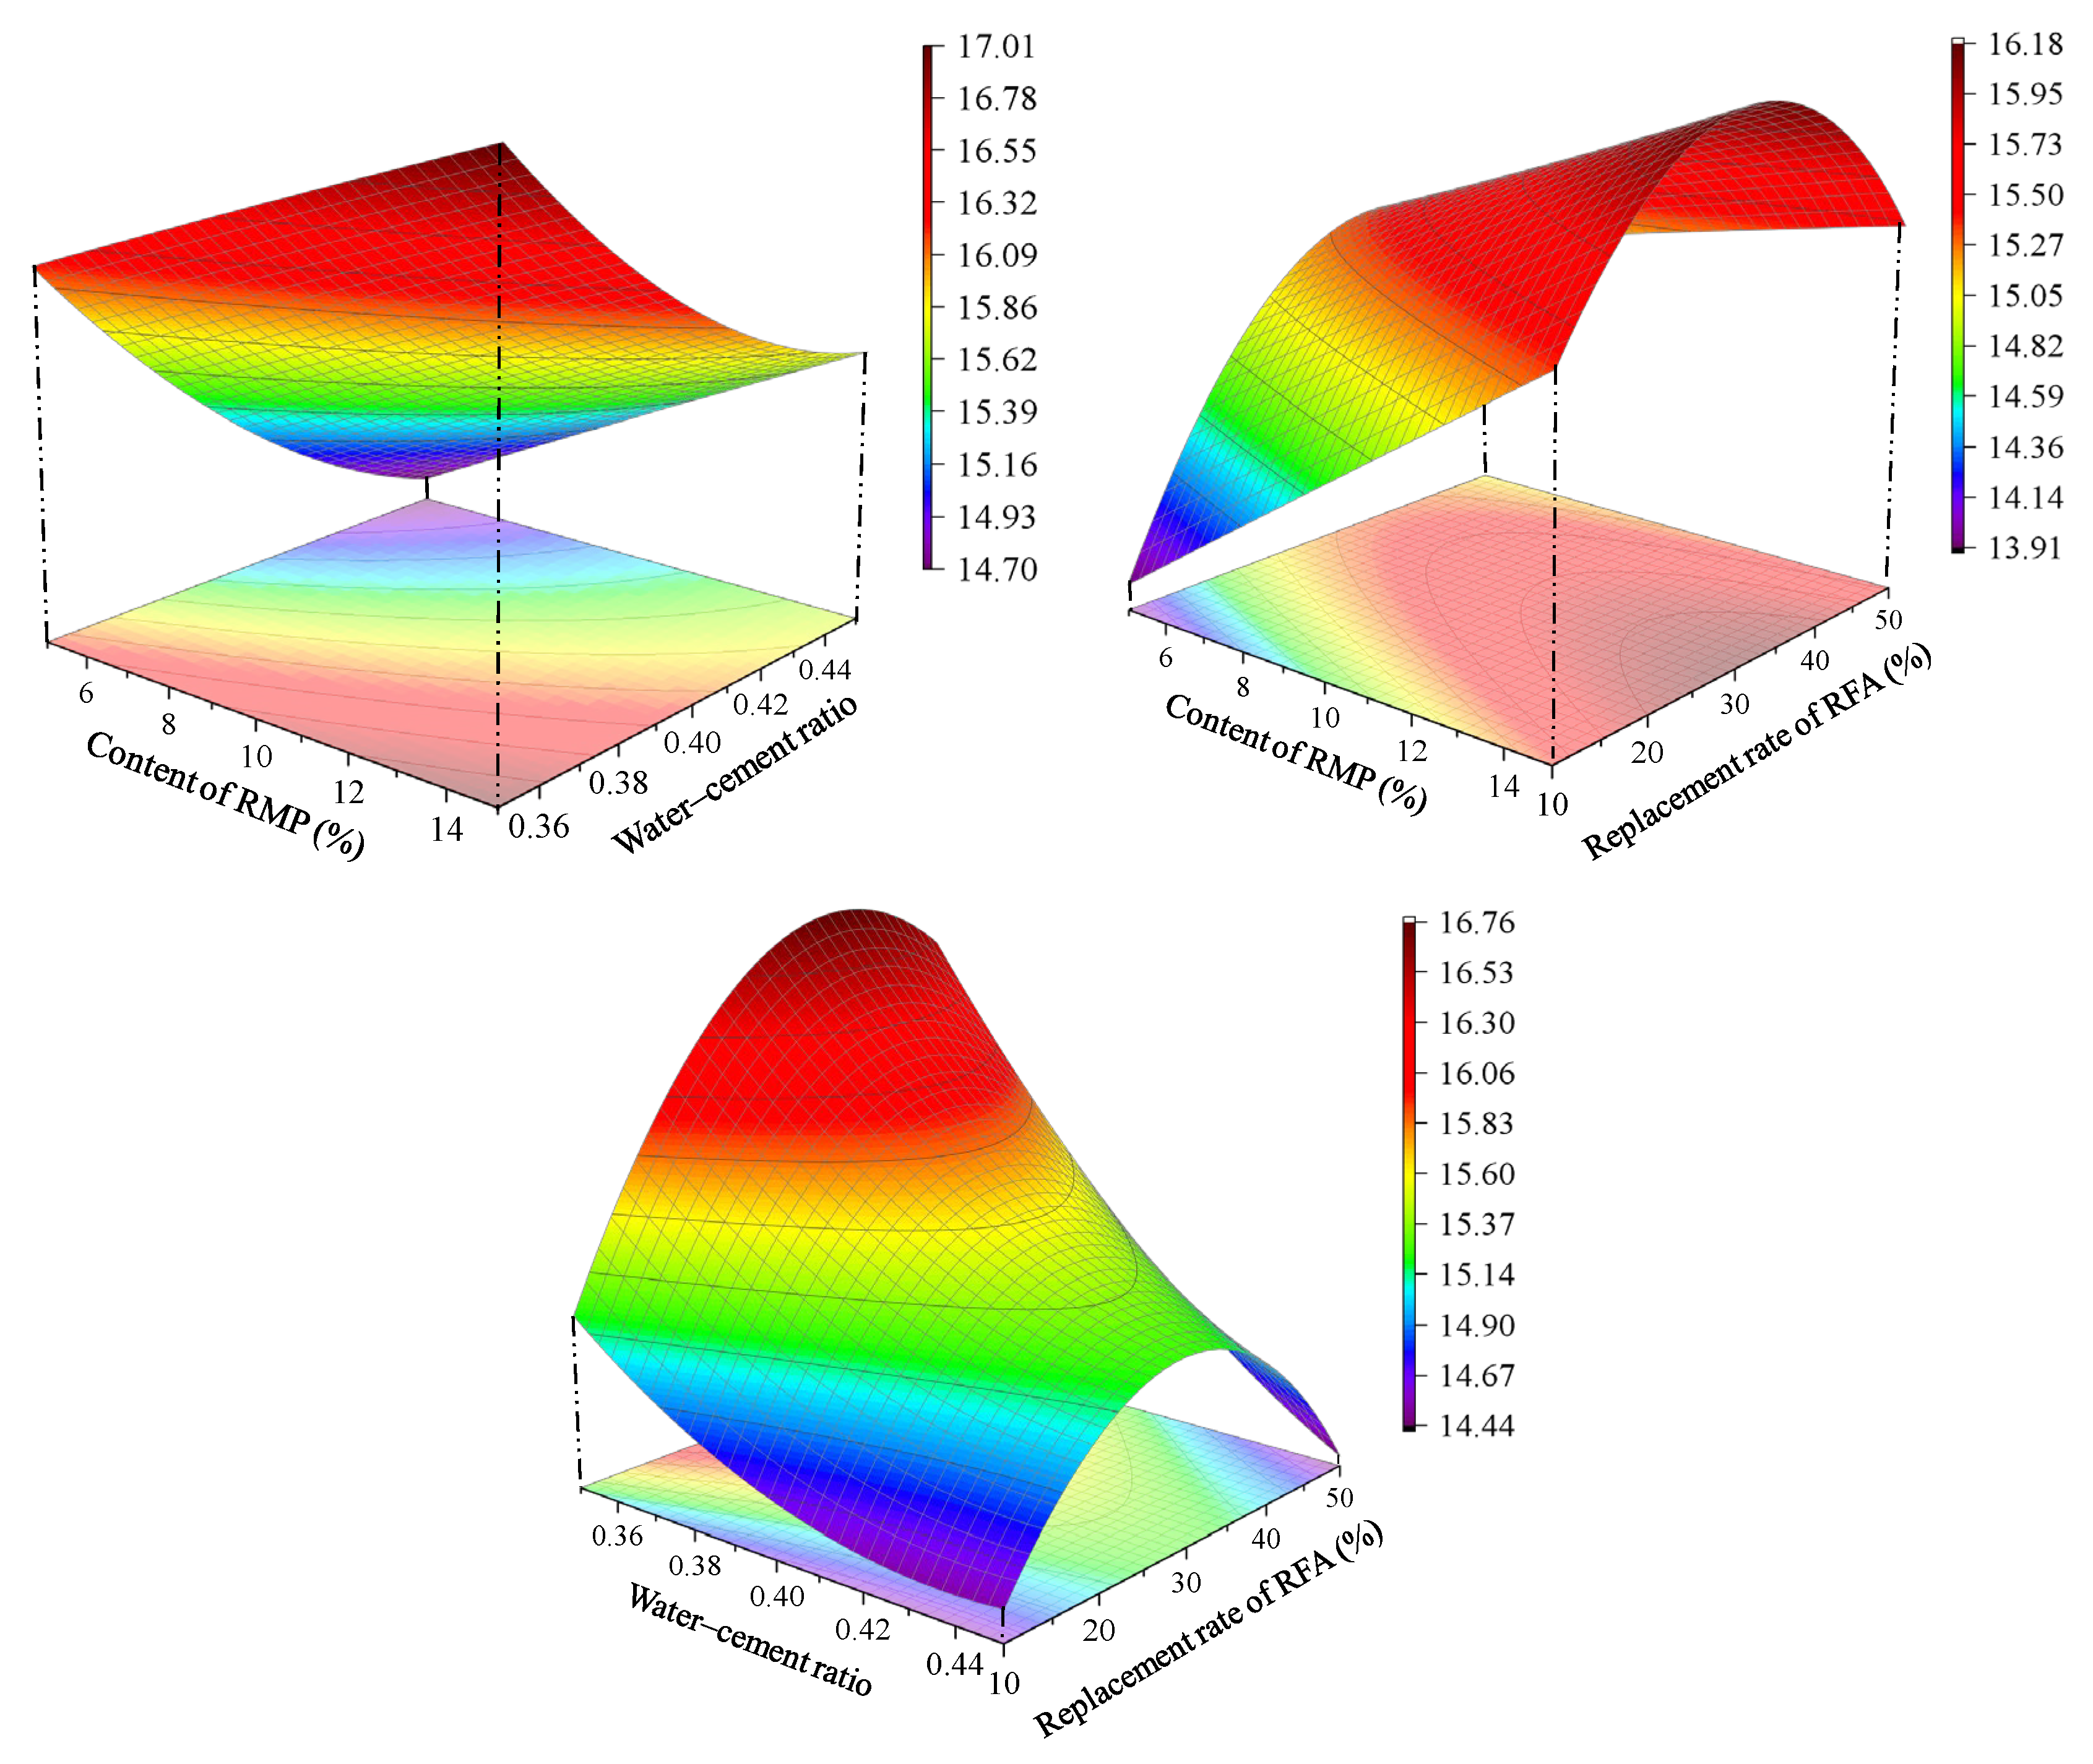
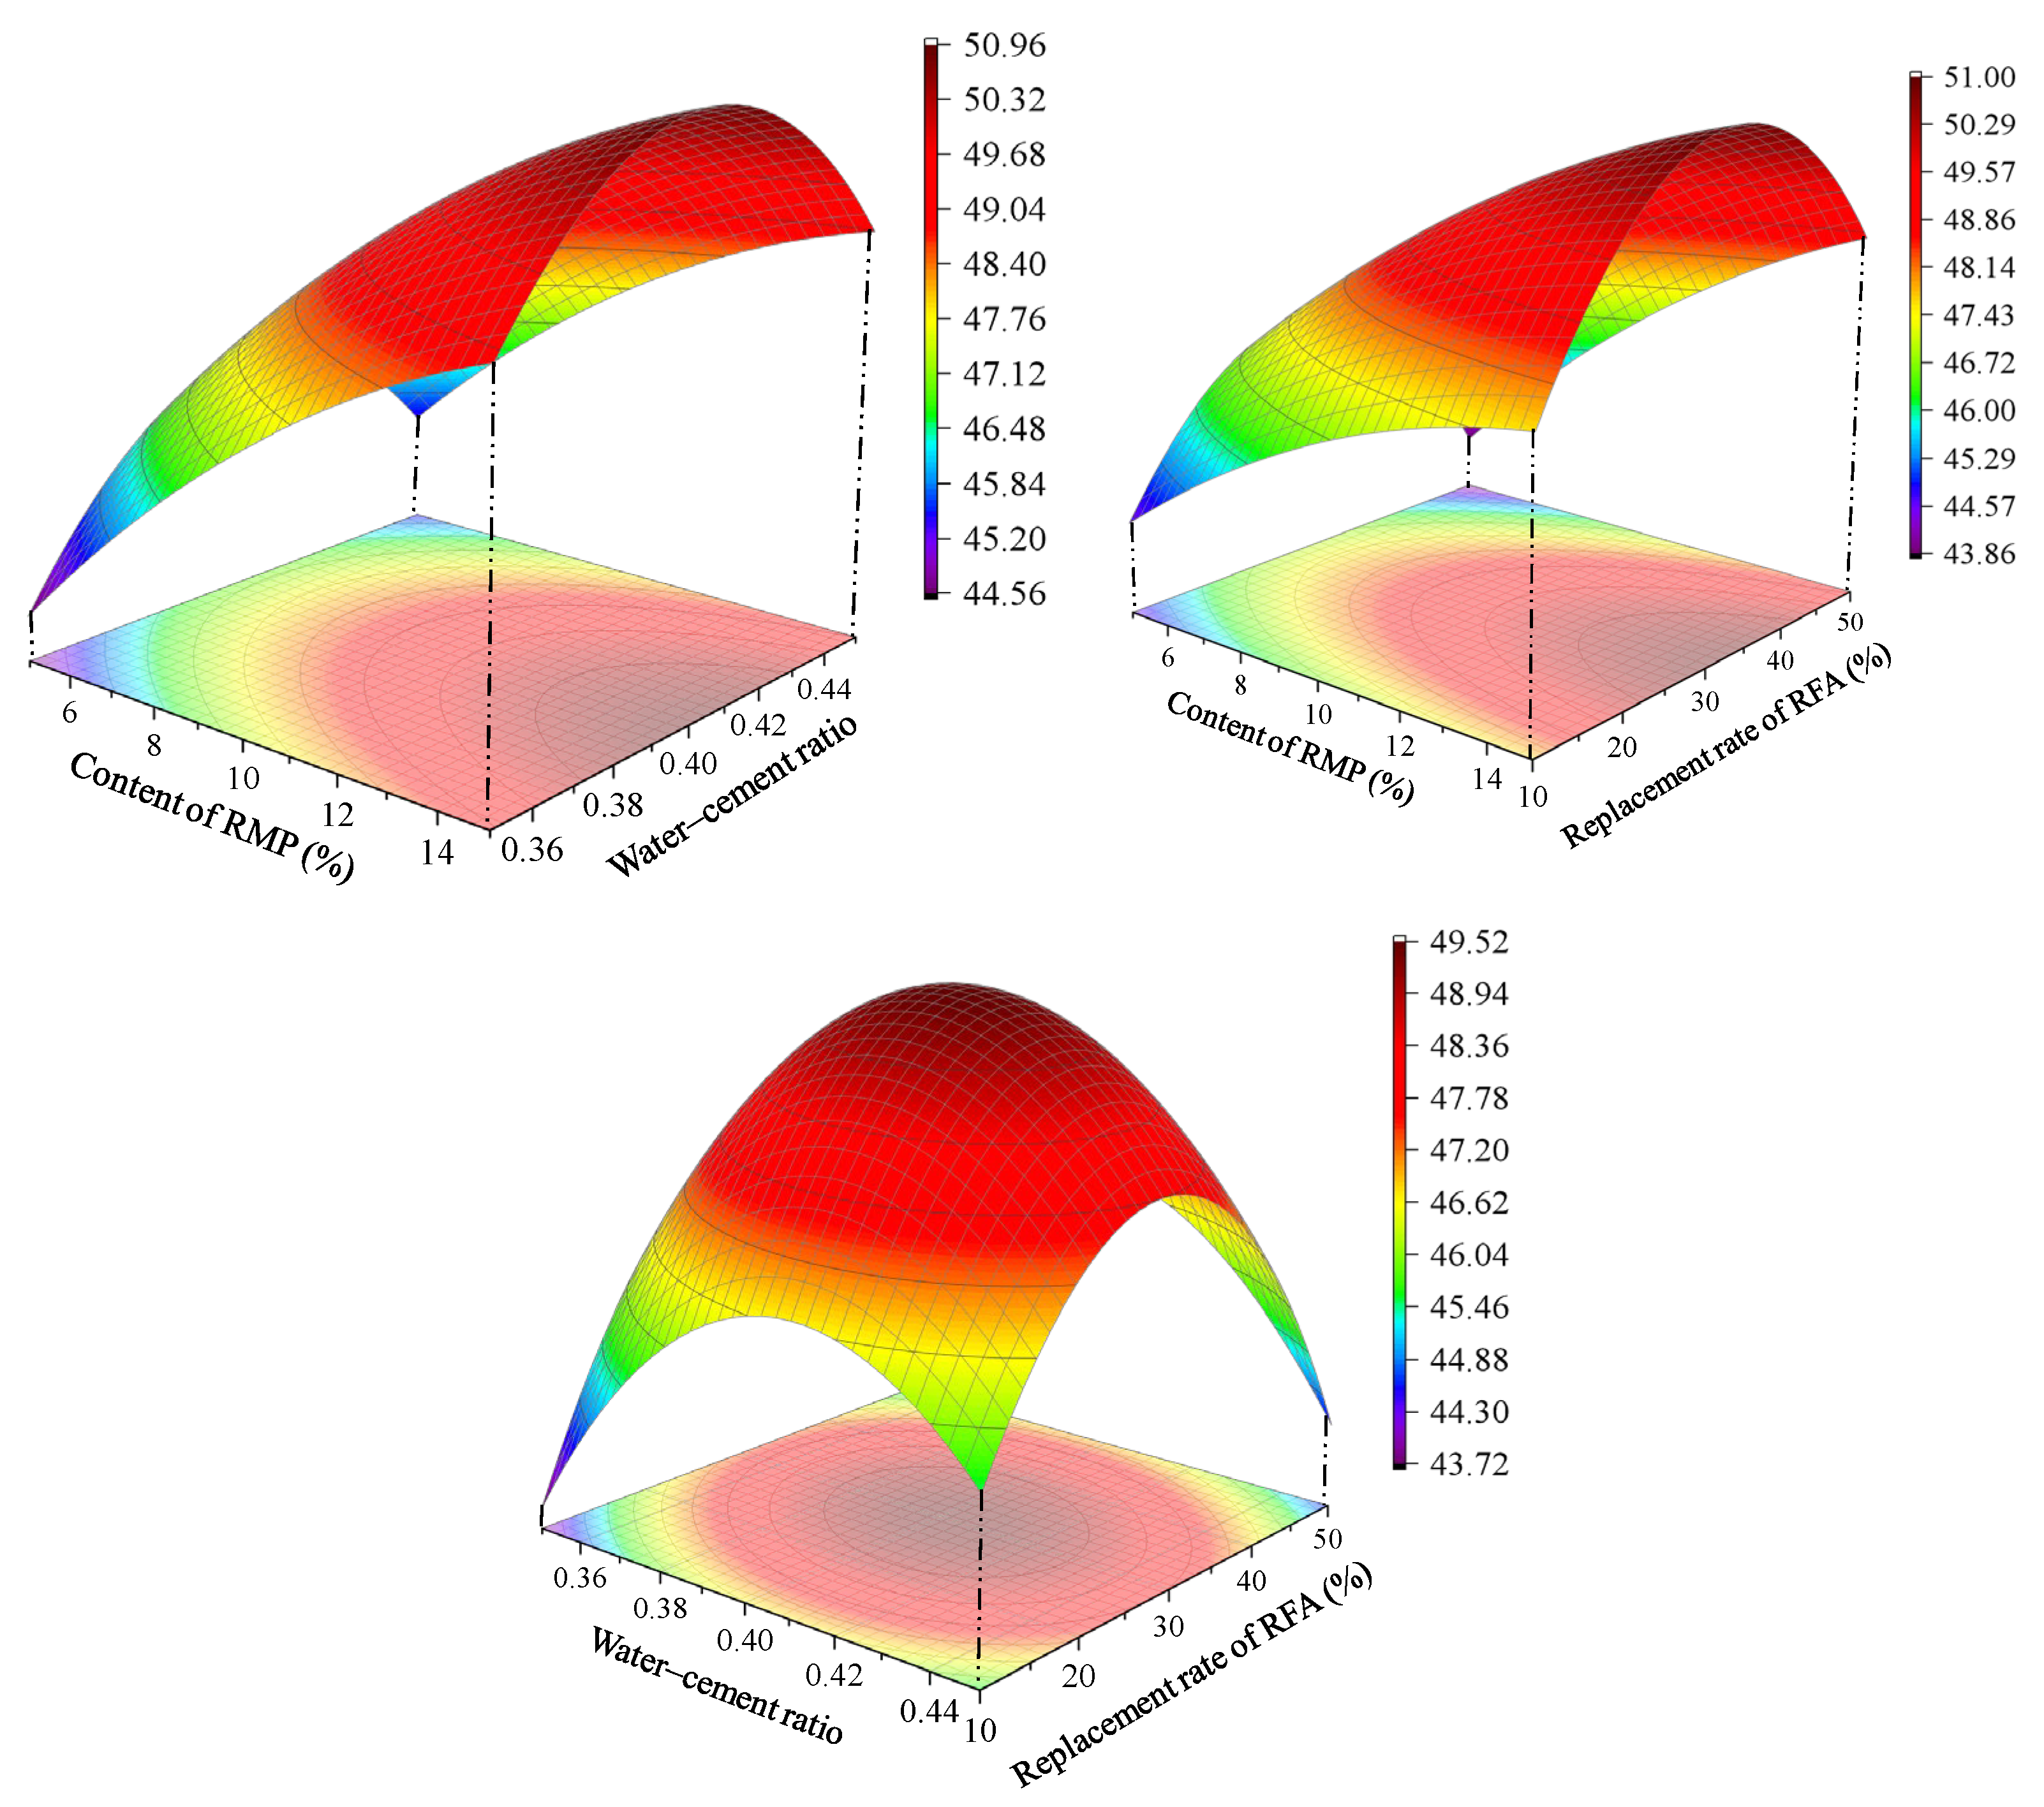
3.3. Analysis of Response Surface Test Results

Table 6 can draw a multifactor response surface plot and two-dimensional contour by verifying the qualified model. The response surface plots show the interaction between the two factors when the remaining factor takes an intermediate value. The interaction of all variables can be clearly shown in the figures. Figure 8, Figure 9 and Figure 10 show the relationship between the influence of the three factors on compressive strength under the interaction of a single element and two factors.
According to the graph, it can be observed that the compressive strengths at 3 days, 28 days, and 90 days all increase with an increase in the content of WCP. This indicates that the appropriate addition of WCP is beneficial for enhancing the strength of recycled aggregate concrete. From a physical perspective, powdered materials can be considered as fillers. Filling the micro-voids achieves the optimal particle gradation effect, which is consistent with the findings in reference [34]. From a chemical analysis point of view, the test results of oxide content in Section 2.2.2 indicate that WCP is rich in SiO2 and Al2O3, which gives it a potential pozzolanic effect. This reaction with water produces more cementitious material, which is another important reason for the increase in strength. This conclusion aligns with the findings in reference [35].
The compressive strength at 3 days decreases with an increase in the water–cement ratio. The results of compressive strength at 28 days and 90 days indicate that for a water–cement ratio ranging from 0.35 to 0.4, the compressive strength increases with an increase in the water–cement ratio. For a water–cement ratio ranging from 0.4 to 0.45, the compressive strength decreases with an increase in the water–cement ratio. At a water–cement ratio of 0.45, the compressive strength is higher than that at a water–cement ratio of 0.35. This study fully considers the difference in water demand between WCP and RFA compared to natural aggregate. A too low water–cement ratio with insufficient water content may affect the hydration reaction of cementitious materials, resulting in inadequate cementing action and unfavorable compressive strength development. An excessively high water–cement ratio may reduce the compactness of the matrix and increase the capillary porosity due to the presence of free water. This also hinders the increase in compressive strength, which aligns with the findings in reference [36].
The compressive strength at 3 days, 28 days, and 90 days shows an initial increase and then a decrease with an increase in the content of RFA. The maximum compressive strength at 3 days is achieved at a replacement rate of 30%. The test results of aggregate properties in Section 2.1 of this study indicate that the crushing index of RFA is twice that of NFA, resulting in an increase in weak links within the matrix due to its lower strength. This effect is not significant at lower replacement rates of RFA. Instead, it may indirectly adjust the water–cement ratio due to the changes in the water absorption rate of the fine aggregate, which has a positive impact on the compressive strength. However, as the replacement rate increases, the overall continuity of the strength of the matrix becomes discontinuous. The concentration of stress during the compression process leads to a decrease in strength. Similar conclusions can be found in reference [37].
Analysis of variance (ANOVA) was conducted using the model proposed in this study. The significance of factors was determined using the F-test, where F is the ratio of the regression mean square to the residual mean square. The critical value of the factor was set as F0, and the probability of F being smaller than F0 was denoted as p. In this study, the significance of the three factors and their interactions was evaluated based on p-values. A significance level of p < 0.01 was considered highly significant, 0.01 < p < 0.05 was considered significant, and p > 0.05 was considered non-significant. The calculated results of compressive strength can be found in Table 8, Table 9 and Table 10.
The results of the analysis of variance for the compressive strength at 3 days indicate that the p-value for factor A is 0.0026, and the p-value for factor B is 0.0003, both of which are less than 0.01. This demonstrates that the influence of the content of WCP and the water–cement ratio on the short-term compressive strength of recycled concrete is highly significant. The p-value for factor C is 0.0208, which is less than 0.05, indicating a significant effect of the replacement rate of RFA on the short-term compressive strength of recycled concrete. The interaction BC has a p-value of 0.0452, also less than 0.05, suggesting that the interaction between the water–cement ratio and the replacement rate of fine aggregate significantly affects the short-term compressive strength of recycled concrete.
The results of the analysis of variance for the compressive strength at 28 days indicate that the p-value for factor A is less than 0.0001, and the p-value for factor B is 0.0360, which is less than 0.01. This demonstrates that the influence of the content of WCP and the water–cement ratio on the middle-term compressive strength of recycled concrete is highly significant. The p-value for factor C is 0.1414, which is greater than 0.05, indicating that the effect of the replacement rate of RFA on the standard compressive strength of recycled concrete is not significant.
The Interaction AB has a p-value of 0.0098, less than 0.01, indicating a significant effect of the interaction between the content of WCP and the water–cement ratio on the middle-term compressive strength. The interaction AC has a p-value of 0.0416, less than 0.05, demonstrating a significant influence of the interaction between the content of WCP and the replacement rate of fine aggregate on the middle-term compressive strength of recycled concrete. On the other hand, the interaction BC has a p-value of 0.0986, greater than 0.05, suggesting that the interaction between the water–cement ratio and the replacement rate of RFA does not have a significant impact on the compressive strength at 28 days.
The results of the analysis of variance for the compressive strength at 90 days indicate that the p-value for factor A is less than 0.0001, demonstrating a highly significant effect of the content of WCP on the long-term compressive strength of recycled concrete. The p-value for factor BC is 0.0104, which is less than 0.05, indicating a significant influence of the water–cement ratio and the replacement rate of RFA on the long-term compressive strength of recycled concrete.

3.4. Mix Ratio Optimization

The response surface is used to analyze the objective equation’s solution. The optimal mix ratio of recycled aggregate concrete based on mechanical properties is shown in Table 11.
The conclusion reveals that the optimal mechanical performance of concrete is achieved by incorporating 15% of WCP, maintaining a water–cement ratio of 0.43, and substituting 33% of NFA with RFA.

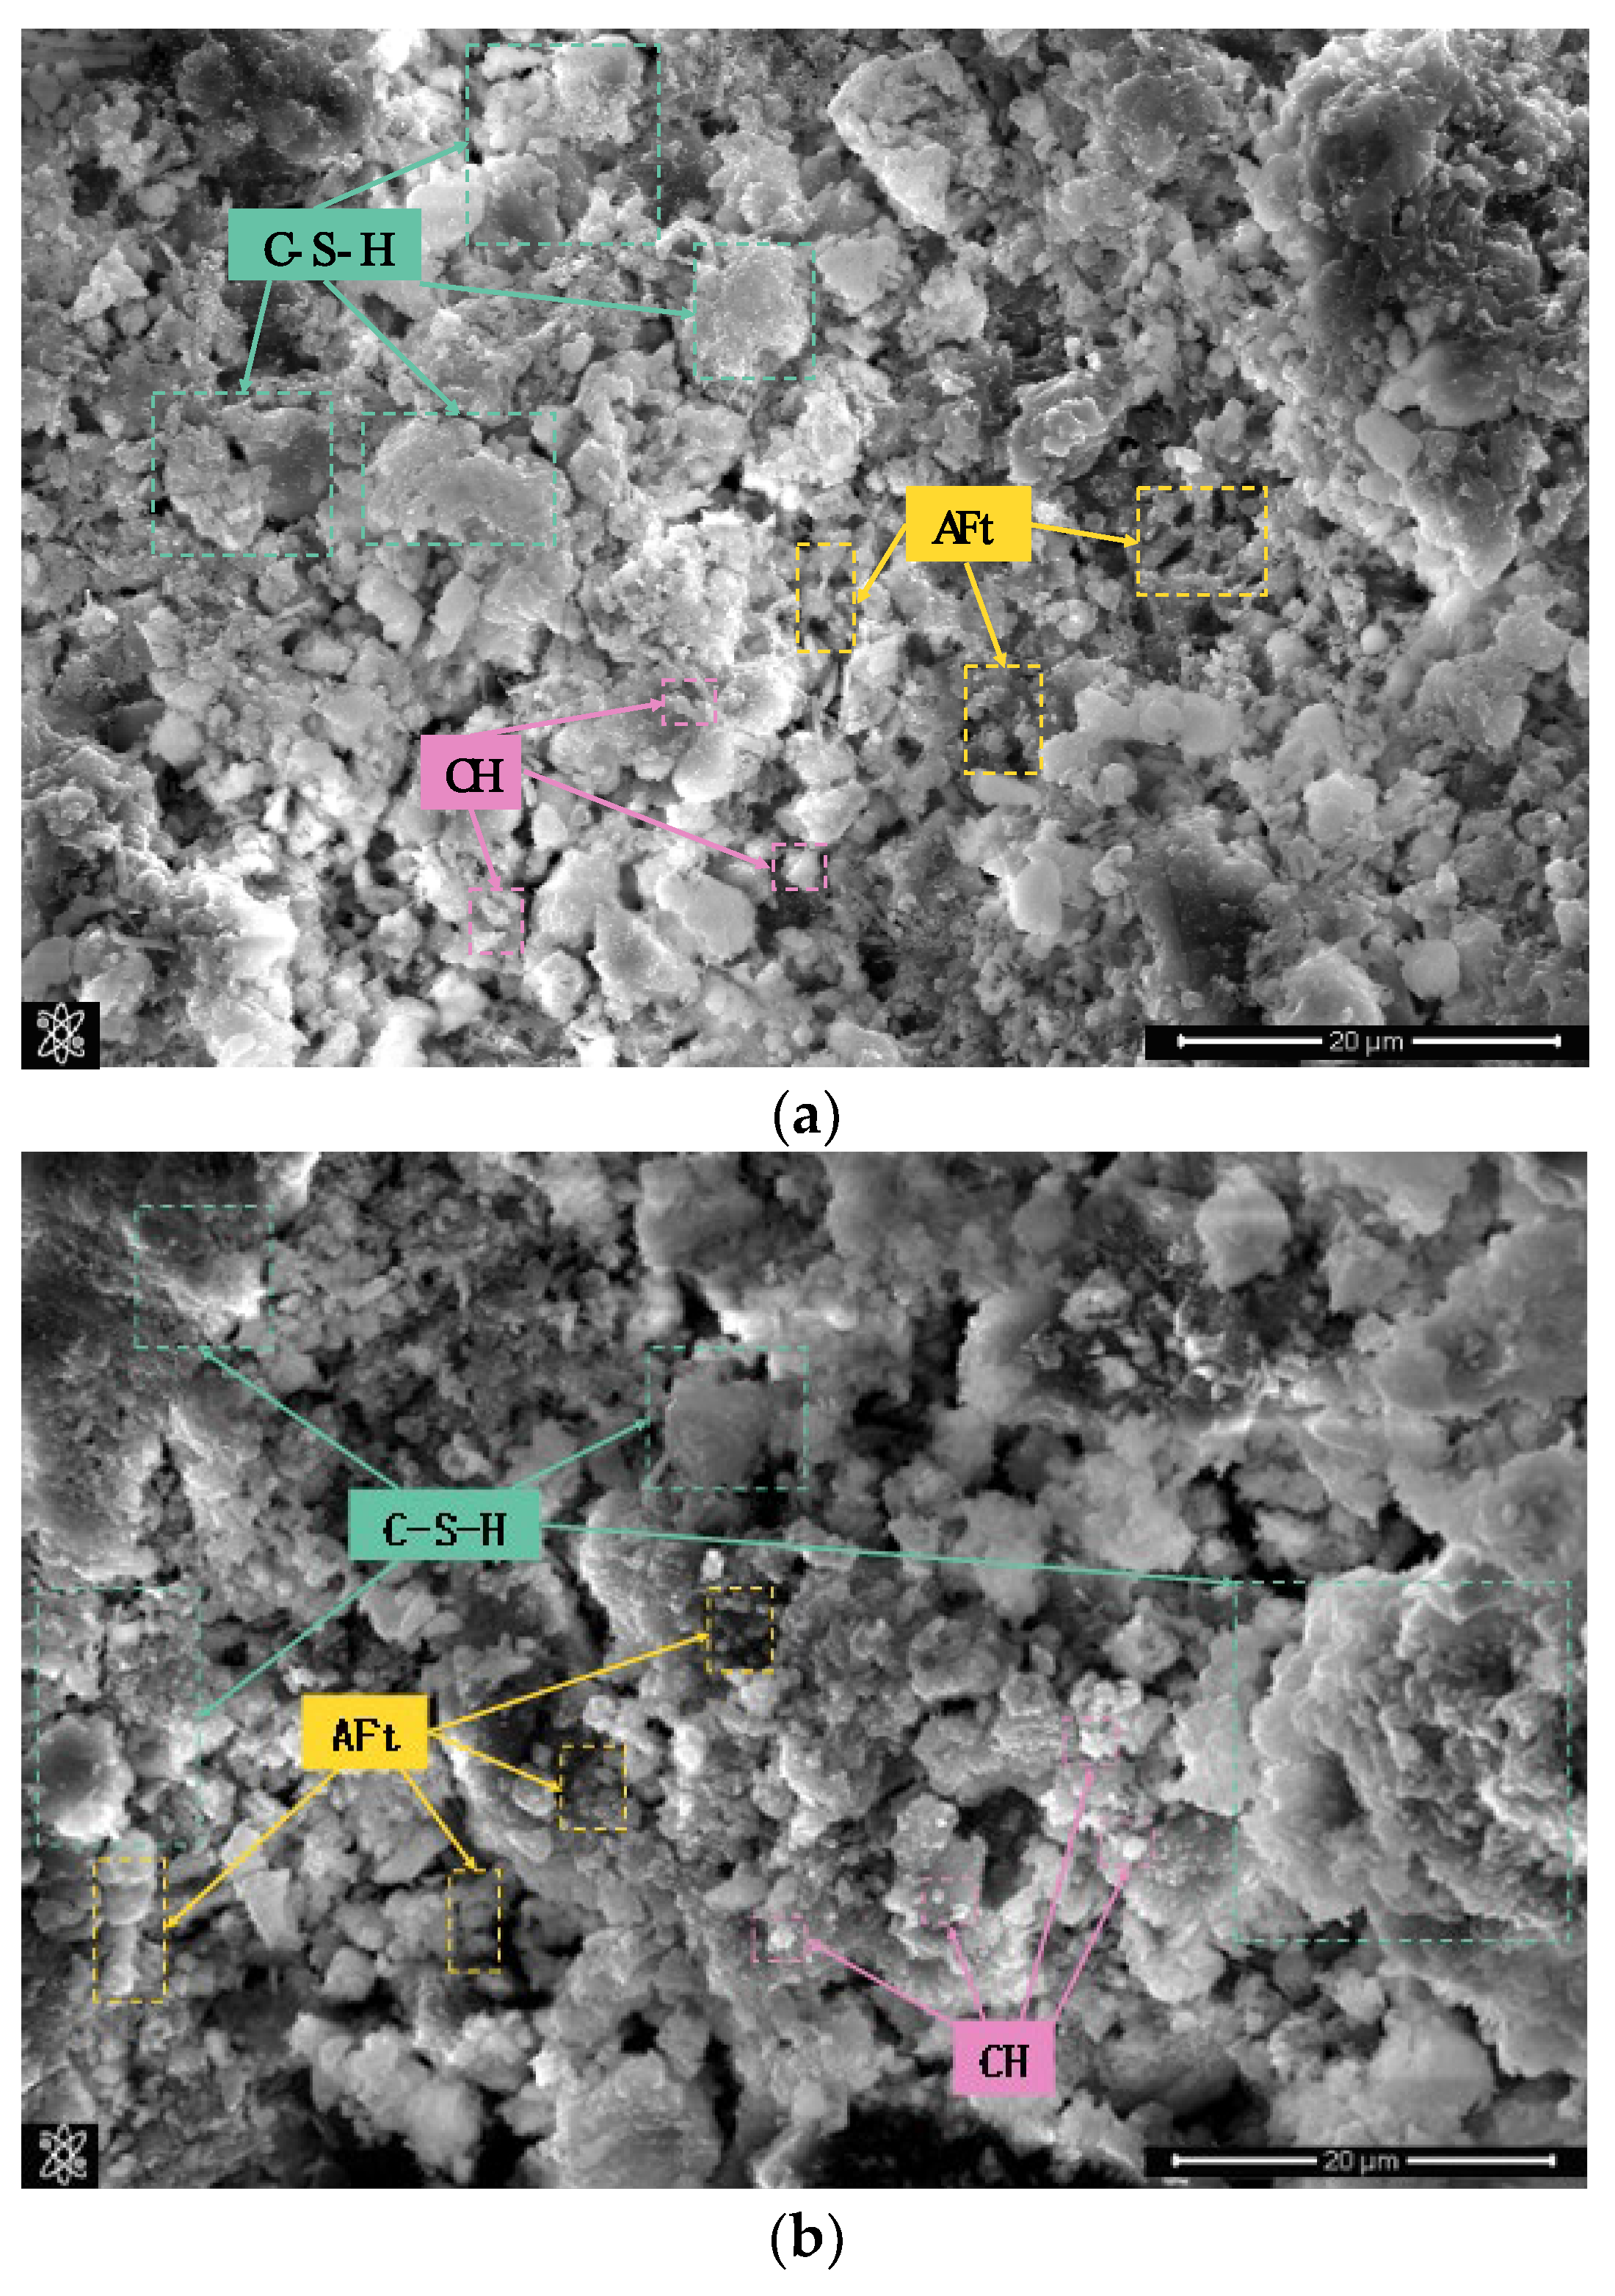
4. Microstructure Analysis Based on Fractal Theory

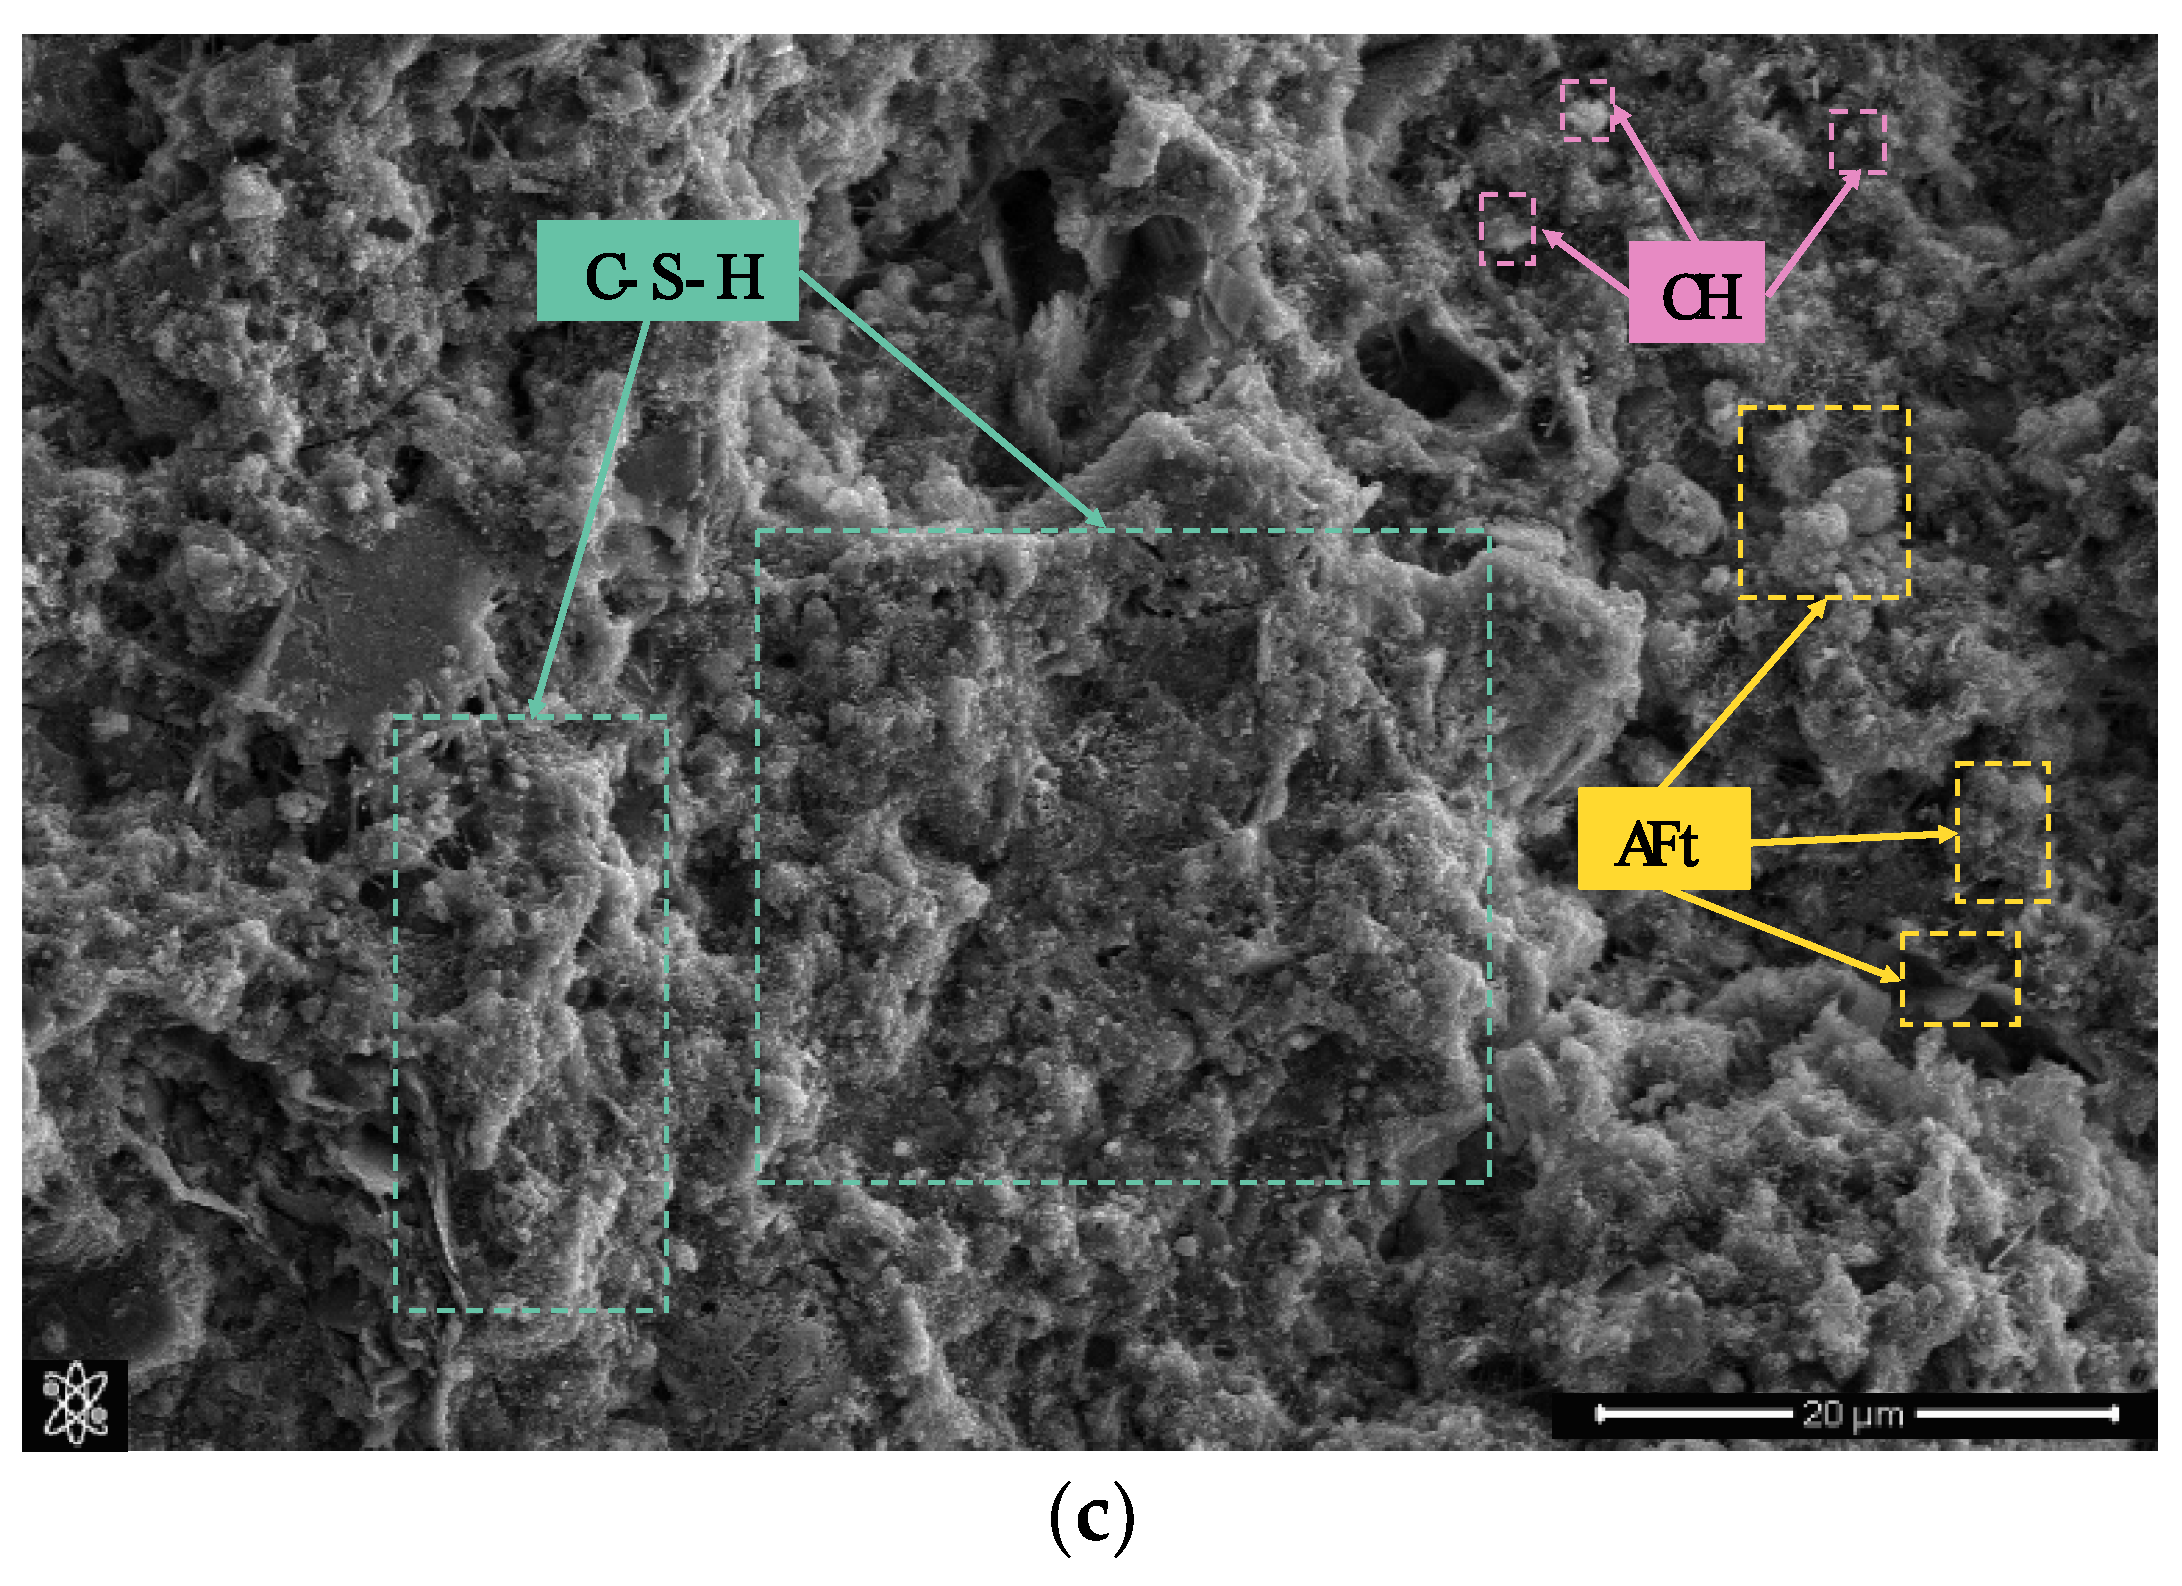
4.1. Surface Microscopic Morphology Changes

Figure 11 shows typical images of SEM microscopic morphology of ordinary concrete, singly blended RFA, and compound-blended recycled aggregate concrete with the optimized mix ratio given in this paper. The large shapes distributed in the figure are hydrated calcium silicate gel (C–S–H), which is the hydration product of the cementation material and the primary source of compressive strength. The short, rod-like material is ettringite (AFt), which is needle-like in early stages and is filled in during hydration to compact the structure. The volume of ettringite expands during the formation process, and the re-formation of ettringite after the completion of matrix curing may lead to matrix cracking. The small hexagonal pieces are calcium hydroxide (CH), which is brittle and unfavorable for strength.
Comparing Figure 11a,b, after incorporating RFA, the matrix structure was loose and porous at 28 d, and the continuity of hydrated calcium silicate gel was poor. There are multiple penetrating cracks between the hydration products. The RFA comes from the waste concrete, which contains C2S with inadequate hydration. Compared with ordinary concrete, the slow hydration of dicalcium silicate continues to hydrate slowly in the later hydration period, and the resulting hydrated calcium silicate gel has a significantly smaller size and irregular shape. It cannot be connected as a whole. Comparing Figure 11a–c, the recycled aggregate concrete matrix after compounding is more uniform, flat, and compact. The pores and cracks of (a) (b) between the matrix of the specimen and the voids between the hydration products are filled to form a complete structure. The filling of voids and cracks is strong evidence of solid growth.

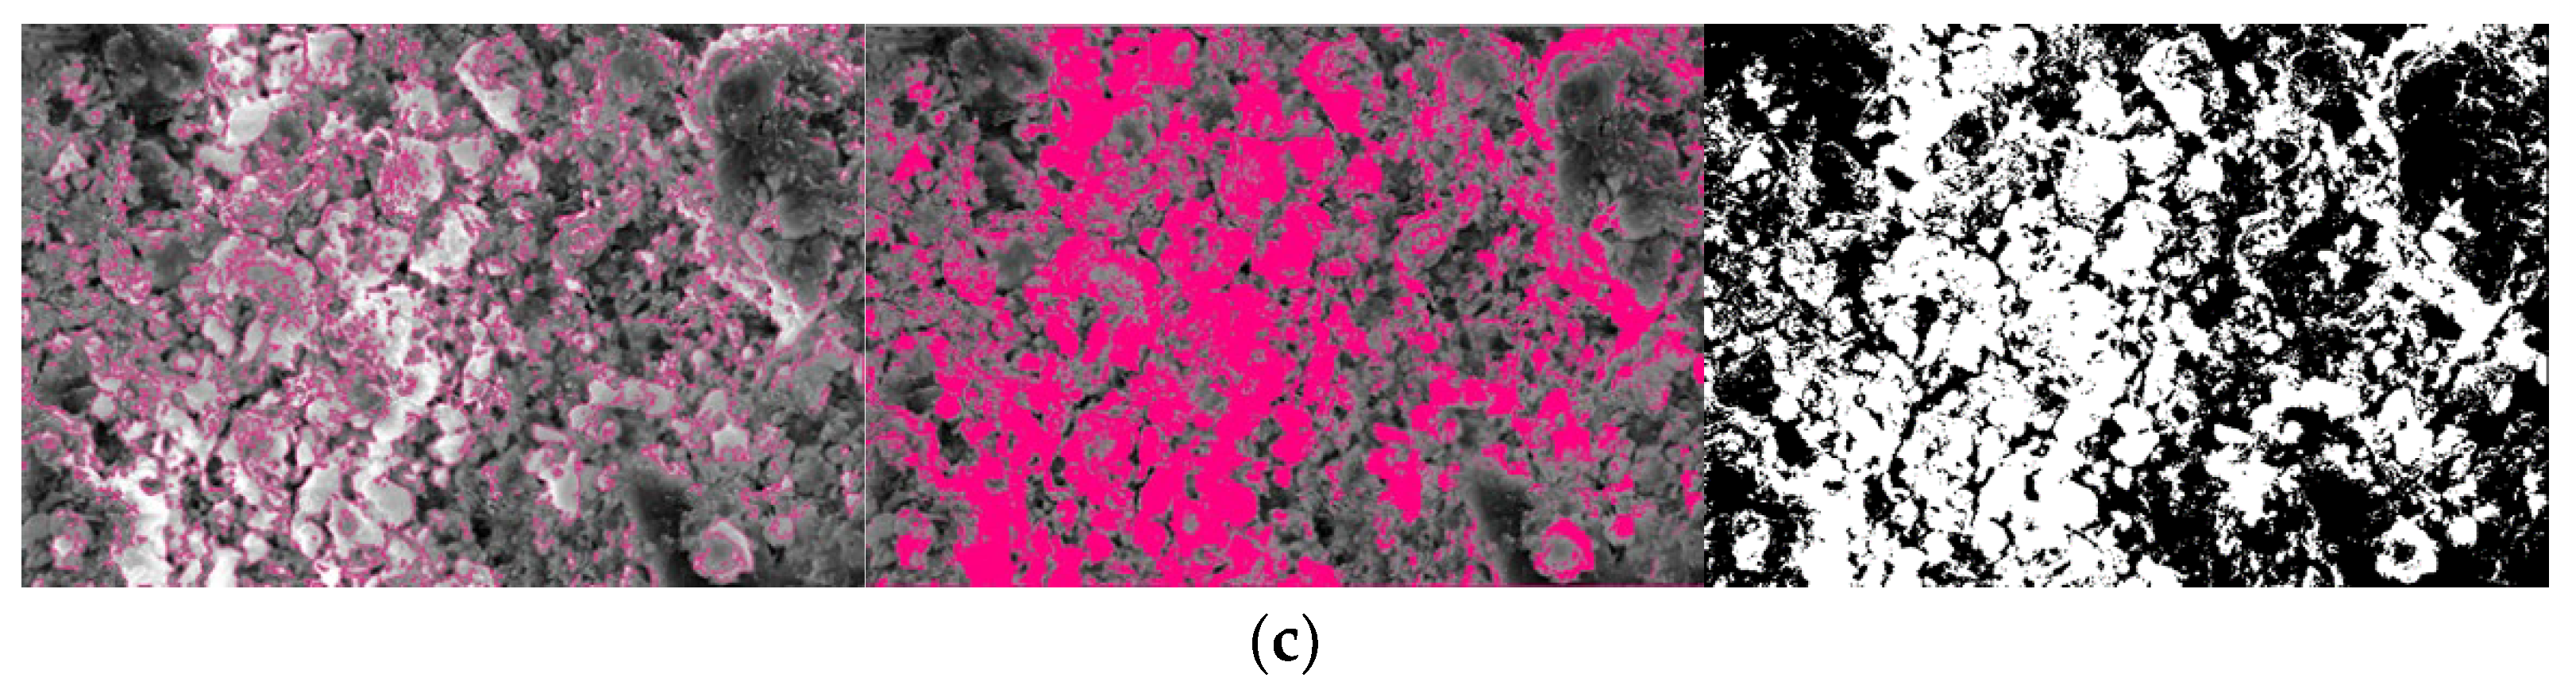
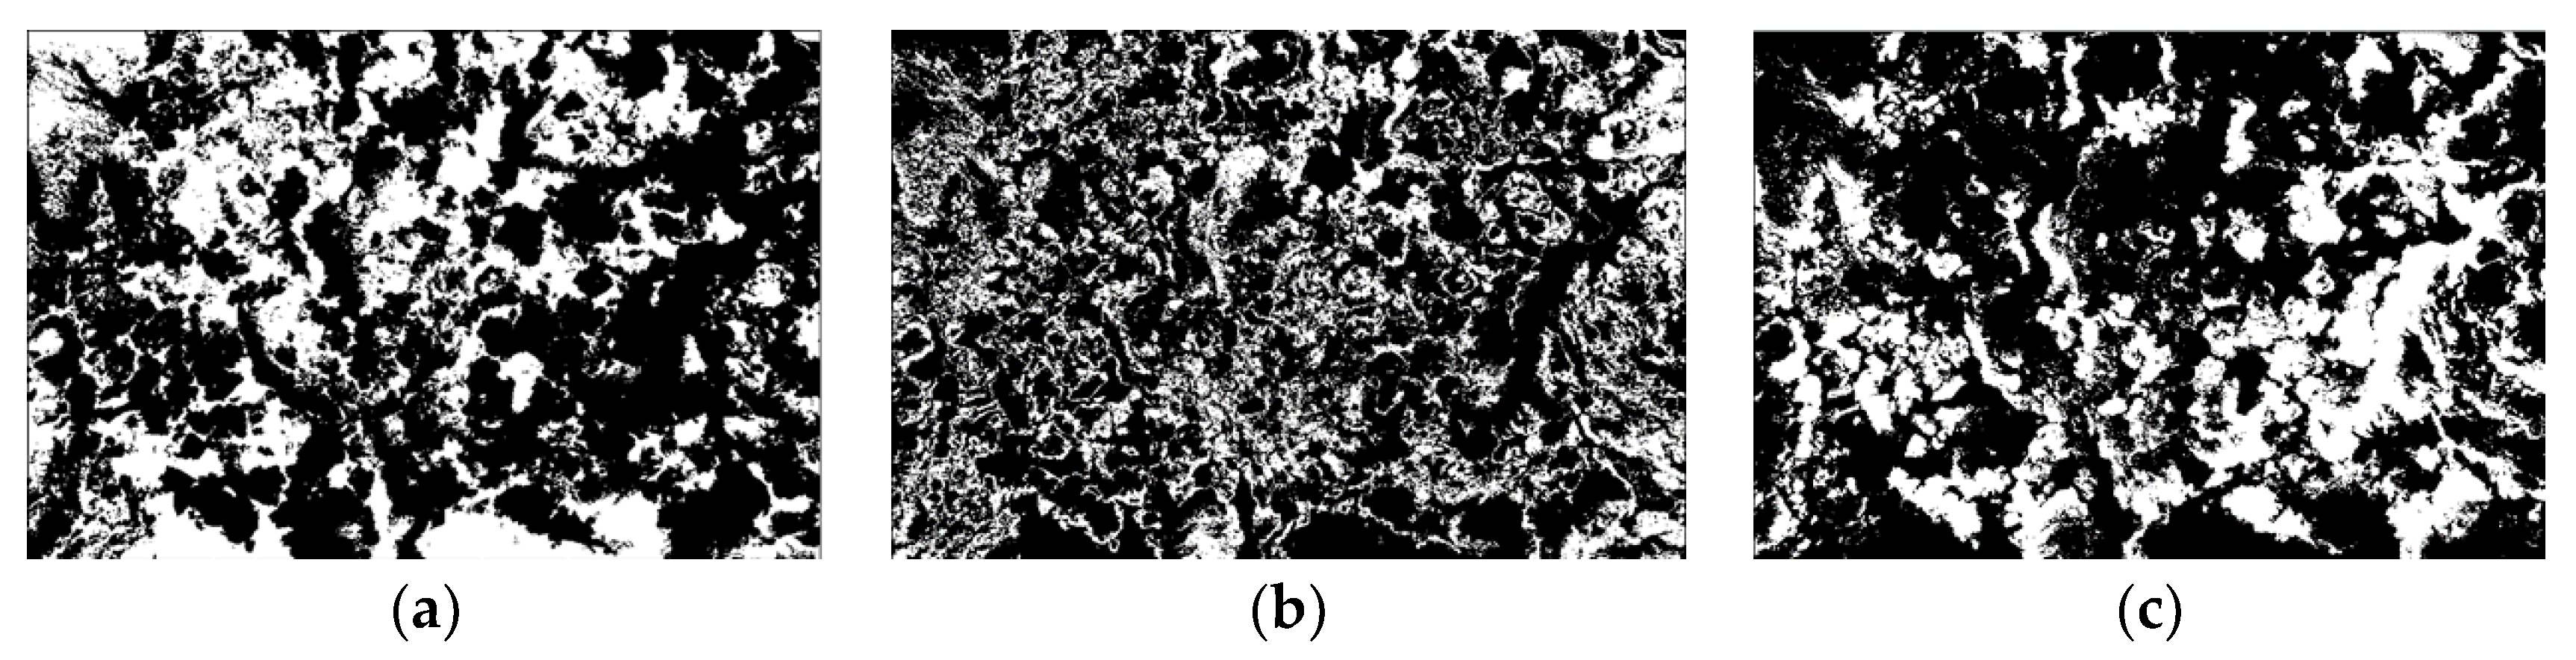
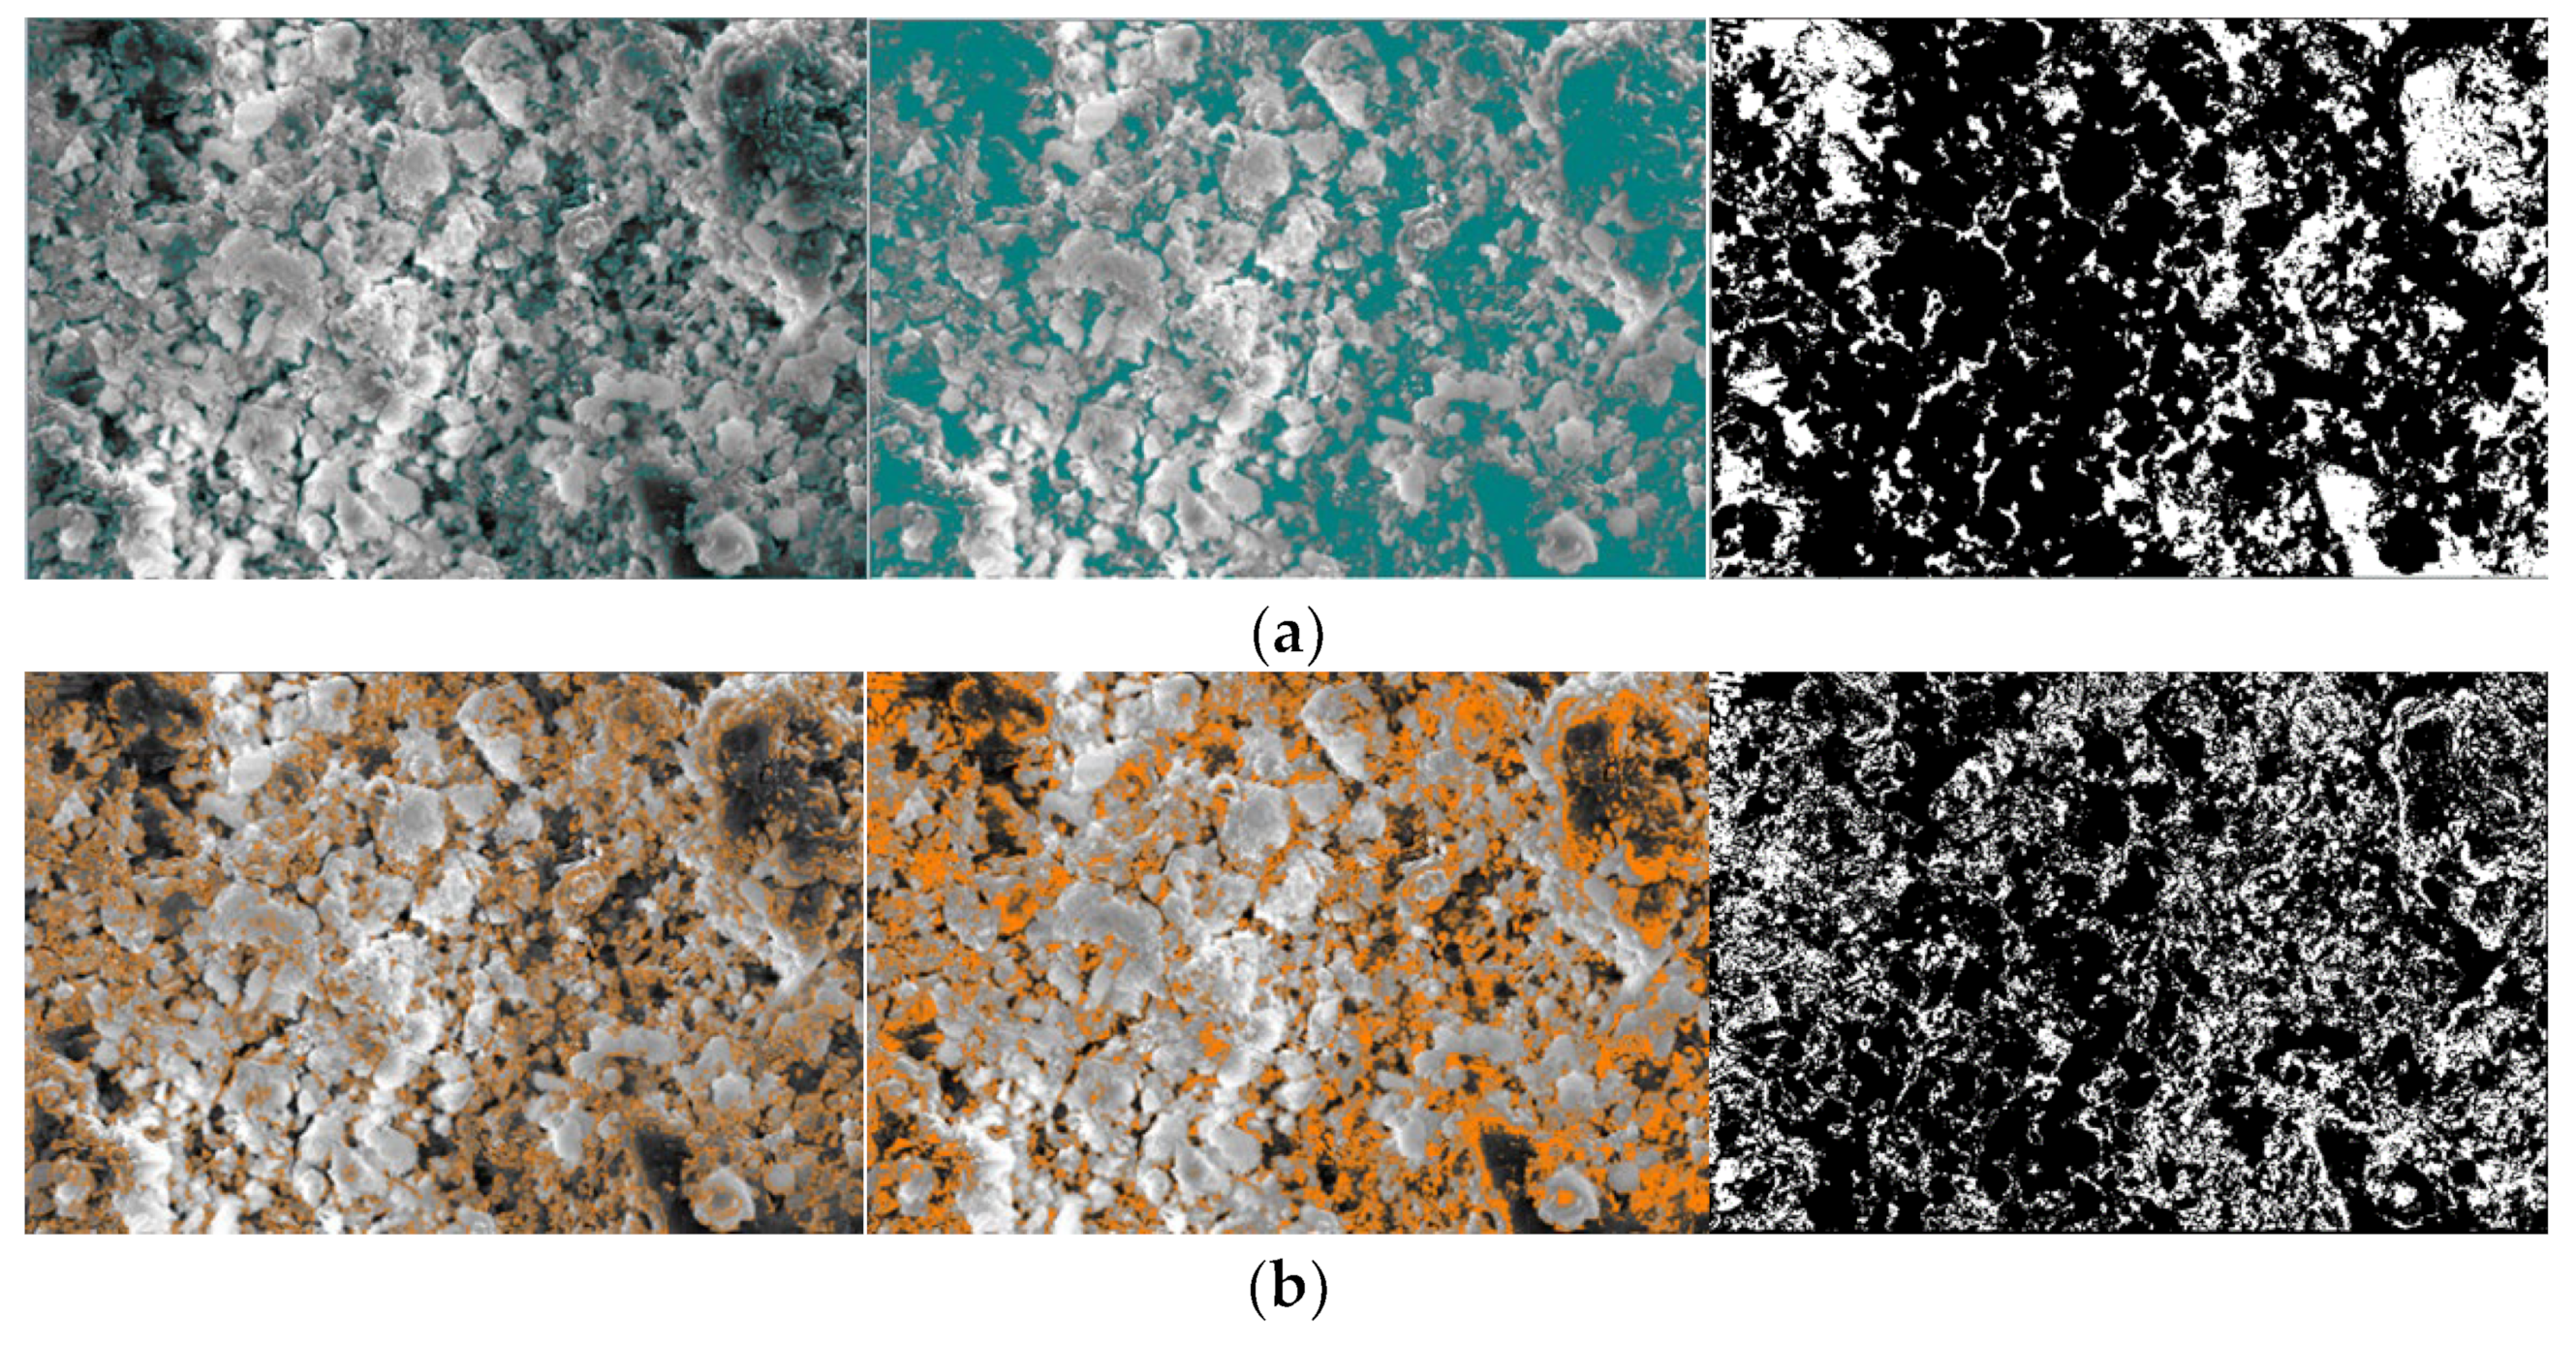
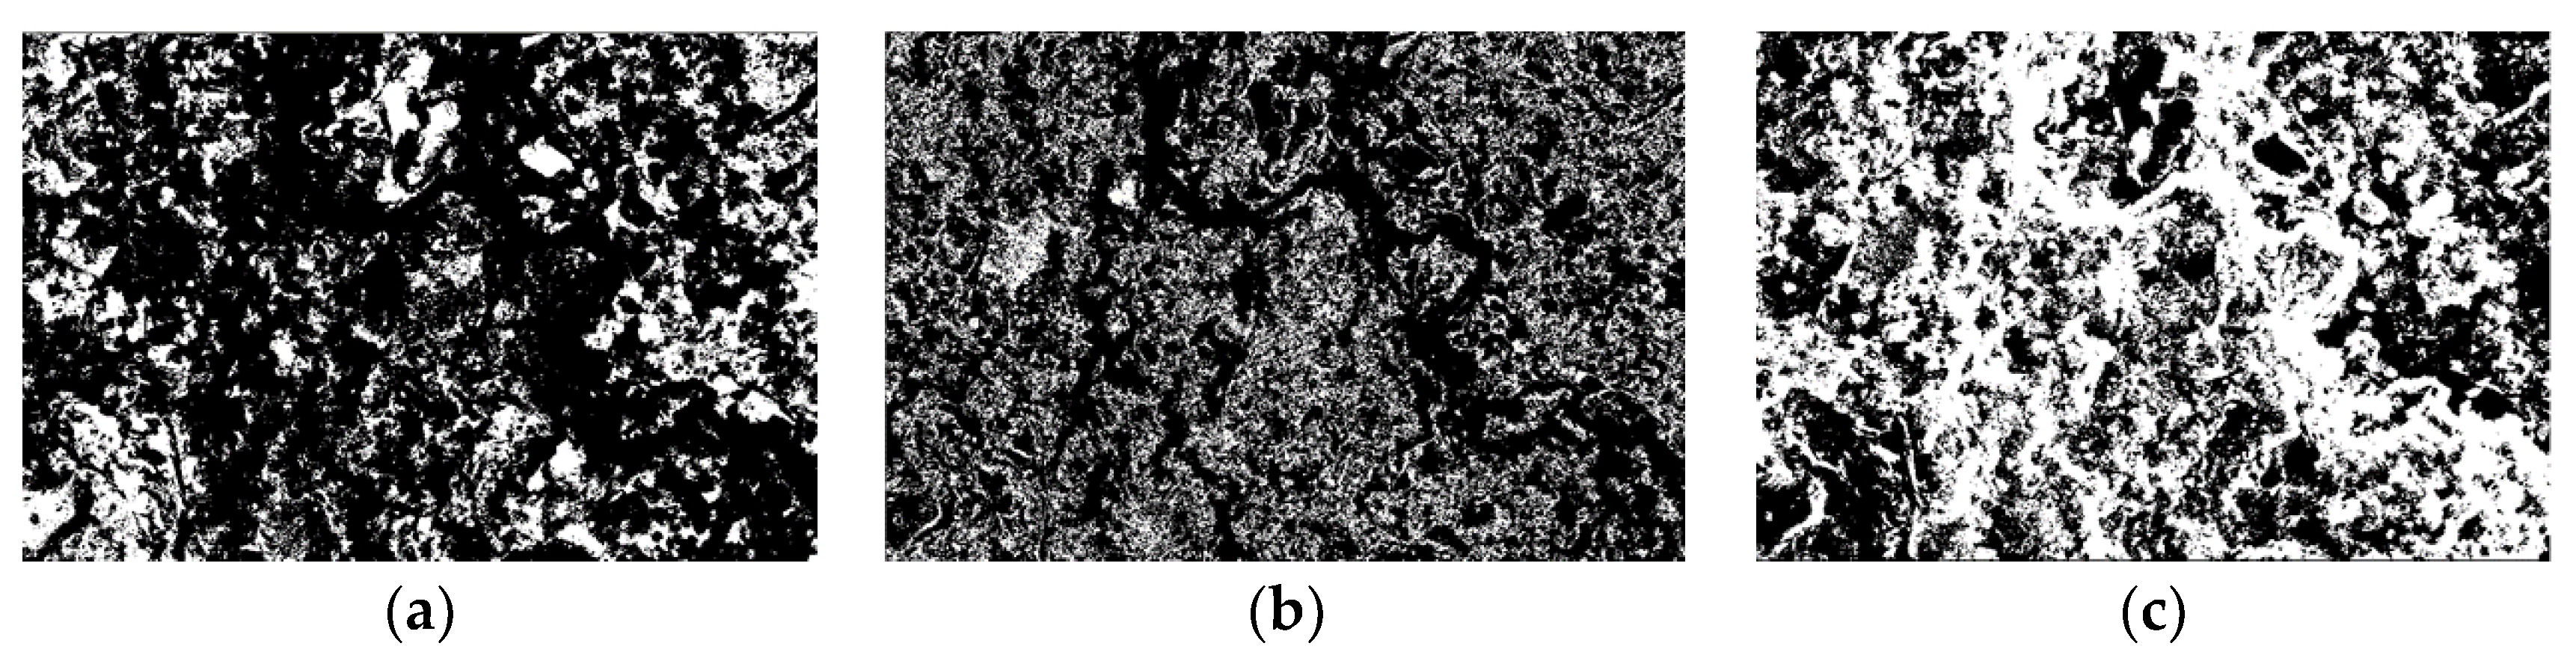
4.2. Grayscale Binarization Analysis

SEM images can clearly show the relationship between hydration products and pores. However, direct roughness analysis through SEM images needs to be more accurate. The microscopic picture of SEM needs to be grayscale binarized first [38]. The treatment results are shown in Figure 12, Figure 13 and Figure 14.
Take Figure 11a as an example to describe the process of picture binarization. At pixel values from 1 to 255, the contrast of the original image is guaranteed, and the image is denoised. The SEM images were divided into three tomographic objects. F1 (Figure 12a) depicts the hydrated calcium silicate gel layer; F2 (Figure 12b) depicts fillers such as unhydrated particles, filled powders, Aft, and CH; and F3 (Figure 12c) shows pores and cracks with depths exceeding the limit. Each tomographic object was manually profiled and filled with color, and the supplied picture was binarized. The processed images are only black and white. Black-and-white images indicate the roughness fluctuation of SEM images. In the figure, black represents the research object of the concrete matrix, and white represents pores or cracks. Binary grayscale pictures of concrete mixed with 33% RFA and concrete mixed with 33% RFA and 15% WCP can be obtained using the same method (Figure 13 and Figure 14).
The statistics of the area of the three layers after binarization are listed in Table 12.
Table 12 shows the following: The minimum monomer areas of ordinary concrete F1, F2, and F3 are all 10. The largest monomer area is the hydration product monomer area, 59,879; the filler F2 monomer area is the smallest, 9506. The most extensive total area is that of the hydration product F3, which is 135,580, the smallest is that of F2, 111,834.
When a single admixture regenerates fine aggregate, the minimum area of the monomer is the largest, 10. The minimum sizes of filler and hydration product are the same, 1. The maximum monomer area was 56,632 (that of the hydration product), and the minimum monomer area was 26,645 (filler). The most extensive total area is of pores, 164,679; and the smallest is of filler, 104,010.
Regarding double blending with RFA and WCP, the minimum monomer area is the same. The largest monomer area was that of the hydration product, 154,697; and the smallest was that of the filler 2355. The maximum total size is 196,621, for hydrate; and the minimum is 61,593, for stuffing.
The product area of the three mixture ratios was comprehensively compared. The maximum total porosity is single-doped, and the minimum is complex-doped. Compound mixing is beneficial in reducing the total porosity of the recycled aggregate concrete matrix.

4.3. Fractal Dimension Calculation

This paper introduces the concept of box number to establish three levels of roughness fractal models for SEM images. A fixed-scale cubic box is chosen, and its side length is set to be ri. The fractal objects are covered with different numbers of packages, and the covering process boxes are not allowed to overlap. This reduces the value of ri as ri approaches 0. The logarithm ratio of the number of parcels required for full coverage of the study subject to the logarithm of the box diameter was defined as the box dimension. Let F be any nonempty bounded subset of the Se space, and for any ri > 0, M r i F denotes the minimum number of cube boxes needed to cover F [39]. There exists k such that
R i 0 ,   M r i F r i k
Then, k is called the box dimension of F. If and only if there exists a positive value j:
lim r i 0 M r i F r i k = j
Taking the logarithm of both sides of the equation,
lim r i 0 lg M r i F + k lg r i = lg j
k = lim r i 0 lg j lg M r i F lg r = lim r i 0 lg M r i F lg r
A logarithmic coordinate system is established with as the horizontal axis and as the vertical axis. The least squares method fit the curve, and the slope D was the fractal dimension. The fractal dimensions of pores, fillers, and hydration gelling substances are shown in Table 13 through the fractal analysis of the grey-scale pictures of the three types of concrete after stratification.
Table 13 shows that the fractal results for pore structure F1 show that NAC and RAC are the same, and the addition of fine aggregate does not significantly affect the pore structure of concrete. However, the fractal dimension of RAPC after double blending is 1.67, which is smaller than that of NAC and RAC, and the WCP plays a physical filling role in the pores. The pore size becomes smaller, improves the pore structure, and positively affects compressive strength.
The fractal results of filler F2 show that the lowest roughness belongs to NAC, and the largest is that of RPC. The filling effect is the best after the composite blending of RFA and regenerated micro-powder, and the singular blending of fine aggregate also plays a particular architectural effect.
The fractal results of hydration gelling product F3 showed that RPC had the highest roughness. The composition analysis of regenerated micro-powder showed that the regenerated micro-powder was mainly derived from old cement paste. Rich in SiO2 and Al2O3, the regenerated micro-powder has a potentially active volcanic effect, and more hydrated calcium silicate gel is produced after secondary hydration. But this effect is similar to that of concrete. The F3 fractal dimension of a singly blended fine aggregate concrete is the smallest, only 1.71. Much smaller than ordinary concrete and WCP concrete. The surface condition of RFA is more complex, with old mortar and loose structures between it and the entirety. Many needles and short-column ettringite fill the hydration products, making the resulting sheet ettringite less continuous. In addition, the incoming mortar with a loose bond affects the hydration of the newly mixed cement. The selection of the interface transition zone is biased to random, so the fractal dimension of the microimage is small. Discontinuous hydration products hurt compressive strength.

5. Conclusions

Results of an experimental study examining the strength of concrete with singular incorporation of recycled fine aggregate and dual incorporation of RFA and WCP are presented. The interactive effects of the amount of WCP, water–cement ratio, and replacement rate of RFA were investigated using the Box–Behnken design method to determine the optimal mix proportion. Microscopic test images were subjected to layered grayscale binarization processing, and fractal analysis of the product morphology was performed at different levels. The following conclusions can be drawn:
(1)
Based on the response surface experimental analysis of compressive strength, it was found that an appropriate amount of WCP is beneficial for improving the short-, middle-, and long-term strength of concrete. The optimal dosage is 15% by mass of the fine aggregate;
(2)
The water–cement ratio has a significant impact on the compressive strength of concrete. According to the experimental process used in this study, the optimal water-cement ratio is 0.43;
(3)
The replacement of 33% of natural aggregate with RFA does not have a significant effect on compressive strength. This can serve as a guideline for the application of RFA as a substitute for natural aggregate;
(4)
Grayscale binarization processing of the concrete matrix revealed that the concrete with singular incorporation of fine aggregate has the largest pore area, while the concrete with dual incorporation of RFA and WCP has the smallest pore area. The fractal dimension of the pores is negatively correlated with compressive strength;
(5)
Fractal analysis of the hydration products at three levels demonstrated a positive correlation between the fractal dimension of the hydrated calcium silicate gel and compressive strength. The layered fractal model shows superiority in evaluating the compressive strength of concrete.

Author Contributions

Conceptualization, J.L. and F.C.; methodology, L.Z. and H.L.; software, Y.T. and F.C.; validation, L.Z., H.L. and J.L.; formal analysis, F.C.; investigation, Y.T.; resources, L.Z.; data curation, L.Z.; writing—original draft preparation, H.L.; writing—review and editing, L.Z.; visualization, L.Z.; supervision, J.L.; project administration, H.L.; funding acquisition, L.Z. All authors have read and agreed to the published version of the manuscript.

Funding

This research was funded by China Postdoctoral Science Foundation, grant number 2019M662437.

Data Availability Statement

Not applicable.

Conflicts of Interest

The authors declare no conflict of interest.

References

  1. Guo, Y.; Liu, Y.; Wang, W.; Zhang, Y.; Wang, Z.; Jiang, L. A study on heat transfer performance of recycled aggregate thermal insulation concrete. J. Build. Eng. 2020, 32, 101797. [Google Scholar] [CrossRef]
  2. Bidabadi, M.S.; Akbari, M.; Panahi, O. Optimum mix design of recycled concrete based on the fresh and hardened properties of concrete. J. Build. Eng. 2020, 32, 101483. [Google Scholar] [CrossRef]
  3. Li, L.; Xuan, D.; Sojobi, A.O.; Liu, S.; Chu, S.H.; Poon, C.S. Development of nano-silica treatment methods to enhance recycled aggregate concrete. Cem. Concr. Compos. 2021, 118, 103963. [Google Scholar] [CrossRef]
  4. Kazmi SM, S.; Munir, M.J.; Wu, Y.F.; Patnaikuni, I.; Zhou, Y.; Xing, F. Axial stress-strain behavior of macro-synthetic fiber reinforced recycled aggregate concrete. Cem. Concr. Compos. 2019, 97, 341–356. [Google Scholar] [CrossRef]
  5. Liang, C.; Ma, H.; Pan, Y.; Ma, Z.; Duan, Z.; He, Z. Chloride permeability and the caused steel corrosion in the concrete with carbonated recycled aggregate. Constr. Build. Mater. 2019, 218, 506–518. [Google Scholar] [CrossRef]
  6. Medjigbodo, S.; Bendimerad, A.Z.; Rozière, E.; Loukili, A. How do recycled concrete aggregates modify the shrinkage and self-healing properties? Cem. Concr. Compos. 2018, 86, 72–86. [Google Scholar] [CrossRef]
  7. Lessly, S.H.; Kumar, S.L.; Jawahar, R.R.; Prabhu, L. Durability properties of modified ultra-high performance concrete with varying cement content and curing regime. Mater. Today Proc. 2021, 45, 6426–6432. [Google Scholar] [CrossRef]
  8. Hu, L.; He, Z.; Shao, Y.; Cai, X.; Zhang, S. Microstructure and properties of sustainable cement-based materials using combustion treated rice husk ash. Constr. Build. Mater. 2021, 294, 123482. [Google Scholar] [CrossRef]
  9. Zhang, L.; Gong, H.; Liu, J.; Li, H. Mechanical properties and chloride penetration resistance of copper slag aggregate concrete. Fractal Fract. 2022, 6, 427. [Google Scholar] [CrossRef]
  10. Kang, S.H.; Hong, S.G.; Moon, J. The use of rice husk ash as reactive filler in ultra-high performance concrete. Cem. Concr. Res. 2019, 115, 389–400. [Google Scholar] [CrossRef]
  11. Safiuddin, M.; West, J.S.; Soudki, K.A. Hardened properties of self-consolidating high performance concrete including rice husk ash. Cem. Concr. Compos. 2010, 32, 708–717. [Google Scholar] [CrossRef]
  12. Akono, A.T.; Zhan, M.; Chen, J.; Shah, S.P. Nanostructure of calcium-silicate-hydrates in fine recycled aggregate concrete. Cem. Concr. Compos. 2021, 115, 103827. [Google Scholar] [CrossRef]
  13. Etxeberria, M.; Gonzalez-Corominas, A. The assessment of ceramic and mixed recycled aggregates for high strength and low shrinkage concretes. Mater. Struct. 2018, 51, 129. [Google Scholar] [CrossRef]
  14. Wang, X.; Zhang, C.; Zhu, H.; Wu, Q. Reaction kinetics and mechanical properties of a mineral-micropowder/metakaolin-based geopolymer. Ceram. Int. 2022, 48, 14173–14181. [Google Scholar] [CrossRef]
  15. Mesgari, S.; Akbarnezhad, A.; Xiao, J.Z. Recycled geopolymer aggregates as coarse aggregates for Portland cement concrete and geopolymer concrete: Effects on mechanical properties. Constr. Build. Mater. 2020, 236, 117571. [Google Scholar] [CrossRef]
  16. Sun, Y.; Li, J.S.; Chen, Z.; Xue, Q.; Sun, Q.; Zhou, Y.; Chen, X.; Liu, L.; Poon, C.S. Production of lightweight aggregate ceramsite from red mud and municipal solid waste incineration bottom ash: Mechanism and optimization. Constr. Build. Mater. 2021, 287, 122993. [Google Scholar] [CrossRef]
  17. Martinez-Echevarria, M.J.; Lopez-Alonso, M.; Garach, L.; Alegre, J.; Poon, C.S.; Agrela, F.; Cabrera, M. Crushing treatment on recycled aggregates to improve their mechanical behaviour for use in unbound road layers. Constr. Build. Mater. 2020, 263, 120517. [Google Scholar] [CrossRef]
  18. Awoyera, P.O.; Okoro, U.C. Filler-ability of highly active metakaolin for improving morphology and strength characteristics of recycled aggregate concrete. Silicon 2019, 11, 1971–1978. [Google Scholar] [CrossRef]
  19. Xu, Y.; Chen, W.; Jin, R.; Shen, J.; Smallbone, K.; Yan, C.; Hu, L. Experimental investigation of photocatalytic effects of concrete in air purification adopting entire concrete waste reuse model. J. Hazard. Mater. 2018, 353, 421–430. [Google Scholar] [CrossRef]
  20. Xu, G.; Shen, W.; Zhang, B.; Li, Y.; Ji, X.; Ye, Y. Properties of recycled aggregate concrete prepared with scattering-filling coarse aggregate process. Cem. Concr. Compos. 2018, 93, 19–29. [Google Scholar] [CrossRef]
  21. Kim, J.; Sadowski, Ł. Properties of recycled aggregate concrete designed with equivalent mortar volume method. Struct. Integr. Recycl. Aggreg. Concr. Prod. Fill. Pozzolans 2022, 301, 365–381. [Google Scholar]
  22. Kumar, R. Effects of high volume dolomite sludge on the properties of eco-efficient lightweight concrete: Microstructure, statistical modeling, multi-attribute optimization through Derringer’s desirability function, and life cycle assessment. J. Clean. Prod. 2021, 307, 127107. [Google Scholar] [CrossRef]
  23. Sharaky, I.A.; Ghoneim, S.S.; Aziz BH, A.; Emara, M. Experimental and theoretical study on the compressive strength of the high strength concrete incorporating steel fiber and metakaolin. Structures 2021, 31, 57–67. [Google Scholar] [CrossRef]
  24. Shaheen, N.; Rizwan, S.A.; Khushnood, R.A.; Bier, T.A. Mechanical and energy performance of variably cured effective microorganisms cementitious composite designed via Taguchi. J. Clean. Prod. 2021, 310, 127350. [Google Scholar] [CrossRef]
  25. Zhang, Q.; Feng, X.; Chen, X.; Lu, K. Mix design for recycled aggregate pervious concrete based on response surface methodology. Constr. Build. Mater. 2020, 259, 119776. [Google Scholar] [CrossRef]
  26. GB175-2007; General Purpose Portland Cement. State Bureau of Technical Supervision: Beijing, China, 2006. (In Chinese)
  27. GB/T 14685-2011; Pebbie and Crushed Stone for Building. State Quality of the People’s Republic of China General Administration of Quantity Supervision, Inspection and Quarantine: Beijing, China, 2011. (In Chinese)
  28. JGJ 52-2006; Quality and Test Method Standard of Ordinary Concrete’s and Gazvel. China Architecture and Building Press: Beijing, China, 2006. (In Chinese)
  29. JGJ 63-2006; Standard of Water for Concrete. Ministry of Construction, PRC: Beijing, China, 2006. (In Chinese)
  30. Alkhaly, Y.R.; Hasan, M. Characteristics of reactive powder concrete comprising synthesized rice husk ash and quartzite powder. J. Clean. Prod. 2022, 375, 134154. [Google Scholar] [CrossRef]
  31. JGJ 55-2011; Specification for Mix Proportion Design of Ordinary Concrete. China Building Industry Press: Beijing, China, 2011. (In Chinese)
  32. Marzouki, M.; Samet, B.; Tounsi, H. Application of Plackett–Burman and Box-Behnken designs for the optimization of Tunisian dam sediment-based geopolymers. J. Build. Eng. 2022, 50, 104162. [Google Scholar] [CrossRef]
  33. GB/T 50081-2002; Standard for Test Method of Mechanical Properties on Ordinary Concrete. China Architecture & Building Press: Beijing, China, 2003. (In Chinese)
  34. He, Z.H.; Zhan, P.M.; Du, S.G.; Liu, B.J.; Yuan, W.B. Creep behavior of concrete containing glass powder. Compos. Part B Eng. 2019, 166, 13–20. [Google Scholar] [CrossRef]
  35. Kim, Y.J. Quality properties of self-consolidating concrete mixed with waste concrete powder. Constr. Build. Mater. 2017, 135, 177–185. [Google Scholar] [CrossRef]
  36. Rasheed, M.F.; Rahim, A.; Irfan-ul-Hassan, M.; Ali, B.; Ali, N. Sulfur concrete made with waste marble and slag powders: 100% recycled and waterless concrete. Environ. Sci. Pollut. Res. 2022, 29, 65655–65669. [Google Scholar] [CrossRef]
  37. Zheng, C.; Lou, C.; Du, G.; Li, X.; Liu, Z.; Li, L. Mechanical properties of recycled concrete with demolished waste concrete aggregate and clay brick aggregate. Results Phys. 2018, 9, 1317–1322. [Google Scholar] [CrossRef]
  38. Zhang, L.; Dang, F.; Ding, W.; Zhu, L. Quantitative study of meso-damage process on concrete by CT technology and improved differential box counting method. Measurement 2020, 160, 107832. [Google Scholar] [CrossRef]
  39. Yang, X.; Wang, M. Fractal dimension analysis of aggregate packing process: A numerical case study on concrete simulation. Constr. Build. Mater. 2021, 270, 121376. [Google Scholar] [CrossRef]
Figure 1. Comparison of the particle size distributions of aggregate. (a) Fine aggregate. (b) Coarse aggregate.
Fractalfract 07 00648 g001
Figure 2. Morphology of regenerated micro-powder.
Fractalfract 07 00648 g002
Figure 3. Factor BBD encoding factor levels.
Fractalfract 07 00648 g003
Figure 4. The results of compressive strength tests.
Fractalfract 07 00648 g004
Figure 5. Pictures of compressive strength tests.
Fractalfract 07 00648 g005
Figure 6. SEM test picture.
Fractalfract 07 00648 g006
Figure 7. Residual plots for compressive strength. (a) Normal plot of residuals (3 d). (b) Distribution of residuals (3 d). (c) Normal Plot of residuals (28 d). (d) Distribution of residuals (28 d). (e) Normal plot of residuals (90 d). (f) Distribution of residuals (90 d).
Fractalfract 07 00648 g007
Figure 8. Compressive strength response surface at 3 d.
Fractalfract 07 00648 g008
Figure 9. Response surface of compressive strength at 28 d.
Fractalfract 07 00648 g009
Figure 10. Response surface of 90 d compressive strength.
Fractalfract 07 00648 g010
Figure 11. SEM morphology of concrete. (a) Ordinary concrete (unfavourable). (b) 33% RFA. (c) Compounded with 33% RFA and 15% WCP.
Fractalfract 07 00648 g011aFractalfract 07 00648 g011b
Figure 12. Hierarchical binarization picture of ordinary concrete. (a) F1. (b) F2. (c) F3.
Fractalfract 07 00648 g012aFractalfract 07 00648 g012b
Figure 13. Layered binarization picture of single-doped 33% RFA concrete. (a) F1. (b) F2. (c) F3.
Fractalfract 07 00648 g013
Figure 14. Layered binarization picture of concrete mixed with 33% RFA and 15% WCP. (a) F1. (b) F2. (c) F3.
Fractalfract 07 00648 g014
Table 1. Basic properties of aggregate.
TypePerformance
Density
(kg/m3)
Loose Packing
Density
(kg/m3)
Crushing
Value Index
(%)
Princess
(%)
Water Absorption Rate
at 24 h
(%)
Moisture
Content
(%)
NCA2670156618.2181.11
NFA2530150613.771.41.77
RFA2330128027515.45.8
Table 2. Performance index of water-reducing agent.
Water-Reducing Rate (%)Air Content (%)pH LevelDensity (kg/m3)Water-Reducing Rate (%)
302.47.9105324
Table 3. X-ray spectrum analysis table of WCP (%).
ElementCaOSiO2Fe2O3Al2O3MgO Na2OK2OP2O5TiO2ZrO2LOI
Content43.7326.558.1913.184.990.752.210.050.030.030.29
Table 4. Table of BBD factor levels.
NumberVariable FactorsLevel
APercentage of WCP (%)51015
BWater–cement ratio0.350.40.45
CAggregate substitution rate (%)103050
Table 5. Fit ratio of BBD scheme design and compressive strength test results (kg/m3).
NumberCementDesigned WaterNCANFARFAAdditional WaterWCPWater Reducer
1406142.11290486.5208.513.8134.754.87
2406142.11290486.5208.513.81104.254.87
3406182.71290486.5208.513.8134.754.87
4406182.71290486.5208.513.81104.254.87
5406162.41290625.569.54.6034.754.87
6406162.41290625.569.54.60104.254.87
7406162.41290347.5347.523.0134.754.87
8406162.41290347.5347.523.01104.254.87
9406142.11290625.569.54.6069.54.87
10406182.71290625.569.54.6069.54.87
11406142.11290347.5347.523.0169.54.87
12406182.71290347.5347.523.0169.54.87
13406162.41290486.5208.513.8169.54.87
14406162.41290486.5208.513.8169.54.87
15406162.41290486.5208.513.8169.54.87
16406162.41290486.5208.513.8169.54.87
17406162.41290486.5208.513.8169.54.87
Table 6. Prediction model of compressive strength.
Time/dPrediction Model
3Y3d = 28.19619 + 0.0714 × A − 76.24 × B + 0.295325 × 30 + 0.26 × A × B − 0.002525 × A × 30 − 0.355 × B × 30 − 0.00027 × A2 + 88.3 × B2 − 0.001879 × 302
Y3d = 28.19619 + 0.0714 × A − 76.24 × 0.4 + 0.295325 × C + 0.26 × A × 0.4 − 0.002525 × A × C − 0.355 × 0.4 × C − 0.00027 × A2 + 88.3 × 0.42 − 0.001879 × C2
Y3d = 28.19619 + 0.0714 × 10 − 76.24 × B + 0.295325 × C + 0.26 × 10 × B − 0.002525 × 10 × C − 0.355 × B × C − 0.00027 × 10² + 88.3 × B2 − 0.001879 × C2
28Y28d = −38.22625 + 0.537 × A + 356.8 × B + 0.34725 × 30 − 2.4 × A × B + 0.00425 × A × 30 − 0.325 × B × 30 + 0.0304 × A2 − 396 × B2 − 0.004163 × 302
Y28d = −38.22625 + 0.537 × A + 356.8 × 0.4 + 0.34725 × C − 2.4 × A × 0.4 + 0.00425 × A × C − 0.325 × 0.4 × C + 0.0304 × A2 − 396 × 0.42 − 0.004163 × C2
Y28d = −38.22625 + 0.537 × 10 + 356.8 × B + 0.34725 × C − 2.4 × 10 × B + 0.00425 × 10 × C − 0.325 × B × C + 0.0304 × 10² − 396 × B2 − 0.004163 × C2
90Y90d = −100.97306 + 1.00685 × A + 663.865 × B + 0.643613 × 30 − 0.73 × A × B + 0.00435 × A × 30 − 0.66 × B × 30 − 0.02223 × A2 − 790.3 × B2 − 0.006933 × 302
Y90d = −100.97306 + 1.00685 × A + 663.865 × 0.4 + 0.643613 × C − 0.73 × A × 0.4 + 0.00435 × A × C − 0.66 × 0.4 × C − 0.02223 × A2 − 790.3 × 0.42 − 0.006933 × C2
Y90d = −100.97306 + 1.00685 × 10 + 663.865 × B + 0.643613 × C − 0.73 × 10 × B + 0.00435 × 10 × C − 0.66 × B × C − 0.02223 × 10² − 790.3 × B2 − 0.006933 × C2
Table 7. Model validation analysis table.
SourceC.V.%F-Valuep-ValueSignificanceAdjusted R²Predicted R²Adeq Precision
3 d1.8912.470.0016significant0.94130.86580.856513.8164
28 d0.79239.47<0.0001significant0.98070.95580.905719.5297
90 d0.809368.75<0.0001significant0.98880.97440.938019.8009
Table 8. Analysis of variance of regression models for 3 d compressive strength.
SourceSum of SquaresDegrees of FreedomMean SquareF-Valuep-Value
A1.7811.7820.880.0026
B3.7313.7343.790.0003
C0.7510.758.820.0208
AB0.0110.010.190.6693
AC0.2510.253.000.1270
BC0.5010.505.920.0452
Table 9. Analysis of variance of regression models for compressive strength at 28 d.
SourceSum of SquaresDegrees of FreedomMean SquareF-Valuep-Value
A19.53119.53167.65<0.0001
B0.7810.786.710.0360
C0.3210.322.750.1414
AB1.4411.4412.360.0098
AC0.7210.726.200.0416
BC0.4210.423.630.0986
Table 10. Analysis of variance of regression models for compressive strength at 90 d.
SourceSum of SquaresDegrees of FreedomMean SquareF-Valuep-Value
A32.12132.12221.91<0.0001
B–B0.4010.402.830.1364
C–C0.1610.161.120.3246
AB0.1310.130.920.3693
AC0.7510.755.230.0561
BC1.7411.7412.040.0104
Table 11. BBD optimized mix ratio.
Test NumberCement (kg/m3)Designed WaterNCANFARFAAdditional WaterWCPWater Reducer
1406172.961290465.65229.3515.19104.254.87
Table 12. Statistical table of area of each layer of binarized picture.
CategoryNACRACRAPC
LevelF1F2F3F1F2F3F1F2F3
Min1010101011111
Max13,456950659,87928,808664556,63267002355154,697
Range13,446949659,86928,798664456,63166992354154,696
Mean21411728350211128314330428
Sum116,662111,834135,580164,679104,010131,062108,89461,593196,621
Table 13. Fractal dimensions.
CategoryNACRACRAPC
LevelF1F2F3F1F2F3F1F2F3
Fractal dimension1.711.731.811.711.751.711.671.761.83
Disclaimer/Publisher’s Note: The statements, opinions and data contained in all publications are solely those of the individual author(s) and contributor(s) and not of MDPI and/or the editor(s). MDPI and/or the editor(s) disclaim responsibility for any injury to people or property resulting from any ideas, methods, instructions or products referred to in the content.

