
Hydration and Fractal Analysis on Low-Heat Portland Cement Pastes Using Thermodynamics-Based Methods


 ,
, 
Abstract
1. Introduction
2. Methods and Algorithms
2.1. Simulation Method
2.2. Fractal Analysis of Pore Structure in LHP Cement Paste
2.3. Tortuosity Analysis of Pore Structure in LHP Cement Paste
3. Results and Analysis
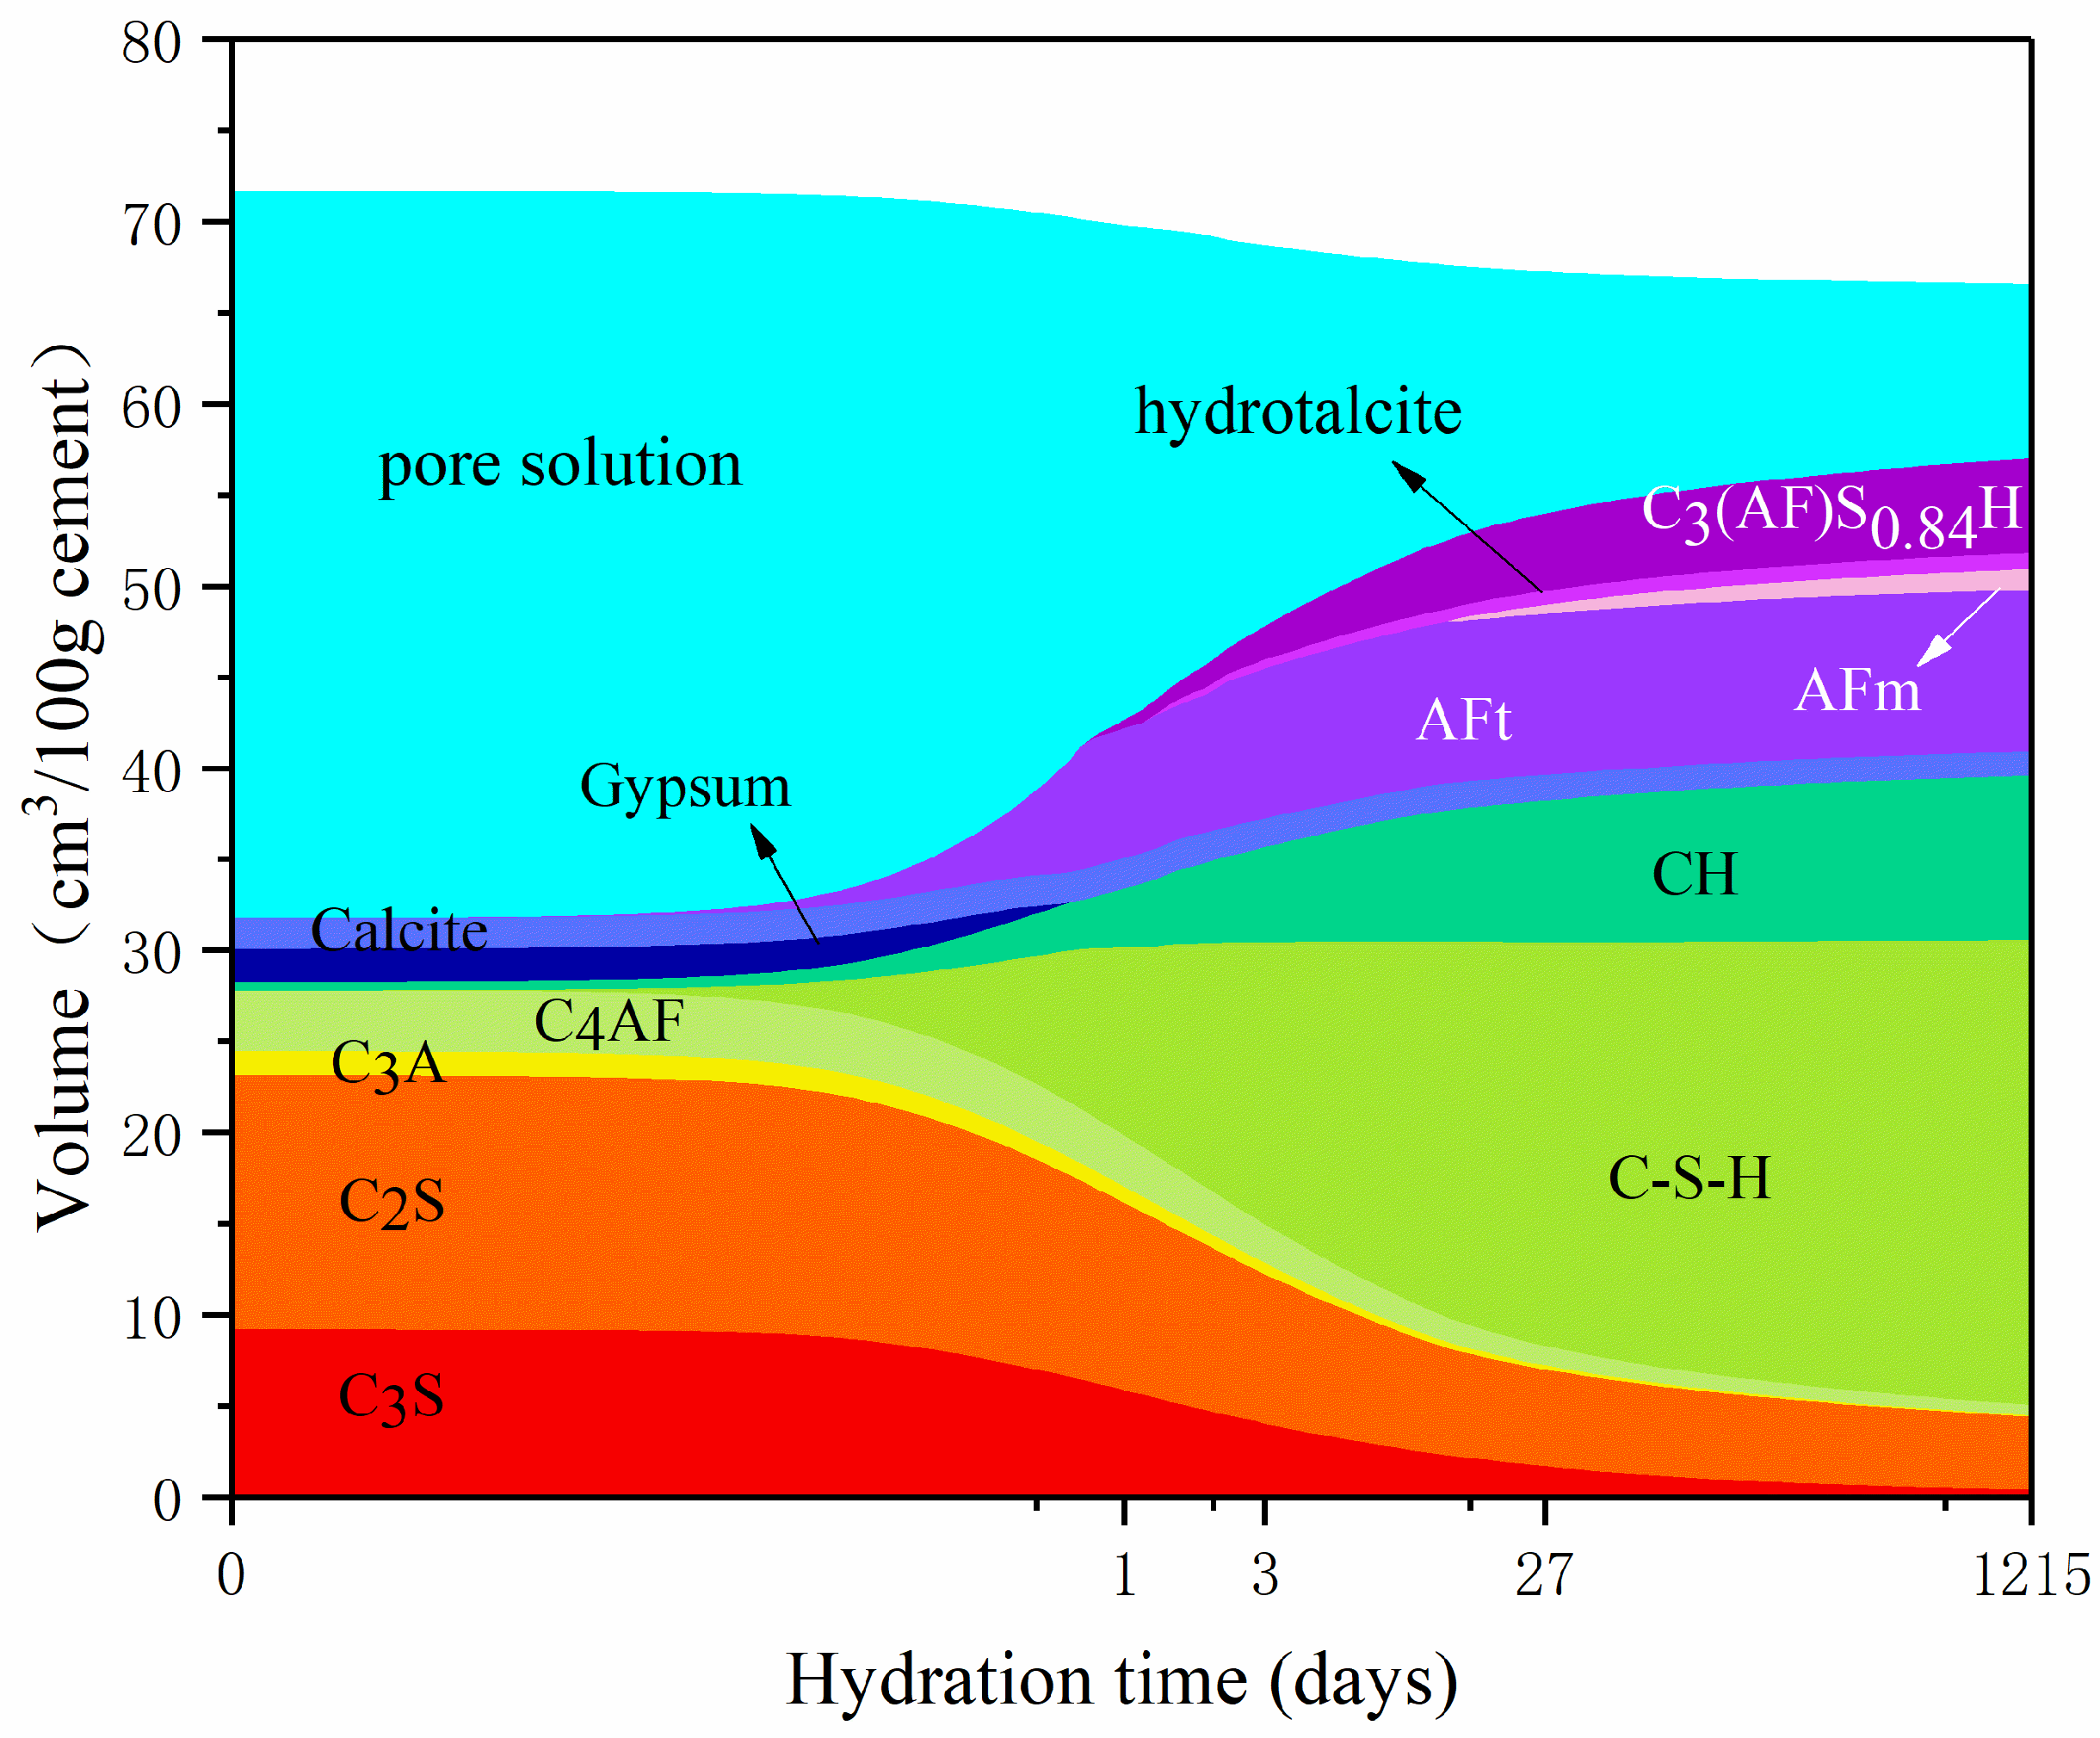
3.1. Influence of Temperature on Hydration Products
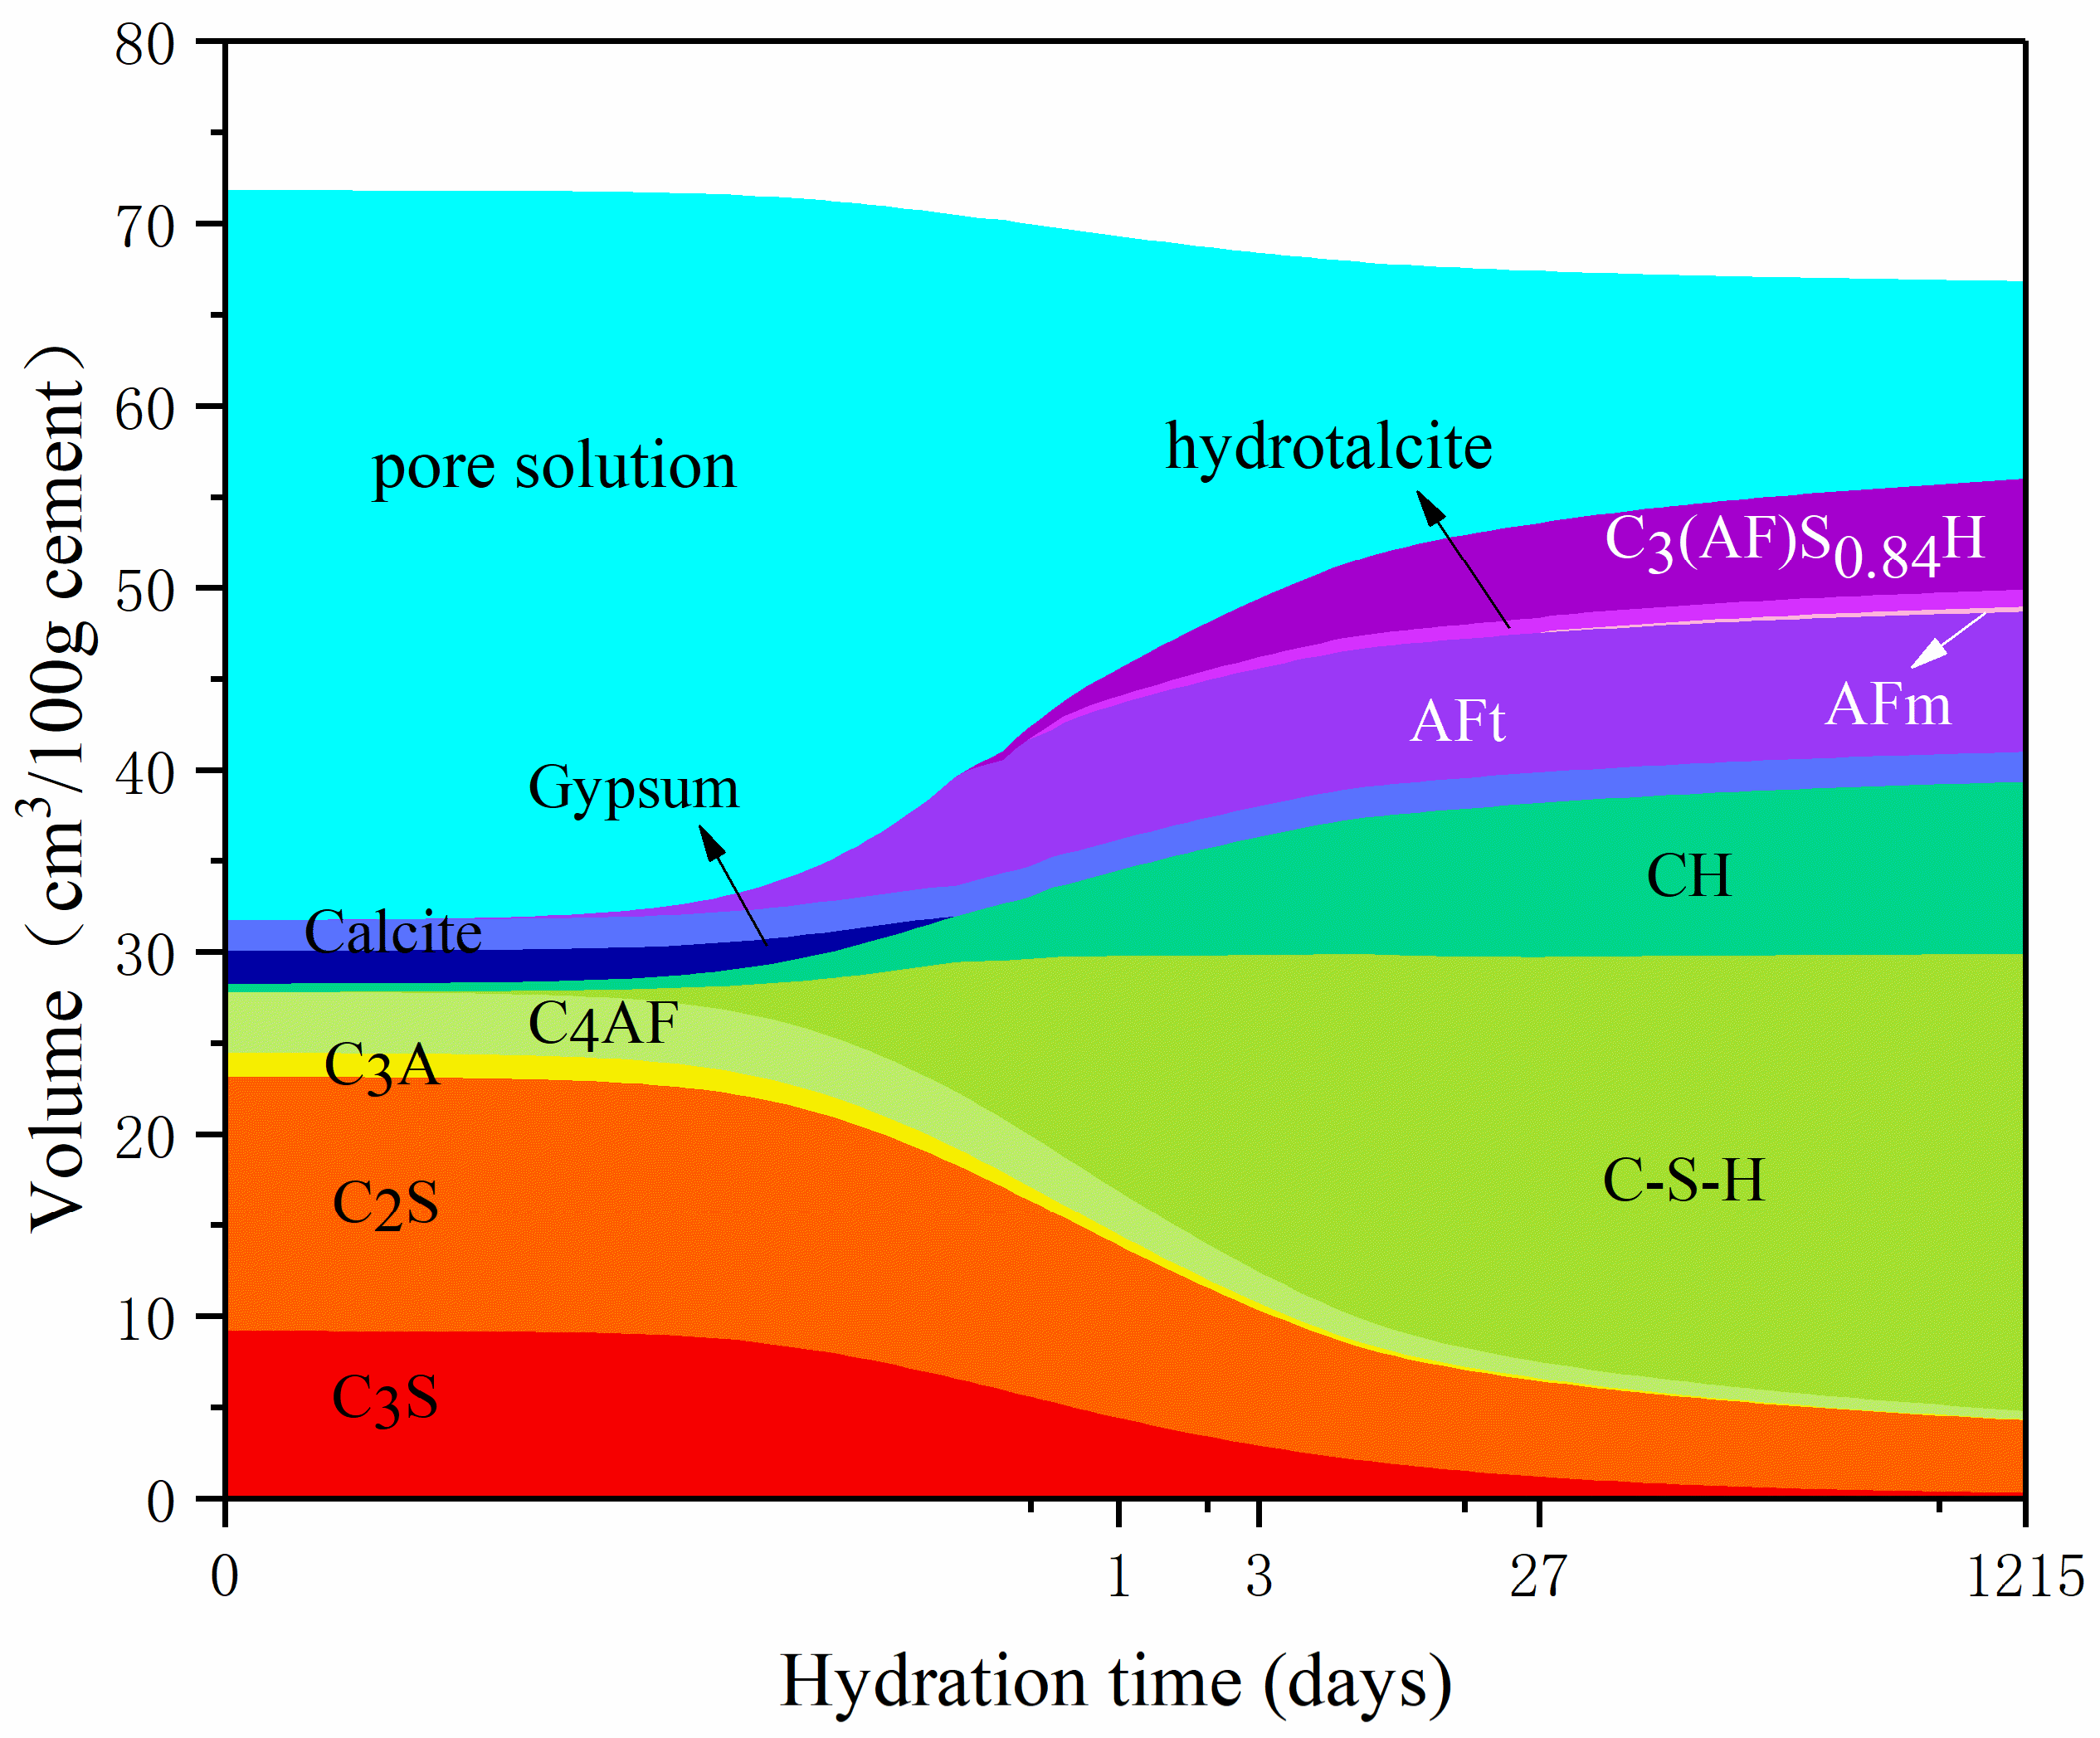
3.2. Influence of w/c Ratio on Hydration Products
3.3. Pore Structure of LHP Cement Paste
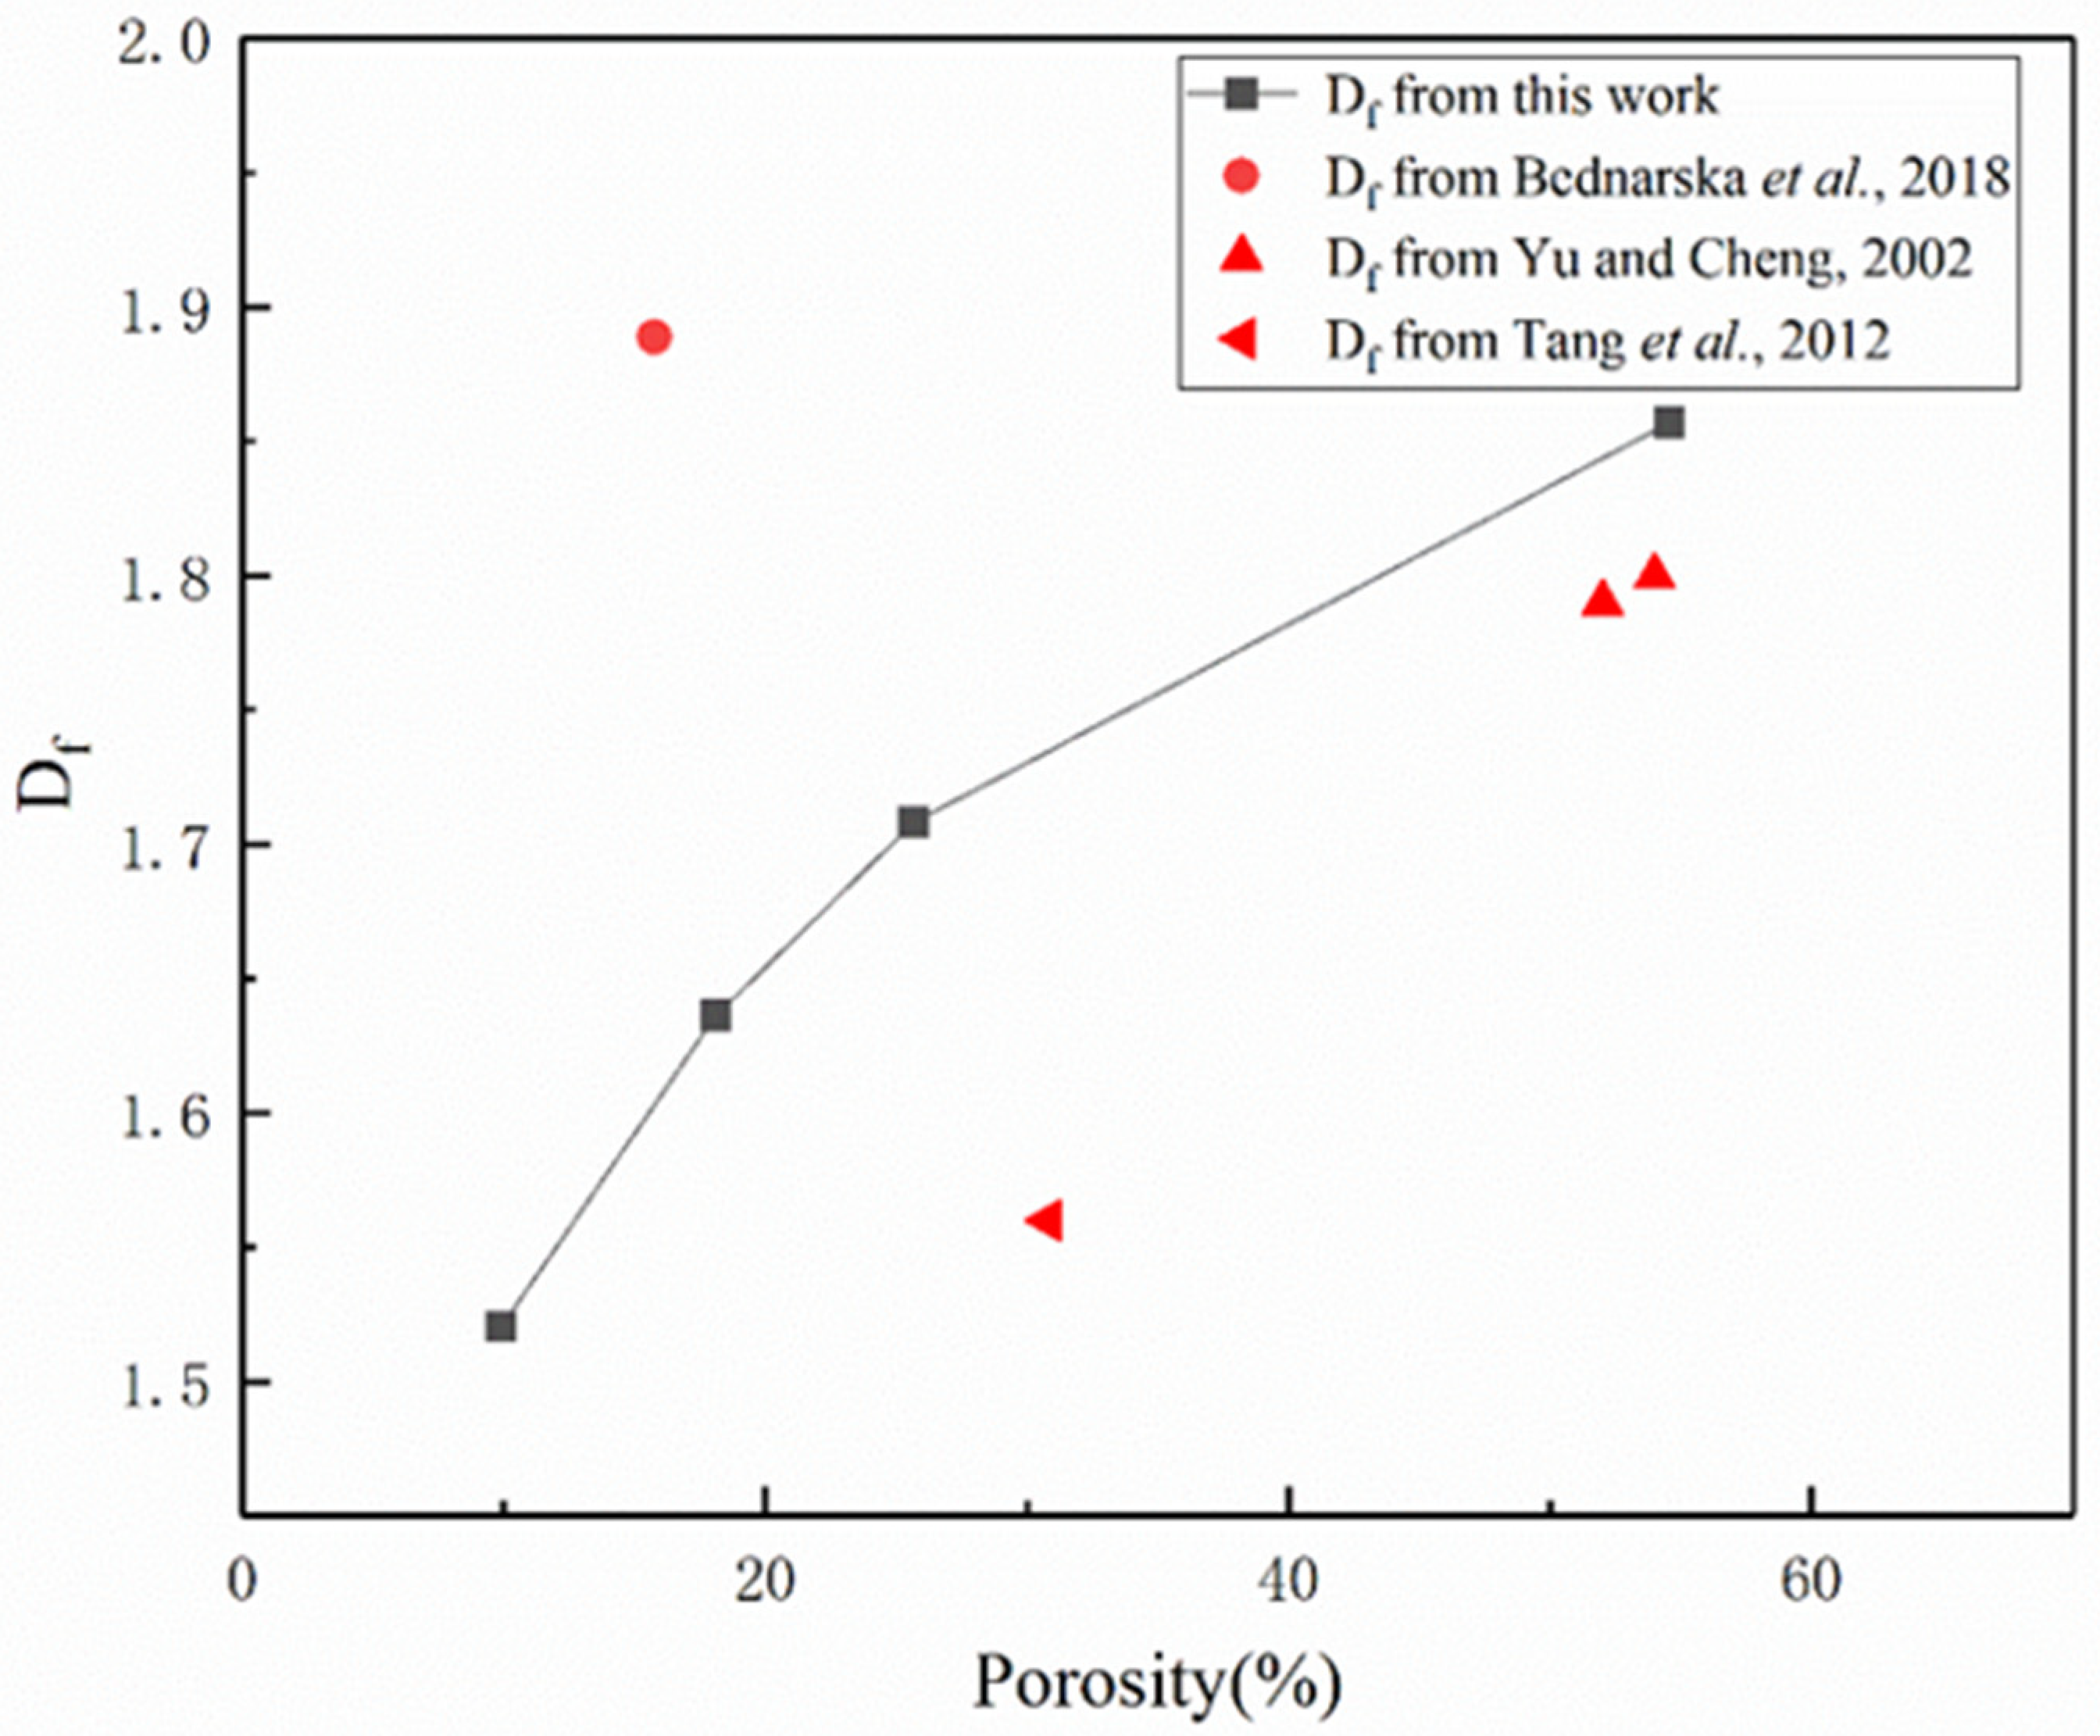
3.4. Fractal Analysis of Pore Structure in LHP Cement Paste
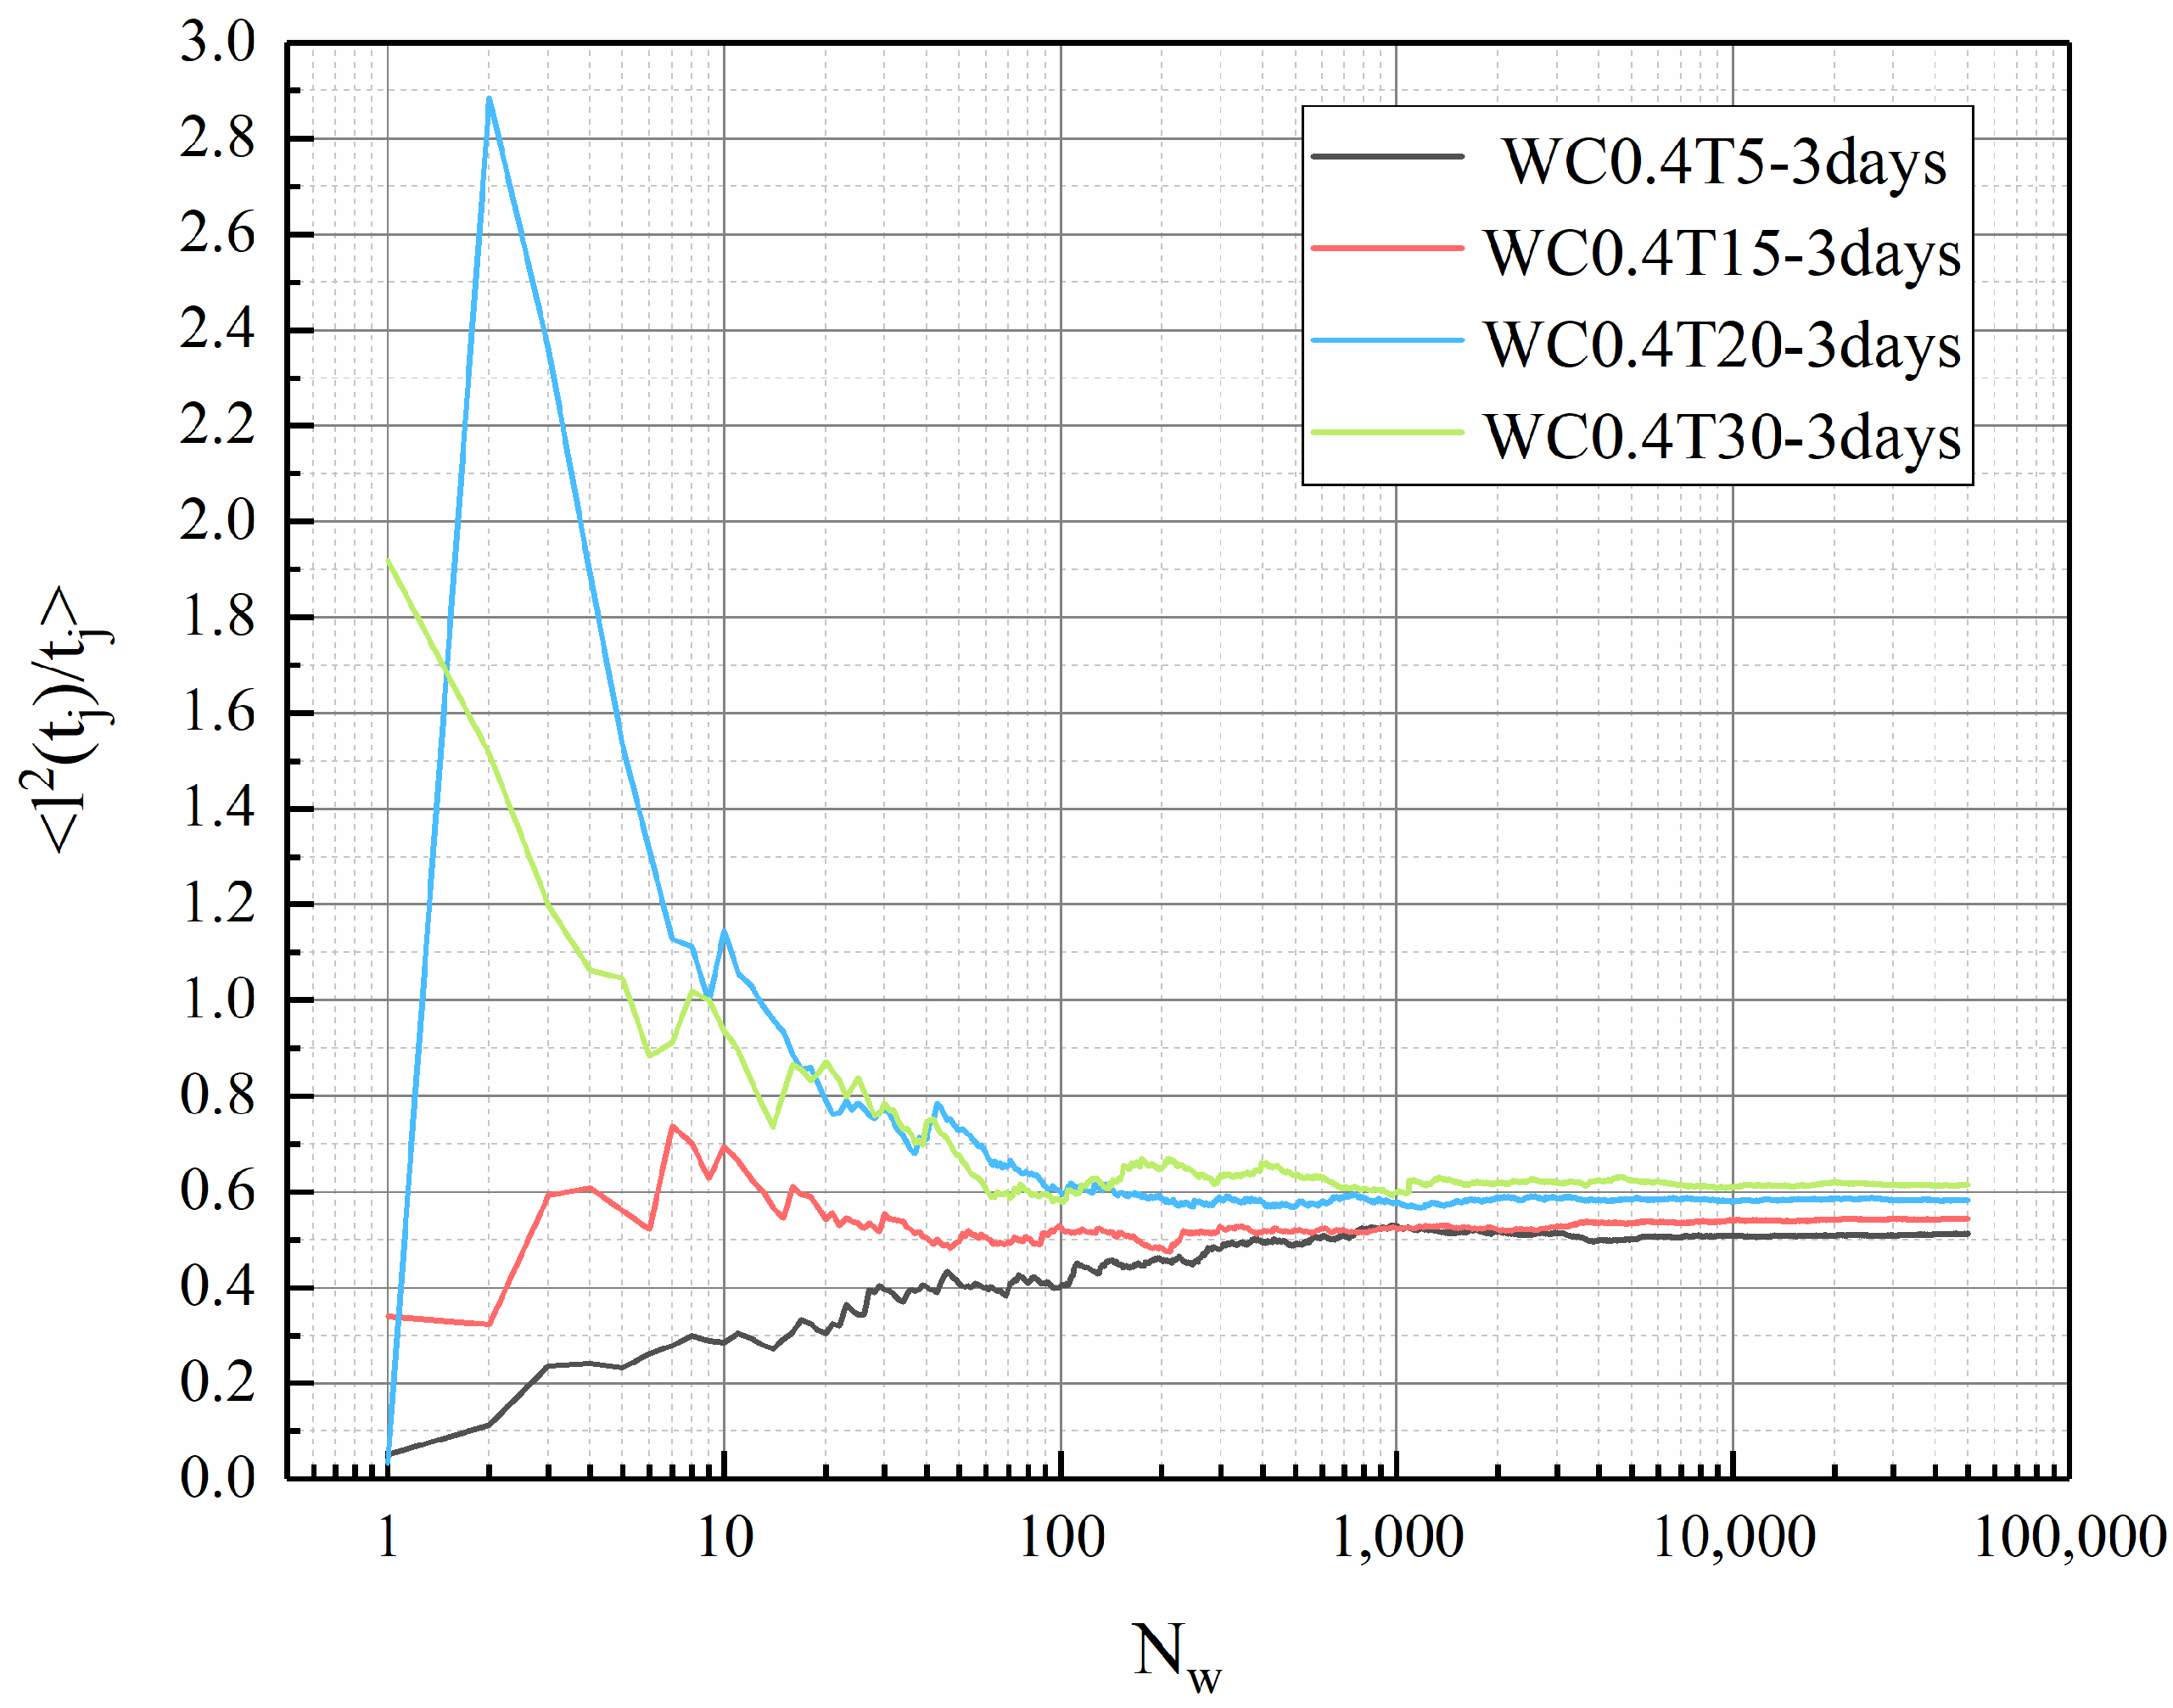
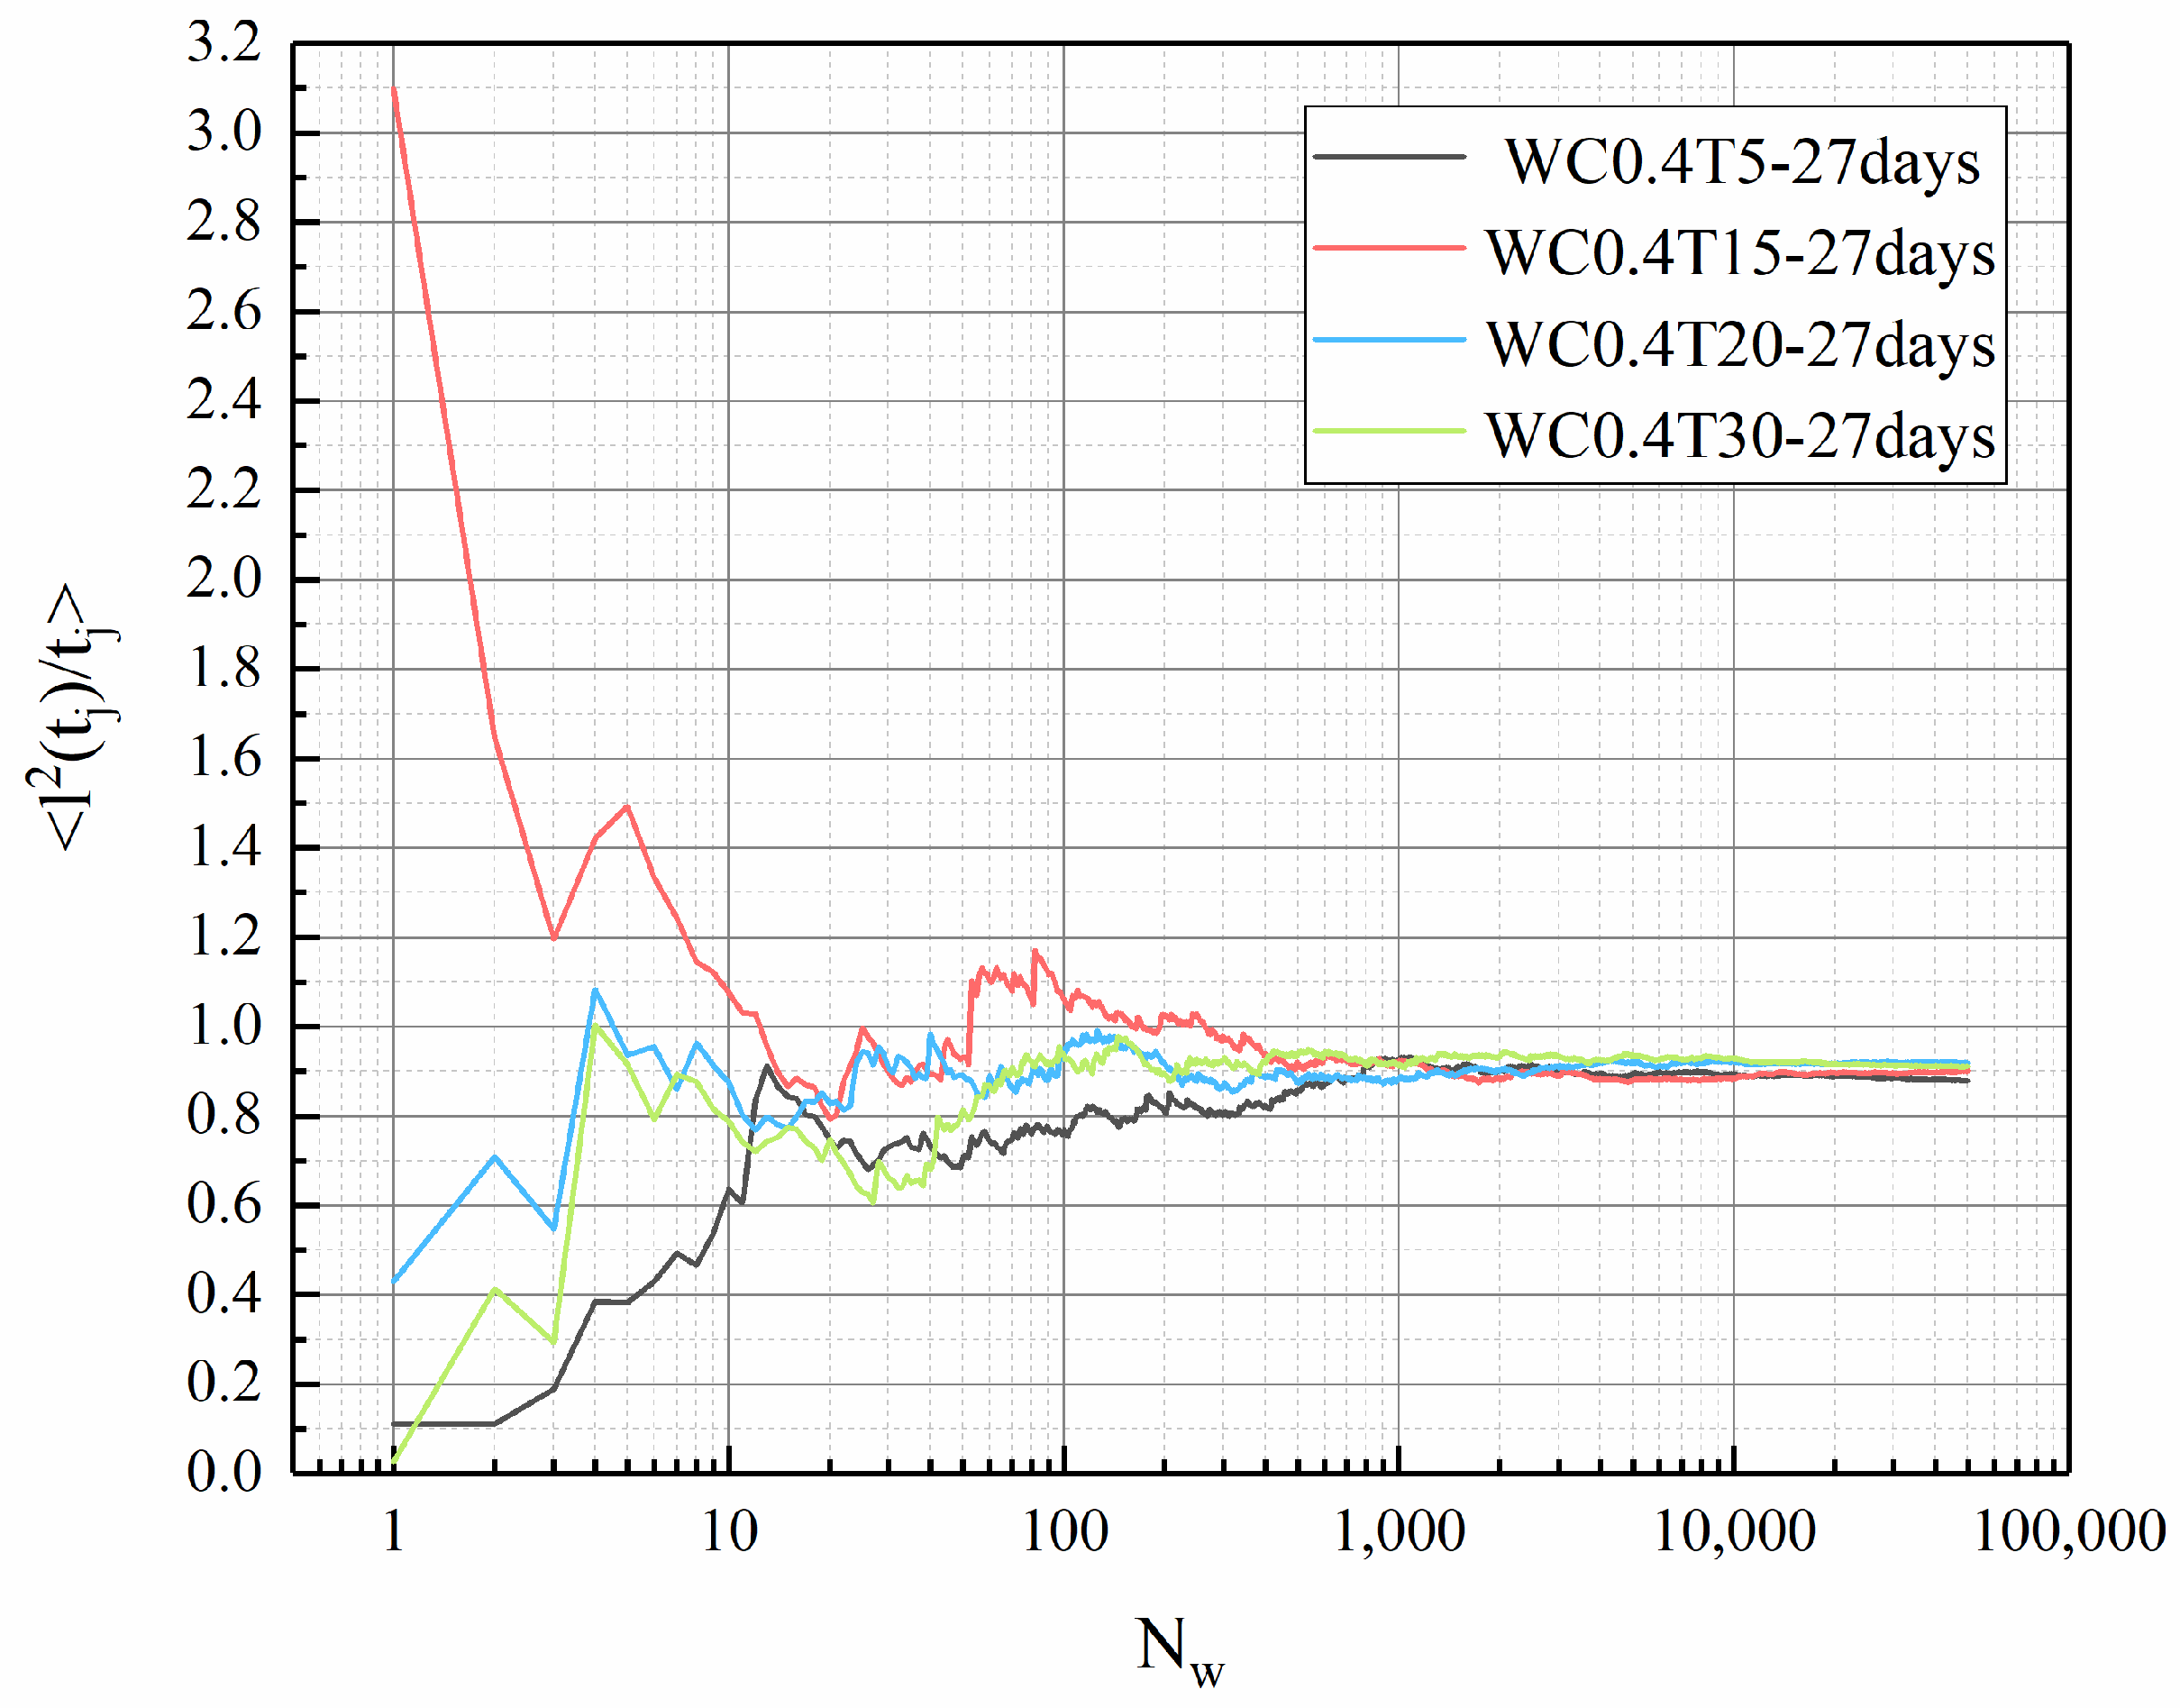
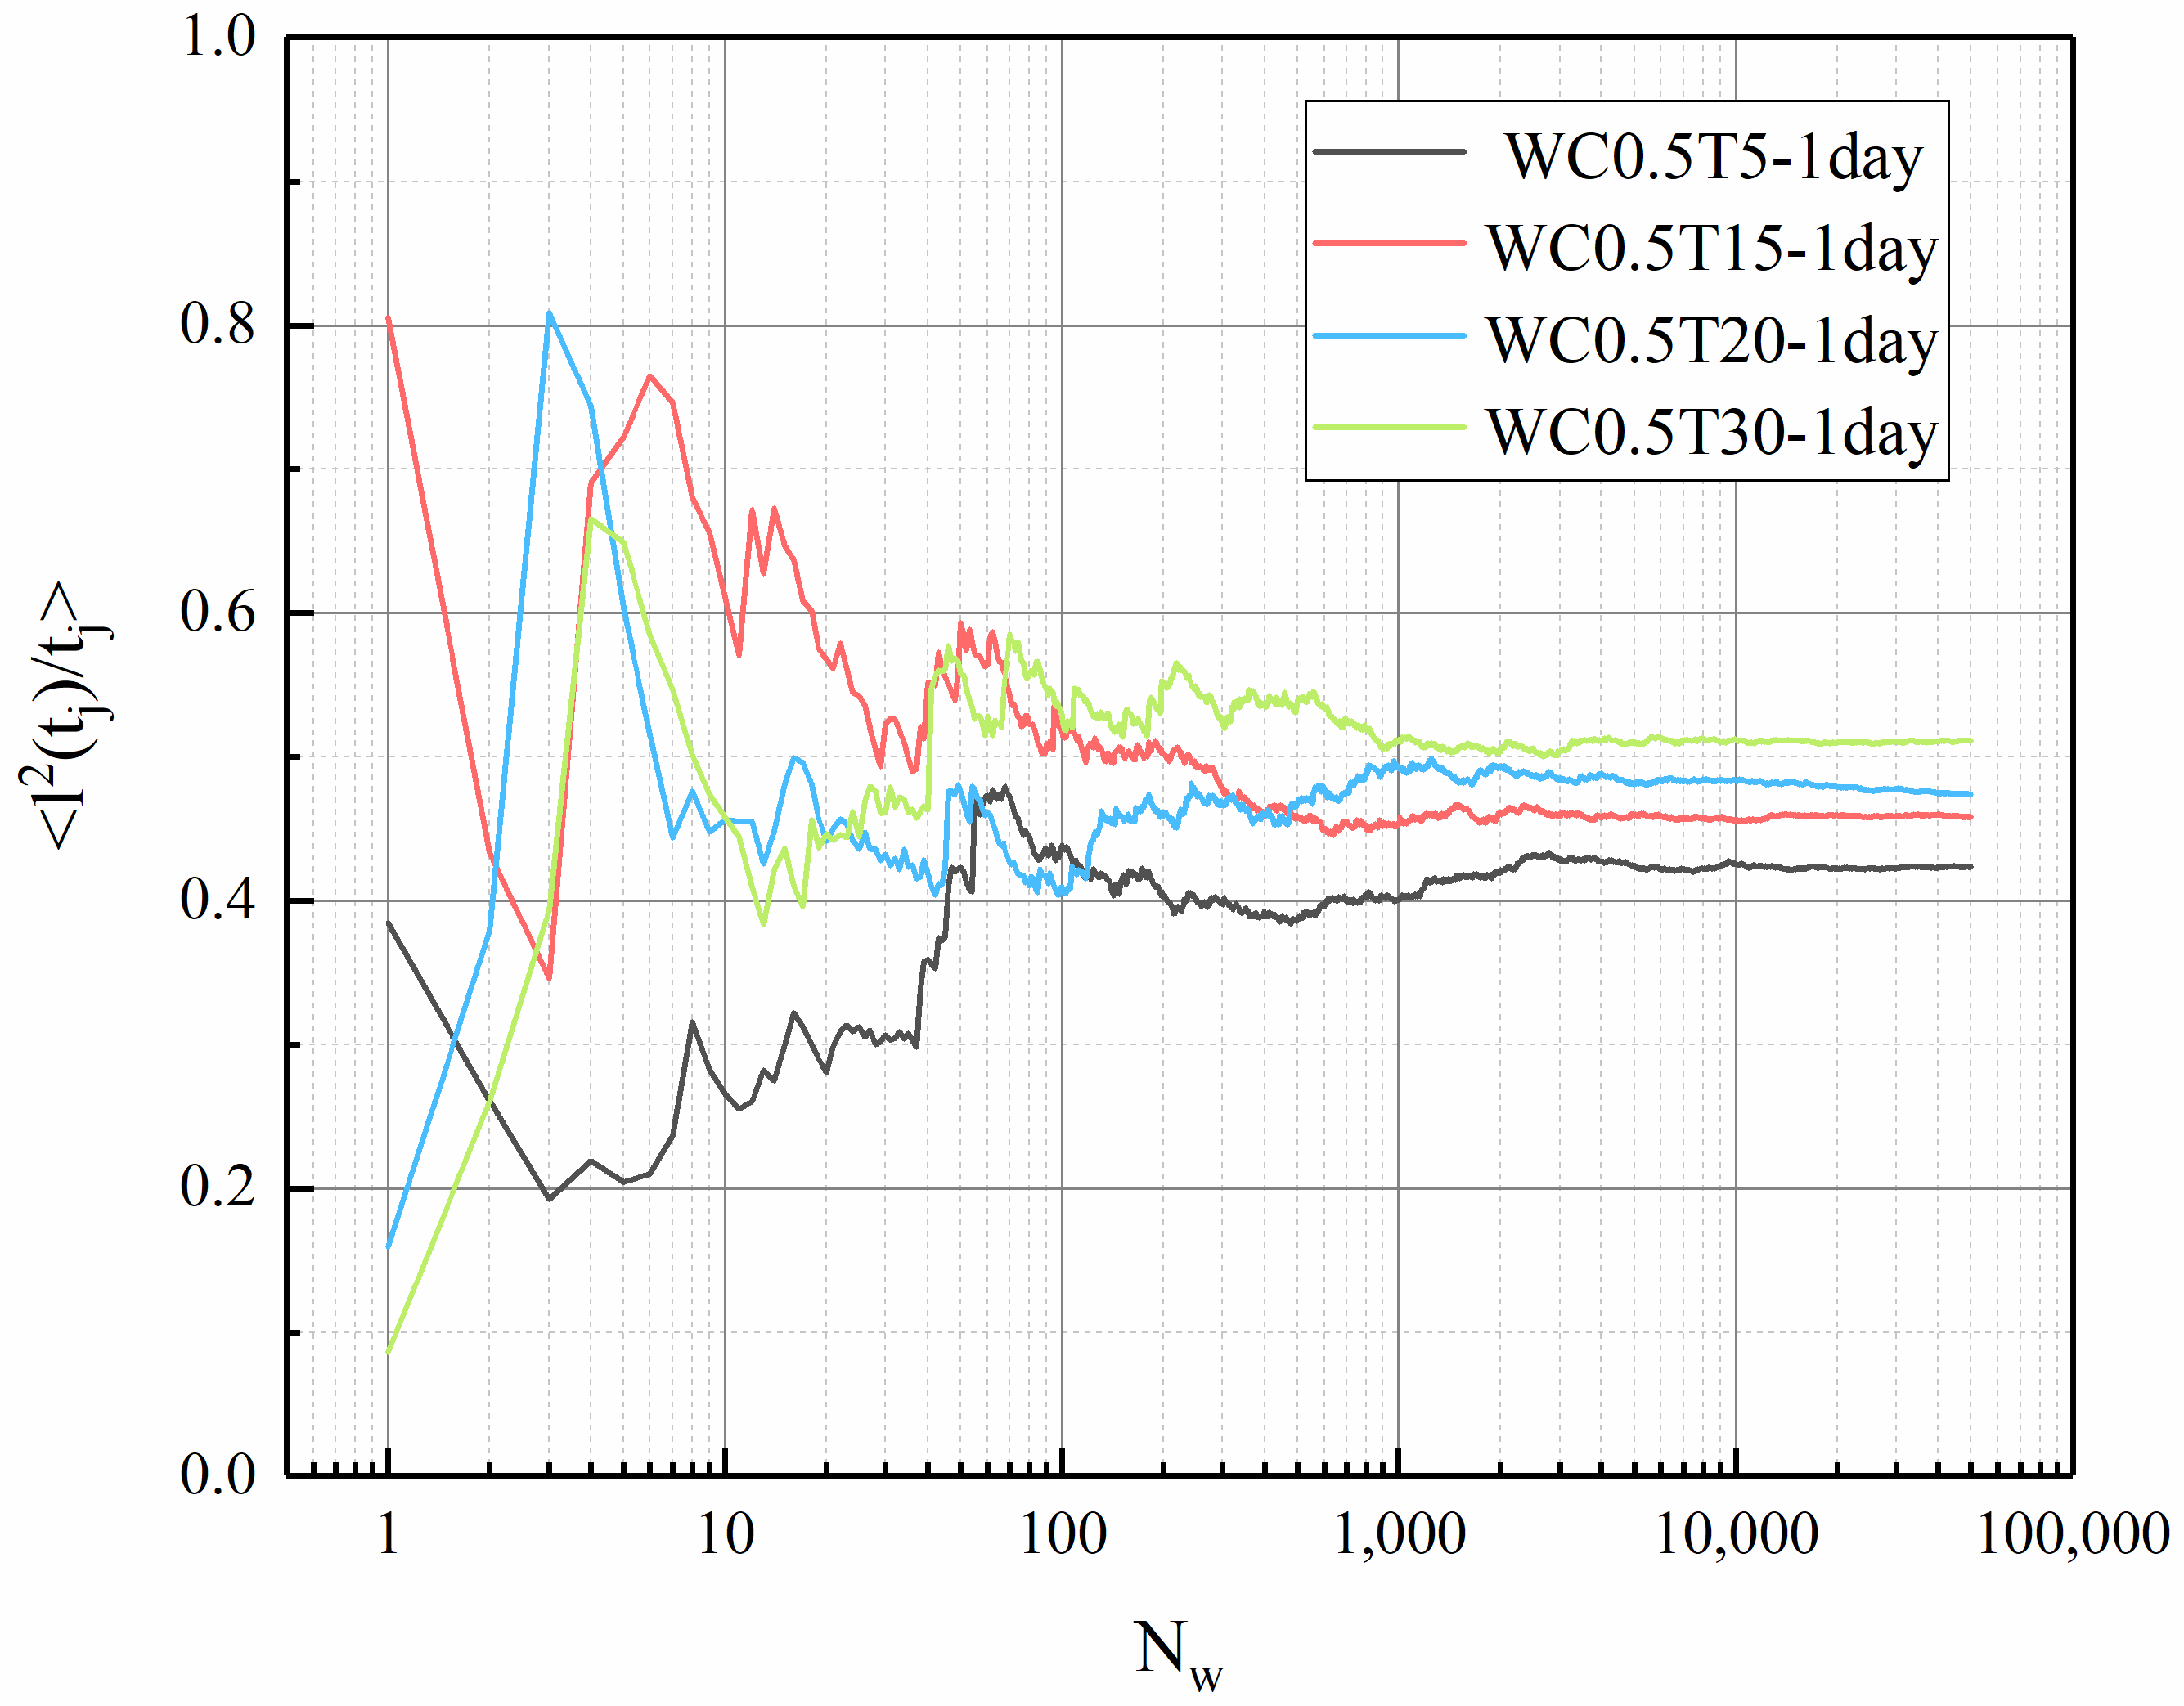
3.5. Tortuosity of LHP Cement Paste
4. Conclusions
- Curing temperature has a significant impact on the hydration process and porosity of LHP cement paste, of which we investigated the hydration characteristics in the temperature range of 5–30 °C. High curing temperature potentially leads to high early hydration degree of LHP cement paste. At the same time, long hydration time can alleviate the influence of temperature on hydration products to some extent.
- The w/c ratio significantly affects the hydration degree and porosity of LHP pastes. Two values of w/c ratio (0.4 and 0.5) are compared in this work. At the same curing temperature, a high w/c ratio leads to the high porosity of cement paste and hydration degree of raw clinkers. After curing for 27 days, the formation rate of products for a low w/c ratio paste is low and the number of crystals is significantly small. Remarkably, high w/c ratio is helpful to the compact hydration structure of LHP cement pastes.
- In this work, fractal analysis and tortuosity analysis are used to explore the pore structure characteristics of LHP cement paste. The value of LHP cement paste is closely related to porosity, and a high w/c ratio and low curing temperature can lead to a high value. From the tortuosity analysis, it can be concluded that the tortuosity of LHP cement paste increases with a decrease in its porosity. The tortuosity of the high-w/c pastes is generally higher than that of the low w/c pastes. This may indicate that the internal structures of cement pastes with larger pores are more complex, which is consistent with the conclusion of fractal analysis. In addition, high-temperature curing may cause high tortuosity. For the low-w/c-ratio pastes, this effect is mainly reflected in the early stage of hydration, and for high values, it is also obvious under long-term curing. Based on the tortuosity value, we calculated the 1/ value of LHP cement paste, and the 1/ value of LHP cement paste is low, which may mean that the effective diffusivity of LHP cement paste is low.
5. Prospects
- The modeling of LHP cement paste can effectively assist in future practical engineering research on cement paste, which also provides ideas for other types of cement research. Using computer simulation for pilot experiments can extremely improve experimental efficiency. However, this model also has certain limitations. This model only explores the hydration properties of LHP cement from a thermodynamic perspective without considering hydrodynamics. The hydration model of LHP cement paste is still not accurate enough, and future research can try to establish a more accurate cement paste hydration model combined with hydrodynamics to explore deeper cement hydration properties.
- In this research, the fractal dimension analysis and the tortuosity calculation of LHP cement paste mainly focus on the establishment of a calculation model. The results obtained are consistent with the relevant findings. After verification, the model is feasible. However, this research is limited to the establishment of models and does not conduct in-depth discussions on the nature and application of fractal dimension and tortuosity of LHP cement paste. The tortuosity of cement paste may be related to its permeability and strength to a certain extent. We hope this can provide ideas and basic data for further research by subsequent scholars.
Author Contributions
Funding
Data Availability Statement
Acknowledgments
Conflicts of Interest
References
- Jian, S.W.; Gao, W.B.; Lv, Y.; Tan, H.B.; Li, X.G.; Li, B.D.; Huang, W.C. Potential utilization of copper tailings in the preparation of low heat cement clinker. Constr. Build. Mater. 2020, 252, 119130–119138. [Google Scholar] [CrossRef]
- Taloey, N.; Aikawa, Y.; Kubota, O.; Sakai, E. Theoretical analysis of the hydration dependence of low heat portland cements with or without silica fume on their packing fractions. J. Ceram. Soc. Jpn. 2018, 126, 706–713. [Google Scholar] [CrossRef]
- Mori, K.; Fukunaga, T.; Sugiyama, M.; Iwase, K.; Oishi, K.; Yamamuro, O. Hydration properties and compressive strength development of low heat cement. J. Phys. Chem. Solids 2012, 73, 1274–1277. [Google Scholar] [CrossRef]
- Wang, Q.; Liu, R.; Liu, C.; Liu, P.; Sun, L. Effects of silica fume type and cementitious material content on the adiabatic temperature rise behavior of lhp cement concrete. Constr. Build. Mater. 2022, 351, 128976–128988. [Google Scholar] [CrossRef]
- Peng, H.Y.; Lin, P.; Xiang, Y.F.; Hu, J.W.; Yang, Z.L. Effects of carbon thin film on low-heat cement hydration, temperature and strength of the wudongde dam concrete. Buildings 2022, 12, 717–733. [Google Scholar] [CrossRef]
- Gong, J.W.; Jiang, C.M.; Tang, X.J.; Zheng, Z.G.; Yang, L.X. Optimization of mixture proportions in ternary low-heat portland cement-based cementitious systems with mortar blends based on projection pursuit regression. Constr. Build. Mater. 2020, 238, 117666–117678. [Google Scholar] [CrossRef]
- Kotsay, G.; Jaskulski, R. Belite cement as an ecological alternative to portland cement-a review. Mater. Struct. Technol. J 2019, 2, 70–76. [Google Scholar]
- Cuesta, A.; Ayuela, A.; Aranda, M.A.G. Belite cements and their activation. Cem. Concr. Res. 2021, 140, 106319–106338. [Google Scholar] [CrossRef]
- Wang, Q.H.; Liu, R.X.; Liu, P.Y.; Liu, C.Y.; Sun, L.Y.; Zhang, H. Effects of silica fume on the abrasion resistance of low-heat portland cement concrete. Constr. Build. Mater. 2022, 329, 127165–127176. [Google Scholar] [CrossRef]
- Piasta, J. Heat deformations of cement paste phases and the microstructure of cement paste. Mater. Struct. 1984, 17, 415–420. [Google Scholar] [CrossRef]
- Lerch, W.; Bogue, R.H. The Heat of Hydration of Portland Cement Pastes; Portland Cement Association at the National Bureau of Standards: Washington, DC, USA, 1934. [Google Scholar]
- Holmes, N.; Tyrer, M.; West, R.; Lowe, A.; Kelliher, D. Using phreeqc to model cement hydration. Constr. Build. Mater. 2022, 319, 126129–126144. [Google Scholar] [CrossRef]
- Holmes, N.; Tyrer, M.; Kelliher, D. Predicting chemical shrinkage in hydrating cements. Buildings 2022, 12, 1972–1980. [Google Scholar] [CrossRef]
- Lothenbach, B.; Wieland, E. A thermodynamic approach to the hydration of sulphate-resisting portland cement. Waste Manag. 2006, 26, 706–719. [Google Scholar] [CrossRef] [PubMed]
- Lothenbach, B.; Zajac, M. Application of thermodynamic modelling to hydrated cements. Cem. Concr. Res. 2019, 123, 105779–105799. [Google Scholar] [CrossRef]
- Leisinger, S.M.; Lothenbach, B.; Le Saout, G.; Johnson, C.A. Thermodynamic modeling of solid solutions between monosulfate and monochromate 3CaO·Al2O3·Ca[(CrO4)x(SO4)1-x]·nH2O. Cem. Concr. Res. 2012, 42, 158–165. [Google Scholar] [CrossRef]
- Brouwers, H.J.H.; de Korte, A.C.J. Multi-cycle and multi-scale cellular automata for hydration simulation (of Portland-cement). Comput. Mater. Sci. 2016, 111, 116–124. [Google Scholar] [CrossRef]
- Koumpouri, D.; Angelopoulos, G.N. Effect of boron waste and boric acid addition on the production of low energy belite cement. Cem. Concr. Compos. 2016, 68, 1–8. [Google Scholar] [CrossRef]
- Iacobescu, R.I.; Koumpouri, D.; Pontikes, Y.; Saban, R.; Angelopoulos, G.N. Valorisation of electric arc furnace steel slag as raw material for low energy belite cements. J. Hazard. Mater. 2011, 196, 287–294. [Google Scholar] [CrossRef]
- Kulik, D.A.; Wagner, T.; Dmytrieva, S.V.; Kosakowski, G.; Hingerl, F.F.; Chudnenko, K.V.; Berner, U.R. Gem-selektor geochemical modeling package: Revised algorithm and GEMS3K numerical kernel for coupled simulation codes. Comput. Geosci. 2013, 17, 1–24. [Google Scholar] [CrossRef]
- Karpov, I.K.; Chudnenko, K.V.; Kulik, D.A.; Avchenko, O.V.; Bychinskii, V.A. Minimization of gibbs free energy in geochemical systems by convex programming. Geochem. Int. 2001, 39, 1108–1119. [Google Scholar]
- Karpov, I.K.; Chudnenko, K.V.; Kulik, D.A. Modeling chemical mass transfer in geochemical processes: Thermodynamic relations, conditions of equilibria, and numerical algorithms. Am. J. Sci. 1997, 297, 767–806. [Google Scholar] [CrossRef]
- Wagner, T.; Kulik, D.A.; Hingerl, F.F.; Dmytrieva, S.V. Gem-selektor geochemical modeling package: Tsolmod library and data interface for multicomponent phase models. Can. Mineral. 2012, 50, 1173–1195. [Google Scholar] [CrossRef]
- Lothenbach, B.; Kulik, D.A.; Matschei, T.; Balonis, M.; Baquerizo, L.; Dilnesa, B.; Miron, G.D.; Myers, R.J. Cemdata18: A chemical thermodynamic database for hydrated portland cements and alkali-activated materials. Cem. Concr. Res. 2019, 115, 472–506. [Google Scholar] [CrossRef]
- Ma, H.; Xu, B.; Lu, Y.; Li, Z. Modeling magnesia-phosphate cement paste at the micro-scale. Mater. Lett. 2014, 125, 15–18. [Google Scholar] [CrossRef]
- Yu, B.; Li, J. Some fractal characters of porous media. Fractals 2011, 09, 365–372. [Google Scholar] [CrossRef]
- Wang, R.; Singh, A.K.; Kolan, S.R.; Tsotsas, E. Fractal analysis of aggregates: Correlation between the 2d and 3d box-counting fractal dimension and power law fractal dimension. Chaos Solitons Fractals 2022, 160, 112246. [Google Scholar] [CrossRef]
- Panigrahy, C.; Seal, A.; Mahato, N.K.; Bhattacharjee, D. Differential box counting methods for estimating fractal dimension of gray-scale images: A survey. Chaos Solitons Fractals 2019, 126, 178–202. [Google Scholar] [CrossRef]
- Ma, H. Multi-Scale Modeling of the Microstructure and Transport Properties of Contemporary Concrete. Ph.D. Thesis, Hong Kong University of Science and Technology, Hong Kong, China, 2013. [Google Scholar]
- Zhong, H.; Zhang, K.; Yang, L.; Wang, F.; Hu, S.; Lv, M.; He, J. In-depth understanding the hydration process of mn-containing ferrite: A comparison with ferrite. J. Am. Ceram. Soc. 2022, 105, 4883–4896. [Google Scholar] [CrossRef]
- Chen, W.; Li, Y.; Shen, P.; Shui, Z. Microstructural development of hydrating portland cement paste at early ages investigated with non-destructive methods and numerical simulation. J. Nondestr. Eval. 2013, 32, 228–237. [Google Scholar] [CrossRef]
- Sharma, R.; Kim, H.; Lee, N.K.; Park, J.-J.; Jang, J.G. Microstructural characteristics and co2 uptake of calcium sulfoaluminate cement by carbonation curing at different water-to-cement ratios. Cem. Concr. Res. 2023, 163, 107012–107028. [Google Scholar]
- Shirani, S.; Cuesta, A.; Morales-Cantero, A.; De la Torre, A.G.; Olbinado, M.P.; Aranda, M.A.G. Influence of curing temperature on belite cement hydration: A comparative study with portland cement. Cem. Concr. Res. 2021, 147, 106499–106514. [Google Scholar] [CrossRef]
- Xuan, M.-Y.; Wang, X.-Y. Autogenous shrinkage reduction and strength improvement of ultra-high-strength concrete using belite-rich portland cement. J. Build. Eng. 2022, 59, 105107–105123. [Google Scholar] [CrossRef]
- Wang, R.; Liu, X.; Yue, X. Effect of carboxylated styrene–butadiene copolymer on the hydration of tricalcium aluminate in the presence of gypsum and calcium hydroxide. J. Therm. Anal. Calorim. 2022, 147, 3015–3023. [Google Scholar] [CrossRef]
- Matschei, T.; Lothenbach, B.; Glasser, F.P. The afm phase in portland cement. Cem. Concr. Res. 2007, 37, 118–130. [Google Scholar] [CrossRef]
- Collier, N.C. Transition and decomposition temperatures of cement phases-a collection of thermal analysis data. Ceram-Silikaty 2016, 60, 338–343. [Google Scholar] [CrossRef]
- Matsushita, T.; Hoshino, S.; Maruyama, I.; Noguchi, T.; Yamada, K. Effect of curing temperature and water to cement ratio on hydration of cement compounds. In Proceedings of the 12th International Congress Chemistry of Cement, Montreal, QC, Canada, 8–13 July 2007. [Google Scholar]
- Swaddiwudhipong, S.; Chen, D.; Zhang, M.H. Simulation of the exothermic hydration process of portland cement. Adv. Cem. Res. 2002, 14, 61–69. [Google Scholar] [CrossRef]
- Emmanuel, A.C.; Bishnoi, S. Influence of clinker replacement and curing temperature on hydration kinetics, strength development, and phase assemblage of fly ash–blended cements. J. Mater. Civ. Eng. 2022, 34, 04022107. [Google Scholar] [CrossRef]
- Mu, X.; Zhang, S.; Ni, W.; Xu, D.; Li, J.; Du, H.; Wei, X.; Li, Y. Performance optimization and hydration mechanism of a clinker-free ultra-high performance concrete with solid waste based binder and steel slag aggregate. J. Build. Eng. 2023, 63, 105479–105495. [Google Scholar] [CrossRef]
- Wang, Z.; Wang, Q.; Zhao, W.; Xia, C.; Tian, X.; Jiang, Y.; Zhou, X.; Chen, G.; Wang, L.; Chen, M. Influence of carlin-type gold mine tailings addition on the synthesis temperature, alkali-resistant performance, and hydration mechanism of portland cement. Constr. Build. Mater. 2022, 359, 129458–129469. [Google Scholar] [CrossRef]
- Baltrusaitis, J.; Grassian, V.H. Calcite surface in humid environments. Surf. Sci. 2009, 603, L99–L104. [Google Scholar] [CrossRef]
- Demenev, A.D.; Khmurchik, V.T.; Maksimovich, N.G.; Demeneva, E.P.; Sedinin, A.M. Improvement of sand properties using biotechnological precipitation of calcite cement (CaCO3). Environ. Earth Sci. 2021, 80, 580. [Google Scholar] [CrossRef]
- Snellings, R.; Machner, A.; Bolte, G.; Kamyab, H.; Durdzinski, P.; Teck, P.; Zajac, M.; Muller, A.; de Weerdt, K.; Haha, M.B. Hydration kinetics of ternary slag-limestone cements: Impact of water to binder ratio and curing temperature. Cem. Concr. Res. 2022, 151, 106647–106660. [Google Scholar]
- Pang, X.Y.; Jimenez, W.C.; Singh, J. Measuring and modeling cement hydration kinetics at variable temperature conditions. Constr. Build. Mater. 2020, 262, 120788–120797. [Google Scholar] [CrossRef]
- Zhao, Y.L.; Qiu, J.P.; Ma, Z.Y. Temperature-dependent rheological, mechanical and hydration properties of cement paste blended with iron tailings. Powder Technol. 2021, 381, 82–91. [Google Scholar] [CrossRef]
- Perez-Bravo, R.; Morales-Cantero, A.; Bruscolini, M.; Aranda, M.A.G.; Santacruz, I.; De la Torre, A.G. Effect of boron and water-to-cement ratio on the performances of laboratory prepared belite-ye’elimite-ferrite (BYF) cements. Materials 2021, 14, 4862. [Google Scholar] [CrossRef]
- Kurihara, R.; Maruyama, I. Revisiting tennis-jennings method to quantify low-density/high-density calcium silicate hydrates in portland cement pastes. Cem. Concr. Res. 2022, 156, 106786–106799. [Google Scholar] [CrossRef]
- Silvestro, L.; Lima, G.T.D.S.; Ruviaro, A.S.; Gleize, P.J.P. Stability of carboxyl-functionalized carbon nanotubes in simulated cement pore solution and its effect on the compressive strength and porosity of cement-based nanocomposites. C 2022, 8, 39–50. [Google Scholar]
- Thomas, J.J.; Allen, A.J.; Jennings, H.M. Structural changes to the calcium-silicate-hydrate gel phase of hydrated cement with age, drying, and resaturation. J. Am. Ceram. Soc. 2008, 91, 3362–3369. [Google Scholar] [CrossRef]
- Wang, P.; Li, N.; Xu, L. Hydration evolution and compressive strength of calcium sulphoaluminate cement constantly cured over the temperature range of 0 to 80 °C. Cem. Concr. Res. 2017, 100, 203–213. [Google Scholar] [CrossRef]
- Xie, J.; Wu, Z.; Zhang, X.; Hu, X.; Shi, C. Trends and developments in low-heat portland cement and concrete: A review. Constr. Build. Mater. 2023, 392, 131535–131551. [Google Scholar] [CrossRef]
- Xuan, M.-Y.; Bae, S.C.; Kwon, S.-J.; Wang, X.-Y. Sustainability enhancement of calcined clay and limestone powder hybrid ultra-high-performance concrete using belite-rich portland cement. Constr. Build. Mater. 2022, 351, 128932–128945. [Google Scholar] [CrossRef]
- Moreira, E.B.; Baldovino, J.A.; Rose, J.L.; Izzo, R.L.D. Effects of porosity, dry unit weight, cement content and void/cement ratio on unconfined compressive strength of roof tile waste-silty soil mixtures. J. Rock Mech. Geotech. Eng. 2019, 11, 369–378. [Google Scholar] [CrossRef]
- Li, L.G.; Feng, J.J.; Zhu, J.; Chu, S.H.; Kwan, A.K.H. Pervious concrete: Effects of porosity on permeability and strength. Mag. Concr. Res. 2021, 73, 69–79. [Google Scholar]
- Rahmanzadeh, B.; Rahmani, K.; Piroti, S. Experimental study of the effect of water-cement ratio on compressive strength, abrasion resistance, porosity and permeability of nano silica concrete. Frat. Ed Integrita Strutt. 2018, 12, 16–24. [Google Scholar]
- Bednarska, D.; Wieczorek, A.; Koniorczyk, M. Characterization of pore structure for permeability prediction of cement based materials under frost attack—The fractal approach. In Proceedings of the AIP Conference Proceedings, Maharashtra, India, 5–6 July 2018. [Google Scholar]
- Yu, B.; Cheng, P. A fractal permeability model for bi-dispersed porous media. Int. J. Heat Mass Transfer 2002, 45, 2983–2993. [Google Scholar] [CrossRef]
- Tang, H.P.; Wang, J.Z.; Zhu, J.L.; Ao, Q.B.; Wang, J.Y.; Yang, B.J.; Li, Y.N. Fractal dimension of pore-structure of porous metal materials made by stainless steel powder. Powder Technol. 2012, 217, 383–387. [Google Scholar] [CrossRef]
- Bespalhuk, K.J.; de Oliveira, T.J.C.; Valverde, J.V.P.; Gonçalves, R.A.; Ferreira-Neto, L.; Souto, P.C.S.; Silva, J.R.; de Souza, N.C. Fractal analysis of microstructures in portland cement pastes-effect of curing conditions. Constr. Build. Mater. 2023, 363, 129881–129889. [Google Scholar] [CrossRef]
- Zeng, B.; Yin, F.; Yang, Y.; Wu, Y.; Mao, C. Application of the novel-structured multivariable grey model with various orders to forecast the bending strength of concrete. Chaos Solitons Fractals 2023, 168, 113200–113214. [Google Scholar] [CrossRef]
- Guo, Y.; Zhang, T.; Du, J.; Wang, C.; Wei, J.; Yu, Q. Evaluating the chloride diffusion coefficient of cement mortars based on the tortuosity of pore structurally-designed cement pastes. Micropor Mesopor Mat. 2021, 317, 111018–111030. [Google Scholar] [CrossRef]
- Patel, R.A.; Perko, J.; Jacques, D.; De Schutter, G.; Ye, G.; Van Bruegel, K. Effective diffusivity of cement pastes from virtual microstructures: Role of gel porosity and capillary pore percolation. Constr. Build. Mater. 2018, 165, 833–845. [Google Scholar] [CrossRef]


| Raw Clinker | Density (g/cm3) [10] | Content CaO (% Weight) [10] | Heat Evolved on Complete Hydration (cal/g) [11] |
|---|---|---|---|
| C3S | 3.15 | 1.28 | 120 |
| -C2S | 3.23 | 0.02 | 62 |
| Paste Notation | w/c Ratio | Temperature (°C) |
|---|---|---|
| WC0.4T5 | 0.4 | 5 |
| WC0.4T15 | 0.4 | 15 |
| WC0.4T20 | 0.4 | 20 |
| WC0.4T30 | 0.4 | 30 |
| WC0.5T5 | 0.5 | 5 |
| WC0.5T15 | 0.5 | 15 |
| WC0.5T20 | 0.5 | 20 |
| WC0.5T30 | 0.5 | 30 |
| Chemical Oxide Constituents (wt.%) | Percentage (%) | Mineral Composition (wt.%) | Percentage (%) |
|---|---|---|---|
| CaO | 61.86 | C3S | 28.7 b (30.7) c |
| SiO2 | 23.98 | C2S | 47.0 b (44.3) c |
| Fe2O3 | 4.22 | C3A | 4.1 b (3.6) c |
| Al2O3 | 4.23 | C4AF | 12.8 b (14.1) c |
| MgO | 2.89 | Gypsum | 3.9 |
| SO3 | 2.31 | ||
| R2O a | 0.31 | ||
| Loss on ignition (wt.%) | 0.45 |
| WC0.4T5 | WC0.4T15 | WC0.4T20 | WC0.4T30 | |||||||||
|---|---|---|---|---|---|---|---|---|---|---|---|---|
| 1 Day | 3 Days | 27 Days | 1 Day | 3 Days | 27 Days | 1 Day | 3 Days | 27 Days | 1 Day | 3 Days | 27 Days | |
| Reactant | ||||||||||||
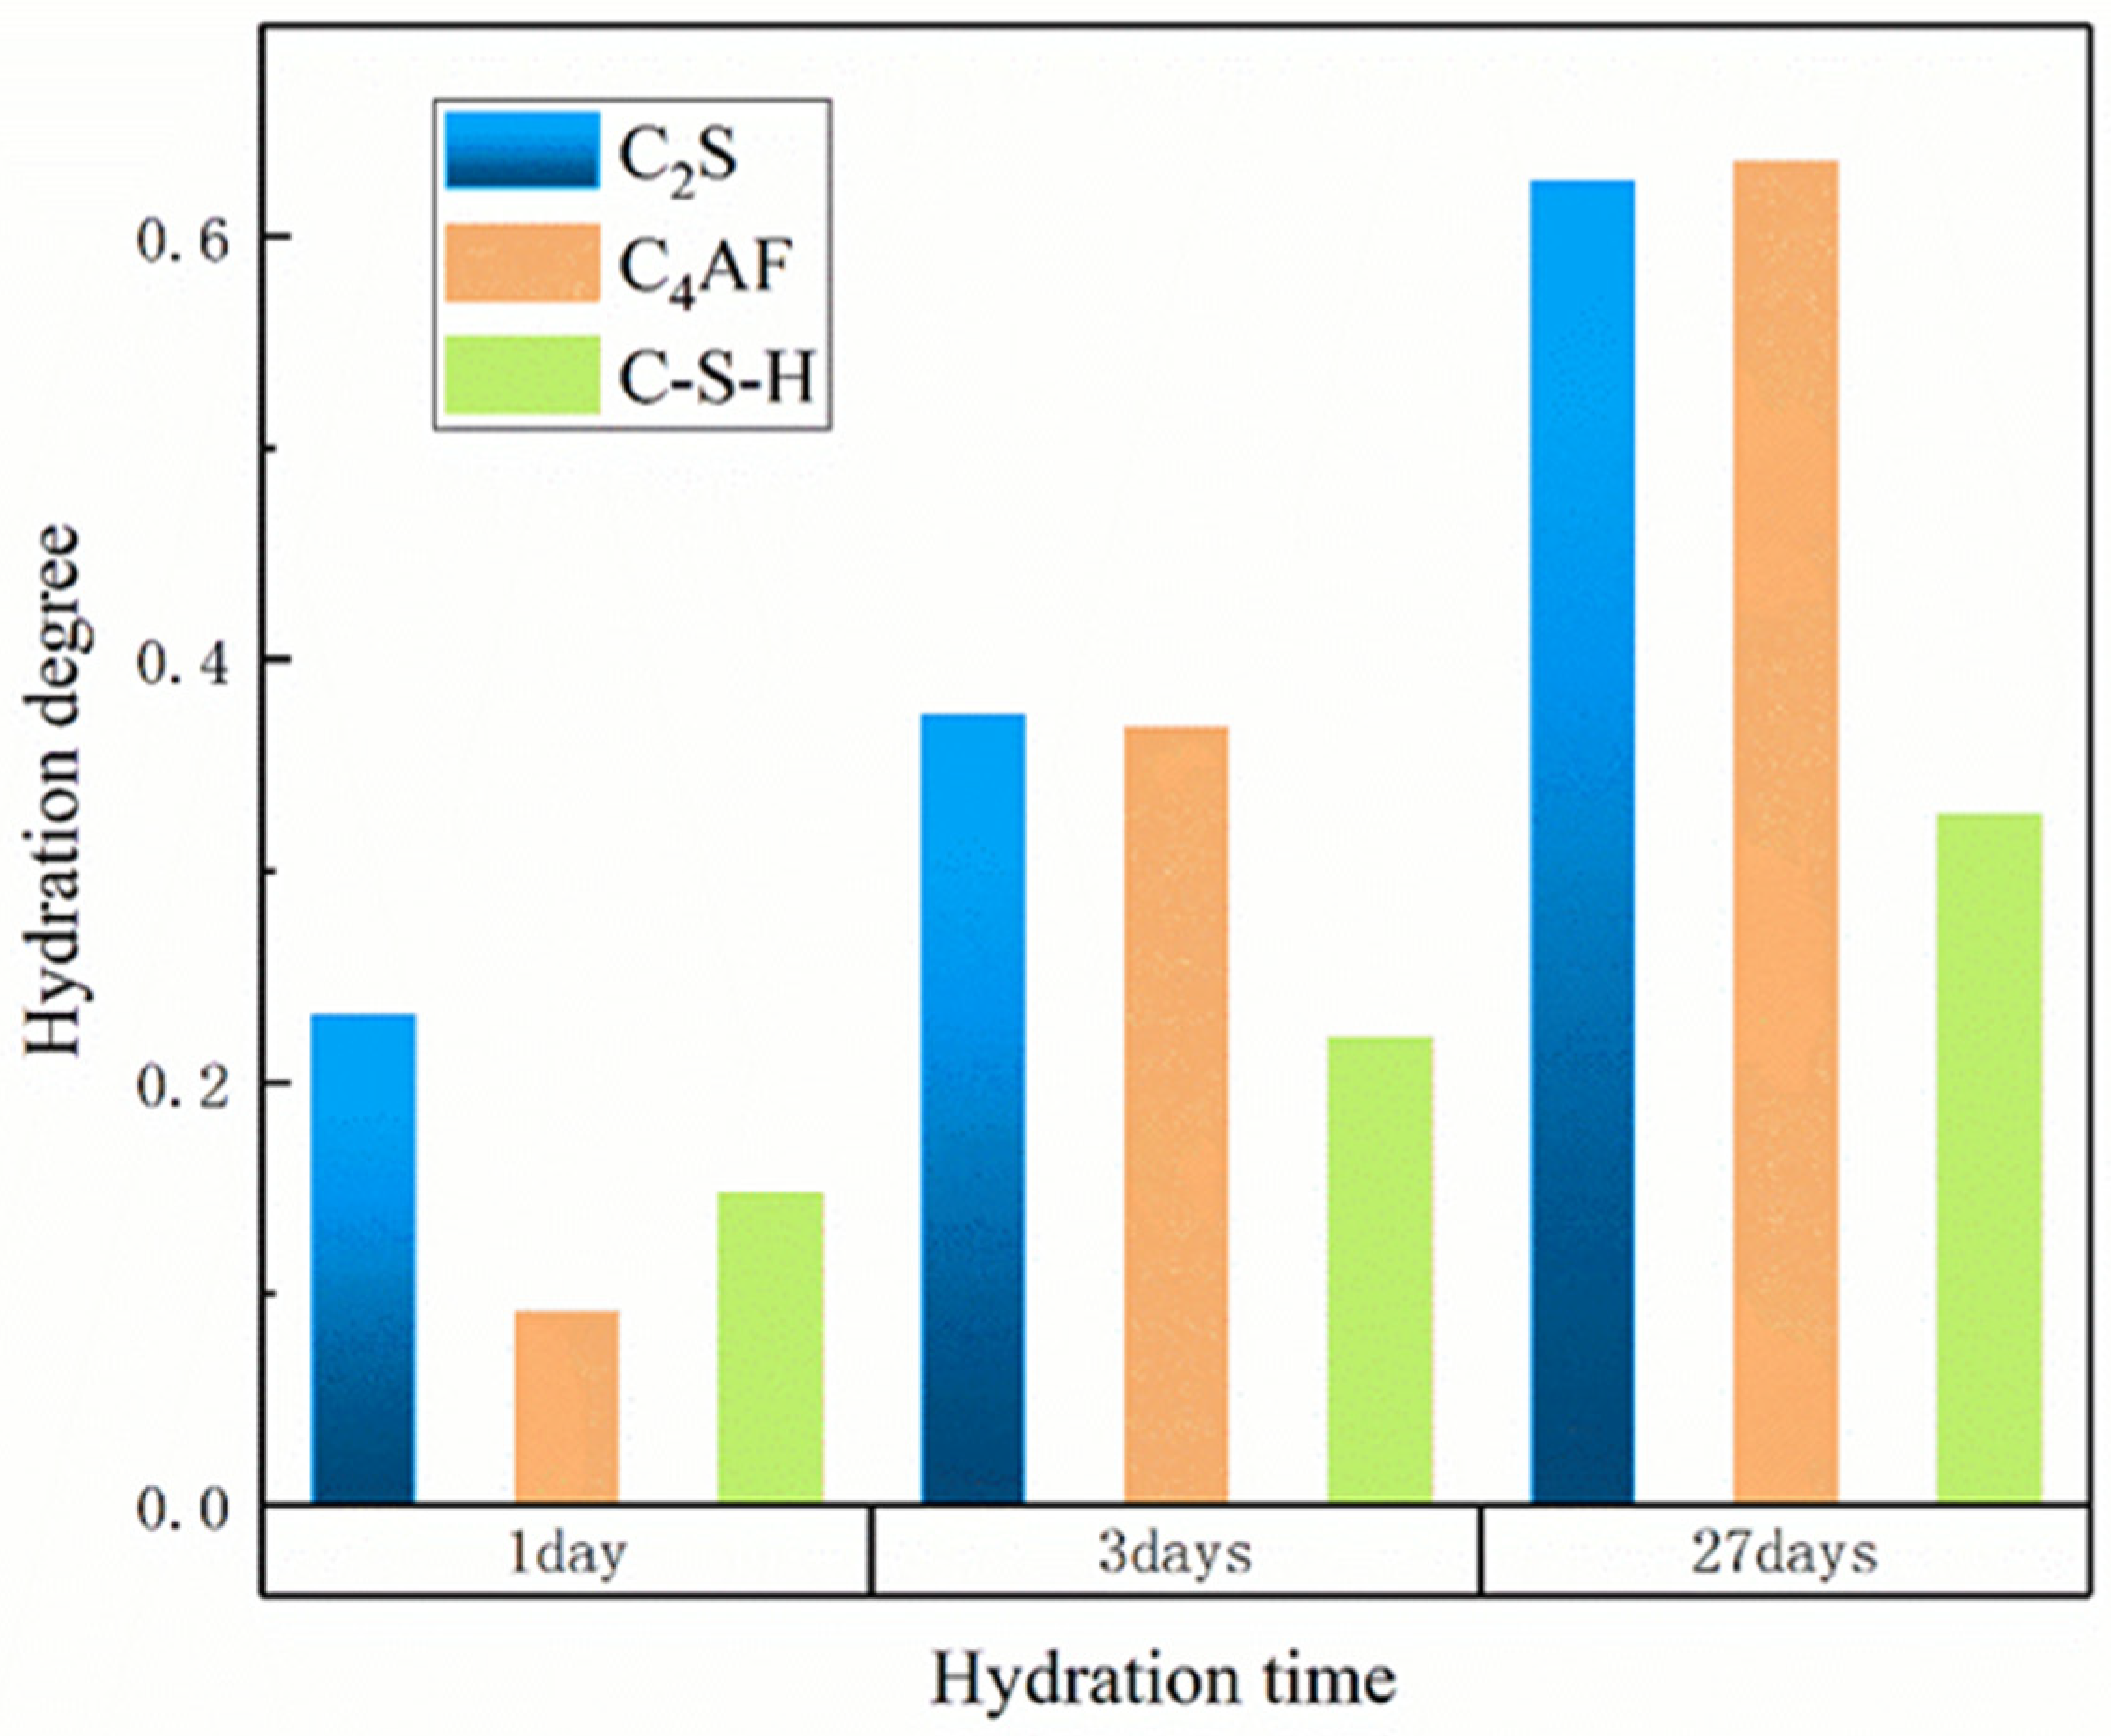
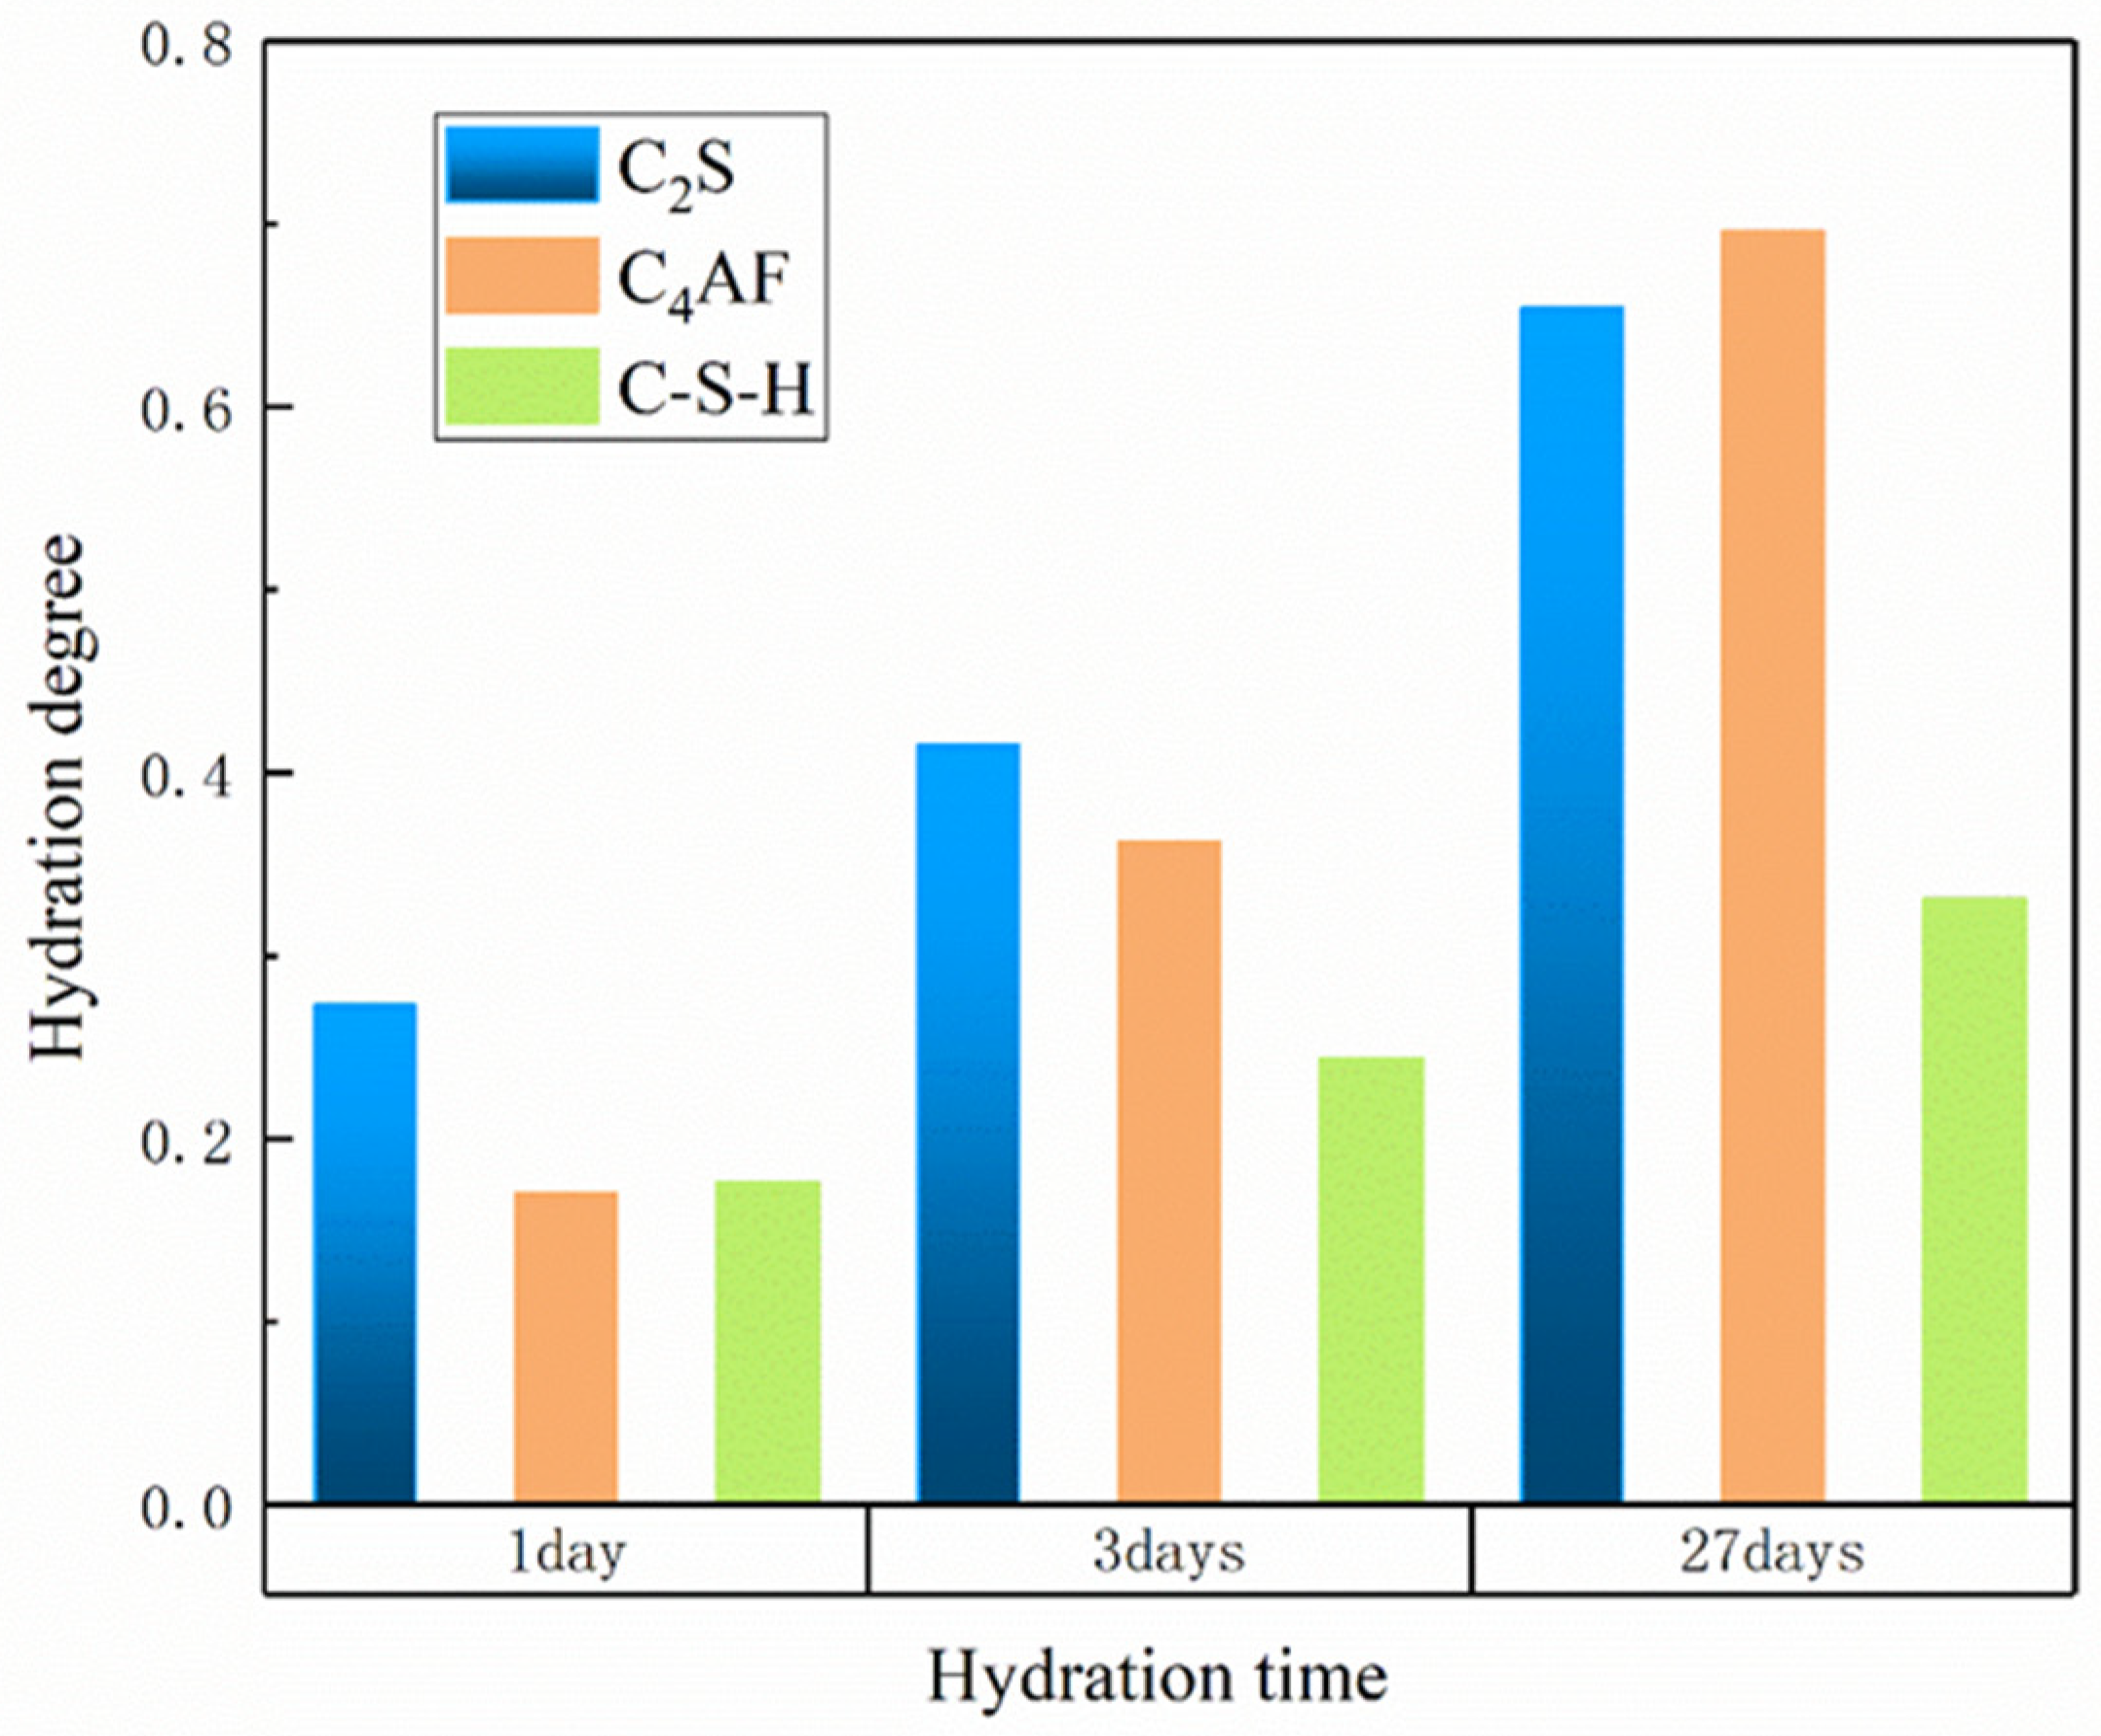
| C3S | 0.261 | 0.457 | 0.771 | 0.377 | 0.567 | 0.825 | 0.432 | 0.614 | 0.846 | 0.534 | 0.692 | 0.879 |
| C2S | 0.231 | 0.373 | 0.614 | 0.273 | 0.415 | 0.621 | 0.293 | 0.434 | 0.622 | 0.331 | 0.469 | 0.625 |
| C3A | 0.206 | 0.381 | 0.742 | 0.338 | 0.538 | 0.820 | 0.408 | 0.605 | 0.849 | 0.550 | 0.711 | 0.891 |
| C4AF | 0.091 | 0.267 | 0.634 | 0.170 | 0.362 | 0.682 | 0.213 | 0.407 | 0.700 | 0.297 | 0.489 | 0.729 |
| Other unhydrated raw clinker | 0.124 | 0.331 | 0.525 | 0.274 | 0.415 | 0.568 | 0.328 | 0.454 | 0.584 | 0.418 | 0.515 | 0.609 |
| Hydrated products | ||||||||||||
| C-S-H | 0.177 | 0.263 | 0.377 | 0.211 | 0.288 | 0.376 | 0.226 | 0.298 | 0.374 | 0.250 | 0.311 | 0.371 |
| CH | 0.206 | 0.284 | 0.399 | 0.255 | 0.322 | 0.399 | 0.272 | 0.334 | 0.400 | 0.303 | 0.349 | 0.398 |
| Raw Clinkers | Color | Phases | Color |
|---|---|---|---|
| C3S | Red | Pore or water | Dark blue |
| C2S | Pink | Crystals a | Purple |
| C3A | Orange | Outer hydration product | Green |
| C4AF | Deep yellow | Inner hydration product | Light yellow |
| Other unhydrated raw clinker | Grey |
| Paste Notation | (%) | ||||
|---|---|---|---|---|---|
| WC0.4T5 | 23.33 | 0.3936 | 2.541 | 10.890 | 0.092 |
| WC0.4T15 | 18.45 | 0.3930 | 2.545 | 13.791 | 0.073 |
| WC0.4T20 | 16.60 | 0.4424 | 2.260 | 13.617 | 0.073 |
| WC0.4T30 | 13.97 | 0.4674 | 2.139 | 15.315 | 0.065 |
| WC0.5T5 | 32.91 | 0.4238 | 2.360 | 7.170 | 0.139 |
| WC0.5T15 | 28.13 | 0.4585 | 2.181 | 7.753 | 0.129 |
| WC0.5T20 | 25.66 | 0.4737 | 2.111 | 8.227 | 0.122 |
| WC0.5T30 | 22.23 | 0.5109 | 1.957 | 8.805 | 0.114 |
| Paste Notation | (%) | ||||
|---|---|---|---|---|---|
| WC0.4T5 | 13.41 | 0.5124 | 1.952 | 14.553 | 0.069 |
| WC0.4T15 | 10.87 | 0.5493 | 1.820 | 16.748 | 0.060 |
| WC0.4T20 | 10.36 | 0.5829 | 1.716 | 16.559 | 0.060 |
| WC0.4T30 | 9.32 | 0.6148 | 1.627 | 17.452 | 0.057 |
| WC0.5T5 | 22.49 | 0.5145 | 1.944 | 8.642 | 0.116 |
| WC0.5T15 | 19.34 | 0.5940 | 1.684 | 8.705 | 0.115 |
| WC0.5T20 | 18.12 | 0.6180 | 1.618 | 8.930 | 0.112 |
| WC0.5T30 | 16.11 | 0.6646 | 1.505 | 9.340 | 0.107 |
| Paste Notation | Porosity (%) | ||||
|---|---|---|---|---|---|
| WC0.4T5 | 6.00 | 0.8793 | 1.137 | 18.954 | 0.053 |
| WC0.4T15 | 5.91 | 0.9016 | 1.109 | 18.767 | 0.053 |
| WC0.4T20 | 5.94 | 0.9190 | 1.088 | 18.319 | 0.055 |
| WC0.4T30 | 5.99 | 0.9111 | 1.098 | 18.323 | 0.055 |
| WC0.5T5 | 11.52 | 0.9859 | 1.014 | 8.805 | 0.114 |
| WC0.5T15 | 10.36 | 1.0802 | 0.926 | 8.936 | 0.112 |
| WC0.5T20 | 9.90 | 1.1291 | 0.886 | 8.946 | 0.112 |
| WC0.5T30 | 9.13 | 1.2217 | 0.819 | 8.965 | 0.112 |
Disclaimer/Publisher’s Note: The statements, opinions and data contained in all publications are solely those of the individual author(s) and contributor(s) and not of MDPI and/or the editor(s). MDPI and/or the editor(s) disclaim responsibility for any injury to people or property resulting from any ideas, methods, instructions or products referred to in the content. |
© 2023 by the authors. Licensee MDPI, Basel, Switzerland. This article is an open access article distributed under the terms and conditions of the Creative Commons Attribution (CC BY) license (https://creativecommons.org/licenses/by/4.0/).
Share and Cite
Zhou, Y.; Li, W.; Peng, Y.; Tang, S.; Wang, L.; Shi, Y.; Li, Y.; Wang, Y.; Geng, Z.; Wu, K. Hydration and Fractal Analysis on Low-Heat Portland Cement Pastes Using Thermodynamics-Based Methods. Fractal Fract. 2023, 7, 606. https://doi.org/10.3390/fractalfract7080606
Zhou Y, Li W, Peng Y, Tang S, Wang L, Shi Y, Li Y, Wang Y, Geng Z, Wu K. Hydration and Fractal Analysis on Low-Heat Portland Cement Pastes Using Thermodynamics-Based Methods. Fractal and Fractional. 2023; 7(8):606. https://doi.org/10.3390/fractalfract7080606
Chicago/Turabian StyleZhou, Yifan, Wenwei Li, Yuxiang Peng, Shengwen Tang, Lei Wang, Yan Shi, Yang Li, Yang Wang, Zhicheng Geng, and Kai Wu. 2023. "Hydration and Fractal Analysis on Low-Heat Portland Cement Pastes Using Thermodynamics-Based Methods" Fractal and Fractional 7, no. 8: 606. https://doi.org/10.3390/fractalfract7080606
APA StyleZhou, Y., Li, W., Peng, Y., Tang, S., Wang, L., Shi, Y., Li, Y., Wang, Y., Geng, Z., & Wu, K. (2023). Hydration and Fractal Analysis on Low-Heat Portland Cement Pastes Using Thermodynamics-Based Methods. Fractal and Fractional, 7(8), 606. https://doi.org/10.3390/fractalfract7080606