Article

A Simplified Lattice Boltzmann Boundary Conditions for Gas Transport in Self-Affine Microchannels with an Inherent Roughness of in a Tight Reservoir

1
Laboratory of Enhanced Oil Recovery of Education Ministry, College of Petroleum Engineering, Northeast Petroleum University, Daqing 163318, China
2
Postdoctoral Research Center, Daqing Oilfield Co., Ltd., Daqing 163453, China
*
Author to whom correspondence should be addressed.
Fractal Fract. 2023, 7(8), 596; https://doi.org/10.3390/fractalfract7080596
Submission received: 6 July 2023 / Revised: 28 July 2023 / Accepted: 31 July 2023 / Published: 2 August 2023

Abstract

:
A simplified method of determining lattice Boltzmann boundary conditions based on self-affine microchannels with an inherent roughness in a tight reservoir is presented in this paper to address nonlinear efficiency problems in fluid simulation. This approach effectively combines the influence of rough surfaces in the simulation of the flow field, the description of L-fractal theory applied to rough surfaces, and a generalized lattice Boltzmann method with equivalent composite slip boundary conditions for inherent roughness. The numerical simulations of gas slippage in a two-dimensional plate model and rough surfaces to induce gas vortex reflux flow are also successfully carried out, and the results are in good agreement with the simulation results, which establishes the reliability and flexibility of the proposed simplified method of rough surfaces. The effects of relative average height and fractal dimensions of the rough surfaces under exact boundary conditions and equivalent coarsened ones are investigated from three perspectives, namely those of the average lattice velocity, the lattice velocity at average height position at the outlet, and the coefficient of variation for lattice velocity at average height position. It was found that the roughness effect on gas flow behavior was more obvious when it was associated with the enhanced rarefaction effect. In addition, the area of gas seepage was reduced, and the gas flow resistance was increased. When the fractal dimension of the wall was about 1.20, it has the greatest impact on the fluid flow law. In addition, excessive roughness of the wall surface tends to lead to vortex backflow of the gas in the region adjacent to the wall, which greatly reduces its flow velocity. For gas flow in the nanoscale seepage space, wall roughness hindered gas migration rate by 84.7%. For pores larger than 200 nm, the effects of wall roughness on gas flow are generally negligible.

1. Introduction

Unconventional oil and gas resources have the characteristics of large area continuous distribution, unclear traps, and unstable natural production capacity [1]. In recent years, it has become a hot topic in the global energy field. China is rich in unconventional oil and gas resources, and the recoverable resources are about three times that of conventional oil and gas. Among them, the large-scale development of tight sandstone gas is the most feasible presently [2]. Different from conventional natural gas reservoirs, tight sandstone gas reservoirs have experienced strong compaction, calcareous cementation, and siliceous cementation during the hydrocarbon accumulation process. A tight gas reservoir is dominated by micropores and nanopores, and the main throat radius is in the range of 25 to 700 nm, which directly affects the gas flow [3,4,5]. Micro- and nanochannels can reduce intermolecular collisions and enhance molecule–wall collisions. Darcy’s law is invalid for the description of gas flow behaviors in these nanopores, as the diameters of the nanopores are very close to the mean free path of sandstone gas molecules [6]. The study of the microscale effect was originally about the gas flow in micropipes, and the previous work in this area was mainly focused on the study of the resistance coefficient of gas in micropipes. Knudsen first performed preliminary experimental work on the dynamics of rarefied gases and defined the ratio of the mean free path of gas molecules to the size of the flow characteristics as the Knudsen number (Kn) [7]. According to the Knudsen number Kn, there are four main mass transfer mechanisms for gas in porous media [8]: continuous flow (Kn < 0.01), where Darcy’s law is still applicable; slip flow (0.01 < Kn < 0.1), where the slip effect should not be neglected; transition flow (0.1 < Kn < 10), where the rarefaction effect must be taken into account, and the continuum assumption is nearly invalid; and free molecular flow (Kn > 10) where molecular-wall collisions mainly dominate the gas flow. The Knudsen number in the nanopores of a tight sandstone gas reservoir matter ranges from 0.001 to 1 [9]. Therefore, the multiple flow mechanisms of slip flow and continuous flow for tight sandstone gas exist simultaneously, a factor that should be carefully investigated. At this flow space scale, the flow characteristics of sandstone gas reservoirs differ from those of conventional reservoirs, and it is necessary to consider the effects of microscale effects, detachment effects, compression effects, and dense gas effects.
For conventional oil and gas reservoirs, the influence of pore wall roughness on pore-throat size can be almost ignored. However, in tight gas reservoirs, the influence of wall roughness cannot be ignored [10,11]. On the one hand, it produces additional resistance to gas flow, and on the other hand, in micro- and nanothroats, wall roughness also affects the cross-sectional area of the seepage. A typical characteristic of tight porous media is that wall effects have a more prominent influence on fluid flow action. The accurate description of rock wall morphology and additional resistance is of great significance, not only for the study of the fluid seepage mechanism but also for micro- and nanoscale numerical simulation [12,13]. However, it is difficult to accurately describe tight porous media due to the complex wall roughness of the morphology and the strong randomness of structural changes. Fortunately, as the variation in the height of the wall surface in actual core samples can be obtained by experimental tests, it is possible to describe the wall roughness of the morphology in tight porous media. Since Mandelbrot’s [14] introduction of the concept of the fractal, fractal theory has been applied in many fields. It is used in studies of oil and gas to describe the complexity and irregularity of the microscopic pore-throat structures within sandstones to avoid the complexity of quantitative characterization [15,16,17]. Johnson et al. [18] introduced the term “fractal” to describe the roughness of the pore surface and to calculate a compensation for the viscous attenuation in porous media caused by this roughness. Since then, many scholars have applied the fractal method to study the surface roughness on fluid flow characteristics. Chan et al. [19] proposed that the Weierstrass–Mandelbrot function can be used to adopt self-affine roughness almost at full scale. By studying the flow characteristics of non-Newtonian fluids through cylindrical pipes with self-similar wall roughness characteristics, Bouchendouka et al. [20] proposed the influence of self-similar structures on the rheological behavior of non-Newtonian fluids. Correspondingly, there is another similar work, which describes the roughness of pipe walls by fractal dimension, and analyzes the influence of roughness on the flow characteristics of non-Newtonian fluids [21]. In addition to the fractal dimension, there are some advanced fractal parameters, such as surface entropy, fractal succolarity, and fractal lacunarity [22]. Surface entropy is used to describe the height distribution homogeneity, which influences the surface structure and surface tension by the action of a chemical agent. Fractal succolarity refers to the intercommunication in a surface [23], which can be regarded as a permeable film, and is caused by penetration into another layer. Fractal lacunarity can be understood as the quantization of the entire void space as a function of scale [24]. The lower the value of fractal lacunarity, the more uniform the entire void space.
The flow space of tight sandstone gas reservoirs is narrow, and the corresponding micro/nanopore-media gas transmission experiments are difficult, and the correctness of the experimental results is not guaranteed. However, conventional numerical simulation methods are difficult to accurately characterize the gas flow patterns at the micro/nanoscale. The molecular dynamics (MD) method [25], the dissipative particle dynamics method, and direct simulation Monte Carlo [26,27] method have successfully been used to simulate the rarefied gas flow in the nanopores of shale gas reservoirs. However, as the simulation calculation is refined to the molecular scale, it becomes increasingly time-consuming. The lattice Boltzmann method (LBM), a widely popular mesoscopic kinetic approach, is efficient and saves time. However, the treatment of complex boundary conditions in a porous medium when gas flow is simulated should be noted [28,29,30]. The throat is at the nanoscale, which dominates the flow behavior of tight gas. In the nanoscale range, the Knudsen layer, which is formed over the surface of the rock wall when gas flows, cannot be neglected. In addition, in this layer, gas molecules collide more frequently, and the influence of the surface of the wall on the gas flow behavior becomes more prominent. In particular, the rarefaction effect has a nonnegligible influence on the boundary conditions in the process of micro- or nanoscale numerical simulation. Ho [31,32] proposed the discrete velocity method (DVM) to treat the rarefaction effect in a gas flow numerical simulation using LBM. Lim [33] quantitatively characterized the relaxation time under the influence of wall slip, based on the relationship between the Knudsen number, the molecular mean free path, and the characteristic scale. Tang [34] improved Lim’s model in relation to the above defects and obtained an accurate representation of the mathematical relationship between the Knudsen number and the relaxation time at the rock wall, which is widely used for its simplicity and accuracy. In particular, the boundary conditions of the LBM model were discussed. In Tang’s model, the combined boundary condition taking into account the specular diffuse reflection coordination coefficient was used to obtain the effective representation of the second-order wall slip velocity in the microchannel. However, the selection of the combined coefficient in this method had a significant influence on the results of the simulation. Guo [35,36] proposed an MRT LBM, taking the Knudsen layer effect into account, according to the characteristics of gas slip flow in micro- and nanochannels. The results showed that the wall confinement effect caused by the Knudsen layer had a nonnegligible influence on the prediction results, which should be considered in the modeling of gas micro-flow simulation. Many other LBM models have been proposed for simulating gas flow behavior in micro- and nanochannels. Furthermore, gas adsorption, nonlinear flow, and the slip effect near the boundary in micro- and nanochannels have been considered in these models [37,38,39]. However, the influence of wall boundary microstructure on gas flow characteristics has not been directly considered in detail. In addition, most of the existing literature studies on the micro- and nanoscale flow simulation of unconventional natural gas are focused on simple straight channels or randomly generated porous media, while there are few reports on the effects of rough pore walls on flow. In micro- and nanochannels, the rough wall significantly changes the shape of the flow channel [40], and leads to the tortuous flow of the fluid, and the effect of internal friction is enhanced, which cannot be ignored. The method in this paper can apply the measured wall microstructure parameters to the model simulation process of the LBM method and to the LBM boundary equivalent treatment method, considering the wall roughness is given. By applying the results of this paper, the equivalent roughness coefficient of the LBM wall can be obtained by measuring the pore wall morphology of shale, and the calculation ability of LBM can be improved.
In this study, we put forward a novel method for improving the generalized LB model, with an equivalent boundary condition. The novelty of this study relates to the employment of the L-fractal system in characterizing the equivalent boundary conditions of rough wall morphology in microchannels while taking into account the roughness effect. First, L-fractal theory is proposed to describe the wall morphology of tight porous media. Then, we establish morphological description models of the wall roughness in a microchannel with different fractal dimensions. Moreover, using L-fractal theory, an equivalent treatment method for pore-throat wall boundary conditions is proposed for the LBM. Finally, on the basis of the lattice model under the influence of inherent wall roughness, gas migration in the microchannel is simulated and discussed. The method proposed in this paper can apply the measured wall microstructure parameters to LBM and give an LBM-boundary-equivalent treatment method considering wall roughness, overcoming the limitations of LBM in simulating gas flow in tight reservoirs.

2. Model Description

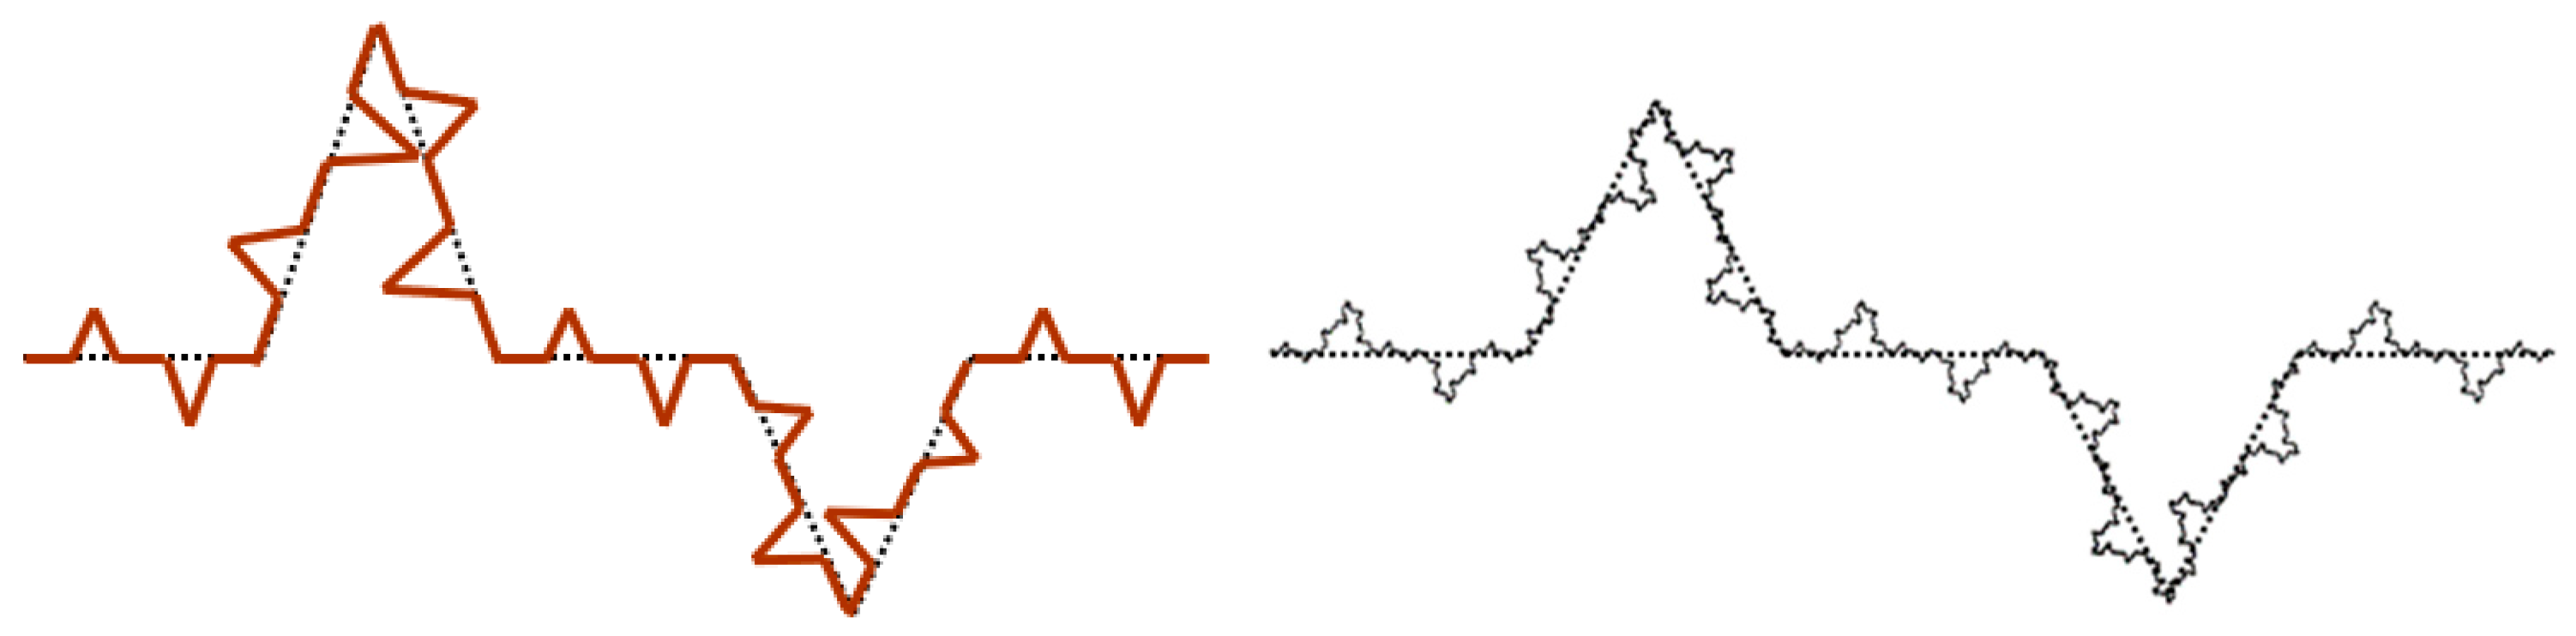
2.1. Inherent Wall Roughness Description Model-Based on Fractal Theory

By applying fractal L-system method, the surface roughness of porous medium inside real rock is equivalently characterized. In other words, the roughness of the surface of the porous medium measured by the actual method is added to the numerical simulation at the micro scale in a modeled way. The equivalent method involves the boundary conditions of the simulation process being equivalent, including the effects of slippage effect, boundary Knudsen layer, and non-ideal dense gas. To describe and characterize the complex characteristics of the surface morphology of a tight porous media wall, the basic unit of the surface morphology of a microchannel wall is taken to be a pattern formed by a generator after several iterations on the basis of the fractal L-system method. The fractal L-system [41] method is taken to describe the contour of the microchannel wall surface morphology to reflect the concave, convex, and uneven characteristics on the wall surface in the microchannel of a tight sandstone reservoir.
We assume that the L-system generator adopted in this paper is in the form of F-F++F-F+F--F+F, where F stands for forward unit, and − and + represent rotation in different directions. When describing the characteristics of the wall surface morphology in the microchannel of a tight sandstone reservoir, it should be noted that the step length and the rotating angle of generation are not always the same. To express and simulate or calculate the process in a more convenient way, a corner mark is added to all forward units and rotation units, that is, the form of the generator unit is symbolically expressed as Equation (1):
F m F u u + u + F u u F m u + F d d d F d d + F m d
The generator surface morphology is shown in Figure 1.
Where the forward unit Fm constitutes the horizontal part of the generator graph, and its step length is 1 (dimensionless). The forward unit Fu constitutes the upper convex part of the generator graph, and its step length is Lu (dimensionless). The forward unit Fd constitutes the concave part of the generator graph, and its step length is Ld (dimensionless). The angles of the rotating units −u and +u are α u , the rotating angle of −d and +d of the rotating units are α d , where −denotes motion in the clockwise direction, and + denotes in the counter clockwise direction. The displacement length of the two Fu forward units and the two Fd forward units on the plane is guaranteed to be 1. According to the geometric relationships, the equations are as follows:
L u = 1 2 cos α u
L d = 1 2 cos α d
Therefore, the roughness profile of the wall morphology in the microchannel is given as follows: the generator is based on a transverse forward unit; a pattern formed after n iterations, in which the value of n should be large enough to meet the accuracy requirements; and n is equal to 5 or 6 in general. In each iteration, each later forward unit should be replaced by the generative unit pattern itself of the previous iteration. The shape following the first iteration is the basic form of the generator, as shown in Figure 1. The shapes that follow the second and third iterations are shown in Figure 2.
The iteration method based on a fractal L-system is as follows: First, an initializer, such as F, is assumed to be the basis of the iteration. Next, all of the basic units in the current production are replaced by generating units to form the production unit after the first iteration. Finally, the previous step is repeated until the difference between the shape formed and the shape of the last iteration is less than the set accuracy.
To describe the roughness profile of the wall morphology in the microchannel, after each forward unit is replaced iteratively, the replaced forward unit corner mark is attached to the new forward unit’s corner. However, the rotation unit is not replaced. The production expression after the first iteration is FmuFu+u+uFuuFm+dFdddFd+dFm. Then, the production formula following the second iteration is as follows:
FmmuFum+u+uFum−Fmm+dFdmddFdm+dFmmuFmuuFuu+u+uFuuuFmu+dFduddFdu+dFmu+u+uFmuuFuu+u+uFuuuFmu+dFduddFdu+dFmuuFmmuFum+u+uFum−Fmm+dFdmddFdm+dFmm+dFmduFud+u+uFuduFmd+dFddddFdd+dFmdddFmduFud+u+uFuduFmd+dFddddFdd+dFmd+dFmmuFum+u+uFum−Fmm+dFdmddFdm+dFmm.
After the third and later iterations, the production is more complex, and it is not further described here. Following this process, the fractal pattern formed represents the roughness profile of the wall morphology, where one side is the wall surface, and the other side is the microchannel part. According to the principle of generating the roughness of the morphology in the microchannel using the fractal L-system above, the step length of the ith forward unit after n iterations is deduced in Equation (4).
L ( i , n ) = 5 n L u n u L d n d
where nu is the number of u in the corner mark of the ith forward unit, and nd is the number of d in the corner mark of the ith forward unit.
From the definition of a fractal dimension, the fractal dimension of the wall roughness in the microchannel by an L-system is obtained as follows:
D L = ln ( 3 + 2 L u + 2 L d ) ln 5
Because no random parameters are involved in this method of characterization of wall roughness morphology according to the fractal L-system, the rough wall surface has a definite shape. Therefore, the only parameters that can control its morphology are the convex and concave forward unit steps, Lu and Ld, respectively, on the generator.
The specific method of determining the fractal dimension of the actual core from tight sandstone reservoirs is as follows: The core of tight sandstone gas reservoirs is sampled. Then, according to the fractal self-similar property, the fractal dimension of the shape of the fresh fracture surface of the rock obtained by the plane acquisition method [42] can be considered to represent the dimension of the microchannel wall surface morphology. The following condition is assumed: The rough surface description model of the wall morphology by the fractal L-system in the microchannel is consistent with the maximum and average heights of the overall convexity of the fresh fracture surface with a tight sandstone core, that is, there is such a similarity. The corresponding relationship is seen in Equations (6) and (7).
h u + h d = β L H m
h d = β L H a
where hu represents the height of the ^ shape from two Fu in the generator of the fractal L-system roughness of the morphology in microchannel (dimensionless), and hu is equal to 0.5 tanαu (dimensionless). hd gives the depth of the V shape of the two Fu in the generator of the fractal L-system roughness of the morphology in the microchannel (dimensionless), and hd is equal to 0.5 tanαd (dimensionless). Hm denotes the height between the maximum concave and convex positions of the fresh fracture surface of the rock measured directly in an experiment (×10−9 m). Ha denotes the overall average height of the rough surface morphology obtained by actual measurement (×10−9 m). Furthermore, we define the ratio of Ha to the characteristic length of the flow field as the relative roughness of the morphology of the wall surface. There is no definite mathematical relationship between Hm and Ha. βL is defined as the length similarity ratio between the surface roughness of the morphology according to the fractal L-system and the actual wall surface morphology in the microchannel (dimensionless).
The fractal dimension DL of the rough surface of the morphological model using a fractal L-system in the microchannel should be equal to the measured fractal dimension Dr of the actual surface morphology of the sandstone reservoir rock. Using the formulas above, we obtain Equation (8).
D r = ln ( 3 + 2 β L 2 ( H m H a ) 2 + 0.25 + 2 β L 2 H a 2 + 0.25 ) ln 5
Equation (8) describes the similarity ratio βL. The fractal dimension Dr of the rough surface morphology in the microchannel, the maximum height of pore surface Hm, and the average height of the pore surface Ha can be obtained from the measurement of reservoir rock, making them quantifiable. The definite expression of βL is difficult to obtain. Using numerical analysis, βL should be solvable within in a reasonable range for each parameter. The numerical solution of βL could be obtained by dichotomous programming. Meanwhile, negative solutions need to be dropped.
The values for both Hm and Ha can be directly tested experimentally. According to Equation (8), if Hm is 0.2 × 10⁻⁹ m and Ha is 0.1 × 10⁻⁹ m, we can obtain the relative parameters in a fractal L-system corresponding to the fractal dimension conditions shown in Table 1.
Due to the limitations of the concave depth and the convex height of the rough wall surface in the microchannel, the per unit length of wall surface in a fractal L-system is limited. In addition, the morphology of the wall surface should be composed of an infinite number of units of length in a fractal L-system, connected end-to-end. According to the geometric relationship, the per unit length in the fractal L-system is expressed as follows:
l L = 5 β L
where lL is the wall length of a unit in a fractal L-system in the microchannel (dimensionless).
Table 1 shows that as the fractal dimension increases, the length similarity ratio βL gradually increases, and the wall length unit of fractal L-system decreases accordingly. According to the proposed model of wall surface morphology using the fractal L-system, the wall surface morphology under different wall fractal dimensions can be drawn as shown in Figure 3. In addition, only the lower part of the physical model is shown in this schematic diagram. That is, the bottom edge is the roughness wall surface, and the upper part is the flow space of the bulk phase fluid in the microchannel.
In relation to Equation (8) and according to Figure 3, the wall surface morphology at different fractal dimensions has the same maximum height and maximum depth, consistent with the basic assumptions of the model. Equation (5) is a formula for calculating the self-similar dimension using the fractal method, based on the definition formula of the L-system dimension. Thus, the greater the fractal dimension of the obtained morphology of the wall surface, the more complex the wall contour, and the more details of the wall surface can be seen after magnification. This law is in accordance with the basic characteristics of fractal theory. This analysis confirms the reliability of the fractal L-system method to describe the wall surface morphology under the influence of the inherent roughness of a tight sandstone gas reservoir.

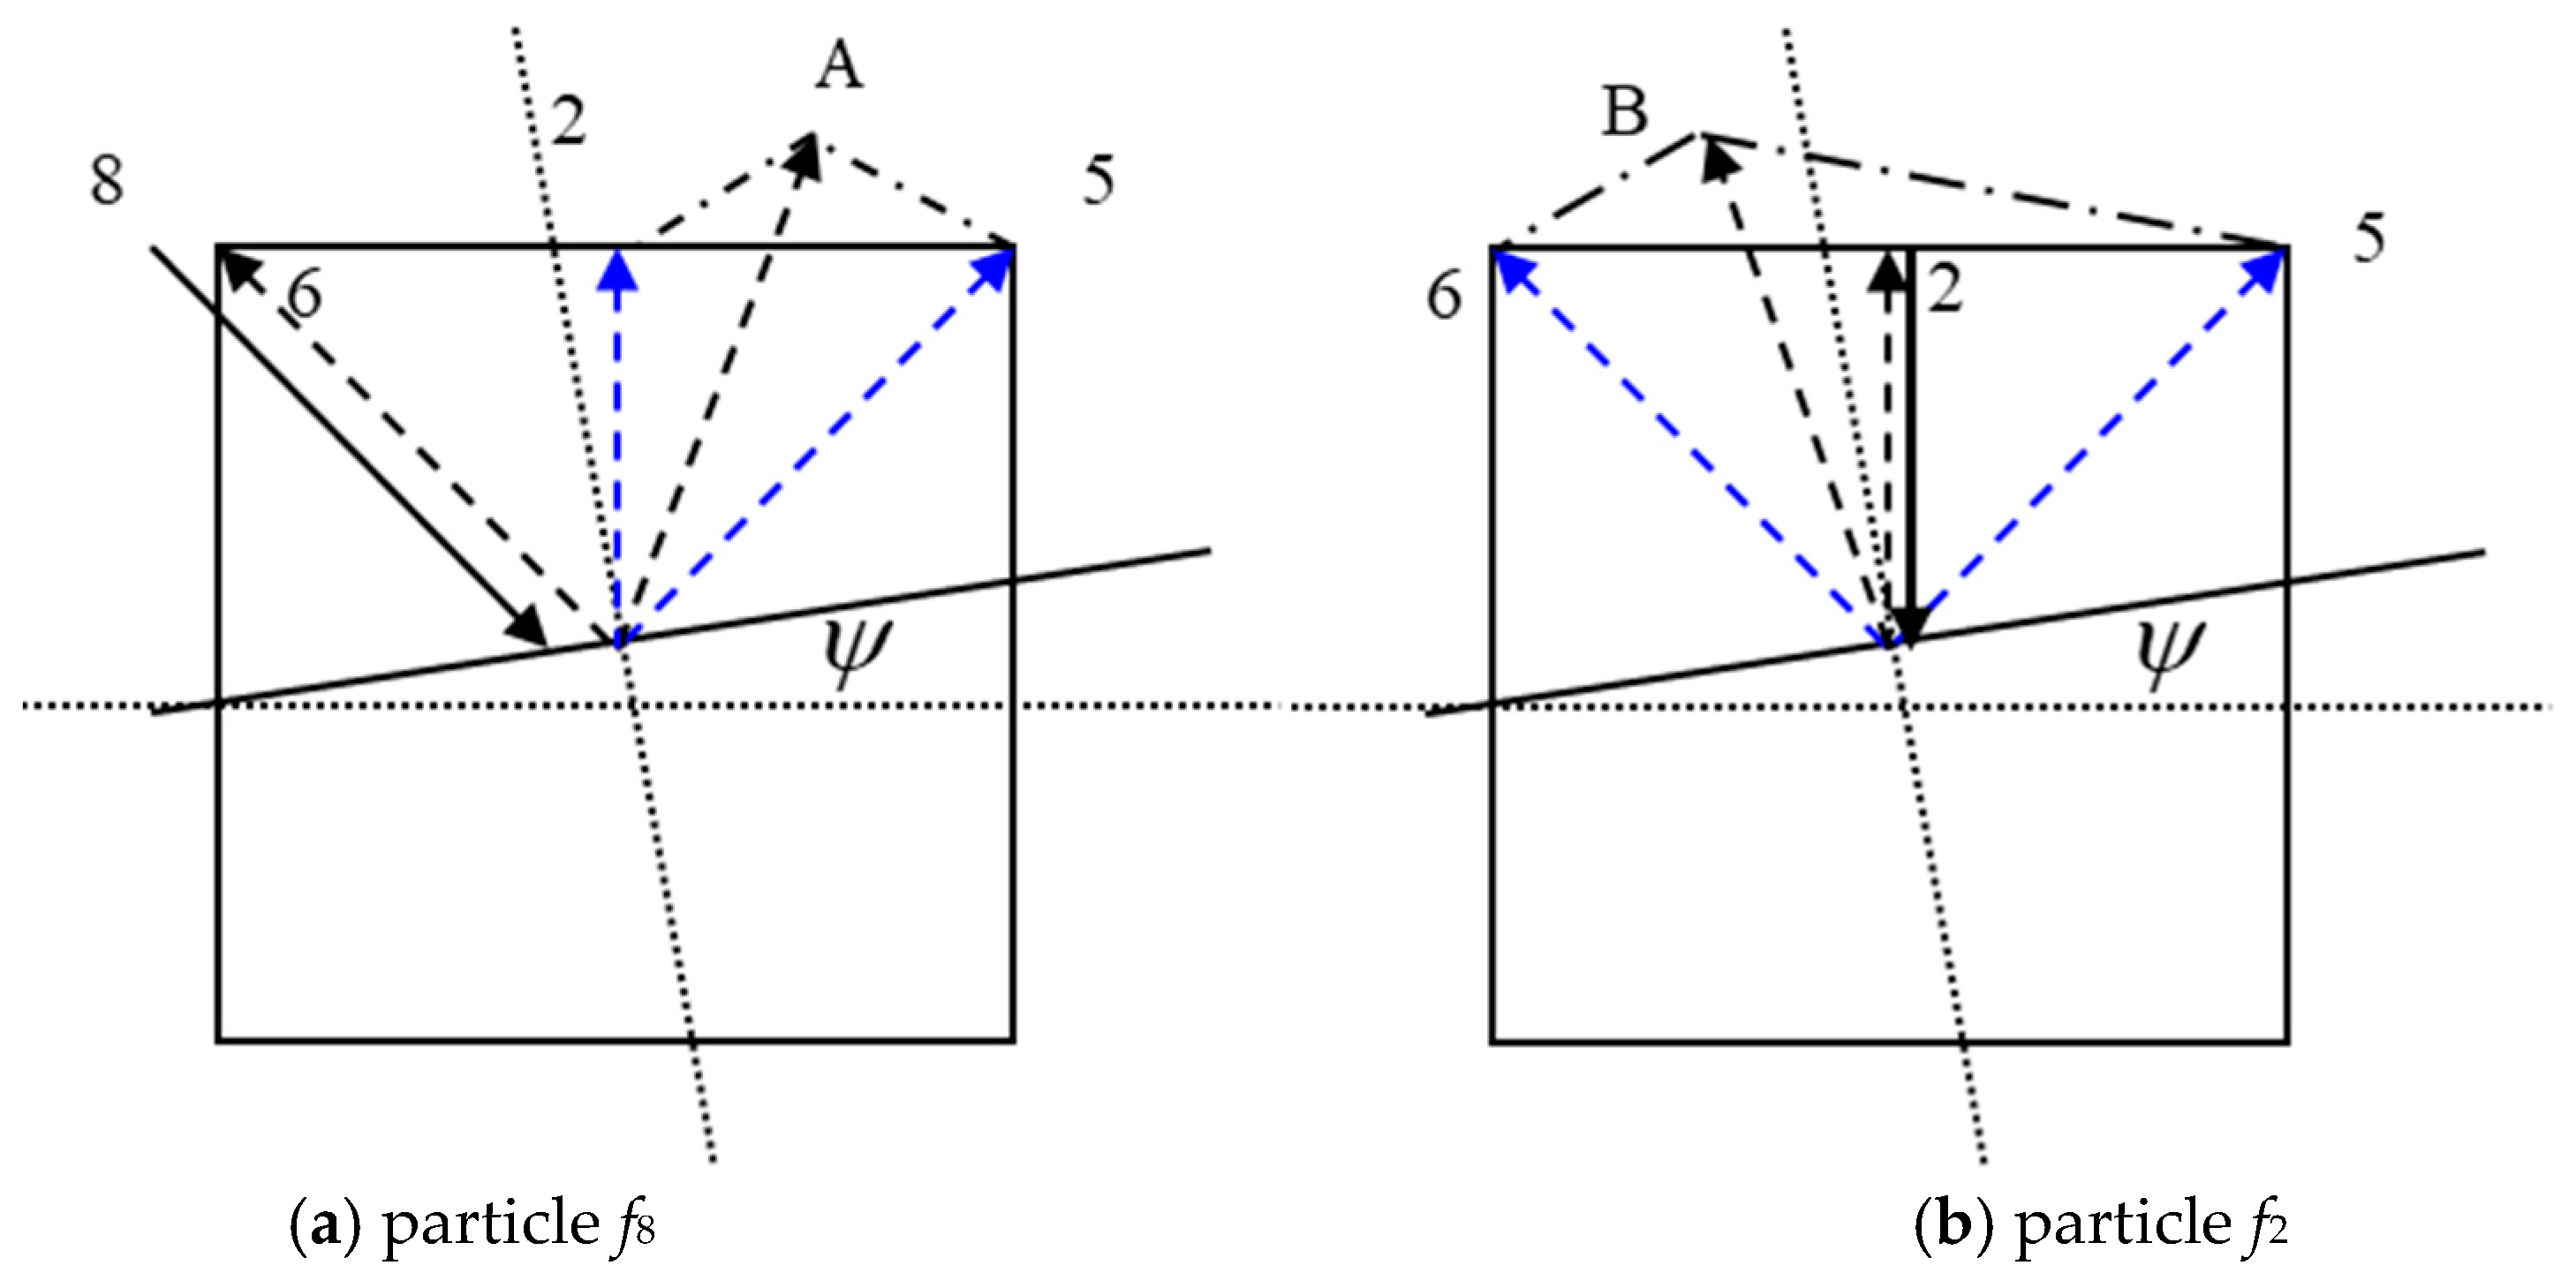
2.2. The LBM Equivalent Boundary Conditions Considering Inherent Wall Roughness

In the lattice model with a large number of grids, the influence of the concave–convex morphology of the wall surface and its inherent roughness on the gas flow in the microchannel can be well presented. However, when simulating gas flow in a reservoir with a low porosity to accurately obtain its flow characteristics, due to the limitation of the number of lattices, if each pore diameter were about ten grids, and the total number of grids were to reach 1 trillion, the simulation calculation could not be completed successfully. Therefore, we propose a coarse-boundary mesh method to consider the influence of the roughness of the wall surface and obtain its boundary conditions.
In general, the conventional boundary treatment methods of the LBM model are the rebound method and the scattering method. In the LBM described above, the treatment of the wall boundary conditions is coordinated by the combination of the completely forward reflection and the completely backward reflection of the wall. Under the condition of wall roughness, the gas particles near the surface of the wall collide with the irregular porous wall at different incident angles, and a scattering of uncertain direction occurs. According to the assumption of the LBM model, the bounce rule for particle collision with the wall surface is a set of reflections taking place in the center direction of three adjacent grids, corresponding to the incident point shown in Figure 4.
Similarly, according to the direction of reflection of the particles, the direction of the discrete velocity is also finite. In a larger gas flow microchannel, the scattering coefficients in each direction in the closed boundary condition are also determined parameters. However, the pore throat of the tight sandstone gas reservoir is very small, and the irregular wall roughness with a concave–convex morphology occupies a large part of the space of the pore throat. Meanwhile, with the same lattice characteristic length, the surface morphology of the wall is complex, and the reflection angle of the particle collision with the wall surface changes frequently, as shown in Figure 5.
When the pore of a conventional reservoir is larger, the roughness of the wall of the pore has little influence on fluid flow, and the morphology for each grid of the wall surface is relatively consistent. The influence of wall roughness near the boundary on the fluid flow law in the LBM model can be effectively characterized by the determined scattering coefficient after the gas particles collide with the surface of the wall. In tight porous media, however, the characteristics of wall roughness in the microchannel have a great impact on the fluid seepage space, and the morphology of the wall surface in each boundary grid is obviously different. Therefore, the grid at the boundary of the LBM model in tight reservoirs must have different scattering coefficients, which are random, but the scattering coefficients at the determined location do not change over time.
The unknown particle distribution function on the general diffuse boundary can be expressed as shown in Equation (10):
f i ( x w ) = ( 1 r b ) f i ( S R ) ( x w ) + r b f i ( B B ) ( x w )
where f i ( S R ) ( x w ) and f i ( B B ) ( x w ) are the known distribution functions in the corresponding directions of the rebound scheme, and the mirror rebound scheme at compute node xw on the microchannel wall surface as follows:
f i ( B B ) ( x w ) = f i ( x w ) f i ( S R ) ( x w ) = f i ( x w )
where the direction −i is the opposite of direction i, and direction i’ is the mirror direction of direction i. Likewise, r b is the combination coefficient of the two above, whose value is between 0 and 1 (dimensionless). For the 2D plate model of microchannel, when the D2Q9 model is adopted, Equation (10) can be expressed as follows (taking the bottom edge boundary of the nanochannel as an example):
f 4 ( x , t ) = f 2 ( x , t ) f 7 ( x , t ) = r b f 5 ( x , t ) + ( 1 r b ) f 6 ( x , t ) f 8 ( x , t ) = r b f 6 ( x , t ) + ( 1 r b ) f 5 ( x , t )
According to Tang, the combination coefficient r b value of 0.7 has the greatest agreement with the experimental results. However, in the pore-throat structure of the tight sandstone gas reservoir, the direction of reflection of the fluid particles after colliding with pore-throat roughness wall may exist at all angles, and the fluid particles scatter in all directions. Therefore, a new treatment method of the equivalent boundary condition is proposed, which can be used to simulate the microscale migration of gas particles under the influence of the roughness wall that can simplify the coupling between the roughness wall and the slip boundary conditions. Let us suppose that under two-dimensional conditions, the distribution function for gas particles at the wall position satisfies the following equation (taking the bottom edge boundary of the microchannel as an example).
f 4 ( x , t ) = r 11 f 2 ( x , t ) + r 12 f 5 ( x , t ) + r 13 f 6 ( x , t ) f 7 ( x , t ) = r 21 f 2 ( x , t ) + r 22 f 5 ( x , t ) + r 23 f 6 ( x , t ) f 8 ( x , t ) = r 31 f 2 ( x , t ) + r 32 f 5 ( x , t ) + r 33 f 6 ( x , t )
Five line segments with different dip angles are seen on the generator unit graph in the microchannel of the tight reservoir, based on the fractal L-system. If the horizontal direction is considered to be 0°, then the five angles are 0°, αu, −αu, αd, and −αd. Their characteristic lengths are 3, Lu, Lu, Ld, and Lu, respectively. By setting B = ( 0 , α u , α u , α d , α d ) and C = ( 3 , L u , L u , L d , L d ) , these two matrices are angle set and length set, respectively. Then, bi and ci, respectively, represent the ith item in the set of angles or lengths.
According to the fractal L-system iteration rules, the total length of line segments with angle ψ after n iterations is as follows:
L ψ = 5 n x M j = 1 n c m j
where ψ = j = 1 n b m j , mj is any integer from 1 to 5, and x M is the total number of different combinations that can be formed after mj changes the order.
In the D2Q9 lattice model, taking the diagonal direction f8 and bottom direction f2 as examples, gas particles scatter when they collide with the wall surface at an angle of ψ to the horizontal direction as show in Figure 6.
Taking the reflection of particles colliding with the wall in the diagonal direction f8 as an example, after scattering, rb particles bounce back in the f6 direction, and (1 − rb) particles scatter in the direction of A, dispersing into the f2 and f5 directions. In the meantime, rb particles in the f2 direction bounce back along the f2 direction, and (1 − rb) particles scatter in the A direction, dispersing them into f5 and f6 directions. According to these assumptions and methods, by combining Equations (2), (3), (13) and (14), the scattering coefficient matrix is obtained when the length of the wall grid unit is exactly equal to the length of the lattice, as follows:
[ r i j ] = ( 1 + 2 ( r b 1 ) ( D r 1 ) τ D r ( 1 r b ) ( D r 1 ) τ D r ( 1 r b ) ( D r 1 ) τ D r ( 1 r b ) ( D r 1 ) τ D r r [ 1 ( 1 r b ) ( D r 1 ) τ D r ] ( 1 r ) [ 1 ( 1 r b ) ( D r 1 ) τ D r ] ( 1 r b ) ( D r 1 ) τ D r ( 1 r ) [ 1 ( 1 r b ) ( D r 1 ) τ D r ] r [ 1 ( 1 r b ) ( D r 1 ) τ D r ] )
where τ is equal to hmin/hmax (dimensionless), hmin is the minimum value of hu and hd (×10−9 m), and hmax is the maximum value of hu and hd (×10−9 m).
For the wall surface description model with LBM in the microchannel, the length of the lattice may not be equal to the integral multiple of the length of the L-system wall grid unit. That is, there is a wall grid that contains an incomplete L-system unit. In this case, the scattering coefficient matrix [rij] is different from the scattering matrix when the length of L-system wall grid unit is exactly equal to the length of the lattice. The scattering coefficients of all grid walls take r11 as the criterion. In an L-system wall surface unit, the average deviation between r11(x) of the scattering matrix and r11 of the whole L-system wall surface unit scattering matrix when the length of 1/n is taken as follows:
σ r 11 = r 11 [ 1 + C . V . ( n ) ]
where C . V . ( n ) is the coefficient of variation of the wall rotation angle ψ function, divided into n segments.
When a scattering coefficient matrix is assigned to each wall surface grid, an initial r11(x) value is first assigned to each grid with an ordinary random function. Then, the average value is adjusted according to the r11 of the scattering matrix of the single L-system wall surface element so that the average value of the entire boundary lattice is equal to the r11 of the scattering matrix of the single L-system wall surface unit. Furthermore, the variation coefficient of the scattering matrix r11(x) of each lattice is adjusted, where C . V . ( n l ) is the ratio of the wall surface unit length of a single L-system to the length of the lattice. For the three-dimensional LBM model D3Q19, because there is no velocity direction in the body diagonal direction, the three square sections in the model are the same as those in the 2D case, and the inherent roughness of the wall surface can also be calculated by the same method.
It is worth noting that the coarser model proposed above treats the discretization velocity of the LBM model equivalently by introducing a scattering coefficient matrix so that the coarser model with a lower lattice number can equivalently represent the fine lattice model. The size of the lattice of the coarsening model is related to the feature length of the flow space. For any given feature length, the corresponding reasonable range of the coarsening degree can be obtained. The coarsening degree of the model has a certain applicability, that is, there are upper and lower limits of the lattice size of the coarsening model. This limitation is determined by the equilibrium distribution mode of the LBM itself and the characteristic length of the flow field. On the one hand, according to the distribution of the particle equilibrium and particle velocity dispersion mode of the LBM method, the coarser model must be able to describe the flow law of the boundary fluid and bulk fluid in the flow field at the same time, and a coarser degree of lattice size should not be too large. That is, there is an upper limit to the lattice size in the direction perpendicular to particle migration. On the other hand, the simplification process of the inherent roughness of the wall surface is reflected by the scattering coefficient matrix of particles at the wall surface. According to the morphology of the wall surface roughness, the edge length of the lattice must be larger than the convex peak and concave valley of the inherent roughness unit of the wall surface before the method can be applied for coarsening. That is, the size of the coarsened model should not be too small, and the lattice size has a lower limit. However, in fact, the proportion of the lattice number in the flow direction as well as the vertical flow direction in the coarser model and the fine model is unchanged, and the vertical lattice size is determined by the characteristic scale of the flow field and the horizontal migration distance.

2.3. The Generalized LBM

Since tight sandstone gas reservoirs are characterized by obvious low porosity and low permeability, it is necessary to consider the effects of slippage effect, boundary Knudsen layer, and non-ideal dense gas. Therefore, the LBGK-D2Q9 model is adopted to establish a mathematical model of the nano- and microscale flow tight sandstone gas reservoir. The nano- and microscale effect on gas flow is investigated via a two-dimensional nine-velocity (D2Q9) lattice Boltzmann model [40,43,44,45], which has the following form:
f i ( x + e i δ t , t + δ t ) f i ( x , t ) = 1 τ [ f i ( e q ) ( x , t ) f i ( x , t ) ]
where f i ( x . t ) is the particle distribution function, e i is the particle velocity in the i direction, f i ( e q ) ( x , t ) is the equilibrium distribution function, and τ denotes the relaxation time of the BGK model. For the D2Q9 model, the discrete lattice velocity e i is given as
{ e i = ( 0 , 0 ) i = 9 e i = c [ cos ( i 1 ) π 2 , sin ( i 1 ) π 2 ] i = 1 , 2 , 3 , 4 e i = 2 c [ cos ( 2 i 1 ) π 4 , sin ( 2 i 1 ) π 4 ] i = 5 , 6 , 7 , 8
and f i ( e q ) ( x , t ) is given as
f i ( e q ) = ρ ω i [ 1 + e i u c s 2 + ( e i u ) ( e i u ) 2 c s 4 u u 2 c s 2 ]
where w0 = 4/9, w1–4 = 1/9, w5–8 = 1/36, and c s 2 = c 2 / 3 with c = δ x / δ t . The density ρ and velocity u can be obtained by
ρ = i = 0 8 f i u = 1 ρ i = 0 8 e i f i

2.3.1. Compressibility of Gas

To reflect the influence on the gas density in nanochannels, we characterized changes in fluid viscosity by considering the relaxation time of the compressed fluid, as follows:
τ = 1 2 + ρ r e f ρ ( τ 1 2 )
where ρ r e f denotes the reference mass density, namely the fluid density of the model system under given temperature and pressure conditions. Thus, the kinetic viscosity of the fluid is as follows:
η = 1 3 ρ r e f c 2 ( τ 1 2 ) δ t
The uniform grid system of isothermal flow, exhibits the following equation:
K n out = π 24 ( 2 τ 1 ) ρ r e f ρ o u t H / δ x
That is, the relaxation time is:
τ = 1 2 + ρ o u t H / δ x K n o u t ρ r e f π / 6
where ρ o u t denotes gas density at the outlet of the nanoscale plate model, and Knout denotes the Knudsen number at the corresponding position. Under isothermal conditions, the product of the Kn number at any position x in the nanochannel and the pressure p(x) at the corresponding position is a constant value, as follows: Kn = Knout pout/p(x).

2.3.2. Rarefaction Effect

Using MD and taking into account the gas rarefaction effect and the wall truncation effect shown in Figure 7, the effective relaxation time of gas flowing in the nanochannel is as follows [45]:
τ * = ρ o u t ρ r e f 6 / π H δ x K n out Ψ ( K n out ) ( 1 + 0.5 b ρ o u t χ ) 2 + 0.5 χ
where Ψ is a monotone function about Kn and satisfies the equation lim K n 0 Ψ ( K n ) = 1 , and χ denotes the modified collision factor taking the gas rarefaction effect into account.

2.3.3. Treatment of Coupled Slip Boundary Conditions

In this subsection, the general combined boundary conditions introduced by Chai [46] is considered to describe and characterize the gas flow characteristics in tight porous media, rarefaction effect, and slip boundary. In addition, the tangential momentum regulation coefficient is introduced to characterize the proportion of completely diffuse reflection molecules in all incident molecules. The composite slip boundary conditions formed by the bounding scheme boundary and specular reflection boundary are as follows:
f i = r f i ( b ) + ( 1 r ) f i ( s )
where r denotes the coefficient of proportion of the bounding part of the combined boundary, which is related to the given wall boundary conditions, lattice size, and Knudsen number. f i ( b ) denotes the partial distribution function of the rebound of the incident gas particle. f i ( s ) is the distribution function of the specular reflection of the incident gas particle.
According to lattice theory, the unknown distribution functions f2, f5, and f6 after particle collision at time t, and (the corresponding distribution function at the first layer of the boundary grid j = 1), are described as follows:
{ f 2 = f 4 * + 2 r ρ w 2 e 2 u w a l l ( x , y ) / c s 2 f 5 = r f 7 * + ( 1 r ) f 8 * + 2 r ρ w 5 e 5 u w a l l ( x , y ) / c s 2 f 6 = r f 8 * + ( 1 r ) f 7 * + 2 r ρ w 6 e 6 u w a l l ( x , y ) / c s 2
From the above studies on gas rarefaction effect theory and taking into account the influence of gas compressibility, according to the combination coefficient describing the slip boundary conditions, the combination coefficient r of the rebound part of tight gas particles colliding with solid wall and mirror emission can be obtained as follows:
r = 1 + ρ o u t χ 6 / π ρ r e f ( 1 + 0.5 b ρ o u t χ ) 2 [ ( δ x ) 2 4 H 2 K n out ψ ( K n out ) + A 1 + ( 2 A 2 8 ρ o u t 4 ( 1 + 0.5 b ρ o u t χ ) 4 χ 2 ρ r e f 2 π ) K n out ψ ( K n out ) ]
Different velocity models for particle transport of Knudsen fluid and bulk fluid on a wall must be created to characterize the slip boundary of nanoscale gas flow. Using the wall truncation effect of the modified molecular mean free path, combined with nanoscale flow, Guo [47] constructed the velocity model of second-order slip flow under boundary conditions, as follows:
u s l i p = A 1 ( λ * n u ) w a l l A 2 [ λ * ν ( λ * n u ) ] w a l l
where n denotes the unit normal vector pointing in the direction of fluid flow. A1 and A2 are two parameters related to the interaction between the gas and the solid wall, which can be expressed as follows:
A 1 = 2 σ σ ( 1 0.1817 σ )     A 2 = 1 π + 1 2 A 1 2
As reported [48], when σ is 0.7, the fitting degree of the experimental results and the theoretical results are the best. If the tangential momentum regulation coefficient σ = 0.7 is substituted into the above equation, A1 and A2 can be obtained, and the wall reflection combination coefficient r can also be identified. The above theoretical model and boundary conditions constitute a complete general model of two-dimensional rarefaction gas transport, considering the boundary slip effect.

3. Numerical Validations and Discussion

In this section, the performance of the simplified boundary condition describing wall roughness is examined first by simulating flow past a two-dimension plate that is flat from the perspective of different average wall heights and fractal dimensions. After that, the rock wall height and inherent roughness fractal dimension combined with different characteristic scale is simulated by considering the difference of gas flow velocity.

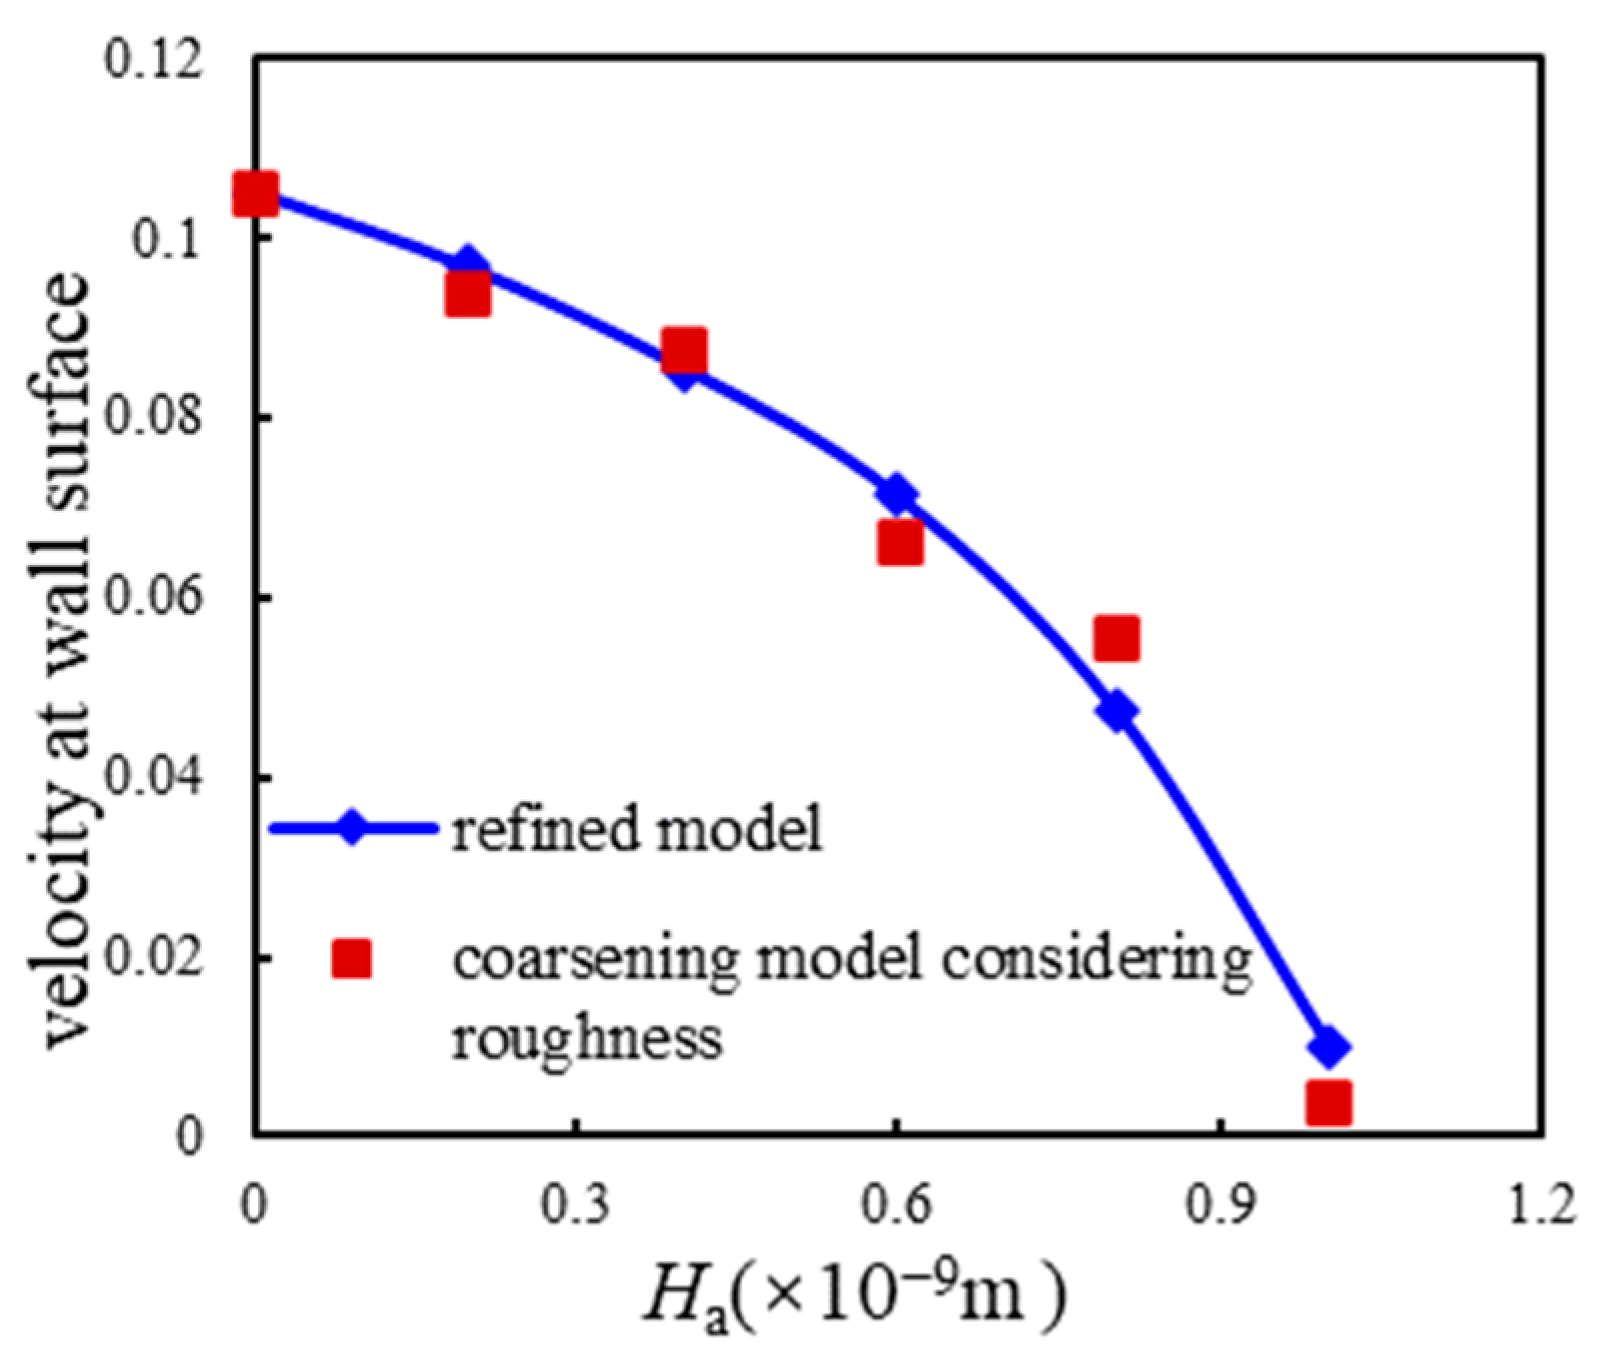
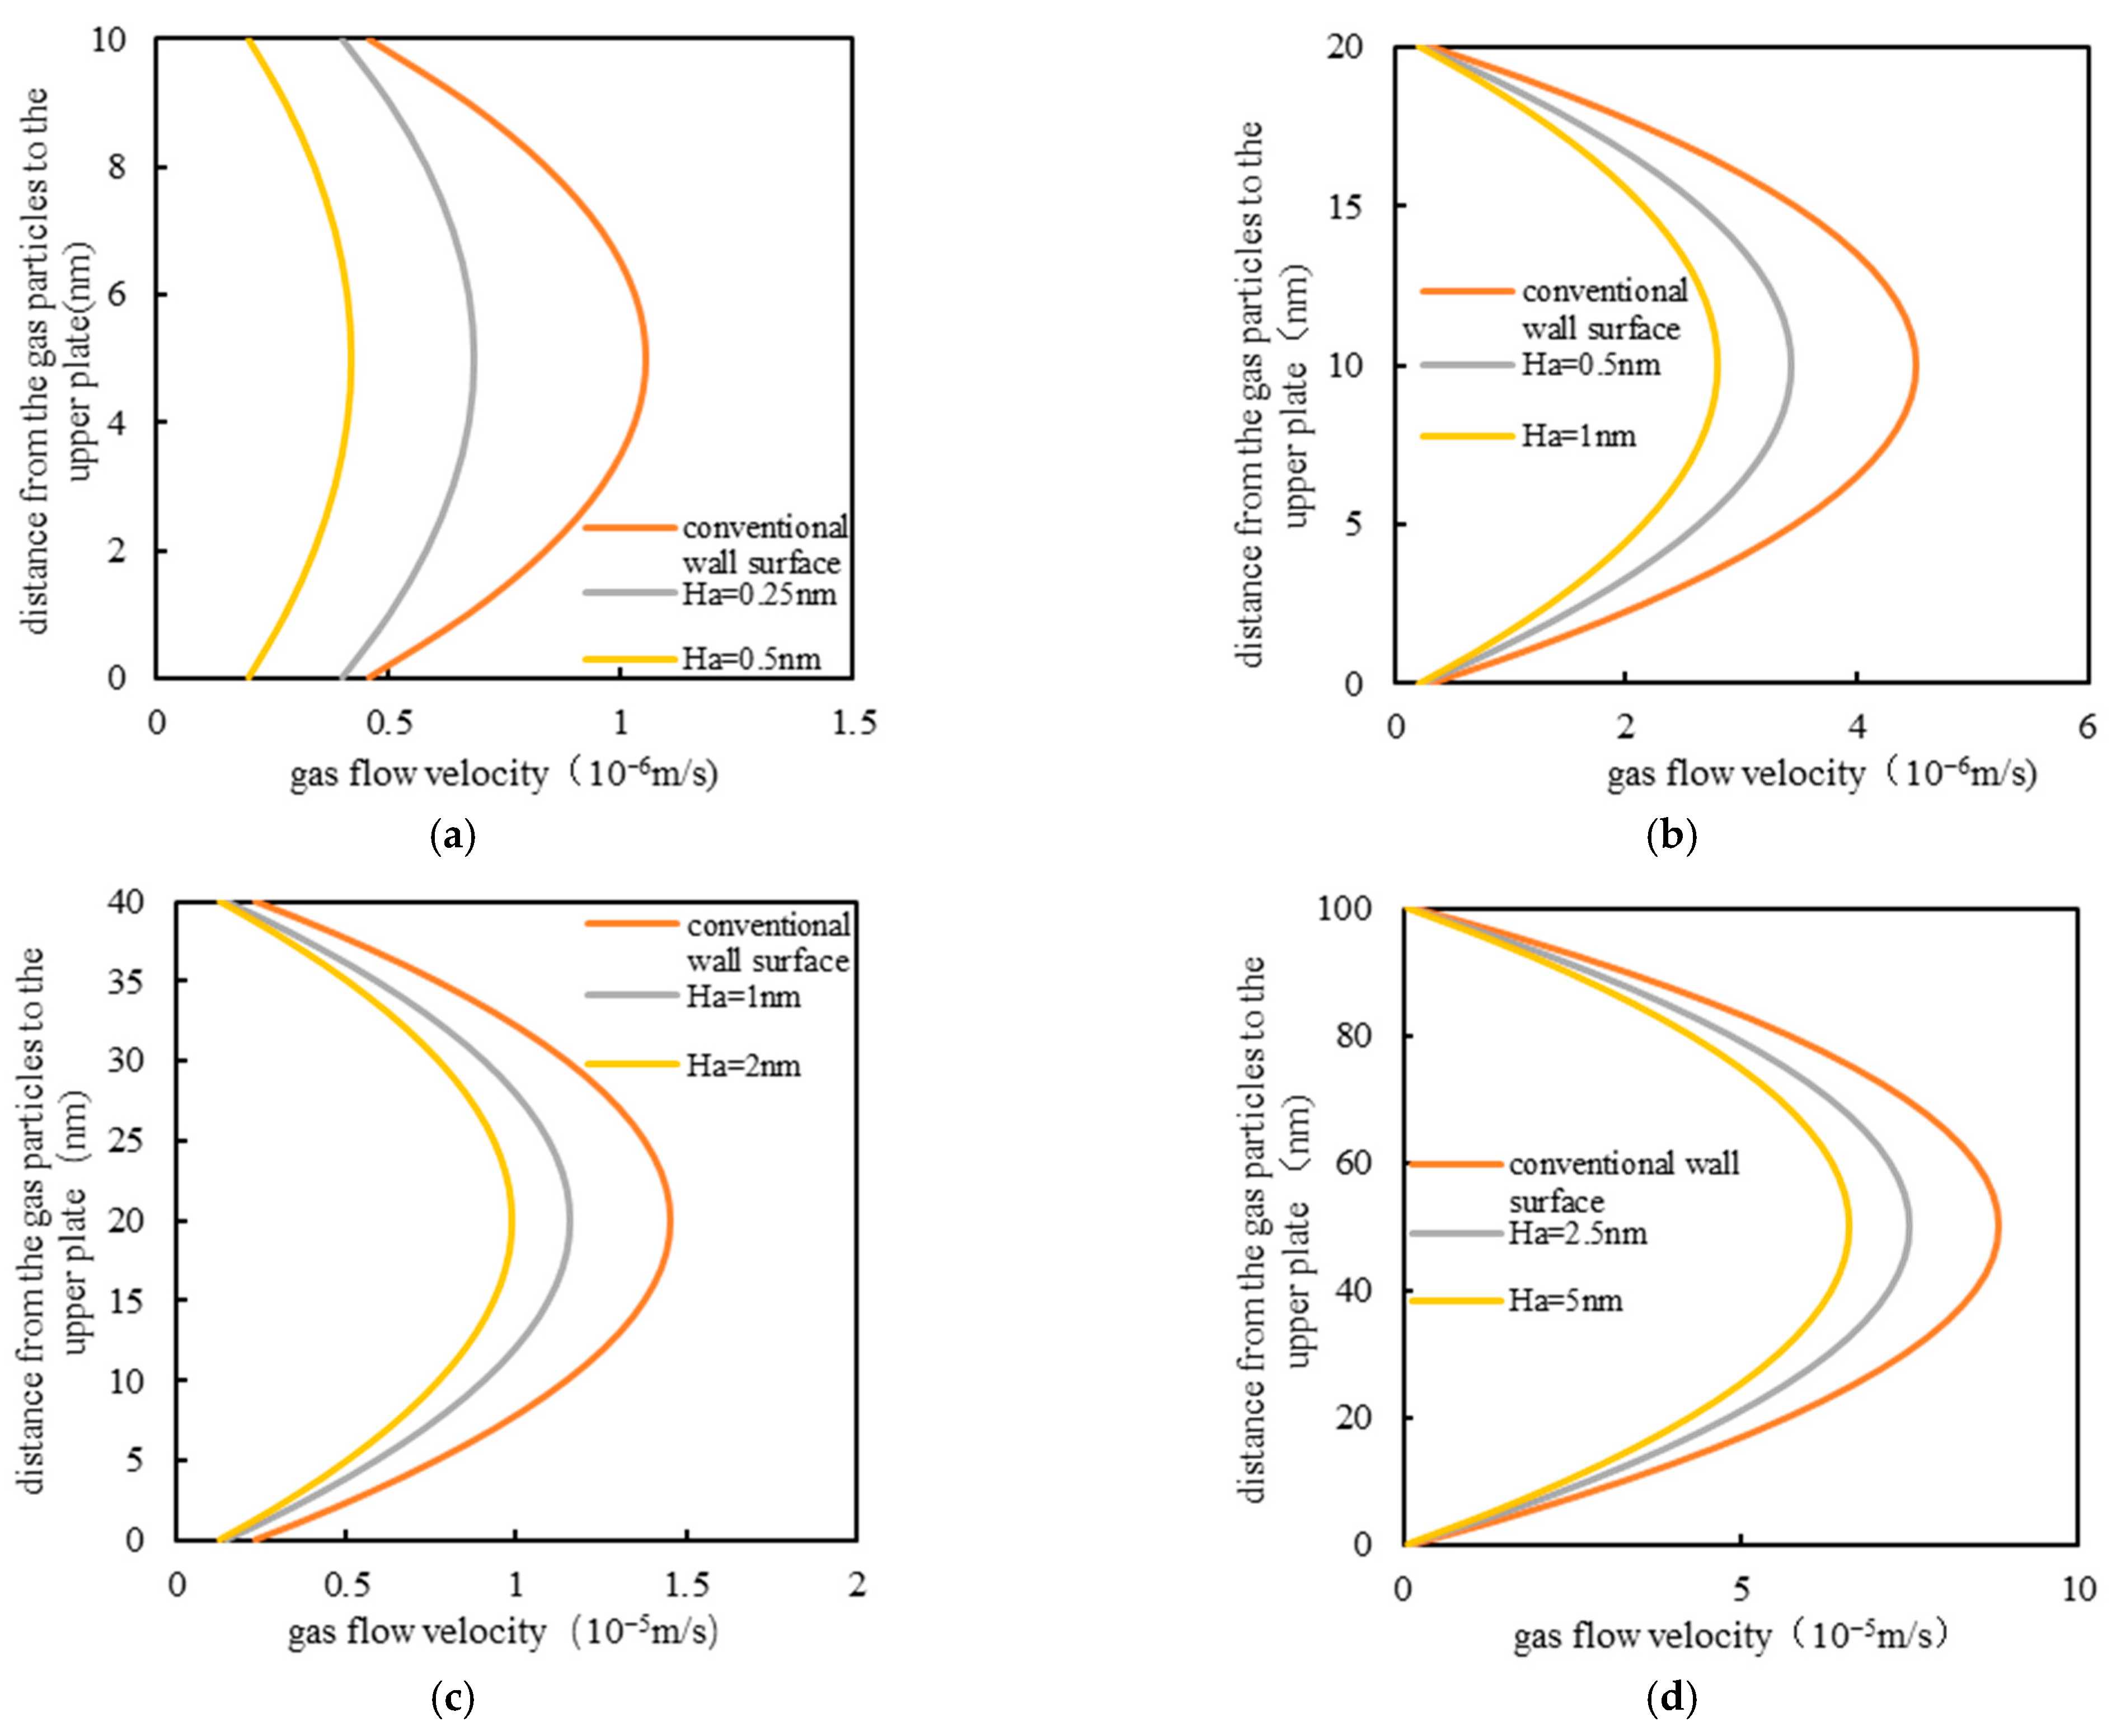
3.1. Transverse Velocity Field under Different Average Wall Heights

In this case, only the conventional boundary conditions, including wall slip, are used to carry out LBM simulation and calculation. For the coarsened model, the equivalent boundary condition for wall roughness proposed in this paper is used for simulation and calculation. First, we verify the correctness of the rough wall boundary equivalent method proposed in this paper through LBM simulation at the microscale. The model parameters are set as follows. The dynamic viscosity of methane gas is 0.022 mPa • s under actual reservoir conditions. The isotherm temperature of the model system is 383.15 K (i.e., 110 °C). The average pressure of the model system is set to 30 MPa. The average density of gas at the outlet is ρ ¯ o u t , and its value is 1.0 g/cm3. The fractal dimension D of the microchannel wall is 1.2, and its characteristic length is 50 × 10−9 m. The effective grid number of the refined LBM model after mesh refinement is 400 × 200. The grid number of equivalent LBM model after roughening the scattering coefficient matrix proposed above is 8 × 4. The bottom edge of the model is set as a closed boundary, and the upper edge is set as an open boundary. The inlet and outlet of the model are set at the condition of constant pressure, and the displacement pressure gradient is 0.6 MPa/×10−2 m. The schematic diagram of the above two models and microchannel structure is shown in Figure 8.
Using LBM simulation, the transverse lattice velocity field distribution of gas particles in the actual rough boundary refinement grid model and the coarser grid model with equivalent boundary conditions are compared and analyzed. The fractal dimension D of the microchannel wall is set to 1.20, and the average height Ha of the rock wall surface is set at 1% to 5% of the characteristic length of the flow field, namely 0.5, 1.0, 1.5, 2.0, and 2.5 × 10⁻⁹ m. The transverse lattice velocity field obtained by the simulation under two boundary conditions is shown in Figure 9.
Before the formal simulation calculation began, firstly, we established a closed model to test the velocity of gas passing through this model under a completely closed state, which was used to verify the convergence of this model. There were 300 × 300 lattice nodes in the x/y direction in the calculation domain, and all four sides of the boundary were a fractal wall surface. In the test, the stray velocity was concentrated near the wall, and the maximum stray velocity was only 6.20 × 10⁻⁷ (dimensionless). In comparison, the velocity of gas in dynamic models was usually greater than 0.01 (dimensionless). It can be proved that the model has good convergence, and the error of the calculation process will not diverge and affect the calculation result.
Comparing the simulation results in relation to the two wall boundary conditions above shows that the gas migration velocity distribution in the transverse direction and its variation law are basically consistent, whether obtained by the fine model of actual boundary conditions or the equivalent coarse-grid model taking into account wall surface roughness. This verifies the accuracy of the equivalent boundary conditions proposed in this paper. The transverse velocity field of gas particle flow under different average wall heights is shown in Figure 8. Where the characteristic size of the flow field and the fractal dimension of the wall surface remain unchanged, with the increase in the average height Ha of the concave and convex wall of the microchannel, roughness produces higher resistance to gas particle flow on the wall, and the flow law of the gas particles changes accordingly. The larger Ha is, the greater the differences in gas particle flow velocity between adjacent positions on the surface of the rock wall. When Ha exceeds 1.0 × 10⁻⁹ m, that is, when relative roughness exceeds 2%, vortex backflow gradually occurs near the wall surface, and the local flow velocity becomes negative, resulting in a great disturbance to the distribution of the velocity field of the gas particle flow. When the Ha value is 2.5 × 10⁻⁹ m, that is, when relative roughness is 5%, a large range of vortex reflux leads to inefficient or ineffective local gas particle flow, which greatly reduces the flow capacity and flow rate of gas particles in the microchannel. The pore-throat structure of tight sandstone porous media is complex, and frequent changes in rock wall surface height increases the seepage resistance. Once the vortex backflow occurs, the permeability of the reservoir is greatly reduced.
As shown in Figure 10, Figure 11 and Figure 12, as Ha increases, the gas particle velocity at the position of the average wall surface height decreases, and the decreasing velocity gradually accelerates. The convex pore wall obstructs the gas flow, thus reducing the slip velocity on the gas wall. In addition, the wall velocity at the outlet end of the model decreases, while the decreasing velocity is gradually slowed. To same extent, the convex wall surface reduces the cross-sectional seepage area of the microchannel, and it also reduces the seepage capacity of gas particle. The coefficient of velocity variation reflects the degree of velocity difference at the average height position of the concave and convex wall surface. The simulation results show that the coefficient of variation for velocity increases rapidly with the increase in Ha. Likewise, the larger the wall undulation, the higher the degree of disorder of the wall through which the gas flows, and the larger the error when the wall is considered a conventional boundary condition.

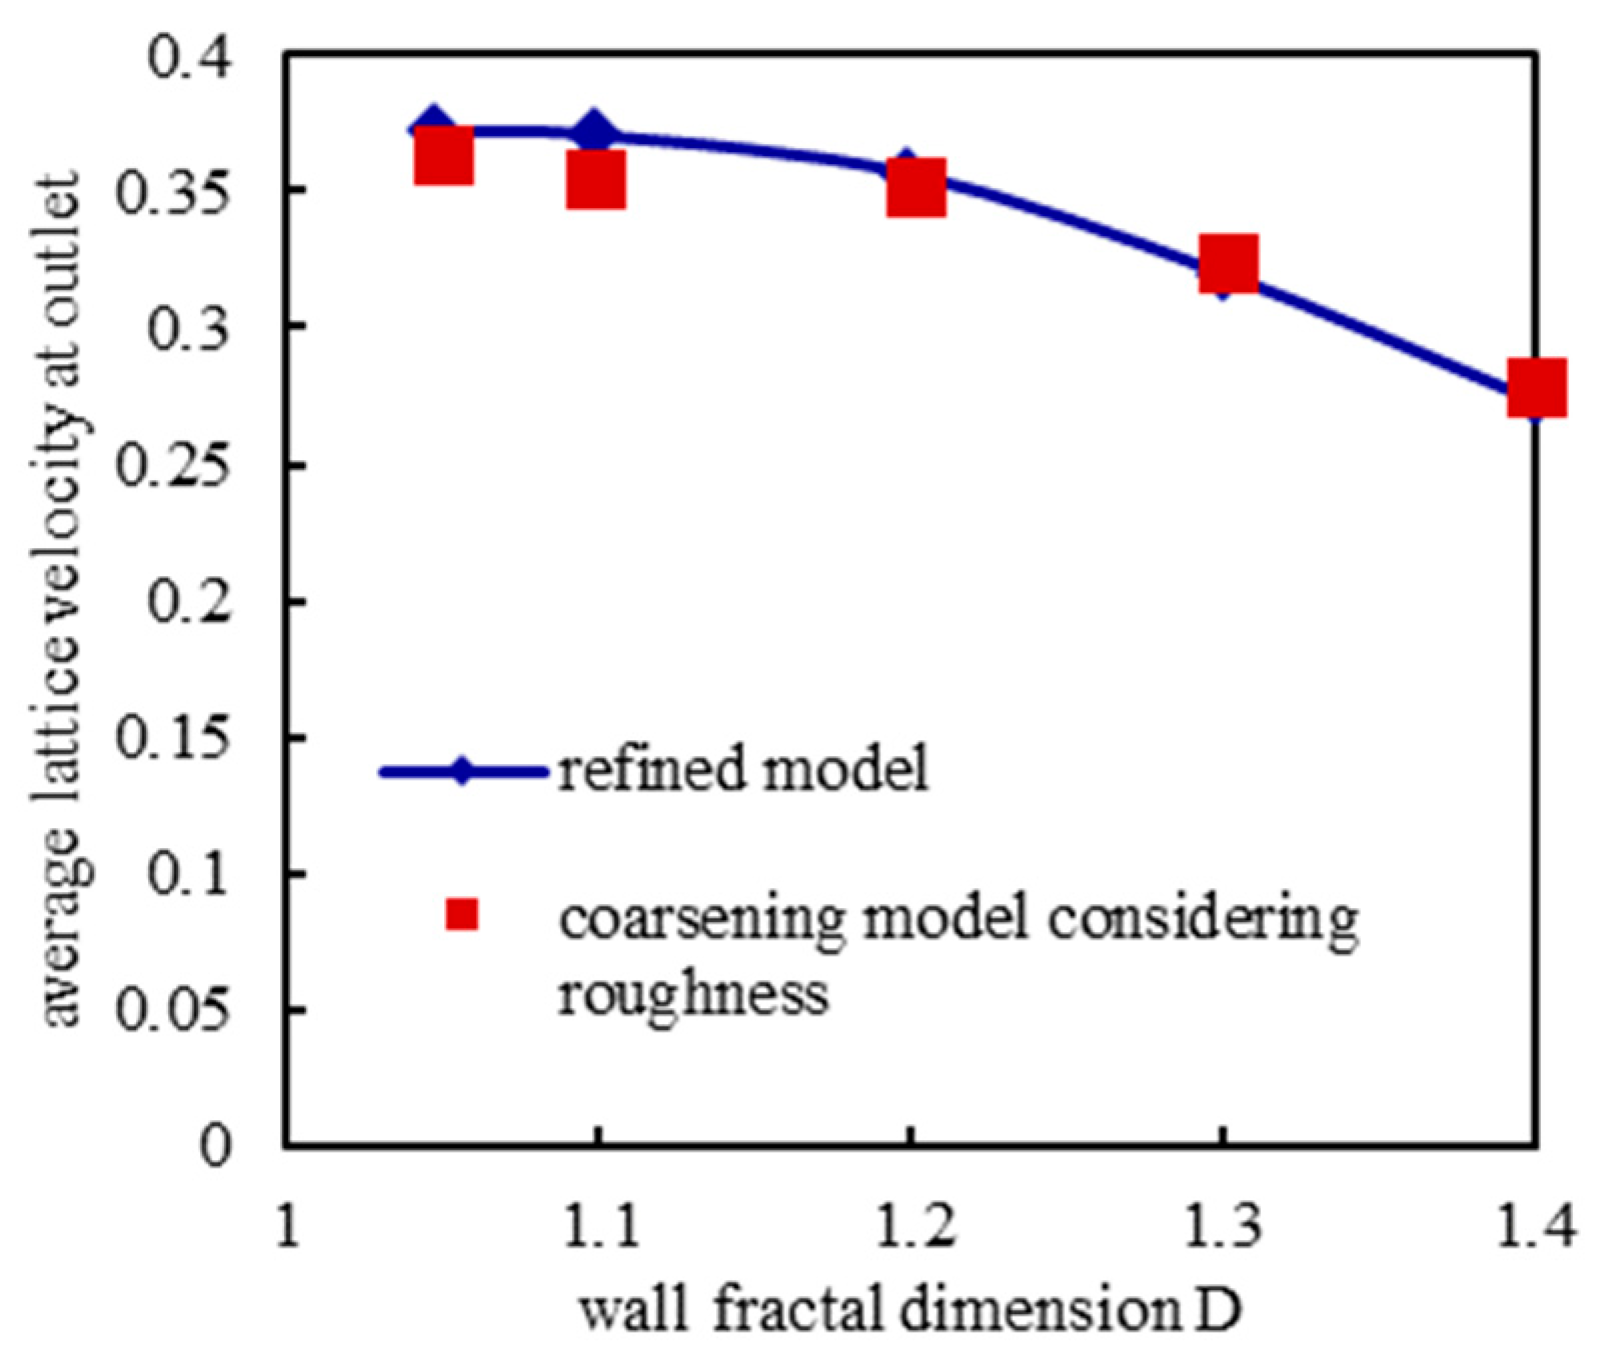
3.2. Transverse Velocity Field under Different Fractal Dimensions of Wall Roughness

Figure 13 shows the transverse lattice velocity field distribution of gas particle migration simulated by the models with the above two boundary conditions under different fractal dimensions. Simulation parameters: fractal dimension are 1.05, 1.10, 1.20, 1.30, and 1.40, respectively; Hm = 3.2 × 10⁻⁹ m, Ha = 1.6 × 10⁻⁹ m; Other initial conditions were the same as in the above study.
By comparing the simulation results of fractal dimension variation under different wall boundary conditions, it can be seen that the distribution and variation law of transverse velocity field obtained by the two boundary conditions have good consistency. The variation of gas particle flow velocity under different wall surface fractal dimensions is shown in Figure 12: The larger the fractal dimension, the more complex the wall contour, the more frequent the variation of the cross-sectional area of the gas seepage channel, and the greater the disturbance to the flow velocity. In the process of the increase in fractal dimensions, vortex backflow gradually appears near the wall surface, and the overall gas particle velocity decreases to a certain extent. However, as the fractal dimension continues to increase, the vortex radius gradually decreases, and the disturbance effect on the gas particle flow velocity near the wall surface gradually weakens. As shown in Figure 13, when the fractal dimension is 1.40, the area of local gas reverse flow area (the dark blue part) generated by vortex reflux is basically the same as that when D = 1.05. From the perspective of velocity field distribution, the disturbance degree of the wall surface fractal dimension on the gas flow velocity field has a peak value, but the larger the fractal dimension is, the larger the gas flow will be.
Figure 14, Figure 15 and Figure 16 shows the simulation results of gas flow under different wall surface fractal dimensions. The distribution and variation law of transverse velocity field obtained by simulation of two boundary conditions are in good consistency. At the same time, with the increase in the fractal dimension of the wall surface, the rough wall surface has different degrees of disturbance to the gas flow velocity nearby. The more complex the wall surface shape, the greater the influence on gas migration law. The simulation results show that with the increase in the fractal dimension of the wall surface in the microchannel, the outlet end wall velocity of the model gradually decreases. It is worth noting that, with the increase in the fractal dimension of the wall surface, although the wall surface morphology is gradually complex, it can be seen from Equation (9) and Figure 12 that the length of the wall element of a single L-system is gradually reduced, and the chaotic degree of wall velocity shows a decreasing trend. When the fractal dimension of the wall surface increases, the gas particle velocity at the average position Ha of the wall decreases first and then increases. When the fractal dimension is about 1.20, the wall surface velocity has the lowest value. That is, the resistance of the wall surface is the largest at this time.
It is also easy to see from the velocity field distribution that when D is equal to 1.20, the scattering is the most complex, and that the scattering coefficient difference is the largest when the gas particles collide with the adjacent wall lattice. As the fractal dimension continues to increase, the stability of lattice scattering coefficient on adjacent walls increases, and the flow velocity at Ha position increases gradually. It is anticipated that as the equivalent wall surface position increases, the characteristic length of flow field decreases, and the fractal dimension makes the cross-sectional seepage area decrease, so the average flow velocity at the outlet of the model decreases. Accordingly, the peak value of the disturbance degree of gas migration caused by the fractal dimension mentioned above should appear near D = 1.20, where the scattering coefficient of adjacent wall lattice has the largest difference.
In addition, by an overall comparison of the simulation results obtained by the refined model with actual boundary conditions and the coarsening model with equivalent boundary conditions at different average wall heights and different wall surface fractal dimensions, it can be seen that the gas particle flow velocity distribution and variation law of the two models are basically consistent. It has been confirmed that the equivalent boundary conditions of the coarse-model proposed in this paper for the LBM simulation meet the accuracy requirements and can greatly improve the computational efficiency.

3.3. Velocity Distribution under Different Conditions

From the proposed LBM model above, the influence of the surface roughness of the microchannel wall on the velocity distribution at the same normal position in different scales of microchannels was simulated and studied. The degree of influence of the roughness of the wall surface on fluid transport velocity was also analyzed. The two simulation conditions were set as follows: the fractal dimension of wall surface roughness was set to 1.2, and the relative wall roughness values were set to 2.5% and 5.0%. In the other group, the simulation conditions for non-rough wall surface and conventional combined boundary conditions were used. The design of the other parameters of the model was the same as parameters above. Figure 17 shows the simulation results of gas flow velocity of two-dimensional models with different characteristic scales of wall fractal dimension.
The simulation of gas particle flow in microchannels shows that the velocity distribution of gas particles with wall-inherent roughness deviates from that without a microscale effect. The velocity of flow of the gas particles in the microchannels with different characteristic sizes decreases with the increase in the inherent roughness of the wall. The inherent roughness reduces the slip velocity of the gas particles near to the surface of the wall. When the distance between plates is small, the inherent roughness of the wall greatly affects the velocity distribution. When the characteristic scale is 10 nm, the wall roughness hinders the gas migration rate by 84.7%. With increasing scale, the influence of wall roughness on velocity slowly decreases; the characteristic scale is 200 nm, and the inherent permeability reaches 3.33 × 10⁻³ μm2. Under the influence of the microscale effect, the migration velocity of gas particles decreases by 15.4%. This indicates that the roughness of the surface of the rock wall plays a significant role in this characteristic scale, and the most fundamental factor is the rarefaction effect, which is more significant when the characteristic scale belongs to the nanoscale. Ha is a direct representation of the roughness of the wall surface. In the microchannels, the surface roughness of the wall plays a role in reducing the cross-sectional area of gas seepage and increasing the resistance of the gas flow. When the characteristic scale is very small, the flux in mass of the gas particles sliding along the wall surface forms a large proportion. The wall with a large Ha not only increases the flow resistance of the gas particles but also reduces the cross-sectional area of the seepage, so it has a great influence on the velocity distribution. With increased characteristic length, the proportion of gas particles slip flow near the wall decreases gradually, and the influence of inherent roughness of the wall on the gas flow rate decreases accordingly.

4. Conclusions

Tight gas in rough microchannels was simulated, and an equivalent method for boundary conditions to gas transport in self-affine microchannels with inherent roughness was proposed. Boundary conditions based on an L-fractal system to characterize rough wall morphology and the generalized LBM, taking into account the compressibility and dense effects of gas, were utilized to study the mechanisms of gas migration in the microchannels. The average wall height of the rock wall surface, the fractal dimensions of wall roughness, and velocity profile were calculated to investigate flow characteristics in rough microchannels.
Permeability in rough microchannels should be adjusted in terms of pressure and topography. Coupled effects of roughness and rarefaction play an important role in microscale gas flow channels. On the one hand, wall roughness reduces gas slip velocity. On the other hand, it also reduces the cross-sectional area of seepage of the microchannels. The deviation of the velocity distribution in a rough channel from that in a smooth channel evidently increases. So, considering the rough wall as a conventional boundary condition would result in large errors. In addition, it is not the case that the greater the surface roughness of the wall, the greater the disturbance to the gas flow law. When the fractal dimension of the wall is about 1.20, it has the greatest impact on the fluid flow law. In addition, excessive roughness of the wall surface tends to lead to vortex backflow of the gas in the region adjacent to the wall, which greatly reduces its flow velocity. The roughness of the rock wall surface has a significant role to play in the gas flow characteristics in microchannels. In particular, for gas flow in nanoscale seepage space (i.e., where the characteristic scale is 10 nm), wall roughness hinders the gas migration rate by 84.7%. For pores larger than 200 nm, the effects of wall roughness on gas flow are generally negligible.

Author Contributions

Conceptualization, F.W. and Y.L.; methodology, F.W. and H.X.; software, F.W. and C.H.; validation, F.W., Y.L. and H.X.; writing—original draft preparation, F.W. and H.X.; writing—review and editing, F.W., H.X. and C.H. All authors have read and agreed to the published version of the manuscript.

Funding

This work was supported by the National Natural Science Foundation of China (Grant No. 51804076 and 52074087), the China Postdoctoral Science Foundation (Grant No. 2021M690528), Postdoctoral Projects in Heilongjiang Province (Grant No. LBH-Z20035), the Heilongjiang Provincial Natural Science Foundation of China (Grant No. LH2021E016), and the Research Initiation Foundation of Northeast Petroleum University (Grant No. 2019KQ15).

Data Availability Statement

The data that support the findings of this study are available from the corresponding author upon reasonable request.

Conflicts of Interest

The authors declare no conflict of interest.

References

  1. Zhang, C.; Guan, P.; Zhang, J.H.; Liang, X.W.; Ding, X.N.; You, Y. A Review of the Progress on Fractal Theory to Characterize the Pore Structure of Unconventional Oil and Gas Reservoirs. Acta Sci. Nat. Univ. Pekin. 2023, 7, 1–12. [Google Scholar]
  2. Zou, C.N.; Yang, Z.; Zhu, R.K.; Zhang, G.S.; Hou, L.H.; Wu, S.T.; Tao, S.Z.; Yuan, X.J.; Dong, D.Z.; Wang, Y.M.; et al. Advances in unconventional oil and gas exploration and development and theoretical technology in China. Acta Geol. Sin. 2015, 89, 979–1007. [Google Scholar]
  3. Zou, C.; Zhu, R.K.; Wu, S.; Yang, T.; Tao, S.Z.; Yuan, X.J.; Hou, L.H.; Yang, H.; Xu, C.C.; Li, D.H.; et al. Types, characteristics, genesis and prospects of conventional and unconventional hydrocarbon accumulations: Taking tight oil and tight gas in China as an instance. Acta Pet. Sin. 2012, 33, 173–187. [Google Scholar]
  4. Zou, C.; Zhang, G.; Tao, S.; Hou, S.; Li, X.; Li, J.; Dong, D.; Zhu, R.; Yuan, X.; Hou, L.; et al. Geological features, major discoveries and unconditional petroleum geology in the global petroleum exploration. Pet. Explor. Dev. 2010, 37, 129–145. [Google Scholar]
  5. Zhou, N.; Lu, S.; Wang, M.; Liu, W.; Guan, Y.; Tan, H.; Wang, Z. Applicability of fractal capillary pressure models to sandstones. J. Pet. Sci. Eng. 2020, 185, 106626. [Google Scholar] [CrossRef]
  6. Yao, J.; Sun, H.; Fan, D.Y.; Wang, C.C.; Sun, Z.X. Numerical simulation of gas transport mechanisms in tight shale gas reservoirs. Pet. Explor. Dev. 2013, 10, 528–537. [Google Scholar] [CrossRef] [Green Version]
  7. Wang, H.; Su, Y.; Wang, W.; Li, G.; Zhang, Q. Simulation on liquid flow in shale nanoporous media based on lattice Boltzmann method. Acta Pet. Sin. 2023, 44, 534–544. [Google Scholar]
  8. Beskok, A.; Karniadakis, G.E. Report: A model for flows in channels, pipes, and ducts at micro and nano scales. Microscale Thermophys. Eng. 1999, 3, 43–77. [Google Scholar]
  9. Hu, C.; Wang, F.; Liu, Y.; Zhi, J. Three-Dimensional Lattice Boltzmann Simulation of Gas-Water Transport in Tight Sandstone Porous Media: Influence of Microscopic Surface Forces. Energy Sci. Eng. 2020, 8, 1924–1940. [Google Scholar] [CrossRef] [Green Version]
  10. Chen, S.; Gong, Z.; Li, X.; Wang, H.; Wang, Y.; Zhang, Y. Pore structure and heterogeneity of shale gas reservoirs and its effect on gas storage capacity in the Qiongzhusi Formation. Geosci. Front. 2021, 12, 101244–101251. [Google Scholar] [CrossRef]
  11. Qian, C.; Li, X.; Shen, W.; Zhang, Q.; Guo, W.; Hu, Y.; Jia, Y. Study on the Pore Structure and Fractal Characteristics of Different Lithofacies of Wufeng–Longmaxi Formation Shale in Southern Sichuan Basin, China. ACS Omega 2022, 7, 8724–8738. [Google Scholar] [CrossRef]
  12. Belyadi, H.; Fathi, E.; Belyadi, F. Numerical simulation of real field Marcellus shale reservoir development and stimulation-ScienceDirect. In Hydraulic Fracturing in Unconventional Reservoirs, 2nd ed.; Gulf Professional Publishing: Cambridge, MA, USA, 2019; pp. 541–585. [Google Scholar]
  13. Modesti, D.; Sathyanarayana, S.; Salvadore, F.; Bernardini, M. Direct numerical simulation of supersonic turbulent flows over rough surfaces. J. Fluid Mech. 2022, 942, A4401–A4425. [Google Scholar] [CrossRef]
  14. Mandelbrot, B. How long is the coast of Britain? Statistical self-similarity and fractional dimension. Science 1967, 156, 636–638. [Google Scholar] [CrossRef] [Green Version]
  15. Zeng, Y.; Ning, Z.; Wang, Q.; Sun, H.; Huang, L.; Ye, H. Gas transport in self-affine rough microchannels of shale gas reservoir. J. Pet. Sci. Eng. 2018, 167, 716–728. [Google Scholar] [CrossRef]
  16. Wei, Y.; Wang, J.; Yu, W.; Qi, Y.; Miao, J.; Yuan, H.; Liu, C. A smart productivity evaluation method for shale gas wells based on 3D fractal fracture network model. Pet. Explor. Dev. 2021, 48, 911–922. [Google Scholar] [CrossRef]
  17. Liu, W.; Zhang, Q.; Dong, Y.; Chen, Z.; Duan, Y.; Sun, H.; Yan, X. Analytical and numerical studies on a moving boundary problem of non-Newtonian Bingham fluid flow in fractal porous media. Phys. Fluids 2022, 34, 023101. [Google Scholar] [CrossRef]
  18. Johnson, D.L.; Koplik, J.; Dashen, R. Theory of dynamic permeability and tortuosity in fluid-saturated porous media. J. Fluid Mech. 1987, 176, 379–402. [Google Scholar] [CrossRef]
  19. Chen, Y.; Zhang, C.; Shi, M.; Peterson, G.P. Role of surface roughness characterized by fractal geometry on laminar flow in microchannels. Phys. Rev. E 2009, 80, 026301. [Google Scholar] [CrossRef]
  20. Bouchendouka, A.; Fellah, Z.E.A.; Larbi, Z.; Ongwen, O.N.; Ogam, E.; Fellah, M.; Depollier, C. Flow of a self-similar non Newtonian fluid using fractal dimensions. Fractal Fract. 2022, 6, 582. [Google Scholar] [CrossRef]
  21. Bouchendouka, A.; Fellah, Z.E.A.; Larbi, Z.; Louna, Z.; Ogam, E.; Fellah, M.; Depollier, C. Fractal Analysis of a Non-Newtonian Fluid Flow in a Rough-Walled Pipe. Materials 2022, 15, 3700. [Google Scholar] [CrossRef]
  22. Talu, S.; Matos, R.S.; Pinto, E.P.; Rezaee, S.; Mardani, M. Stereometric and fractal analysis of sputtered Ag-Cu thin films. Surf. Interfaces 2020, 21, 100650. [Google Scholar] [CrossRef]
  23. Das, A.; Chawla, V.; Matos, R.S.; da Fonseca Filho, H.D.; Yadav, R.P.; Talu, S.; Kumar, S. Surface microtexture and wettability analysis of Quasi Two-Dimensional (Ti, Al)N thin films using Fractal Geometry. Surf. Coat. Technol. 2021, 421, 127420. [Google Scholar] [CrossRef]
  24. Mandelbrot, B.B. A Fractal’s Lacunarity, and how it can be Tuned and Measured. In Fractals in Biology and Medicine; Springer: Basel, Switzerland, 1994; pp. 8–21. [Google Scholar]
  25. Wu, H.; Chen, J.; Liu, H. Molecular dynamics simulations about adsorption and displacement of methane in carbon nanochannels. J. Phys. Chem. C 2015, 119, 13652–13657. [Google Scholar] [CrossRef]
  26. Aljamaan, H.; Al Ismail, M.; Kovscek, A.R. Experimental investigation and Grand Canonical Monte Carlo simulation of gas shale adsorption from the macro to the nanoscale. J. Nat. Gas Sci. Eng. 2017, 48, 119–137. [Google Scholar] [CrossRef]
  27. Alvarado, P. A generalized minimal residual method-based immersed boundary-lattice Boltzmann flux solver coupled with finite element method for non-linear fluid-structure interaction problems. Phys. Fluids 2019, 31, 103603. [Google Scholar] [CrossRef]
  28. Zhang, X.L.; Xiao, L.Z.; Guo, L.; Xie, Q.M. Investigation of shale gas microflow with the Lattice Boltzmann method. Pet. Sci. 2015, 12, 96–103. [Google Scholar] [CrossRef] [Green Version]
  29. Guo, Y.; He, X.; Huang, W. Microstructure effects on effective gas diffusion coefficient of nanoporous materials. Transp. Porous Media 2019, 126, 431–453. [Google Scholar] [CrossRef]
  30. Bahlali, M.L.; Yoo, H.; Favier, J.; Sagaut, P. A lattice Boltzmann direct coupling overset approach for the moving boundary problem. Phys. Fluids 2021, 33, 053607. [Google Scholar] [CrossRef]
  31. Ho, M.T.; Zhu, L.; Wu, L.; Wang, P.; Guo, Z.; Li, Z.H.; Zhang, Y. A multilevel parallel solver for rarefied gas flows in porous media. Comput. Phys. Commun. 2019, 234, 14–25. [Google Scholar] [CrossRef]
  32. Ho, M.T.; Zhu, L.; Wu, L.; Wang, P.; Guo, Z.; Ma, J.; Zhang, Y. Pore-scale simulations of rarefied gas flows in ultra-tight porous media. Fuel 2019, 249, 341–351. [Google Scholar] [CrossRef] [Green Version]
  33. Lim, C.Y.; Shu, C.; Niu, X.D.; Chew, Y.T. Application of lattice Boltzmann method to simulate microchannel flows. Phys. Fluids 2002, 14, 2299–2308. [Google Scholar] [CrossRef]
  34. Tang, G.; Tao, W.; He, Y. Lattice Boltzmann method for simulating gas flow in microchannels. Int. J. Mod. Phys. C 2004, 15, 335–347. [Google Scholar] [CrossRef] [Green Version]
  35. Guo, Z.; Zhao, T.; Shi, Y. Physical symmetry, spatial accuracy, and relaxation time of the lattice Boltzmann equationfor microgas flows. J. Appl. Phys. 2006, 99, 74903–74917. [Google Scholar] [CrossRef]
  36. Guo, Z.; Zheng, C.; Shi, B. Lattice Boltzmann equation with multiple effective relaxation times for gaseous microscale flow. Physical review, E. Statistical, nonlinear, and soft matter physics. Phys. Rev. E 2008, 77, 036707. [Google Scholar] [CrossRef] [PubMed]
  37. Zhao, J.; Kang, Q.; Yao, J.; Zhang, L.; Li, Z.; Yang, Y.; Sun, H. Lattice Boltzmann simulation of liquid flow in nanoporous media. Int. J. Heat Mass Transf. 2018, 125, 1131–1143. [Google Scholar] [CrossRef]
  38. Es-Sahli, O.; Sescu, A.; Afsar, M.Z.; Buxton, O.R. Investigation of wakes generated by fractal plates in the compressible flow regime using large-eddy simulations. Phys. Fluids 2020, 32, 105106. [Google Scholar] [CrossRef]
  39. Jiang, L.; Sun, H.; Wang, Y. Modeling immiscible fluid flow in fractal pore medium by multiphase lattice Boltzmann flux solver. Phys. Fluids 2023, 35, 23334. [Google Scholar] [CrossRef]
  40. Zhao, Y.; Liu, X.; Zhang, L.; Wu, T.; Shan, B. Influence of rough pore wall on tight sandstone gas flow at micro/nano scale. Acta Pet. Sin. 2021, 42, 641–653. [Google Scholar]
  41. Wang, X.; Jian, W.; Xia, J. Three-dimensional Fractal Graphic Description Language System Based on L-system. Comput. Eng. 2009, 35, 194–197. [Google Scholar]
  42. Ge, Y. Research on Roughness and Peak Shear Strength for Rock Discontinuities Based on BAP. Ph.D. Thesis, China University of Geosciences, Wuhan, China, 2014. [Google Scholar]
  43. Chen, S.; Doolen, G.D. Lattice Boltzmann method for fluid flows. Annu. Rev. Fluid Mech. 1998, 30, 329–364. [Google Scholar] [CrossRef] [Green Version]
  44. Rajappan, A.; Golovin, K.; Tobelmann, B.; Pillutla, V.; Abhijeet, A.; Choi, W.; McKinley, G.H. Influence of textural statistics on drag reduction by scalable, randomly rough superhydrophobic surfaces in turbulent flow. Phys. Fluids 2019, 31, 042107. [Google Scholar] [CrossRef]
  45. Ren, J.; Guo, P.; Guo, Z.; Wang, Z. A Lattice Boltzmann Model for Simulating Gas Flow in Kerogen Pores. Transp. Porous Media 2015, 106, 285–301. [Google Scholar] [CrossRef]
  46. Chai, Z.H.; Guo, Z.L.; Shi, B.C. Prediction of permeability in porous media with multi-relaxation-time Lattice Boltzmann method. J. Eng. Thermophys. 2010, 31, 107–109. [Google Scholar]
  47. Guo, Z.; Shi, B.; Zhao, T.S.; Zheng, C. Discrete effects on boundary conditions for the lattice Boltzmann equation in simulating microscale gas flows. Phys. Rev. E Stat. Nonlinear Soft Matter Phys. 2007, 76, 056704. [Google Scholar] [CrossRef] [Green Version]
  48. Tang, G.H.; Tao, W.Q.; He, Y.L. Three-dimensional lattice Boltzmann model for gaseous flow in rectangular microducts and microscale porous media. J. Appl. Phys. 2005, 97, 104918. [Google Scholar] [CrossRef] [Green Version]
Figure 1. The wall surface morphology characteristics of generators in a microchannel.
Fractalfract 07 00596 g001
Figure 2. The shapes after the second and the third iterations.
Fractalfract 07 00596 g002
Figure 3. Wall surface morphology in the microchannel under conditions of different fractal dimensions.
Fractalfract 07 00596 g003
Figure 4. Reflection schematic diagram for wall roughness.
Fractalfract 07 00596 g004
Figure 5. Comparison of pore wall in a conventional reservoir and tight sandstone reservoir. (a) Inner pore wall and grid size; (b) inner pore wall and grid size in a conventional reservoir in a tight sandstone reservoir.
Fractalfract 07 00596 g005
Figure 6. The scattering schematic diagram of fluid particles after colliding with wall surface, which has a degree of ψ with the horizontal direction.
Fractalfract 07 00596 g006
Figure 7. Wall truncation effects under the influence of slip layer. (a) Average free path of bulk phase fluid; (b) average free path of bulk phase fluid.
Fractalfract 07 00596 g007
Figure 8. Grid comparison of two models. (a) Refined grids considering surface roughness with conventional boundary; (b) refinement grids with considering surface roughness with equivalent boundary.
Fractalfract 07 00596 g008
Figure 9. Transverse grid velocity field under different wall height Ha.
Fractalfract 07 00596 g009
Figure 10. The lattice average velocity at the average wall height of the surface under different Ha values.
Fractalfract 07 00596 g010
Figure 11. The outlet lattice velocity at the average wall height of the surface under different Ha values.
Fractalfract 07 00596 g011
Figure 12. Wall velocity variation coefficient at different average height Ha values.
Fractalfract 07 00596 g012
Figure 13. Transverse velocity field under different fractal dimensions.
Fractalfract 07 00596 g013aFractalfract 07 00596 g013b
Figure 14. The outlet lattice velocity at average wall height of the surface under different fractal dimensions.
Fractalfract 07 00596 g014
Figure 15. The wall velocity variation coefficient under different fractal dimensions.
Fractalfract 07 00596 g015
Figure 16. The lattice velocity at the average wall height of rock surface under different fractal dimensions.
Fractalfract 07 00596 g016
Figure 17. Influence of different fractal dimensions of the wall on velocity distribution in microchannels with different characteristic scales. (a) H = 10 × 10−9 m, k = 0.008 × 10⁻³ μm2; (b) H = 20 × 10−9 m, k = 0.033 × 10⁻³ μm2; (c) H = 40 × 10−9 m, k = 0.133 ×1 0−3 μm2; (d) H = 100 × 10−9 m, k = 0.833 × 10⁻³ μm2; (e) H = 150 × 10−9 m, k = 1.875 × 10⁻³ μm2; (f) H = 200 × 10−9 m, k = 3.33 × 10⁻³ μm2.
Fractalfract 07 00596 g017aFractalfract 07 00596 g017b
Table 1. Parameters of fractal L-system with different fractal dimensions.
Fractal Dimension DLLength Similarity Ratio βL
(1/×10−9 m)
huhd
1.01 *1.440.1440.144
1.053.400.3400.340
1.105.160.5160.516
1.156.770.6770.677
1.208.370.8370.837
1.2510.011.0011.001
1.3011.741.1741.174
1.3513.571.3571.357
1.40 **15.511.5511.551
* When fractal dimension of a rough surface is 1, there is no solution; values that give solutions can only approach 1. ** In general, the fractal dimension of a rough surface is not higher than 1.4.
Disclaimer/Publisher’s Note: The statements, opinions and data contained in all publications are solely those of the individual author(s) and contributor(s) and not of MDPI and/or the editor(s). MDPI and/or the editor(s) disclaim responsibility for any injury to people or property resulting from any ideas, methods, instructions or products referred to in the content.

