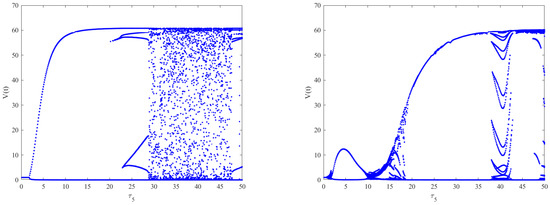
Abstract
In order to investigate the impact of general nonlinear incidence, cellular infection, and multiple time delays on the dynamical behaviors of a virus infection model, a within-host model describing the virus infection is formulated and studied by taking these factors into account in a single model. Qualitative analysis of the global properties of the equilibria is carried out by utilizing the methods of Lyapunov functionals. The existence and properties of local and global Hopf bifurcations are discussed by regarding immune delay as the bifurcation parameter via the normal form, center manifold theory, and global Hopf bifurcation theorem. This work reveals that the immune delay is mainly responsible for the existence of the Hopf bifurcation and rich dynamics rather than the intracellular delays, and the general nonlinear incidence does not change the global stability of the equilibria. Moreover, ignoring the cell-to-cell infection may underevaluate the infection risk. Numerical simulations are carried out for three kinds of incidence function forms to show the rich dynamics of the model. The bifurcation diagrams and the identification of the stability region show that increasing the immune delay can destabilize the immunity-activated equilibrium and induce a Hopf bifurcation, stability switches, and oscillation solutions. The obtained results are a generalization of some existing models.
1. Introduction
Human immunodeficiency virus (HIV) is regarded as one of the major threats to the health of human society and is an important research topic in the field of public health. In recent years, an increasing number of scholars have investigated the dynamic behaviors of HIV infection models by incorporating the different factors that impact the infection procedure. The analysis and understanding of the dynamical behaviors of HIV in the host by modeling HIV infection plays an important role in exploring the mechanism of virus infection. The classical virus infection model is composed of three components: uninfected cells, infected T-cells, and the virus [1]. As the research progresses, improved models have been proposed by many researchers (see [2,3,4,5,6,7,8,9,10,11,12,13,14,15,16,17] and the references therein).
During the process of HIV infection, it takes some time for the initial virus to enter the target cells and for the subsequent viral latency, as well as for infected CD4+ T cells to release infectious free virus particles. Moreover, because of the presence of latently infected cells, HIV cannot be completely eradicated and can be reactivated, continuing to replicate even after antiviral therapy. Thus, this may be an important reason for explaining the failure to eradicate HIV virus infection. In addition, time is needed during the activation procedure of latent cells; thus, there exists a time delay for latent cells to be activated and converted to infected cells [15,18]. Motivated by the above facts, dynamical models with intracellular delays and latency have been investigated (see [11,14,15,16,19,20,21] and the references therein).
As we know, the main two primary immunity modes are humoral and cellular immunity, which are dominated by B cells and cytotoxic T lymphocytes (CTLs), respectively. In virus infections, cellular immunity is reduced by CTLs attacking the infected cells, whereas the B-cell immune response is prevalent during viral infections by attacking the viruses. Both modes are regarded as an important path of eliminating or controlling viral gain when HIV invades the human body. The investigation of the two modes of immune response using viral infection models has received attention from many researchers (see [2,4,5,10,19,22,23,24] and the references therein). However, it is not clear which immune response mode is the most effective one. The existing literature on malaria infection shows that the humoral immune response is more effective compared to the cellular immune response [25]. Thus, the humoral immunity response is considered in the current study. Admittedly, an effective immune response requires the combination of humoral and cellular immunity due to the fact that the humoral immune response alone may not eradicate the infection [26].
In addition, viral stimulation of antigens also requires some time to generate an effective humoral immune response. Studies have been conducted that analyzed the effect of humoral immune delay on the equilibrium stability of viral infection models (see [6,16,27,28] and the references therein). The results have shown that the dynamics of the models incorporating immune delays become more complex, and the existence of time delays can destabilize the steady state and result in Hopf bifurcation, or even chaos solutions, in the corresponding models. However, what the dynamics will be when taking both the intracellular delay and immune response delay into account in a single model remains unknown. The answer will be addressed in this study.
Note that most classical models of disease transmission assume a bilinear incidence (see [2,3,4,5,6] and the references therein). Recent theoretical studies have shown that a nonlinear incidence is more realistic, and a general incidence rate may help us gain a unification theory by omitting unessential details. Common nonlinear incidences include saturated incidence [7,8,9,10,11], Beddington–DeAngelis incidence (B-D) [12,13,14,15,16], and Ivlev functional response functions [29,30,31,32,33], among others. For example, Wang et al. [14] considered the following delayed virus infection model with a B-D incidence rate
where , , , and denote the concentrations of the uninfected cells, latently infected T-cells, actively infected T-cells, and the virus at time t, respectively. The sufficient condition for the global dynamics of Model (1) was presented utilizing the Lyapunov method. However, whether the delay can lead to bifurcation was not discussed in the paper. For the details of Model (1), one can refer to [14].
Recently, the literature has implied that the HIV infection mode within the host has another important mechanism, i.e., cell-to-cell infection, in addition to virus-to-cell infection. It has been found that cell-to-cell infection is a more potent and efficient way of virus propagation than the virus-to-cell infection mode [34,35,36,37,38]. Motivated by this fact, models incorporating cell-to-cell infection have been proposed and studied by many researchers (see [5,20,39,40,41,42,43,44,45,46,47] and the references therein). Note that only virus-to-cell infection was considered and the B-cell immune response in the host was ignored in Model (1). However, the B-cell immune response plays a key role in the immune response by detecting and eliminating HIV virus particles during infection. Thus, motivated by [6,14,16], we consider a delayed virus infection model incorporating general nonlinear incidence and humoral immunity in line with Model (1). In addition, two infection mechanisms are taken into consideration in the model. Therefore, the model takes the form:
where denotes the concentrations of the B cells at time t. Infected cells in the host stimulate B-cell production at a rate of , and free virus particles are cleared by antibodies at a rate of . is the mortality rate of the B cells, is the rate of virus-to-cell infection, is the rate of cell-to-cell infection, is the time delay for latent infected cells to become active infected cells, and is the time delay of the activation of the B-cell immune system. The other parameters have the same meanings as in Model (1) (see [14]). Here, the incidences are assumed to be the nonlinear forms and , respectively, and and satisfy the following properties
In line with (3), one can obtain
Assume that Model (2) satisfies the following initial condition
where .
The rest of the paper is organized as follows. In Section 2, we present some basic results, including the existence of equilibria and the positivity and boundedness of the solutions for Model (5). In Section 3, both the global stability of all equilibria of Model (5) and the existence of local and global Hopf bifurcations are investigated. Moreover, the properties of the Hopf bifurcation solutions are analyzed by applying the normal form and center manifold theory. Some numerical simulations are carried out in Section 4. The summary in Section 5 concludes the paper.
2. Preliminary Results
Before analyzing the dynamical behaviors of the model, we first present some preliminary results. According to the results presented in [48], the solution of Model (2) with initial conditions (5) is non-negative. In the following, we show the boundedness of the solution. From the first equation in Model (2), a simple calculation yields
We define The derivation of yields
where . Thus, , which implies that , , , , and are bounded. Based on the above analysis, we have the following result.
Theorem 1.
Based on the above discussion, it is reasonable to suppose that there exists a positive constant such that , L, I, V, for large t. Thus, in the following, we analyze the dynamic behaviors of Model (2) in a bounded feasible region, which is given by
In the following, we show the existence of equilibria for Model (2), including the infection-free equilibrium (i.e., no infection exists), immunity-inactivated equilibrium (i.e., the immune response has not been activated), and immunity-activated equilibrium (i.e., immune response has been activated and coexists with the virus). For convenience, we denote . Obviously, Model (2) always has an infection-free equilibrium , where . This is the only biologically meaningful equilibrium if , which is the basic reproduction number. It follows from the expression of the basic reproduction number that neglecting either the virus-to-cell infection or the cell-to-cell infection may underevaluate the infection risk. Any other equilibrium () in Model (2) is determined using the following equations.
When and , it follows from (6) that
In order to have and at equilibrium, we must have . From the first equation in (7), we have , and then substituting into the first equation in (6) yields
For all , it follows from (4) that
Further, from (3), we have
This implies that the immunity-inactivated equilibrium exists only if .
When , a simple calculation from (6) implies that
where . In order to have and , we must have . From the first equation in (8), we have
then, substituting into the first equation in (6) leads to
For all , from (4), we can obtain
Further, from (3), and . Then, there exists a unique such that . This implies that the immunity-activated equilibrium exists only if .
3. Stability and Bifurcation Analysis
3.1. Stability Analysis
Theorem 2.
If , the infection-free equilibrium in Model (2) is globally asymptotically stable for .
Proof.
Define the Lyapunov functional , where
By calculating the derivative of along the solutions of Model (2) and applying , we obtain
Condition (4) implies that
Since, , the equality holds if and only if . Therefore, if , then . It can be shown that the largest compact invariant set in is the singleton . LaSalle’s invariance principle [49] implies that is globally asymptotically stable when . This completes the proof. □
Before the proof of the global stability of the immunity-inactivated equilibrium , we present the following result.
Lemma 1.
Define , then we claim that is equivalent to .
Proof.
Obviously, implies that . and the inequalities are equivalent to the inequality . From the monotonicity of function , it follows that is equivalent to for .
On the other hand, is equivalent to . From the monotonicity of function , we know that is equivalent to because . Note that , i.e., is equivalent to . Then is equivalent to . Therefore, the claim is true. □
Theorem 3.
If , the immunity-inactivated equilibrium in Model (2) is globally asymptotically stable for .
Proof.
We employ a particular function, , when . Then, and if and only if . Define the Lyapunov functional , where
From the equilibrium conditions of , we have
which leads to
It follows from (3) that
Moreover, from Lemma 2, we have , with equality holding if and only if , which implies that the largest compact invariant set in is the singleton . Hence, the globally asymptotic stability of the unique immunity-inactivated equilibrium follows from LaSalle’s invariance principle [49]. This completes the proof. □
Theorem 4.
If , the immunity-activated equilibrium in Model (2) is globally asymptotically stable for and .
Proof
Define the Lyapunov functional , where
By calculating the derivative of along the solutions of Model (2) and using the following equilibrium condition at
we obtain
It follows from (3) that
Then, , with equality holding if and only if , , implying that the largest compact invariant set in is the singleton . Therefore, the globally asymptotic stability of the unique immunity-activated equilibrium follows from LaSalle’s invariance principle [49]. This completes the proof. □
3.2. Bifurcation Analysis at
For and , Model (2) becomes
Calculating the corresponding determinant gives
where
Assume that and let in (12). By separating the real and imaginary parts, we can obtain
Squaring and adding these equations yields
where
Let . Then, we obtain
From the expression of in (15), one can show that . Moreover, it can be shown that (16) has at most four positive real roots by applying the relationship between the root and coefficient. Without loss of generality, we assume that has four positive real roots , and . Then, (14) has the positive roots , and thus (12) has a pair of purely imaginary roots . Then, it follows from (13) that
where
Let
where , .
Let
Therefore, if , a Hopf bifurcation occurs at for and . Furthermore, Model (2) undergoes a family of periodic solutions for . Thus, we have the following results.
Theorem 5.
If and , the immunity-activated equilibrium is locally asymptotically stable for and unstable when . Moreover, if , Model (2) undergoes a Hopf bifurcation at when .
3.3. Direction of Hopf Bifurcations
Based on the above discussion, a Hopf bifurcation occurs when . In this section, we study the direction of the Hopf bifurcation using the normal theory and center manifold theorem [50]. We always assume that Model (2) undergoes a Hopf bifurcation at for with , and is the corresponding purely imaginary root of the characteristic equation at for . The conditions for the direction and stability of the Hopf bifurcation are summarized in the following theorem.
Theorem 6.
(i) The direction of the Hopf bifurcation is determined by the sign of , i.e., it is a supercritical bifurcation when and a subcritical bifurcation when . (ii) The stability of the bifurcated periodic solution is determined by , i.e., the periodic solution is stable when and unstable when . (iii) The period of bifurcated periodic solutions is determined by , i.e., the period increases when and decreases when .
The detailed calculations of , , and are given in Appendix A.
3.4. Global Hopf Bifurcation
In the following, we explore the global Hopf bifurcation for using the global Hopf bifurcation theorem of functional equations [51]. Throughout this section, we assume that (16) has a unique positive root. The following lemma is obvious from the definition of the positive invariant set in Model (2).
It follows from Theorem 4 that is globally asymptotically stable when . As a special case of Model (2), Model (11) has no nonconstant periodic solution for . Thus, the following lemma holds.
Lemma 2.
Model (11) has no nonconstant periodic solution when .
It follows from the positive invariant set in Model (2) that the following lemma holds.
Lemma 3.
All nontrivial periodic solutions of Model (11) are uniformly bounded.
The following conclusion shows that Model (11) cannot have a -periodic solution.
Lemma 4.
If , Model (11) has no nonconstant periodic solutions of period .
Proof.
Let be a nontrivial -periodic solution of Model (11). Then, is also a -periodic solution of the following corresponding model
It follows from Theorem 4 that Model (19) has no periodic solution when . Thus, this contradiction completes the proof of the lemma. □
Let and , with , , . Model (11) is equivalent to the following functional differential equations
where
The mapping is completely continuous. By restricting F to the subspace of the constant functions in , we obtain the mapping , where
Then, it can be shown that the assumptions (A1)–(A3) in [51] hold. A point is called a stationary solution of (20) if . A stationary solution is called a center if for some integer m. A center is said to be isolated if it is the only center in some neighborhood of , and it has finite characteristic values of the form .
Let
and be the connected component of in . is the mth crossing number of and m is an integer.
Theorem 7.
Proof.
It follows from [51] that is an isolated center, and there is a smooth curve , such that , for all and , . For the positive , we define . For , a straightforward calculation yields that , if and only if , , which verifies the assumption (A4) in [51] for . Moreover, if we put
it follows from that the crossing number
and then, we have
Thus, the connected component in is nonempty. According to Theorem 3.3 [51], we conclude that is unbounded. It follows from Lemma 3 that the projection of onto the W-space is bounded. From Lemma 4, we know that System (11) with has no nontrivial periodic solution. Consequently, the projection of onto the -space is away from zero, implying that the projection of onto the -space is bounded below. From the definition of , we have . For a contradiction, we assume that the projection of onto the -space is bounded, which implies that there exists a such that the projection of onto the -space is included in the interval . Noting that and from Lemma 3, we have for , which implies that the projection of onto the -space is also bounded. Thus, is bounded. This yields a contradiction and completes the proof. □
4. Numerical Simulations
In this section, we demonstrate the above theoretical results through numerical simulations by choosing three different forms of the general incidence function in Model (2). Most of the parameter values come from [6,17,22,31].
Case (a): Choosing a bilinear incidence function, i.e., , . Let , , , and . A simple calculation gives that , which means that the infection-free equilibrium is globally asymptotically stable, implying that the infection dies out. By choosing different initial values, we can observe that all the solution trajectories converge to the infection-free equilibrium , as shown in Figure 1. Thus, if effective control measures can be taken to decrease the basic reproduction number to less than 1, the infection will be controlled.
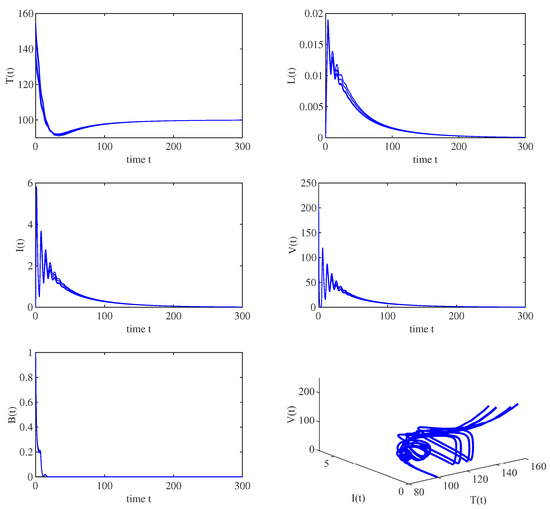
Figure 1.
When , all solution trajectories starting from different initial values converge to the disease-free equilibrium , which implies that the infection-free equilibrium is globally asymptotically stable.
When , , and the other parameters are the same as those in Figure 1, we have . All the solution trajectories starting from different initial values converge to , which implies that the immunity-inactivated equilibrium is globally asymptotically stable, as shown in Figure 2. Moreover, when , , and the other parameters are the same as those in Figure 1, , which implies that the immunity-activated equilibrium is globally asymptotically stable, as shown in Figure 3.

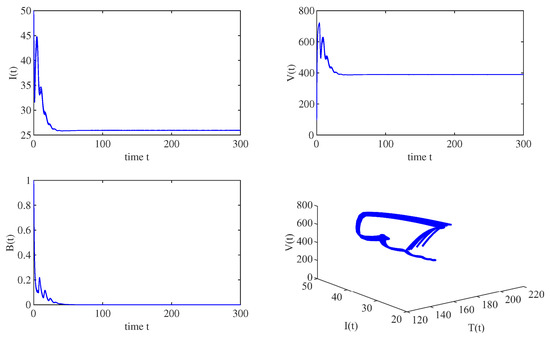
Figure 2.
When , all solution trajectories starting from different values converge to the immunity-inactivated equilibrium , which implies that , is globally asymptotically stable.
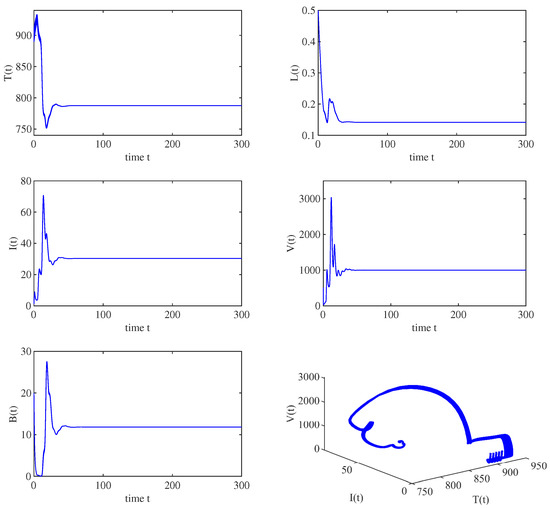
Figure 3.
When , all solution trajectories starting from different initial values converge to the immunity-activated equilibrium , which implies that is globally asymptotically stable for and .
When and , using the same parameter values as those in Figure 3 and choosing as the bifurcation parameter, the numerical results indicate that only one positive root of exists, i.e., . Then, , and the critical value . Figure 4 shows that the immunity-activated equilibrium is locally asymptotically stable when , and a periodic solution bifurcates from an unstable when , as shown in Figure 5, which corresponds to the bifurcation diagram in Figure 6 (left). Furthermore, it follows from Theorem 6 that , , , and . Thus, the Hopf bifurcation is supercritical and the bifurcated periodic solutions are stable.
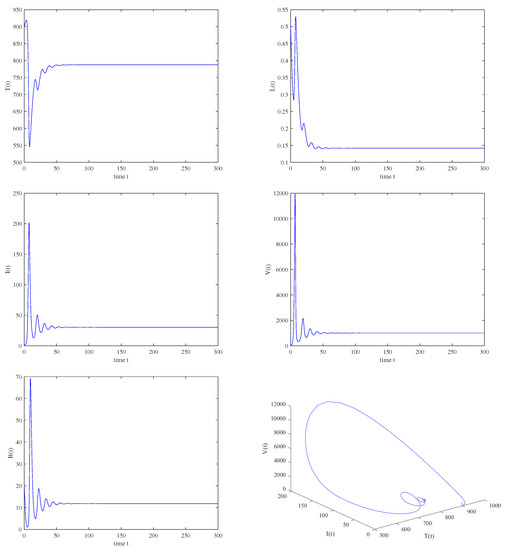
Figure 4.
When , , , then is locally asymptotically stable.
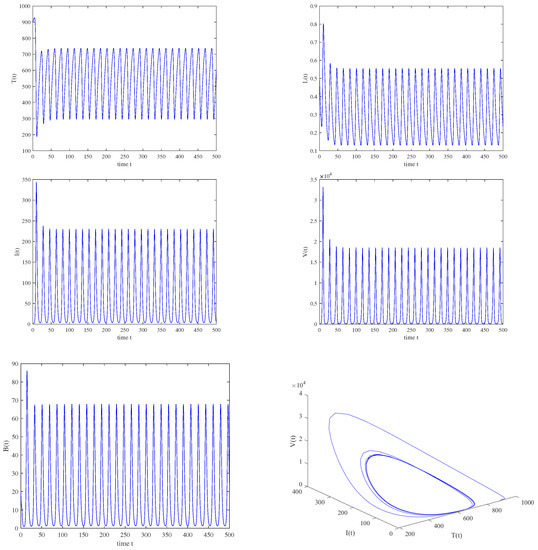
Figure 5.
When , , , a stable periodic solution is bifurcated from an unstable equilibrium through the Hopf bifurcation.
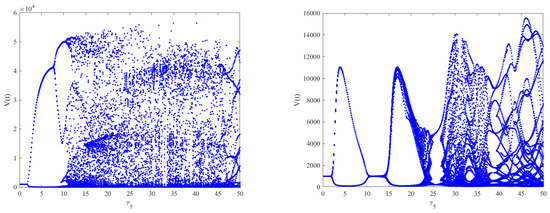
As shown in Figure 6 (left), when and by choosing as the bifurcation parameter, the bifurcation diagram with respect to shows that the immunity-activated equilibrium is stable for a smaller immune delay () and unstable for a larger immune delay, leading to irregular oscillations. However, the theoretical results obtained using Theorems 2–4 show that the intracellular delays , and cannot change the global stability of the equilibria. Nevertheless, how the intracellular delays impact the dynamical behaviors of Model (2) also needs to be considered by regarding as the bifurcation parameter and varying .By comparing Figure 6 (left) and Figure 7 (left column), it can be seen that the presence of has little impact on the dynamics of Model (2) when increases. However, in Model (2), the phenomenon of stability switches occurs when appears, except for the Hopf bifurcation and irregular oscillations, as shown in Figure 7 (right column). This indicates that the stability and instability of immunity-activated equilibrium alternate a finite number of times and finally become unstable. A similar phenomenon occurs in the presence of (left column) and (right column), as shown in Figure 8. The numerical results show that the immune delay combined with the intracellular delays and can lead to more rich and complex dynamical behaviors of Model (2) compared to and . In order to more clearly compare the effect of intracellular delays combined with the immune delay , we carried out a stability analysis by varying the values of the intracellular delays and the immune delay . The stability region was obtained numerically and the corresponding results are shown in Figure 9. We can see that the combination of and with leads to much richer dynamics. The stability or stability switches are important characteristics from a biological perspective, as they determine whether the eradication of infection is possible in the case of stability regions with the implementation of effective controlling measures. In contrast, it will be difficult to eradicate the infection in unstable regions. Furthermore, in order to investigate the impact of the coexistence of all intracellular delays and the immune delay on the dynamics of Model (2), we fixed , and . The bifurcation diagram shows that stability switches still exist, except for the Hopf bifurcation and complex oscillations in Model (2), as shown in Figure 6 (right).
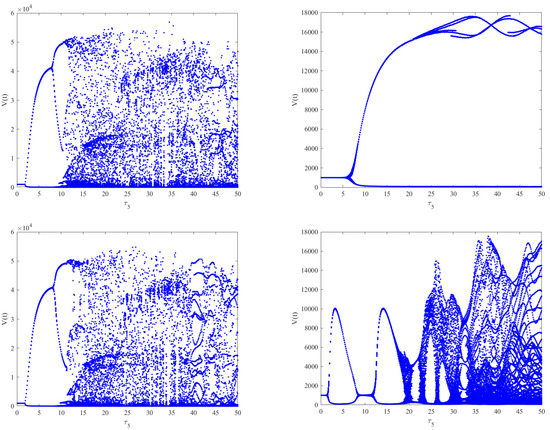
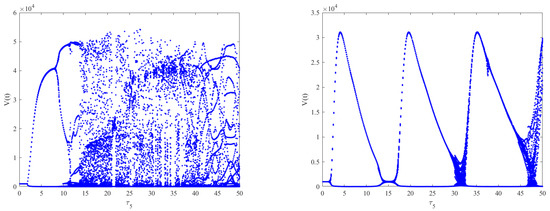
Figure 7.
The effect of intracellular time delays on the dynamics of Model (2). The left column shows from top to bottom, respectively. The right column shows from top to bottom, respectively. A slight change in the dynamical behaviors can be observed for increasing , while stability switches occur for increasing .
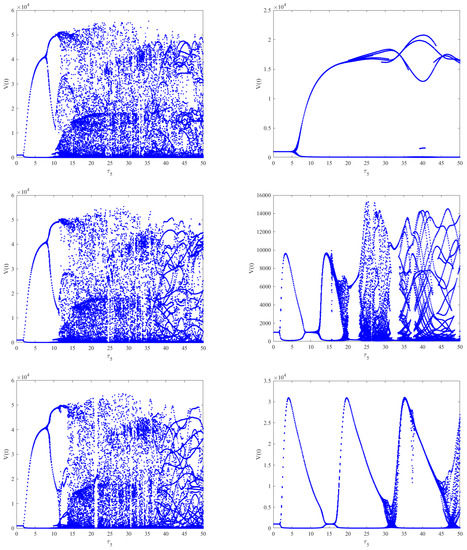
Figure 8.
The effect of intracellular time delays on the dynamics of Model (2). The left column shows from top to bottom, respectively. The right column shows from top to bottom, respectively. A slight change in the dynamical behaviors can be observed for increasing , while stability switches also occur for increasing .
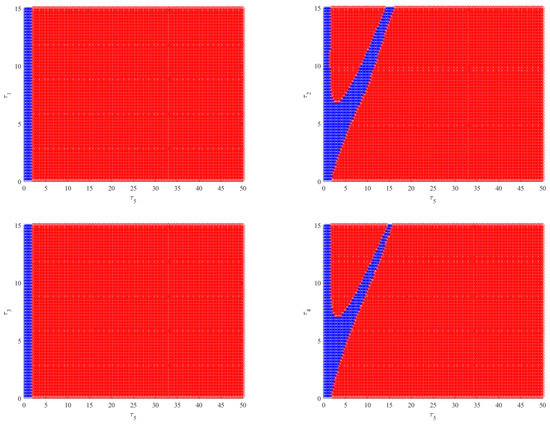
Figure 9.
Plots of the stability region by varying the intracellular delays and immune delay. The blue region indicates a stable equilibrium, and the red region represents an unstable equilibrium.
Case (b): Choosing a saturated incidence, i.e., and . Clearly, conditions (3) and (4) are true. When , () using the same parameter values as those in Figure 3 and choosing as the bifurcation parameter. The numerical results indicate that only one positive root of exists, i.e., , which implies that and the critical value . Figure 10 shows that the immunity-activated equilibrium is locally asymptotically stable when , and a periodic solution bifurcates from an unstable when , as shown in Figure 11. The corresponding bifurcation diagram with respect to in the absence of intracellular delays shows that a Hopf bifurcation and periodic oscillations occur in Model (2), as shown in Figure 12 (left). Moreover, the bifurcation diagram with respect to with intracellular delays () shows that a Hopf bifurcation and periodic solutions also exist, and we can see that the stable interval is longer for and , as shown in Figure 12 (right). This implies that different combinations of intracellular delays may be a type of infection control.
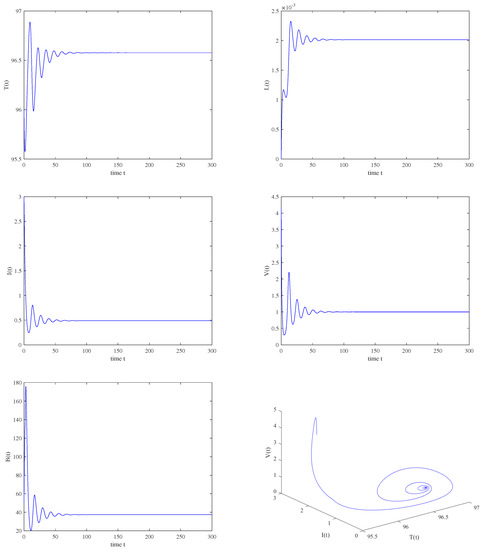
Figure 10.
The immunity−activated equilibrium is asymptotically stable when , , .
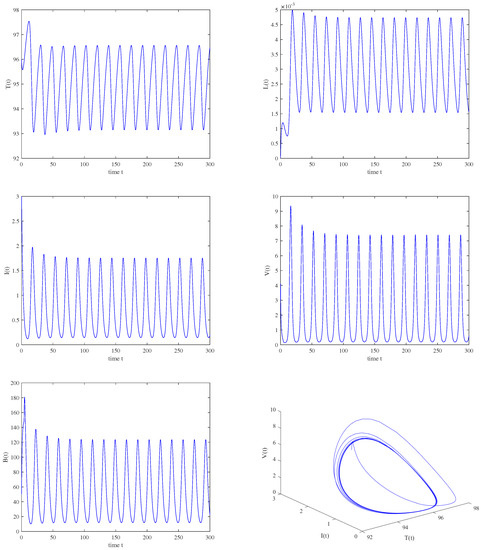
Figure 11.
When , , , a periodic solution is bifurcated from the unstable immunity−activated equilibrium .
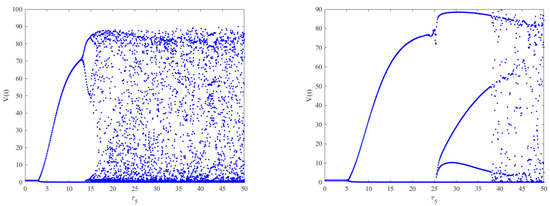
Figure 12.
On the left is the bifurcation diagram of Model (2) with respect to when . On the right is the bifurcation diagram of Model (2) with respect to when are fixed. We can see that the stable interval is longer on the right compared to the left, which implies that different combinations of intracellular delays may be a type of infection control.
Case (c): Choosing and . It is easy to see that the conditions (3) and (4) hold. When , using the same parameter values as those in Figure 3 and choosing as the bifurcation parameter. The numerical results indicate that only one positive root of exists, i.e., . Then, , and the critical value . Figure 13 shows that the immunity-activated equilibrium is locally asymptotically stable when and a Hopf bifurcation and periodic solution bifurcate from an unstable when , which corresponds to Figure 14. The bifurcation diagram with respect to without the intracellular delays shows that there exist periodic oscillations in Model (2), as shown in Figure 15 (left). Moreover, when and are fixed, as shown in Figure 15 (right), complicated dynamics still occur in Model (2) and the stable interval becomes shorter, which means that the existence of intracellular delays may be detrimental to infection control.
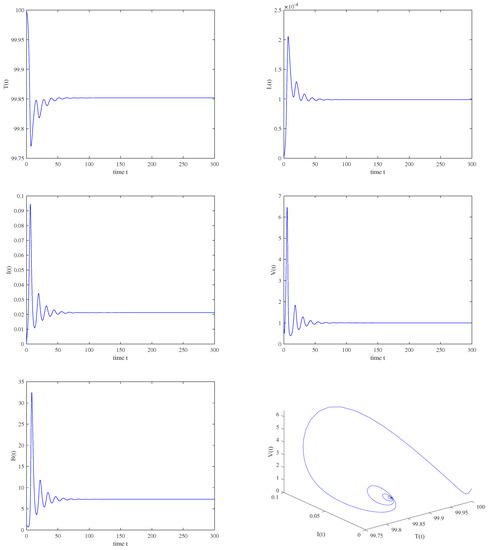
Figure 13.
The immunity−activated equilibrium is asymptotically stable when , , .
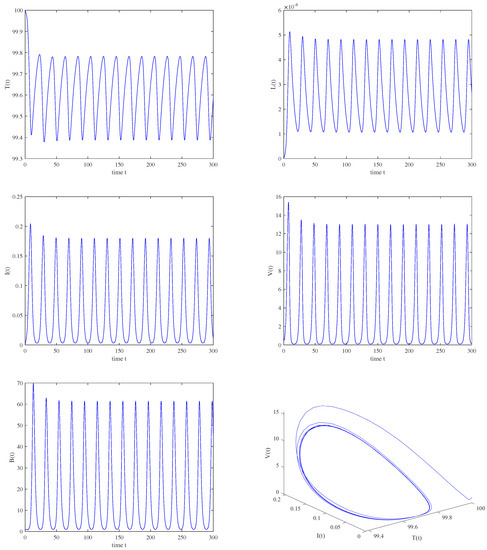
Figure 14.
When , , , a periodic solution is bifurcated from an unstable immunity−activated equilibrium .
5. Conclusions
This paper investigated the dynamical behaviors of a class of viral infection models with cell-to-cell infection, general nonlinear incidence, and multiple delays. The aim of this work was to study the effect of intracellular delays and the immune delay on the dynamics of the model. The threshold dynamics of the equilibria were obtained by constructing Lyapunov functionals. It was found that the infection-free equilibrium is globally asymptotically stable when , which means that the infection dies out. In addition, the immunity-inactivated equilibrium is globally asymptotically stable when , which implies that the virus load is insufficient to activate humoral immunity. Moreover, the immunity-activated equilibrium is globally asymptotically stable when in the absence of an immune delay, which means that the virus can coexist with immune cells and reach a balance within the host. By choosing the immune delay as the bifurcation parameter, we found that Model (2) generated a Hopf bifurcation, and periodic oscillations and stability switches occurred, which indicates that the immune delay can destabilize the immunity-activated equilibrium. The properties of the Hopf bifurcation were investigated by applying the normal theory and center manifold theorem. Moreover, the global existence of the Hopf bifurcation was studied. Finally, numerical simulations were carried out to show how the delays impact the dynamics of Model (2).
The obtained results imply that both the intracellular delays and immune delay are responsible for the rich dynamics of the model. However, it follows from the bifurcation diagrams in Figure 6, Figure 7 and Figure 8, Figure 12 and Figure 15 that the immune delay is the main factor for the existence of the Hopf bifurcation and dominates over the intracellular delays in this viral infection model. This implies that the immune system itself has very complicated procedures during virus infection. Moreover, from a biological perspective, stability and stability switches are important, as they determine whether the eradication of infection may be possible in the case of stable regions, whereas it will be difficult in unstable regions. Thus, the stable regions can provide some insights into infection control. In addition, from a mathematical perspective, we can also provide some theoretical suggestions. For example, it was observed in the bifurcation diagrams that the immune delay may be the main reason for the bifurcation, and the model easily reached a stable state for a small immune delay. This indicates that developing effective drugs to decrease the time for activating the immune response system can contribute to infection control. Furthermore, the expression of the basic reproduction number shows that the infection risk will be underevaluated when ignoring either the cell-to-cell infection or virus-to-cell infection. Thus, developing effective drugs for preventing cell-to-cell infection should be considered, except for virus-to-cell infection.
The theoretical analysis of this virus infection model, which incorporates cellular infection, latency, immune response, general nonlinear incidence, and multiple delays, is rare. The investigation of the global stabilities of the corresponding equilibria by applying the Lyapunov method is a generalization of some existing models. Note that only the humoral immune response has been taken into account in this model. However, both the CTL immune response and humoral immune response are the two main immune mechanisms. Also, it takes some time to build up the CTL immune response, so time delays exist during the activation of the CTL immune response. Thus, exploring the dynamics of a model that incorporates both kinds of immune responses and their corresponding immune delays is an interesting project. We leave this for future work.
Author Contributions
Methodology, J.X. and G.H.; software, J.X. and G.H.; validation, J.X. and G.H.; formal analysis, G.H.; investigation, J.X. and G.H.; data curation, G.H.; writing—original draft, G.H.; writing—review and editing, J.X. and G.H. All authors have read and agreed to the published version of the manuscript.
Funding
This work was funded by the National Natural Science Foundation of China (#11701445, #11971379) and the Natural Science Basic Research Program of Shaanxi Province, China (2022JM-042, 2022JM-038, 2022JQ-033, and 2020JQ-831).
Data Availability Statement
No data were used to support this study.
Conflicts of Interest
The authors declare no conflict of interest.
Appendix A
Proof of Theorem 6.
Define , , and . Model (2) is transformed into a functional differential equation in .
where , and ,
and
with , and
with
According to the Riesz representation theorem, there exists a matrix component in for , which is a bounded variation function, such that
In fact, we can determine as
where is the Dirac delta function. For , we define
and
Then, Model (2) is equivalent to
where . Furthermore, for , define
and a bilinear inner product
where , and T denotes the transpose of the matrix. Then, and are adjoint operators with eigenvalues . Then, we discuss the eigenvectors of and corresponding to these two eigenvalues, respectively. Assuming that is the eigenvector of corresponding to , then . A simple calculation gives
Similarly, assuming that is the eigenvector of corresponding to , then , and we can obtain
From (A6), we have
By selecting
we obtain . In the following, using the notations in [50], we compute the center manifold for . Let be the solution of (A5) for .
Define
then, on the center manifold , we have
where z and are the local coordinates for the center manifold in the directions and .
For of (A5), with and , we obtain
Define
then,
Substitute this expression into (A13) and compare the coefficients
For , it follows from (A13) that
From the definition of A, we obtain
Since , we have
where is a constant vector. Similarly, we can obtain
where is a constant vector. Next, we determine the values of and . From the definition of A and (A16),
where . Then, we have
where , .
It follows from (A21) that
Then, we have
which leads to
where , , , , and . Thus, we have , , , , , and
Similarly, we can obtain
which implies that , , , , , where
By substituting and into (A19) and (A20), we can thus determine and . We can also calculate using (A12) and obtain the quantities:
□
References
- Perelson, A.S.; Nelson, P.W. Mathematical analysis of HIV-1 dynamics in vivo. SIAM Rev. 1999, 41, 3–44. [Google Scholar]
- Nakata, Y. Global dynamics of a cell mediated immunity in viral infection models with distributed delays. J. Math. Anal. Appl. 2011, 375, 14–27. [Google Scholar]
- Murase, A.; Sasaki, T.; Kajiwara, T. Stability analysis of pathogenimmune interaction dynamics. J. Math. Biol. 2005, 51, 247–267. [Google Scholar]
- Wang, S.; Zou, D. Global stability of in-host viral models with humoral immunity and intracellular delays. Appl. Math. Model. 2012, 36, 1313–1322. [Google Scholar]
- Lin, J.; Xu, R.; Tian, X. Threshold dynamics of an HIV-1 virus model with both virus-to-cell and cell-to-cell transmissions, intracellular delay, and humoral immunity. Appl. Math. Comput. 2017, 315, 516–530. [Google Scholar]
- Xu, J.; Geng, Y.; Zhang, S. Global stability and Hopf bifurcation in a delayed viral infection model with cell-to-cell transmission and humoral immune response. Int. J. Bifurc. Chaos 2019, 29, 1950161. [Google Scholar]
- Wang, X.; Liu, S. A class of delayed viral models with saturation infection rate and immune response. Math. Methods Appl. Sci. 2013, 36, 125–142. [Google Scholar]
- Song, X.; Neumann, A.U. Global stability and periodic solution of the viral dynamics. J. Math. Anal. Appl. 2007, 329, 281–297. [Google Scholar]
- Song, X.; Zhou, X.; Zhao, X. Properties of stability and hopf bifurcation for a HIV infection model with time delay. Appl. Math. Model. 2010, 34, 1511–1523. [Google Scholar]
- Tian, X.; Xu, R. Global stability and hopf bifurcation of an HIV-1 infection model with saturation incidence and delayed CTL immune response. Appl. Math. Comput. 2014, 237, 146–154. [Google Scholar]
- Liu, H.; Zhang, J. Dynamics of two time delays differential equation model to HIV latent infection. Physica A 2019, 514, 384–395. [Google Scholar]
- Xiang, H.; Feng, L.; Huo, H. Stability of the virus dynamics model with Beddington–Deangelis functional response and delays. Appl. Math. Model. 2013, 37, 5414–5423. [Google Scholar]
- Huang, G.; Ma, W.; Takeuchi, Y. Global analysis for delay virus dynamics model with Beddington-Deangelis functional response. Appl. Math. Lett. 2011, 24, 1199–1203. [Google Scholar]
- Wang, Y.; Lu, M.; Liu, J. Global stability of a delayed virus model with latent infection and Beddington-Deangelis infection function. Appl. Math. Lett. 2020, 107, 106463. [Google Scholar]
- Zhou, X.; Zhang, L.; Zheng, T.; Li, H.; Teng, Z. Global stability for a delayed HIV reactivation model with latent infection and Beddington-Deangelis incidence. Appl. Math. Lett. 2021, 117, 107047. [Google Scholar]
- Wang, Y.; Lu, M.; Jiang, D. Viral dynamics of a latent HIV infection model with Beddington–Deangelis incidence function, B-cell immune response and multiple delays. Math. Biosci. Eng. 2021, 18, 274–299. [Google Scholar]
- Wang, T.; Hu, Z.; Liao, F.; Ma, W. Global stability analysis for delayed virus infection model with general incidence rate and humoral immunity. Math. Comput. Simul. 2013, 89, 13–22. [Google Scholar]
- Chandra, P.K.; Gerlach, S.L.; Wu, C.; Khurana, N.; Swientoniewski, L.T.; Abdel-Mageed, A.B.; Li, J.; Braun, S.E.; Mondal, D. Mesenchymal stem cells are attracted to latent HIV-1-infected cells and enable virus reactivation via a non-canonical PI3K-NFκB signaling pathway. Sci. Rep. 2018, 8, 14702. [Google Scholar] [PubMed]
- Rong, L.; Perelson, A.S. Modeling latently infected cell activation: Viral and latent reservoir persistence, and viral blips in HIV-infected patients on potent therapy. PLoS Comput. Biol. 2009, 5, e1000533. [Google Scholar]
- Wang, X.; Tang, S.; Song, X.; Rong, L. Mathematical analysis of an HIV latent infection model including both virus-to-cell infection and cell-to-cell transmission. J. Biol. Dyn. 2016, 11, 455–483. [Google Scholar] [PubMed]
- Alshorman, A.; Wang, X.; Joseph Meyer, M.; Rong, L. Analysis of HIV models with two time delays. J. Biol. Dyn. 2017, 11, 40–64. [Google Scholar] [PubMed]
- Xu, J.; Zhou, Y.; Li, Y.; Yang, Y. Global dynamics of a intracellular infection model with delays and humoral immunity. Math. Methods Appl. Sci. 2016, 39, 5427–5435. [Google Scholar]
- Elaiw, A.M. Global stability analysis of humoral immunity virus dynamics model including latently infected cells. J. Biol. Dyn. 2015, 9, 215–228. [Google Scholar] [PubMed]
- Obaid, M.A.; Elaiw, A.M. Stability of virus infection models with antibodies and chronically infected cells. Abstr. Appl. Anal. 2014, 2014, 650371. [Google Scholar]
- Deans, J.A.; Cohen, S. Immunology of malaria. Annu. Rev. Microbiol. 1983, 37, 25–49. [Google Scholar]
- Beeson, J.G.; Osier, F.H.A.; Engwerda, C.R. Recent insights into humoral and cellular immune responses against malaria. Trends Parasitol. 2008, 24, 578–584. [Google Scholar]
- Sun, C.; Li, L.; Jia, J. Hopf bifurcation of an HIV-1 virus model with two delays and logistic growth. Math. Model. Nat. Phenom. 2020, 15, 1–20. [Google Scholar] [CrossRef]
- Wang, T.; Hu, Z.; Liao, F. Stability and Hopf bifurcation for a virus infection model with delayed humoral immunity response. J. Math. Anal. Appl. 2014, 411, 63–74. [Google Scholar]
- Sugie, J. Two-parameter bifurcation in a predator-prey system of Ivlev type. J. Math. Anal. Appl. 1998, 217, 349–371. [Google Scholar]
- Kooij, R.E.; Zegeling, A. A predator-prey model with Ivlev’s functional response. J. Math. Anal. Appl. 1996, 198, 473–489. [Google Scholar]
- Hesaaraki, M.; Moghadas, S.M. Existence of limit cycles for predator-prey systems with a class of functional responses. Ecol. Model. 2001, 142, 1–9. [Google Scholar] [CrossRef]
- Xiang, Z.; Song, X. The dynamical behaviors of a food chain model with impulsive effect and Ivlev functional response. Chaos Solitons Fractals 2009, 39, 2282–2293. [Google Scholar]
- Bardach, J.E. Experimental ecology of the feeding of fishes. Chesap. Sci. 1962, 3, 56–58. [Google Scholar]
- Phillips, D.M. The role of cell-to-cell transmission in HIV infection. AIDS 1994, 8, 719–731. [Google Scholar] [PubMed]
- Sato, H.; Orensteint, J.; Dimitrov, D.; Martin, M. Cell-to-cell spread of HIV-1 occurs within minutes and may not involve the participation of virus particles. Virology 1992, 186, 712–724. [Google Scholar] [PubMed]
- Dimitrov, D.S.; Willey, R.L.; Sato, H.; Chang, L.J.; Blumenthal, R.; Martin, M.A. Quantitation of human immunodeficiency virus type 1 infection kinetics. J. Virol. 1993, 67, 2182–2190. [Google Scholar]
- Martin, N.; Sattentau, Q. Cell-to-cell HIV-1 spread and its implications for immune evasion. Curr. Opin. HIV AIDS 2009, 4, 143–149. [Google Scholar] [PubMed]
- Titanji, B.K.; Aasa-Chapman, M.; Pillay, D.; Jolly, C. Protease inhibitors effectively block cell-to-cell spread of HIV-1 between T cells. Retrovirology 2013, 10, 161. [Google Scholar]
- Culshaw, R.V.; Ruan, S.; Webb, G. A mathematical model of cell-to-cell spread of HIV-1 that includes a time delay. J. Math. Biol. 2003, 46, 425–444. [Google Scholar]
- Lai, X.; Zou, X. Modeling cell-to-cell spread of HIV-1 with logistic target cell growth. J. Math. Anal. Appl. 2015, 426, 563–584. [Google Scholar]
- Li, F.; Wang, J. Analysis of an HIV infection model with logistic target-cell growth and cell-to-cell transmission. Chaos Solitons Fractals 2015, 81, 136–145. [Google Scholar]
- Lai, X.; Zou, X. Modeling HIV-1 virus dynamics with both virus-to-cell infection and cell-to-cell transmission. SIAM J. Appl. Math. 2014, 74, 898–917. [Google Scholar]
- Xu, J.; Geng, Y.; Hou, J. A non-standard finite difference scheme for a delayed and diffusive viral infection model with general nonlinear incidence rate. Comput. Math. Appl. 2017, 74, 1782–1798. [Google Scholar]
- Xu, J.; Zhou, Y. Bifurcation analysis of HIV-1 infection model with cell-to-cell transmission and immune response delay. Math. Biosci. Eng. 2016, 13, 343–367. [Google Scholar]
- Yang, Y.; Zhou, J.; Ma, X.; Zhang, T. Nonstandard finite difference scheme for a diffusive within-host virus dynamics model with both virus-to-cell and cell-to-cell transmissions. Comput. Math. Appl. 2016, 72, 1013–1020. [Google Scholar]
- Chen, S.; Cheng, C.; Takeuchi, Y. Stability analysis in delayed within-host viral dynamics with both viral and cellular infections. J. Math. Anal. Appl. 2016, 442, 642–672. [Google Scholar]
- Zhang, S.; Dong, H.; Xu, J. Bifurcation analysis of a delayed infection model with general incidence function. Comput. Math. Methods Med. 2019, 2019, 1989651. [Google Scholar]
- Yang, X.; Chen, L.; Chen, J. Permanence and positive periodic solution for the single-species nonautonomous delay diffusive models. Comput. Math. Appl. 1996, 32, 109–116. [Google Scholar]
- La Salle, J.P. The Stability of Dynamical Systems; SIAM: Philadelphia, PA, USA, 1976. [Google Scholar]
- Hassard, B.D.; Kazarinoff, N.D.; Wan, Y. Theory and Applications of Hopf Bifurcation; CUP Archive; Cambridge University Press: Cambridge, UK, 1981. [Google Scholar]
- Wu, J. Symmetric functional differential equations and neural networks with memory. Trans. Am. Math. Soc. 1998, 350, 4799–4838. [Google Scholar]
Disclaimer/Publisher’s Note: The statements, opinions and data contained in all publications are solely those of the individual author(s) and contributor(s) and not of MDPI and/or the editor(s). MDPI and/or the editor(s) disclaim responsibility for any injury to people or property resulting from any ideas, methods, instructions or products referred to in the content. |
© 2023 by the authors. Licensee MDPI, Basel, Switzerland. This article is an open access article distributed under the terms and conditions of the Creative Commons Attribution (CC BY) license (https://creativecommons.org/licenses/by/4.0/).
