Abstract
In this paper, we propose to quantitatively compare the loss of human lung health under the influence of the illness with COVID-19, based on the fractal-analysis interpretation of the chest-pulmonary CT pictures, in the case of small datasets, which are usually encountered in medical applications. The fractal analysis characteristics, such as fractal dimension and lacunarity measured values, have been utilized as an effective advisor to interpretation of pulmonary CT picture texture.
1. Introduction
As per an international report, during the week of 26 December 2022 to 1 January 2023, over three million new cases and ten thousand deaths of people diagnosed with SARS-CoV-2 infection were reported. However, in relative terms, this represents significant reductions in weekly cases and deaths of 22% and 12%, respectively [1]. Nonetheless, it should be acknowledged that some of the deceased had underlying health conditions.
Lung diseases are a source of great suffering for many people, encompassing a broad range of pathologies that impede daily life. Recent research shows that 329 million people live with chronic obstructive pulmonary disease (COPD), and over 235 million people have asthma.
COVID-19 is an infectious disease caused by the SARS-CoV-2 virus. The majority of people with COVID-19 experience mild or moderate symptoms and recover without requiring special treatment. However, some individuals develop severe symptoms and require ongoing medical care [2,3,4,5]. In this article, we focus on these patients and examine the pulmonary complications that arise in lung-disease patients who are receiving attentive medical care.
In this paragraph, we answer the question of what computed tomography (CT) is. In simple terms, a CT scan is a safe, quick and painless diagnostic imaging procedure that uses X-rays and computer technology to create detailed images of internal body structures. CT scans produce two-dimensional images of a specific section of the body, and the data obtained can be utilized with specialized software to construct three-dimensional images. CT scans are particularly useful for viewing and evaluating lung diseases [6].
One of the most common reasons for using pulmonary CT scans is to identify preinvasive lesions. These lesions, such as squamous cell carcinoma in situ, atypical adenomatous hyperplasia and idiopathic diffuse lung hyperplasia with neuroendocrine cells, are clinically characterized by the presence of mild, moderate or severe dysplasia.
During a CT scan, the patient lies on a sliding table that is attached to a circular CT scanner. The scanner sends X-rays through the targeted body area [7,8]. Each rotation of the scanner takes less than a second and produces a cross-sectional image of the region being examined. The images are then saved as a group on a computer and can be post-processed to obtain reconstructions according to any plan, which can assist the physician in making a diagnosis. These images can also be printed on film or written to a CD.
Thoracic computed tomography provides valuable information for the diagnosis of lung tumors, the identification of the particular stage reached by a progressive disease, detailed descriptions of primary injuries and the detection of satellite lesions (such as metastases and lymph node affections). Computed tomography can also provide information regarding the size and location of a primary lung injury, including the specific lung segment or lobe affected. If a lung tumor invades the mediastinum, thoracic wall or diaphragm, it can all be diagnosed with the aid of computed tomography.
Fractal analysis involves the investigation of CT image homogeneity by calculating the fractal dimension and lacunarity of the studied samples. This method has successfully identified complexity changes in lung structures associated with known lung diseases [9] and specific tumoral and non-tumoral disorders related to COVID-19 infections. Lacunarity involves detailed quantitative analysis that can evaluate the composition and uniformity of target particles from processed images, providing rapid and accurate information about organized biological models and their structures [10].
2. Theoretical
In image-analysis techniques, the concept of texture is often used. This term refers to the properties that define the structure or boundaries of an object’s image [11]. There are several methods based on different theoretical principles, but we will focus on the approach that utilizes fractal geometry, specifically the method known as fractal analysis [12].
2.1. Fractal Dimension
The concept of the fractal dimension was introduced by Benoit Mandelbrot, a renowned Polish-born, French American mathematician of the 20th century. His fractal hypothesis was proposed in an effort to accurately measure the complexity of self-similar geometric figures using mathematical equations. The fractal dimension is a numerical value that estimates the “intricacy” of such figures. Specifically, the fractal dimension is a statistical parameter that measures how specific relationships within a fractal pattern/model change depending on the scale of measurement [13].
To compute the fractal dimension using box-counting algorithms, the box-counting curve was implemented in MATLAB (https://www.mathworks.com/matlabcentral/fileexchange/13063-boxcount, accessed on 7 August 2022). The box-counting procedure involves placing boxes of varying sizes (r) over the established image and determining the number of boxes required to fully cover the existing binary image. This process results in an estimation of the fractal dimension for the maximum correlation amount observed. The fractal dimension (d) is determined using a power law, but logarithmic transformation is applied to linearize the lnN expression, as shown below [14]. Thus, we have
where k is a so-called nuisance parameter.
2.2. Lacunarity
To compute lacunarity, we need to reevaluate the box mass as the number of localizations inside the box (pack/case). Additionally, we must define a step dimension “s”, which determines the distance the boxes slide through the image. The smallest box size is then set to s. As the boxes slide through the image, we can compute the box mass for each and enter the obtained value into the BM(i,j) matrix. To expedite calculations, the data can be pixelated into an MXM image, with L as the side length of the occupation zone and M = L/s, where the pixel value is the number of confined individuals in each pixel [15]. The number of boxes for a given ε is .
As previously demonstrated in Tole’s 2008 article [16], lacunarity can be effectively computed using
based on the box masses, rather than creating probability distributions from the box-mass data. This method based on lacunarity acquired as a function of a particular size “ε”, involves placing a ε2-sized box in every possible location on the image and calculating the box mass by considering the number of subject pixels within each box. The lacunarity value can then be calculated from the summation of the first and second moments of the box masses [17]. Lacunarity serves as a measure of structural heterogeneity in the analyzed image sample. The gliding box policy is theoretically the most straightforward way to calculate lacunarity.
3. Results and Discussion
The current standard diagnostic procedure for COVID-19 is using a reverse-transcription polymerase chain reaction (RT-PCR), which can be time-consuming and has low sensitivity. Chest X-ray radiography (CXR) is the primary imaging modality that can be used, as it is readily available and provides immediate results. However, it is known to have lower sensitivity than computed tomography (CT), which can be used productively in conjunction with other diagnostic methods [18].
CT has been identified as a clinically relevant approach for the diagnosis and management of COVID-19 patients. Several studies have compared CT images of infected patients with confirmed clinical diagnoses of COVID-19, reporting a sensitivity of 94% and a specificity of 37% [19,20]. Low-dose chest CT with 50 mA is often used instead of standard-dose chest CT with 150 mA because it has been shown to be just as effective at evaluating localized lesions and assessing the likelihood of malignancy in affected tissue, and at assessing lung damage in COVID-19 patients [19,20].
In this paper, pulmonary radiological images obtained using CT techniques were investigated. Postero-anterior lung radiographs with macronodular opacity (<2 cm), of costal intensity, homogeneously located in the lower half of the lung field, were analyzed using known fractal indicators (fractal dimension and lacunarity) [21].
Several patients with a preliminary diagnosis of COVID-19 were tested using CT imaging with the contrast substance OMNIPAQUE 350. The pulmonary CT images obtained for each patient, along with their detailed fractal analysis, are presented in Figure 1, below.
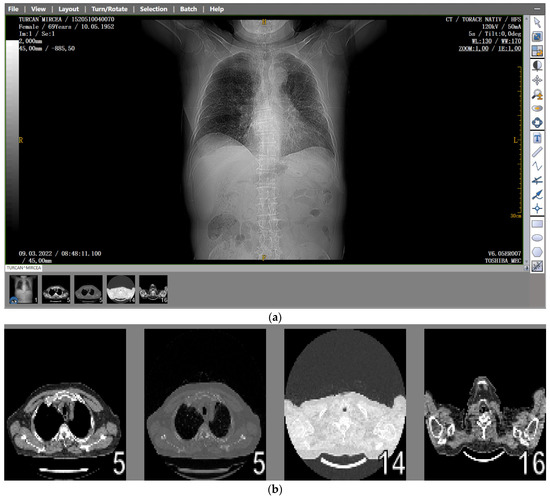
Figure 1.
(a) The CT scan image of a 69-year-old patient who underwent a chest CT examination due to suspicion of COVID-19 in the lungs. (b) A schematic representation of the pre-processing phases of the patient’s CT image (2D), which was resampled to an isomorphic resolution. The indices 5, 14, and 16 represent the numbers of the slices in order.
3.1. Patient Code: MT
Date of performing the pulmonary investigation: 9 March 2022.
Figure 2 and Figure 3 show the selection of the lung portion of interest for patient MT and the same image in “Invert color” format.
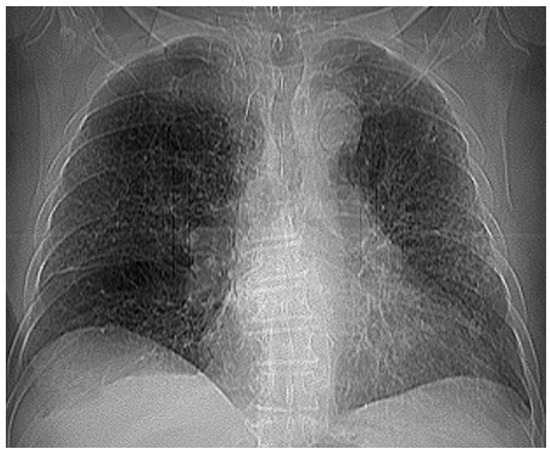
Figure 2.
The selection of the portion of interest of the lungs of patient MT.
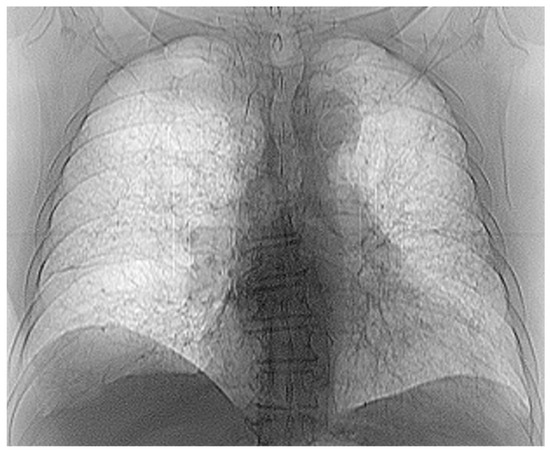
Figure 3.
The image from Figure 2 in “Invert color” format.
Figure 4 and Figure 5 present the defined masks for the left lung and right lung, framed in blue borders.
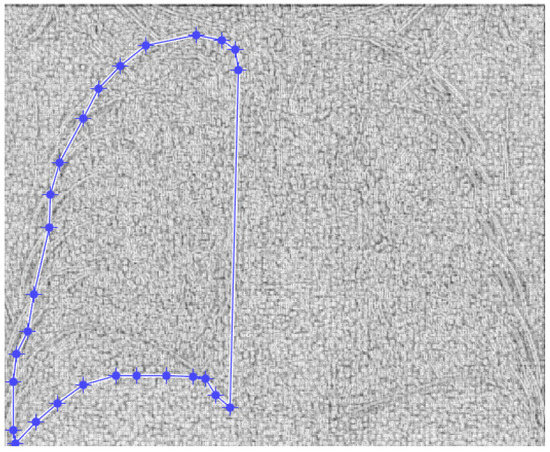
Figure 4.
Defining the mask for the left lung of the first patient.
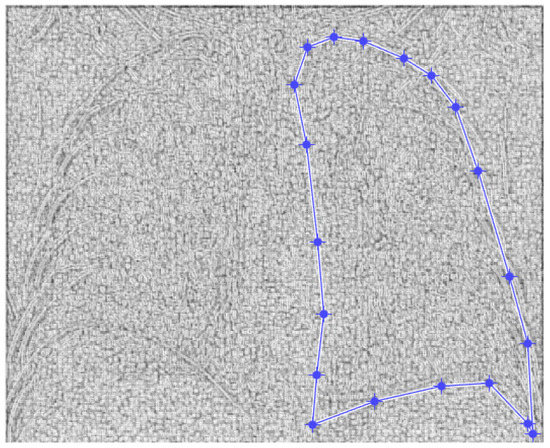
Figure 5.
Defining the mask for the right lung of the first patient.
Table 1 shows the known fractal indicators, such as the fractal dimension of the CT image of the left lung, d1L = 1.8781 ± 0.3251, and the lacunarity, Λ = 0.0300; and the fractal dimension of the right lung, d1R = 1.8817 ± 0.3267, and the lacunarity, Λ = 0.0301.

Table 1.
Fractal indicators for the first patient.
The fractal analysis indicators, namely, the fractal dimension and the lacunarity, were calculated using programs developed for the first time for the analysis of data contained in neurological MRI images [22,23].
Figure 6 shows the 3D graphical representation of voxels contained in patient MT’s CT lung image.
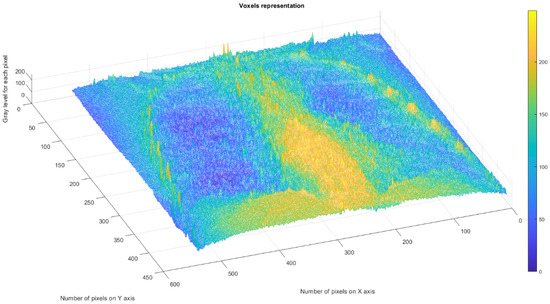
Figure 6.
Three-dimensional graphical representation of voxels in the first patient’s CT lung image.
Note. We have not presented the complete chest CT radiograph images of suspected COVID-19-infected lungs for the following patients. This decision was due to space constraints in this article and the limited relevance of the information contained in these images.
3.2. Patient Code: EF
Date of performing the pulmonary investigation: 22 November 2022.
Figure 7 and Figure 8 show the selection of the lung portion of interest for the patient EF and the same image in “Invert color” format.
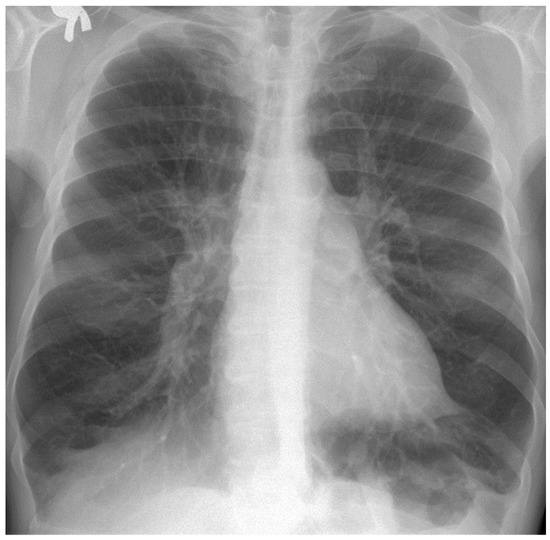
Figure 7.
Selecting the portion of interest of the lungs of patient EF.
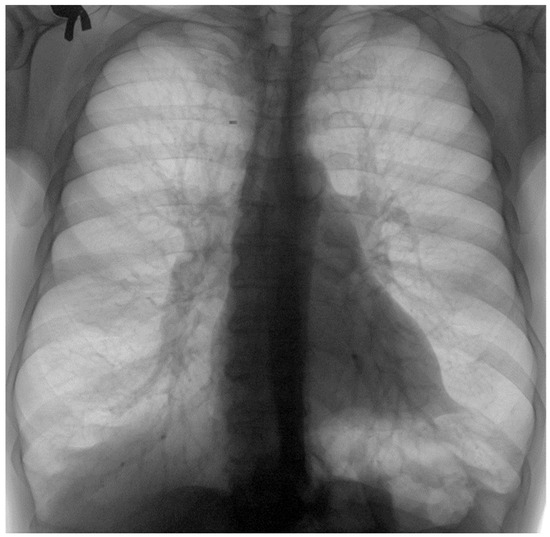
Figure 8.
The image from Figure 7 in “Invert color” format.
Figure 9 and Figure 10 present the defined masks for the left lung and right lung, framed in blue borders.
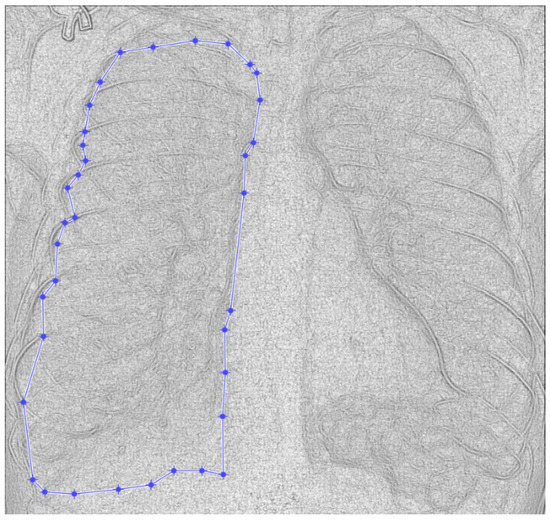
Figure 9.
Defining the mask for the left lung of the second patient.
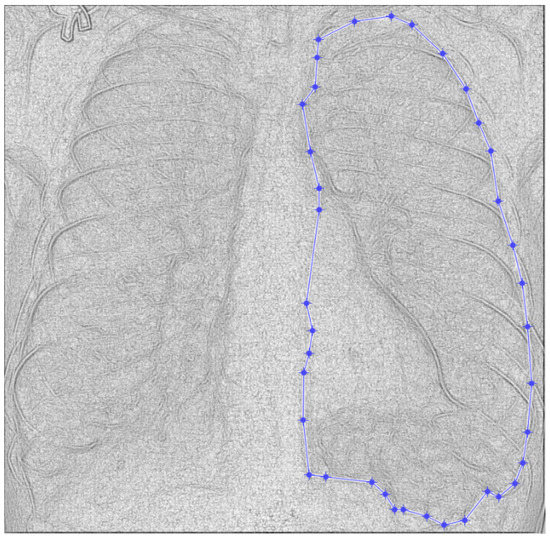
Figure 10.
Defining the mask for the right lung of the second patient.
Table 2 shows the known fractal indicators, such as the fractal dimension of the CT image of the left lung, d1L = 1.9286 ± 0.2480, and the lacunarity Λ = 0.0165; and the fractal dimension of the right lung, d1R = 1.9263 ± 0.2624, and the lacunarity, Λ = 0.0185.

Table 2.
Fractal indicators for the second patient.
Figure 11 depicts the 3D graphical representation of the voxels present in the CT lung image of patient 2. EF. A voxel is a 3D pixel model that, unlike a simple square, is a perfect cube. This modeling technique is theoretically perfect for replicating reality on a large scale. Voxels are currently used in science to accurately and rapidly highlight volumetric data [24,25]. In voxel-based morphometry, concentration differences in pulmonary tissue can be compared using voxels, as shown in Figure 11.
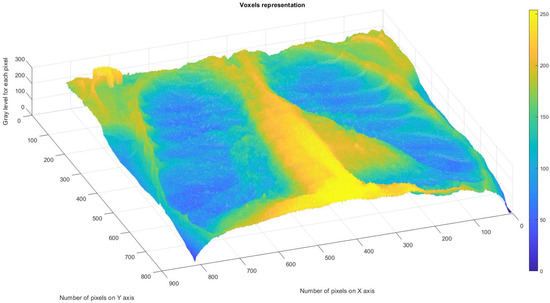
Figure 11.
Three-dimensional graphical representation of voxels in the second patient’s CT lung image.
3.3. Patient Code: VU
Date of performing the pulmonary investigation: 26 February 2021.
Figure 12 and Figure 13 show the selection of lung portion of interest for patient 3 (VU) and the same image in “Invert color” format.
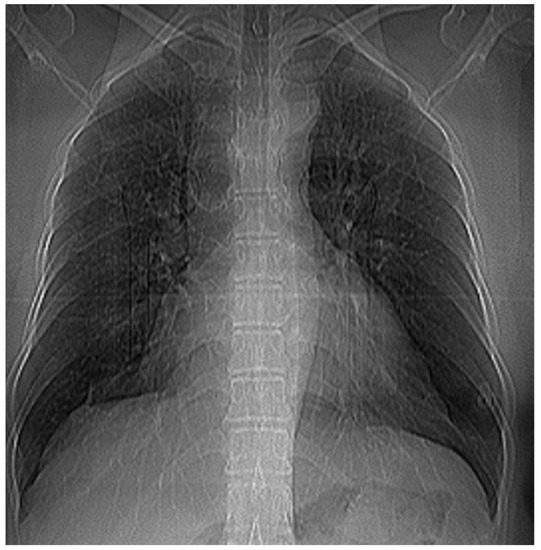
Figure 12.
Selecting the portion of interest of the lungs of patient VU.
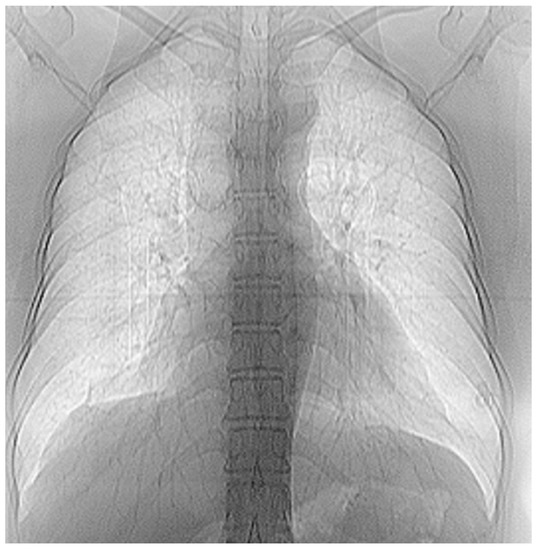
Figure 13.
The image from Figure 12 in “Invert color” format.
Figure 14 and Figure 15 present the defined masks for the left lung and right lung, framed in blue borders.
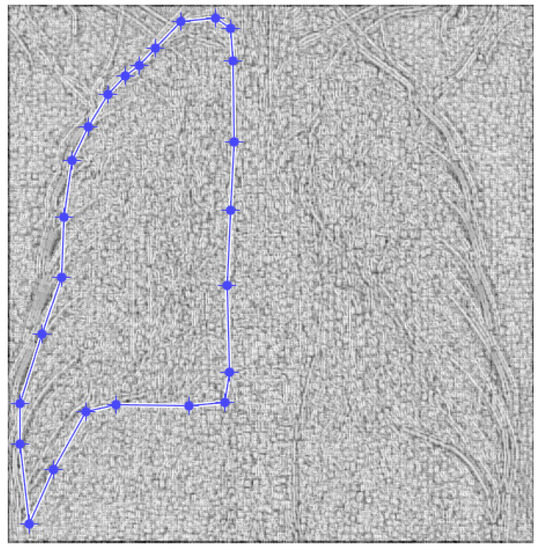
Figure 14.
Defining the mask for the left lung of the third patient.
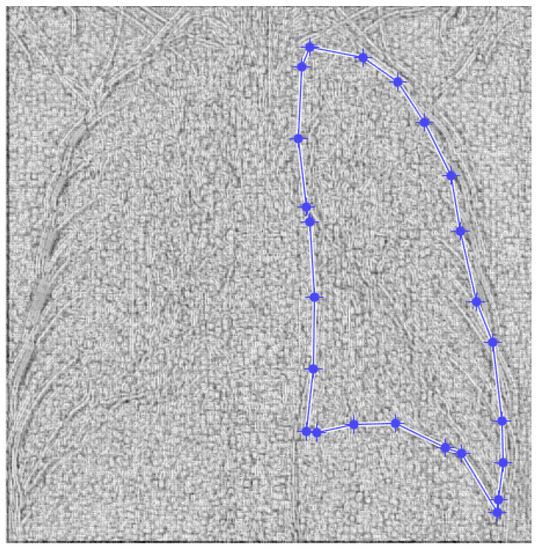
Figure 15.
Defining the mask for the right lung of the third patient.
Table 3 shows the known fractal indicators, such as the fractal dimension of the CT image of the left lung, d1L = 1.8836 ± 0.3148m, and the lacunarity, Λ = 0.0279; and the fractal dimension of the right lung, d1R = 1.8772 ± 0.3204, and the lacunarity, Λ = 0.0291.

Table 3.
Fractal indicators for the third patient.
Figure 16 shows the 3D graphical representation of voxels contained in patient VU’s CT lung image.
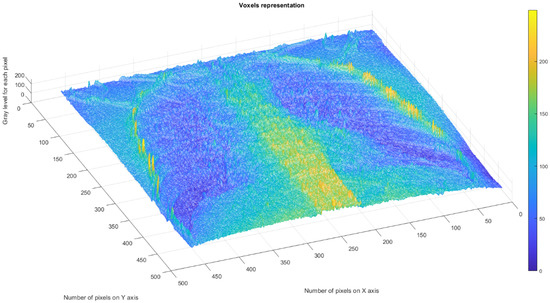
Figure 16.
Three-dimensional graphical representation of voxels in the third patient’s CT lung image.
3.4. Patient Code: VM
Date of performing the pulmonary investigation: 21 December 2021.
Figure 17 and Figure 18 show the selection of lung portion of interest for patient 4, VM, and the same image in “Invert color” format.
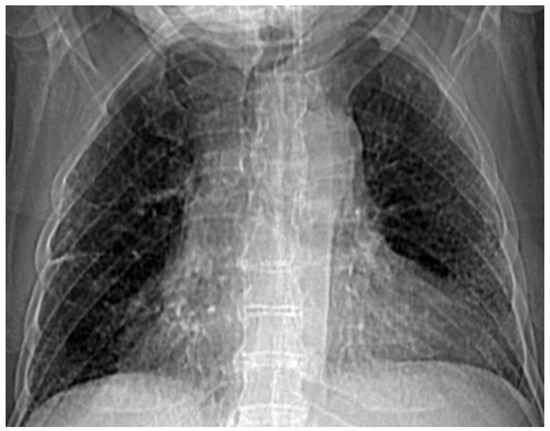
Figure 17.
Selecting the portion of interest of the lung for patient VM.
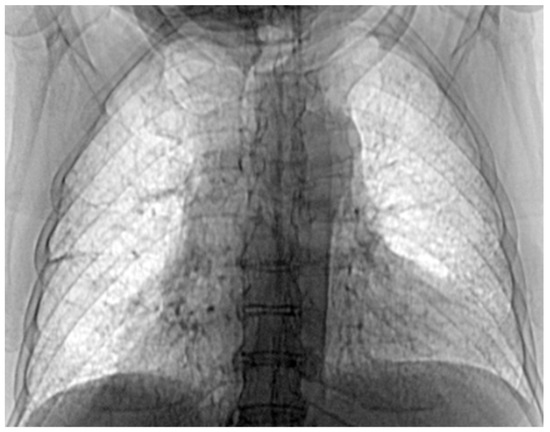
Figure 18.
The image from Figure 17 in “Invert color” format.
Figure 19 and Figure 20 present the defined masks for left lung and right lung, framed in blue borders.
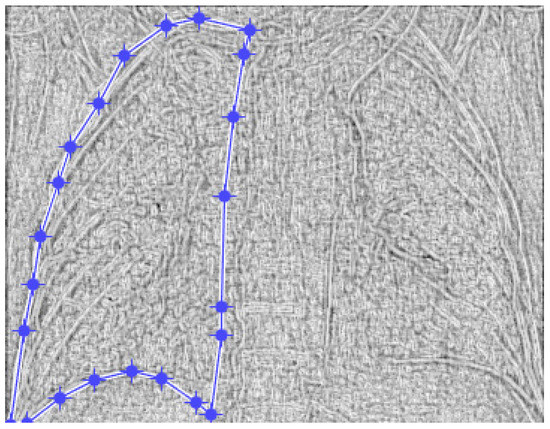
Figure 19.
Defining the mask for the left lung of the fourth patient.
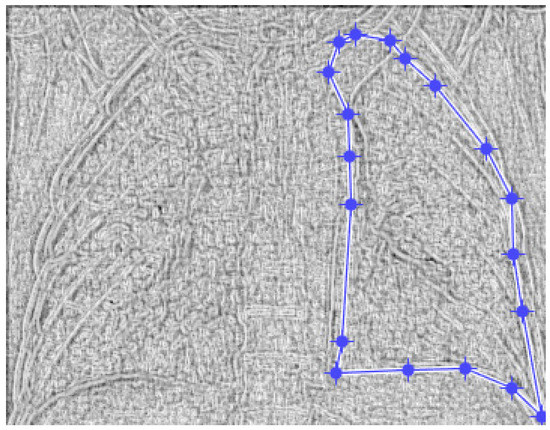
Figure 20.
Defining the mask for the right lung of the fourth patient.
Table 4 shows the known fractal indicators, such as the fractal dimension of the CT image of the left lung, d1L = 1.8378 ± 0.3362, and the lacunarity Λ = 0.0335; and the fractal dimension of the right lung, d1R = 1.8551 ± 0.3371, and the lacunarity, Λ = 0.0331.

Table 4.
Calculation of the fractal indicators for patient 4.
Figure 21 shows the 3D graphical representation of voxels contained in patient VM’s CT lung image.
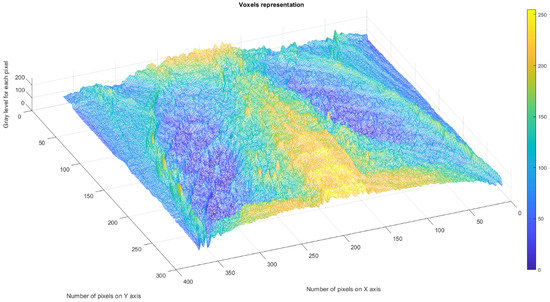
Figure 21.
Three-dimensional graphical representation of voxels in the fourth patient’s CT lung image.
3.5. Patient Code: AG
Date of performing the pulmonary investigation: 25 May 2021.
Figure 22 and Figure 23 show the selection of the lung portion of interest for patient AG and the same image in “Invert color” format.
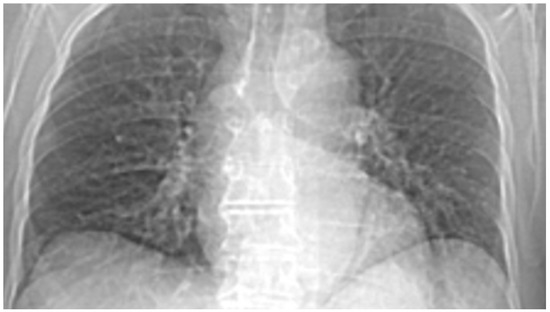
Figure 22.
Selecting the portion of interest of the lung for patient AG.
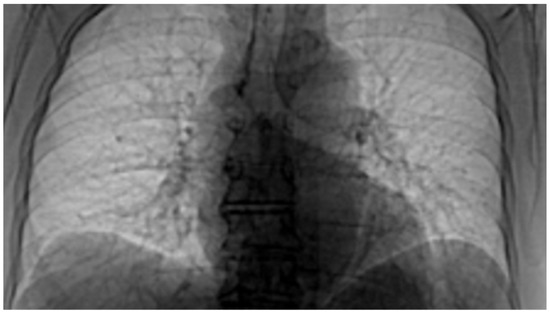
Figure 23.
The image from Figure 22 in “Invert color” format.
Figure 24 and Figure 25 present the defined masks for the left lung and right lung, framed in blue borders.
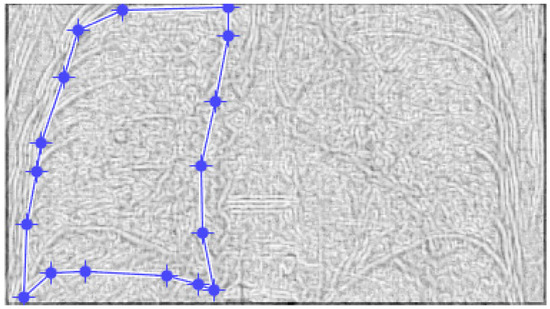
Figure 24.
Defining the mask for the left lung of the fifth patient.
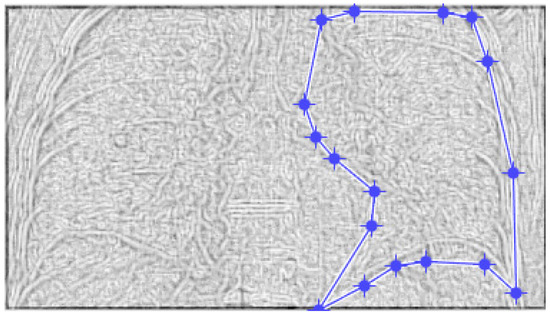
Figure 25.
Defining the mask for the right lung of the fifth patient.
Table 5 shows the known fractal indicators, such as the fractal dimension of the CT image of the left lung, d1L = 1.7661 ± 0.3108, and the lacunarity, Λ = 0.0310; and the fractal dimension of the right lung, d1R = 1.7661 ± 0.3136, and the lacunarity Λ = 0.0315.

Table 5.
Fractal indicators for the fifth patient.
Figure 26 displays the 3D graphical representation of the voxels present in the CT lung image of patient 5. In addition to the high-quality imaging provided by CT procedures, picture evaluation also provides quantitative information regarding various structural features, such as the fractal dimension (left lung and right lung) and lacunarity, the latter of which depicts the measurable heterogeneity of the samples.
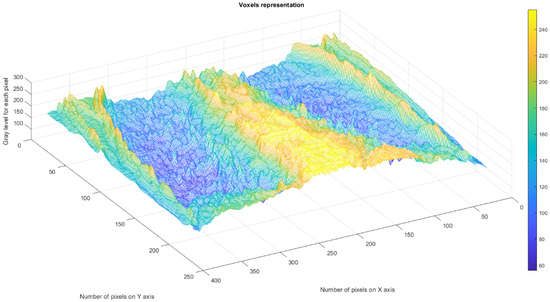
Figure 26.
Three-dimensional graphical representation of voxels in the fifth patient’s CT lung image.
3.6. Full Presentation of the Results
Table 6 below presents the calculated values for both the fractal dimension and lacunarity of the CT image evaluations for all investigated patients.

Table 6.
Fractal indicators of all five investigated patients.
Figure 27 displays the fractal dimension values for the investigated COVID-19 patient group, indicating no significant differences in values between the left and right lung. Additionally, we observed no apparent major differences in fractal dimension values between the left and right lung in any CT imaging controls for the sick patients.
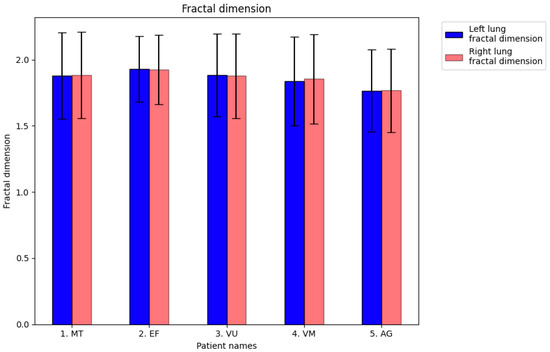
Figure 27.
The fractal dimension (FD) values (±SEM) of CT images of the left lungs and right lungs of affected patients for a comparison with pulmonary controls.
As seen in Figure 28, the lacunarity values in the investigated COVID-19-patient group showed no significant differences between the left and right lungs. Similarly, we found no major differences between the lacunarity values of the lungs in any CT images of controls or sick patients.
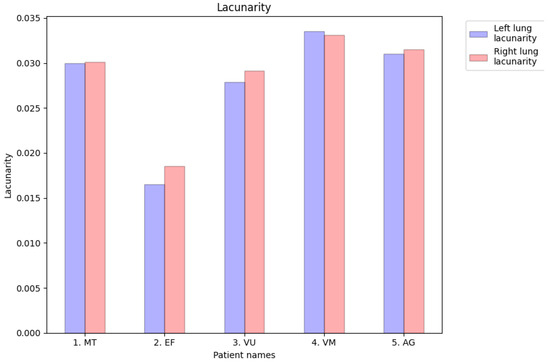
Figure 28.
Lacunarity values of CT images of the left lungs and right lungs of affected patients to compare them with those of pulmonary controls.
Note. Pulmonary COVID-19 may be divided into four main morphological stages, including the following: (1) an initial stage (day 1) with edema, incipient epithelial damage and capillaritis/endothelialitis; (2) the stage of exudative diffuse alveolar damage (days 1–7); (3) the organizational stage of infection (from a week to several weeks); and (4) the fibrotic stage of diffuse alveolar damage (from weeks to months). Undoubtedly, apparent stadial evolution indicates a systematic progression through some distinct stages. The last fibrotic stage is usually associated with long-standing severe and strong disease. Taking into account that in the various stages, the diffuse alveolar damage manifestations frequently coexist side by side, it is markedly observed that stage two represents major spatial homogeneity of lung morphology, and stage four is a reflection of a spatial and temporal heterogeneity specific to COVID-19 [10,11,17]. According to the morphological observations confirmed by the pulmonary CT images, which marked high visual homogeneity at the pixel level as well, highlighted by the values of the fractal parameters obtained (fractal dimension and lacunarity), the clinical investigations, including lung CT, were performed on the first or second day from the onset of disease symptoms in patients infected with COVID-19. Practically, it is a confirmation of the classical studies on the type 2 lung morphology that is present between the first and the seventh day after the onset of the disease, being the stage of exudative diffuse alveolar damage, which is reflected by a major spatial homogeneity of lung morphology. This was demonstrated through numerical experiments—more precisely, through the numerical evaluation of the fractal parameters and the values established for the fractal dimension and lacunarity.
It is important to note that the novel coronavirus, known as COVID-19, has had a devastating impact on global health, affecting over 200 countries and tens of millions of people since its emergence at the end of 2019. This highly infectious disease can spread rapidly, and if not detected and treated promptly, can quickly overwhelm even the most advanced healthcare systems.
While the reverse-transcription polymerase chain reaction (RT-PCR) is the standard diagnostic option, it is known for its lengthy turnaround time and poor sensitivity. The chest radiograph (CXR) method, on the other hand, is the first choice for obtaining compliant images and is widely used due to its ease of availability and quick results. However, computed tomography is undoubtedly the most effective alternative, offering high sensitivity and maximal accuracy for establishing a precise diagnosis.
3.7. Results of Healthy Patients—A Final Comparison Using Control Data
In this subsection, we present and discuss the pulmonary CT scan of healthy lungs, which were not affected by the presence of SARS-CoV-2.
The chest radiograph of healthy lungs on which the fractal analysis was performed is shown in Figure 29a. Aside from the high-quality imaging provided by CT procedures (Figure 29a,b), the picture evaluation assured quantitative information regarding various structural features, such as the fractal dimension and lacunarity.

Figure 29.
(a) Healthy lung image, (b) binary version, (c) mask for the left lung, (d) mask for the right lung.
Figure 30 shows the 2D box-counting algorithm with the local fractal dimension calculation for the healthy-lung CT image. Figure 31 displays the 3D graphical representation of the voxels present in the CT lung image of healthy patient. Table 7 presents the calculated values for the fractal dimension and the lacunarity of the CT image evaluations for the healthy patient.
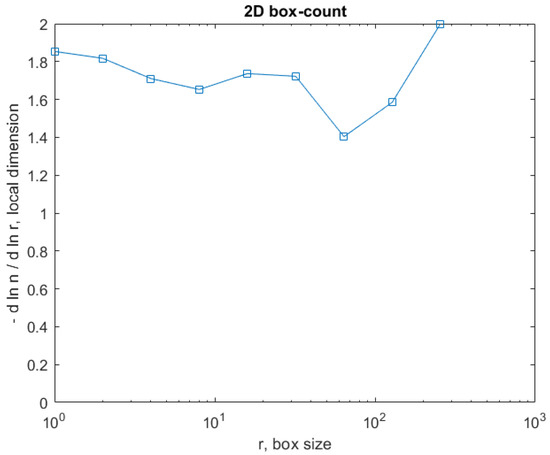
Figure 30.
Two-dimensional box-count algorithm for the local fractal dimension.
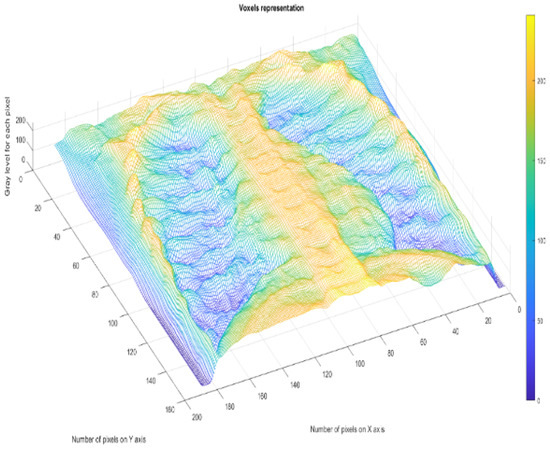
Figure 31.
Three-dimensional graphical representation of voxels.

Table 7.
Calculation of fractal indicators for the healthy lung patient (HLP).
Table 7 shows the known fractal indicators, such as the fractal dimension of the CT image of the left lung, dHL = 1.6410 ± 0.3577, and lacunarity Λ = 0.0475; and the fractal dimension of the right lung, dHR = 1.6318 ± 0.3598, and lacunarity, Λ = 0.0486.
Bodduluri et al. (2018) reported that the mean fractal dimension in 105 healthy lifelong nonsmokers was D = 1.56 [26], which was verified and cited in the paper [27]. In a study published in 2018, Nichita M. and Paun V.-P., two of the authors of the current article, performed the first fractal analysis of lung images from their publishing career [21]. The box-counting algorithm was used to determine fractal properties of the picture. Thus, the adjusted procedures provided the fractal dimension of the following value: D = 1.5661 ± 0.0116.
Comparative Discussion
By comparatively looking at the results obtained for the healthy lung and those obtained for the lungs of some patients infected with the COVID-19 virus [28,29], we notice that the values of the fractal dimensions for the healthy lungs are limited to low values, 1.5–1.6, whereas those of the already infected/diseased lungs (in the first day of disease manifestation) are much higher—between the values of 1.7661 and 1.9263. In addition, lacunarity can be at minimum 0.0486 for a healthy lung, and maximally, 0.0335 for an infected lung. Lacunarity is an efficient measure, especially when it is used to quantify the lack of translational invariance present in fractal and multifractal systems. The determined values are also often used to describe various aspects of mass distribution in such systems. Generally, its value decreases as the system becomes more homogeneous. While lacunarity may be used to distinguish objects with similar fractal dimensions but whose structures fill the space differently, it can also be used independently as a general tool for describing spatial patterns.
3.8. Fractal Analysis Advantages
The advantages of the present paper compared to other works published on the same topic, found in the bibliography of this study [2,3,5,8,28,30,31], are obvious. More precisely, our results are detailed, numerical and complete. We performed a quantitative investigation of pulmonary CT images, based on fractal analysis and the calculation of fractal parameters—fractal dimension and lacunarity. An accurate, correct and unemotional diagnosis can thus be offered, i.e., a non-empirical, scientifically accurate diagnosis of the lung disease due to SARS-CoV-2 infection and its evolution over time, until the patient is cured. The time required for obtaining the diagnosis is short, being under 5 min, by using the software developed by us, as technical support. In short, the entire management of the patients’ illness and hospitalization is changing. Thus, the fractal analysis of pulmonary CT could lead to the establishment of a diagnostic standard at a high level by consulting a pulmonologist who uses this superior practice developed here. This may prevent unnecessary prescription of other clinical investigations and reduce harm to patients and the health system.
4. Conclusions
The current article presents an efficient interpretation of a CT imaging dataset using fractal analysis to investigate and diagnose COVID-19 community cases. This approach has enormous potential to facilitate medical research related to this subject.
The fractal analysis features, such as the fractal dimension and lacunarity values, have been utilized to interpret pulmonary-CT pictures’ textures. This study highlights the need to combine fractal dimension with lacunarity for discriminating between various lung CT image textures, particularly as a reliable method for rapid determination of COVID-19 infection in patients.
The visual aspects of the two lungs appear to be relatively regular; the images were quasi-identical, suggesting that SARS-CoV-2 affects the lungs uniformly and has a homogeneous distribution over their entire inner surface. We thus have confirmation of the classical studies on type 2 lung morphology, showing that between the first and the seventh day after the onset of the disease is the stage of exudative diffuse alveolar damage, which is reflected by a spatial (3D) major homogeneity of lung morphology.
The calculations performed revealed fractal dimension values higher than 1.7661 and lower than 1.9263 for patients infected by SARS-CoV-2. The perfectly healthy patient had the lowest value for the average fractal dimension of the lung CT image. More precisely, for the CT image of the left lung, it was 1.6410 ± 0.3577, and Λ = 0.0475; and the fractal dimension of the right lung was 1.6318 ± 0.3598, and Λ = 0.0486.
Regarding the lacunarity value for patients sick with COVID-19, it ranged from a minimum of 0.0165 to a maximum of 0.0335. Lacunarity serves as a measure of structural heterogeneity in the assessed sample. Additionally, it is used to distinguish objects with similar fractal dimensions but whose structures fill the space differently.
The use of software, together with the stages of image preparation, fractal analysis, and calculation of fractal indicators, takes less than 5 min, making it the fastest way to establish the quantitative diagnosis of COVID-19 infection in the lungs. The fractal analysis of pulmonary CT may lead to the establishment of a diagnostic guideline at a high level by consulting a pulmonologist who uses this superior practice developed here, and may prevent unnecessary prescription of other clinical investigations and reduce harm to patients and the health system.
Author Contributions
Conceptualization, V.-P.P., M.-A.P. and P.P.; methodology, V.-P.P.; software, M.-V.N. and V.-A.P.; validation, V.-P.P., M.-A.P. and V.-A.P.; formal analysis, V.-P.P., M.-A.P. and V.-A.P.; investigation, V.-A.P., M.-A.P. and P.P.; resources, V.-A.P. and M.-A.P.; data curation, V.-A.P. and M.-V.N.; writing—original draft preparation, V.-P.P.; writing—review and editing, M.-A.P. and V.-P.P.; visualization, V.-A.P. and M.-V.N.; supervision, V.-P.P.; project administration, V.-P.P. All authors have read and agreed to the published version of the manuscript.
Funding
This research received no external funding.
Institutional Review Board Statement
The study was conducted in accordance with the Declaration of Helsinki and approved by the Ethics Committee of Rehabilitation Clinical Hospital from Iasi, Romania (protocol code 23651 and date of approval: 10 September 2021).
Informed Consent Statement
Patient consent was waived due to the fact that a document was provided about the fulfilment of standards in patient medical data collection, which was the document asked from the journal.
Data Availability Statement
The data used to support the findings of this study cannot be accessed due to commercial confidentiality.
Acknowledgments
The co-authors M.-A. Paun, V.-A. Paun and V.-P. Paun would like to thank Jenica Paun, for her continuous, kind support.
Conflicts of Interest
The authors declare no conflict of interest.
References
- Weekly Epidemiological Update on COVID-19. Available online: https://www.who.int/publications/m/item/weekly-epidemiological-update-on-covid-19 (accessed on 4 January 2023).
- Afshar, P.; Heidarian, S.; Enshaei, N.; Naderkhani, F.; Rafiee, M.J.; Oikonomou, A.; Fard, F.B.; Samimi, K.; Plataniotis, K.N.; Mohammadi, A. COVID-CT-MD, COVID-19 computed tomography scan dataset applicable in machine learning and deep learning. Sci. Data 2021, 8, 121. [Google Scholar] [CrossRef]
- Qi, X.; Brown, L.G.; Foran, D.J.; Nosher, J.; Hacihaliloglu, I. Chest X-ray image phase features for improved diagnosis of COVID-19 using convolutional neural network. Int. J. Comput. Assist. Radiol. Surg. 2021, 16, 197–206. [Google Scholar] [CrossRef] [PubMed]
- Li, Y.; Xia, L. Coronavirus disease 2019 (COVID-19): Role of chest CT in diagnosis and management. AJR Am. J. Roentgenol. 2020, 214, 1280–1286. [Google Scholar] [CrossRef] [PubMed]
- Gunraj, H.; Wang, L.; Wong, A. COVIDNet-CT: A tailored deep convolutional neural network design for detection of COVID-19 cases from chest CT images. Front. Med. 2020, 7, 608525. [Google Scholar] [CrossRef] [PubMed]
- Ai, T.; Yang, Z.; Hou, H.; Zhan, C.; Chen, C.; Lv, W.; Tao, Q.; Sun, Z.; Xia, L. Correlation of chest CT and RT-PCR testing for coronavirus disease 2019 (COVID-19) in China: A report of 1014 cases. Radiology 2020, 296, E32–E40. [Google Scholar] [CrossRef]
- Fang, Y.; Zhang, H.; Xie, J.; Lin, M.; Ying, L.; Pang, P.; Ji, W. Sensitivity of chest CT for COVID-19: Comparison to RT-PCR. Radiology 2020, 296, E115–E117. [Google Scholar] [CrossRef]
- Borakati, A.; Perera, A.; Johnson, J.; Sood, T. Diagnostic accuracy of X-ray versus CT in COVID-19: A propensity-matched database study. BMJ Open 2020, 10, e042946. [Google Scholar] [CrossRef]
- Mandelbrot, B.B.; Wheeler, J.A. The Fractal Geometry of Nature. Am. J. Phys. 1983, 51, 286. [Google Scholar] [CrossRef]
- Sebok, D.; Vásárhelyi, L.; Szenti, I.; Vajtai, R.; Kónya, Z.; Kukovecz, Á. Fast and accurate lacunarity calculation for large 3D micro-CT datasets. Acta Mater. 2021, 214, 116970. [Google Scholar] [CrossRef]
- Biswas, M.K.; Ghose, T.; Guha, S.; Biswas, P.K. Fractal dimension estimation for texture images-A parallel approach. Pattern Recognit. Lett. 1998, 19, 309–313. [Google Scholar] [CrossRef]
- Lehamel, M.; Hammouche, K. Texture Classification Using Fractal Dimension and Lacunarity. 2014, pp. 1–6. Available online: https://manifest.univ-ouargla.dz/documents/Archive/Archive%20Faculte%20des%20Sciences%20et%20Technologies%20et%20des%20Sciences%20de%20le%20Matiere/2emes-journees-internationales-de-chimie-organometallique-et-catalyse-jicoc-2014/icaiit2014_submission_63.pdf (accessed on 3 February 2023).
- Liu, Y.; Chen, L.; Wang, H.; Jiang, L.; Zhang, Y.; Zhao, J.; Wang, D.; Zhao, Y.; Song, Y. An improved differential box-counting method to estimate fractal dimensions of gray-level images. J. Vis. Commun. Image Represent. 2014, 25, 1102–1111. [Google Scholar] [CrossRef]
- Rajagopalan, V.; Pioro, E.P. Corticospinal Tract and Related Grey Matter Morphometric Shape Analysis in ALS Phenotypes: A Fractal Dimension Study. Brain Sci. 2021, 11, 371. [Google Scholar] [CrossRef]
- Bordescu, D.; Paun, M.A.; Paun, V.A.; Paun, V.P. Fractal analysis of Neuroimagistic. Lacunarity degree, a precious indicator in the detection of Alzheimer’s disease. Univ. Politeh. Buchar. Sci. Bull. Ser. A Appl. Math. Phys. 2018, 80, 309–320. [Google Scholar]
- Tolle, C.R.; McJunkin, T.R.; Gorsich, D.J. An efficient implementation of the gliding box lacunarity algorithm. Phys. D Nonlinear Phenom. 2008, 237, 306–315. [Google Scholar] [CrossRef]
- Kovács, B.B.H.; Varga, D.; Sebők, D.; Majoros, H.; Polanek, R.; Pankotai, T.; Hideghéty, K.; Kukovecz, Á.; Erdélyi, M. Application of Lacunarity for Quantification of Single Molecule Localization Microscopy Images. Cells 2022, 11, 3105. [Google Scholar] [CrossRef]
- Postolache, P.; Borsos, Z.; Paun, V.A.; Paun, V.P. New Way in Fractal Analysis of Pulmonary Medical Images. Univ. Politeh. Buchar. Sci. Bull. Ser. A Appl. Math. Phys. 2018, 80, 313–322. [Google Scholar]
- Sharif, P.M.; Nematizadeh, M.; Saghazadeh, M. Computed tomography scan in COVID-19: A systematic review and meta-analysis. Pol. J. Radiol. 2022, 87, e1–e23. [Google Scholar] [CrossRef]
- Shi, H.; Han, X.; Jiang, N.; Cao, Y.; Alwalid, O.; Gu, J.; Fan, Y.; Zheng, C. Radiological findings from 81 patients with COVID-19 pneumonia in Wuhan, China: A descriptive study. Lancet Infect. Dis. 2020, 20, 425–434. [Google Scholar] [CrossRef]
- Nichita, M.V.; Paun, V.P. Fractal analysis in complex arterial network of pulmonary X-rays images. Univ. Politeh. Buchar. Sci. Bull. Ser. A Appl. Math. Phys. 2018, 80, 325–339. [Google Scholar]
- Nichita, M.V.; Paun, M.A.; Paun, V.A.; Paun, V.P. Fractal analysis of brain glial cells. Fractals dimension and lacunarity. Univ. Politeh. Buchar. Sci. Bull. Ser. A Appl. Math. Phys. 2019, 81, 273–284. [Google Scholar]
- Nichita, M.V.; Paun, M.A.; Paun, V.A.; Paun, V.P. Image Clustering Algorithms to Identify Complicated Cerebral Diseases. Description and Comparison. IEEE Access 2020, 8, 88434–88442. [Google Scholar] [CrossRef]
- Chmielewski, S.; Tompalski, P. Estimating outdoor advertising media visibility with voxel-based approach. Appl. Geogr. 2017, 87, 1–13. [Google Scholar] [CrossRef]
- Takeuchi, H.; Kawashima, R. Voxel-Based Morphometry and Cognitive Function. Brain Nerve 2017, 69, 547–556. [Google Scholar]
- Bodduluri, S.; Puliyakote, A.S.K.; Gerard, S.E.; Reinhardt, J.M.; Hoffman, E.A.; Newell, J.D.; Nath, H.P.; Han, M.K.; Washko, G.R.; Estépar, R.S.J.; et al. Airway fractal dimension predicts respiratory morbidity and mortality in COPD. J. Clin. Investig. 2018, 128, 5374–5382. [Google Scholar] [CrossRef] [PubMed]
- Tanabe, N.; Sato, S.; Suki, B.; Hirai, T. Fractal Analysis of Lung Structure in Chronic Obstructive Pulmonary Disease. Front. Physiol. 2020, 11, 603197. [Google Scholar] [PubMed]
- Bösmüller, H.; Matter, M.; Fend, F.; Tzankov, A. The pulmonary pathology of COVID-19. Virchows Arch. Int. J. Pathol. 2021, 478, 137–150. [Google Scholar] [CrossRef]
- Ye, Z.; Zhang, Y.; Wang, Y.; Huang, Z.; Song, B. Chest CT manifestations of new coronavirus disease 2019 (COVID-19): A pictorial review. Eur. Radiol. 2020, 30, 4381–4389. [Google Scholar] [CrossRef]
- Kamrani, R.; Fallahi, M.J.; Masoompour, S.M.; Ghayumi, S.M.A.; Jalli, R.; Khederzadeh, S.; Erfani, A. Evaluation of the appropriate use of chest CT-Scans in the diagnosis of hospitalized patients in Shiraz teaching hospitals, Southern Iran. Cost. Eff. Resour. Alloc. 2022, 20, 44. [Google Scholar] [CrossRef]
- Sridhar, S.; Kanne, J.P.; Henry, T.S.; Revels, J.W.; Gotway, M.B.; Ketai, L.H. Medication-induced Pulmonary Injury: A Scenario- and Pattern-based Approach to a Perplexing Problem. Radiographics 2022, 42, 38. [Google Scholar] [CrossRef]
Disclaimer/Publisher’s Note: The statements, opinions and data contained in all publications are solely those of the individual author(s) and contributor(s) and not of MDPI and/or the editor(s). MDPI and/or the editor(s) disclaim responsibility for any injury to people or property resulting from any ideas, methods, instructions or products referred to in the content. |
© 2023 by the authors. Licensee MDPI, Basel, Switzerland. This article is an open access article distributed under the terms and conditions of the Creative Commons Attribution (CC BY) license (https://creativecommons.org/licenses/by/4.0/).