Article

A Novel Three-Dimensional Fractal Model for the Normal Contact Stiffness of Mechanical Interface Based on Axisymmetric Cosinusoidal Asperity

1
School of Mechanical Electronic & Information Engineering, China University of Mining & Technology-Beijing, Beijing 100083, China
2
State Key Laboratory of Tribology, Department of Mechanical Engineering, Tsinghua University, Beijing 100084, China
*
Author to whom correspondence should be addressed.
Fractal Fract. 2023, 7(4), 279; https://doi.org/10.3390/fractalfract7040279
Submission received: 14 February 2023 / Revised: 12 March 2023 / Accepted: 14 March 2023 / Published: 24 March 2023
(This article belongs to the Section General Mathematics, Analysis)

Abstract

:
A novel three-dimensional fractal model for normal contact stiffness is proposed in this paper. First of all, a hypothetical surface based on axisymmetric cosinusoidal asperity is established. Then, based on the hypothetical surface, the analytical expressions for the contact stiffness and contact load are derived by combining the three-dimensional fractal theory with the contact mechanics theory. In addition, the simulation results of the presented model and the Pan model are compared with the experimental results. The comparison results show that the maximum relative error of the Pan model is 29.58%, while the maximum relative error of the presented model is 4.35%. Ultimately, the influence of different fractal parameters on contact stiffness is discussed. Under the same contact load, the normal contact stiffness first increases and then decreases with the increase of the fractal dimension D, while the normal contact stiffness monotonically decreases with the increase of scale coefficient G. The results are explained from the perspective of the shape of the asperity. This study provides a novel model for the calculation of normal contact stiffness, which provides a model basis for the study of contact properties for the mechanical interface.

1. Introduction

1.1. Context

With the deepening of research on precision mechanical systems, the analysis of mechanical interfaces considering microscopic morphology has become a hot topic for relevant scholars [1,2,3,4]. There are a large number of mechanical interfaces in the mechanical system; Burdekin and Back [5] pointed out that 60% to 80% of the stiffness of the mechanical complete system was determined by the stiffness of mechanical interfaces. The contact stiffness of the mechanical interface plays an important role in the analysis of the performance of complete mechanical systems. At present, most of the mechanical interface contact parameters need to be obtained from the mechanical interface contact model. Therefore, how to improve the accuracy of the mechanical interface contact model is of great significance for the study of the contact parameters of mechanical systems [6,7,8,9].

1.2. Literature Review

The interface contact model based on the fractal theory can be traced back to the 1990s. First of all, Mandelbrot [10] proposed the fractal theory to explain the randomness and irregularity of natural geometry, which provided a new direction for the development of the contact model. Zhang and Sayles [11,12] proved that the machined surface had fractal characteristics. In 1990, Majumdar and Bhushan [13,14] discussed the role of the fractal theory in the contact of machined surfaces. In their subsequent research, they proposed the fractal model of elastic and plastic contact between rough surfaces (MB model), which pioneered the use of the two-dimensional fractal theory on the surface contact model. Based on the MB model, the 2D fractal model for surface contact was developing continuously. Jiang et al. [15] derived the interface normal contact stiffness model and measured the sample surface to obtain the fractal parameters using the structure function method. The fractal parameters of the samples were substituted into the model and the simulation results were consistent with the experimental results. Tian et al. [16] proposed a new idea to analyze the elastic–plastic deformation stage of asperity, suggesting that the hardness of asperity varies with the interference in the stage. The expression of the total normal load of the surface and the contact model they derived used this idea. Zhang et al. [17] derived the normal contact stiffness model considering the elastic–plastic deformation of asperity. The model was similar to the experimental results of grinding and turning surfaces, which proved the practicability of the model. The normal contact stiffness model derived by Wang et al. [18] takes into account the interaction of asperities during the contact process.
It can be seen from the above that the interface contact model based on the 2D fractal theory was gradually improved by introducing new factors. Unfortunately, these models had limitations in using the 2D fractal theory to simulate the actual three-dimensional rough surface. Ausloos and Berman [19] pointed out that the WM function used in the 2D fractal theory was only an analytic algorithm, not a geometric algorithm. Although the 2D curves drawn using the WM function to simulate anisotropic surface morphology were effective, the simulation of isotropic surface morphology still required use of three-dimensional fractal geometry algorithms to achieve better simulation results [20]. Therefore, Ausloos and Berman [19] generalized the WM function to the new 3D fractal geometry function (the AB function) by introducing multiple variables, which can construct the 3D fractal surface morphologies. Yan and Komvopoulos [20] developed the 3D fractal surface model that can be used to model anisotropic or isotropic surfaces based on the AB function. Then, combined with contact mechanics, the normal contact model simulating the rough silica surfaces is obtained. After that, the 3D fractal theory began to be applied to the contact model of interface. Komvopoulos et al. [21] used the finite element model to analyze the contact deformation in the elastic–plastic deformation stage of asperity and established the 3D fractal model of the interface contact considering the elastic–plastic deformation of asperity. Pan et al. [22] considered the friction factor between contact surfaces and derived the 3D fractal model of interface normal contact stiffness considering friction. Jiang et al. [23] combined the 3D fractal theory with the strain energy method and derived the normal contact model for the bolted joints considering the interaction between asperities.
The above models were based on hemispherical asperity. Nevertheless, with the further development of the mechanical interface contact model, relevant studies [24,25,26,27] found that the shape of asperity greatly impacts the accuracy of the contact model. Krishivasan and Jackson [28] verified the difference in contact deformation between hemispherical asperity and 3D axisymmetric sinusoidal asperity by using a finite element model and gave the empirical equation of normal pressure about the contact area of asperity during the elastic–plastic deformation. The theory proposed by Johnson and Greenwood [29] suggested that the cross-section of the hemispherical asperity at the contact position should be elliptical rather than circular and that the eccentricity of this ellipse was load-dependent. Saha et al. [30] established an axisymmetric sinusoidal body with a base as the shape of the asperity and developed an associated contact model. The empirical equation relating the contact area to the contact pressure of this model was derived using the finite element method. An et al. [27] proved the axisymmetric cosinusoidal asperity is more similar to the asperity on the real surface than the hemispherical asperity, and the contact stiffness model based on the axisymmetric cosinusoidal asperity was closer to the experimental results than the model based on hemispherical asperity.

1.3. New Approach

Considering the influence of the shape of the asperity on the contact model, a novel 3D fractal model for the normal contact stiffness of the mechanical interface based on axisymmetric cosinusoidal asperity will be constructed in this paper. Firstly, a new hypothetical 3D surface will be proposed based on the axisymmetric cosinusoidal asperity and the 3D fractal theory. Then, combined with the contact mechanics theory, the contact deformation process of a single asperity will be analyzed. Furthermore, the analytical expressions relating the normal contact load to the normal contact stiffness of the interface will be derived by combining the truncated asperity size distribution function. Eventually, a new normal contact stiffness model of the mechanical interface will be established.

2. Establishment of the Hypothetical Surface

The interface consists of two rough surfaces. Therefore, the establishment of the hypothetical 3D surface will be first introduced in this paper.
The establishment of the surface needs to combine the shape of asperity on it and the 3D fractal theory. Accordingly, the shape will be determined in the first part of this section. After determining the shape, combined with the 3D fractal theory, the hypothetical surface will be established.

2.1. The Shape of a Single Asperity

The axisymmetric cosinusoidal body is more effective for simulating the asperity on a machined surface than a hemispherical body [27]. Therefore, the axisymmetric cosinusoidal body will be used as the shape of asperity. This shape can be represented by a 2D curve because it is a revolution body. The curve is shown in Figure 1.
As shown in Figure 1, the curve is a cosine curve, and its function expression can be set as
z ( x ) = h [ 1 + cos ( π x l ) ] ,     ( 0 < x < l )
where x and z are the coordinates of the rectangular coordinate system in Figure 1; h is the height of the asperity; and l is the width of the asperity.
There is a certain proportional relationship between h and l. To facilitate the derivation of the following equations, the parameter k is defined as follows
k = l / h

2.2. The Hypothetical Three-Dimensional Surface

Yan [20] improved a function based on the AB function. The function can construct a 3D fractal surface, and the function expression is
z ( x , y ) = L ( G L ) ( D 2 ) ( ln γ M ) 1 / 2                         m = 1 M n = 0 n max γ ( D 3 ) n { cos ϕ m , n cos [ 2 π γ n ( x 2 + y 2 ) L cos ( tan 1 ( y x ) π m M ) + ϕ m , n ] }
where, x, y, and z are the coordinates of the space rectangular coordinate system for constructing the surface; L is the sampling length; G is the scale coefficient of the surface; D is the fractal dimension of the surface (2 < D < 3), which influences the complexity and irregularity of surface morphology; M is the number of overlapping wrinkles used to construct the surface (1 < M < 100. When M = 1, the surface is anisotropic); γ is the frequency density parameter of the surface ( γ > 1 . According to reference [31], γ = 1.5); φ m , n is the random phase; n is the frequency index of the asperity ( n = int [ ln ( 1 / L a ) ln γ ] , La is a value within the sampling length range); and nmax can be obtained from the Equation (4) as
n max = int [ ln ( L / L s ) ln γ ]
where Ls is the resolution of the measuring instrument.
It can be seen from the reference [20] that the normal interference δ of the asperity on the surface can be deduced as follows
δ = 2 ( 4 D ) G ( D 2 ) ( ln γ ) 1 / 2 ( r ) ( 3 D )
where r is the radius of the circular section of the undeformed asperity at the contact location.
According to the definition, δ can also be expressed using Equation (1) as
δ = h [ 1 cos ( π r l ) ]
Combined with Equations (5) and (6), the relationship between h and r can be written as
h = 2 G ( D 2 ) ( ln γ ) 1 / 2 ( 2 r ) ( 3 D ) [ 1 cos ( π r l ) ]
The term cos ( π r l ) is approximately calculated using Taylor’s theorem as
cos ( π r l ) = 1 π 2 r 2 2 l 2
The relationship between h and r is deduced using Equations (2), (7) and (8), as follows
h = 2 ( D 5 ) π 2 k 2 G ( 2 D ) ( ln γ ) 1 / 2 r ( D 1 )
The truncated area a at the contact location of undeformed asperity is
a = π r 2
According to Equations (9) and (10), the relationship between h and a of the asperity is obtained as
h = 2 ( D 5 ) π 5 D 2 k 2 G ( 2 D ) ( ln γ ) 1 / 2 a ( D 1 ) 2

3. Contact Analysis of a Single Asperity

The contact behavior of the interface can be assumed to be the sum of the contact behaviors of the asperities of the interface. Based on the analysis in Section 2, the shape of the asperity and the hypothetical surface is obtained. Therefore, the contact deformation between the single asperity and the rigid plane will be analyzed in this section. The analytical expressions of the normal contact stiffness and normal contact load of the asperity will be finally derived.
When the asperity contacts the rigid plane, the asperity begins to produce elastic deformation, elastic–plastic deformation, and fully plastic deformation in turn with the increase of load. The schematic of the contact between the single asperity and the rigid plane is shown in Figure 2. The red line indicates the shape of the asperity before deformation; the green line represents the shape of the asperity after deformation; r’ is the radius of the circular section of the deformed asperity at the contact location.

3.1. Elastic Deformation Stage

With the increase of contact load, the asperity will enter the elastic deformation stage first. The Hertz contact theory [27] is used to analyze the contact deformation of the asperity in the elastic deformation stage. The relationship between δ and average contact pressure P e a of the asperity is
δ = ( 3 π P e a 4 E ) 2 R
where E is the effective Young’s modulus: E = [ ( 1 v 1 2 ) / E 1 + ( 1 v 2 2 ) / E 2 ] ( 1 ) ( v 1 , v 2 are the Poisson’s ratio of materials of two contact surfaces; E1, E2 are Young’s modulus of materials of two contact surfaces); and R is the curvature radius of the asperity, which can be calculated by the following equation as [27]
R = | 1 d 2 z ( x ) d x 2 | x = 0 = | l 2 h π 2 cos ( π x l ) | x = 0 = l 2 h π 2
Combined with Equations (12) and (13), Pea is expressed as Equation (14) as
P e a = 4 E h 1 / 2 δ 1 / 2 3 l
According to reference [20], the real contact area ae of the asperity can be written as
a e = 1 2 a = π R δ
By definition, the normal contact load Fne of the asperity can be obtained using Equations (2), (11), (14), and (15) as follows
F n e = P e a a e = 2 11 2 D 2 ( ln γ ) 1 / 2 E G D 2 a 4 D 2 3 π 4 D 2
Contact stiffness is the derivative of contact load with respect to interference. So, the normal contact stiffness kne of a single asperity is calculated using Equation (16) as
k n e = d F n e d δ = 4 D 3 D 2 3 / 2 E 3 π 1 / 2 a 1 / 2
According to the reference [32], when P e a = 1.1 k μ σ y , the asperity begins to produce plastic deformation when the friction factor is considered. According to Equation (12), the critical interference δ e c of the elastic deformation stage is
δ e c = ( 33 π k μ ϕ 40 ) 2 R
where k μ is the piecewise factor of friction (when 0 μ 0.3 , k μ = 1 0.228 μ ; when 0.3 < μ < 0.9 , k μ = 0.932 e 1.58 ( μ 0.3 ) . Where μ is the friction factor between the contact surfaces); and ϕ = σ y / E ; σ y is the yield strength of the softer material between the contact surfaces.
Combined with Equations (2), (5), (10), (11), (13) and (18), the critical contact truncated area aec of the elastic deformation stage of the asperity can be expressed as follows
a e c = [ 2 2 D 9 π 4 D G 4 2 D ln γ ( 33 k μ ϕ 40 ) 2 ] 1 2 D

3.2. Plastic Deformation Stage

With the increase of contact load, the asperity will first enter the elastic–plastic deformation stage after the elastic deformation stage. However, due to the fact that there is no complete analytical formula at the stage of elastic–plastic deformation, this paper will use mathematical methods to analyze this stage. Elastic–plastic deformation is the transition stage between elastic deformation and plastic deformation; therefore, the plastic deformation of the asperity will be first discussed in this section. It can be seen from reference [33] that the real contact area ap of the asperity in the plastic deformation stage is equal to the truncated area a as follows
a p = a = π r 2
According to the theory of contact mechanics [34], the average contact pressure Ppa of the asperity in the plastic deformation stage is
P p a = H
where H is the hardness of the softer material of the interfaces.
It can be seen from reference [35] that the upper limit of plastic average pressure of a single asperity Ppul is defined as follows
P p u l = 3 σ y
It can be seen from reference [34] that the relationship between Ppul and H is
H = 0.93 P p u l
According to Equations (21)–(23), Ppa can be expressed as
P p a = 2.79 σ y
The normal contact load Fnp of a single asperity in the plastic deformation stage can be obtained using Equations (20) and (24).
F n p = P p a a p = 2.79 σ y a
For the critical point of fully plastic deformation, the relationship between σ y and Ppa is given in reference [34] as
P p a σ y = 2 3 [ 1 + ln ( 1 3 E σ y | d z ( r p c ) d r p c | ) ] = 2.79
According to Equation (26), the critical radius rpc of the contact truncated section of the plastic stage can be written in the following form
r p c = l π arcsin ( 2 . 79 e 7 / 2 σ y l π E h ) = l π arcsin ( 2 . 79 e 7 / 2 σ y k π E )
The critical contact truncated area apc of the plastic stage is derived from Equations (10) and (27).
a p c = π r p c 2 = l 2 π arcsin 2 ( 2 . 79 e 7 / 2 σ y l π E h ) = [ 2 D 5 π 4 D 2 G 2 D k ( ln γ ) 1 / 2 arcsin ( 2 . 79 e 7 / 2 σ y k π E ) ] 2 2 D
The term arcsin ( 2.79 e 7 / 2 k σ y π E ) is approximately calculated using the Taylor theorem as follows
arcsin ( 2 . 79 e 7 / 2 σ y k π E ) = 2 . 79 e 7 / 2 σ y k π E
Substituting Equation (29) into Equation (28), apc can be obtained as
a p c = ( 2.79 e 7 / 2 2 D 5 π 2 D 2 ϕ G 2 D ( ln γ ) 1 / 2 ) 2 2 D

3.3. Elastic–Plastic Deformation Stage

The elastic–plastic deformation stage is the transition stage between the elastic deformation stage and the plastic deformation stage. In this section, the analytical method of reference [16] will be used to analyze the contact process of the asperity in the elastic–plastic deformation stage.
First of all, the relationship between normal contact pressure and hardness of asperity during elastic deformation and plastic deformation will be discussed. When P e a = P e a c = 1.1 k μ σ y , plastic deformation of asperity occurs. According to Equations (21)–(23), Peac has a linear relationship with H, which can be written as follows
P e a c = K H
where K is a coefficient ( K = 0.4 k μ ).
According to Equations (12) and (31), Pea can be written as
P e a = K H δ δ e c
From Equations (21) and (32), it can be concluded that the average contact pressure of the asperity has a linear relationship with the hardness at the stage of elastic deformation and plastic deformation. Therefore, it is considered that the average contact pressure Pepa of the asperity during the elastic–plastic deformation also has a linear relationship with the hardness. Pepa can be set to the following form
P e p a = H G
where HG is the hardness of the asperity in the elastic–plastic deformation stage. HG will change with the interference of the asperity. Referring to the relations (24) and (32) between the average contact pressure and hardness in the elastic deformation stage and the plastic deformation stage, HG should have the same linear relationship with the truncated area a, which can be listed as follows
H G = c 1 σ y ( a a e c ) c
where c and c1 are coefficients to be determined.
When the asperity is at the elastic critical interference and the plastic critical interference during the contact deformation process, HG should meet the following two conditions
H G ( a e c ) = P e a ( a e c )
H G ( a p c ) = P p a ( a p c )
According to Equations (35) and (36), c and c1 can be determined as
c 1 = 2.79 K
c = ln K ln a e c a p c
HG can be obtained by substituting Equations (37) and (38) into Equation (35).
H G = 2.79 K σ y ( a a e c ) c
According to Equations (33), (39) and (40), the normal contact load Fnep of the asperity at the stage of elastic–plastic deformation is deduced as follows
F n e p = H G a = 2.79 K σ y a 1 + c a e c c
The normal contact stiffness knep of the asperity in the elastic–plastic deformation stage is obtained in the form
k n e p = d F e p d δ = 2.79 3 D G ( 2 D ) 2 ( D 3 ) π 3 D 2 ( 1 + c ) K σ y a e c c ( ln γ ) 1 / 2 a c + D 1 2

4. Establishment of Interface Contact Model

The contact deformation process of a single asperity in three deformation stages is analyzed, and the analytical expressions of the normal contact load and the normal contact stiffness in each deformation stage are obtained in Section 3. In this section, the contact stiffness model of the entire interface will be derived by combining the analysis results in Section 3 with the truncated asperity size distribution function.
Before deriving the contact stiffness model of the interface, the following assumptions are made for the contact model: (1) The surface morphology follows the fractal theory; (2) The shapes of all asperities on the surface are axisymmetric cosinusoidal bodies; (3) The contact between two rough surfaces is assumed to be the contact between a rough surface and a rigid plane; (4) The interaction between asperities is ignored in the contact process; and (5) The macromatrix deformation is not considered during the contact process. Based on the above five assumptions, the contact stiffness model of the interface can be deduced.
According to reference [20], the truncated asperity size distribution function of the asperity on the surface is
n ( a ) = ( D 1 ) 2 a L ( a L a ) D + 1 2 = ( D 1 ) 2 a L D 1 2 a D + 1 2
where aL is the largest truncated area of asperity.
By definition, the real contact area A of the interface is obtained using Equation (42).
A = a e c a L a n ( a ) d a + a p a e c a n ( a ) d a + 0 a p a n ( a ) d a = D 1 ( 3 D ) a L
According to Equations (16), (25), (40) and (42), when D ≠ 2.5, the total normal contact load Fn of the interface can be deduced as
F n = a e c a L F n e n ( a ) d a + a p c a e c F n e p n ( a ) d a + 0 a p c F n p n ( a ) d a = ( D 1 ) 2 11 2 D 2 E G D 2 ( ln γ ) 1 / 2 a L D 1 2 3 ( 5 2 D ) π 4 D 2 [ ( a L 5 2 D 2 a e c 5 2 D 2 ) ] +       2.79 ( D 1 ) 2 ( c + 1.5 0.5 D ) K σ y a e c c a L D 1 2 ( a e c c + 1.5 0.5 D a p c c + 1.5 0.5 D ) +       3 ( D 1 ) σ y 3 D a L D 1 2 a p c 3 D 2
When D = 2.5, Fn can be written as follows
F n = a e c a L F n e n ( a ) d a + a p c a e c F n e p n ( a ) d a + 0 a p c F n p n ( a ) d a = 2 ( ln γ ) 1 / 2 E G 1 / 2 π 3 / 4 a L 3 / 4 ln ( a L a e c ) + 2.79 ( D 1 ) 2 ( c + 1.5 0.5 D ) K σ y a e c c a L D 1 2 ( a e c c + 1.5 0.5 D a p c c + 1.5 0.5 D ) + 3 ( D 1 ) σ y 3 D a L D 1 2 a p c 3 D 2
According to Equations (17), (41) and (42), the total normal contact stiffness Kn of the interface is obtained in the following form
K n = a e c a L k n e n ( a ) d a + a p c a e c k n e p n ( a ) d a = ( D 1 ) ( 4 D ) 2 3 / 2 E ( 2 D ) ( 3 D ) 3 π 1 / 2 a L D 1 2 ( a L 2 D 2 a e c 2 D 2 ) + 2.79 ( D 1 ) 2 ( D 4 ) G ( 2 D ) π 3 D 2 ( 1 + c ) K σ y c ( 3 D ) ( ln γ ) 1 / 2 a e c c a L D 1 2 ( a e c c a p c c ) d a
The dimensionless form of Fn and Kn is as follows.
When D ≠ 2.5, the dimensionless total normal contact load F n * is written as follows
F n * = a e c a L F n e n ( a ) d a + a p c a e c F n e p n ( a ) d a + 0 a p c F n p n ( a ) d a = ( D 1 ) 2 11 2 D 2 G * D 2 ( ln γ ) 1 / 2 a L * D 1 2 3 ( 5 2 D ) π 4 D 2 ( a L * 5 2 D 2 a e c * 5 2 D 2 ) + 2.79 ( D 1 ) 2 ( c + 1.5 0.5 D ) K ϕ a e c * c a L * D 1 2 ( a e c * c + 1.5 0.5 D a p c * c + 1.5 0.5 D ) + 3 ( D 1 ) 3 D ϕ a L * D 1 2 a p c * 3 D 2
where F n * = F n / ( E A a ) , G * = G / A a , a L * = a L / A a , a e c * = a e c / A a , a p c * = a p c / A a . Aa is the nominal contact area of the interface.
When D = 2.5, F n * is written as
F n * = a e c a L F n e n ( a ) d a + a p c a e c F n e p n ( a ) d a + 0 a p c F n p n ( a ) d a = 2 ( ln γ ) 1 / 2 G * 1 / 2 π 3 / 4 a L * 3 / 4 ln ( a L * a e c * ) + 2.79 ( D 1 ) 2 ( c + 1.5 0.5 D ) K ϕ a e c * c a L * D 1 2 ( a e c * c + 1.5 0.5 D a p c * c + 1.5 0.5 D ) + 3 ϕ ( D 1 ) 3 D a L * D 1 2 a p c * 3 D 2
The dimensionless total normal contact stiffness K n * of the interface is
K n * = 2 3 / 2 ( D 1 ) ( 4 D ) 3 π 1 / 2 ( 2 D ) ( 3 D ) a L * D 1 2 ( a L * 2 D 2 a e c * 2 D 2 ) + 2.79 2 ( D 4 ) ( D 1 ) G * ( 2 D ) π 3 D 2 ( 1 + c ) K ϕ c ( 3 D ) ( ln γ ) 1 / 2 a e c * c a L * D 1 2 ( a e c * c a p c * c )
where K n * = K n / ( E A a ) .

5. Results and Discussion

Based on the analysis in Section 4, a 3D fractal model of the normal contact stiffness of the mechanical interface based on the axisymmetric cosinusoidal asperity is obtained. In order to verify the accuracy of this model, the experimental results with the numerical simulation results of the presented model and the reference [22] model (Pan model) will first be compared in this section. Then, the simulation results of the presented model and the Pan model will be compared under different fractal parameters, and the influence of fractal parameters on the normal contact stiffness will be discussed.

5.1. Numerical Simulation and Experimental Test

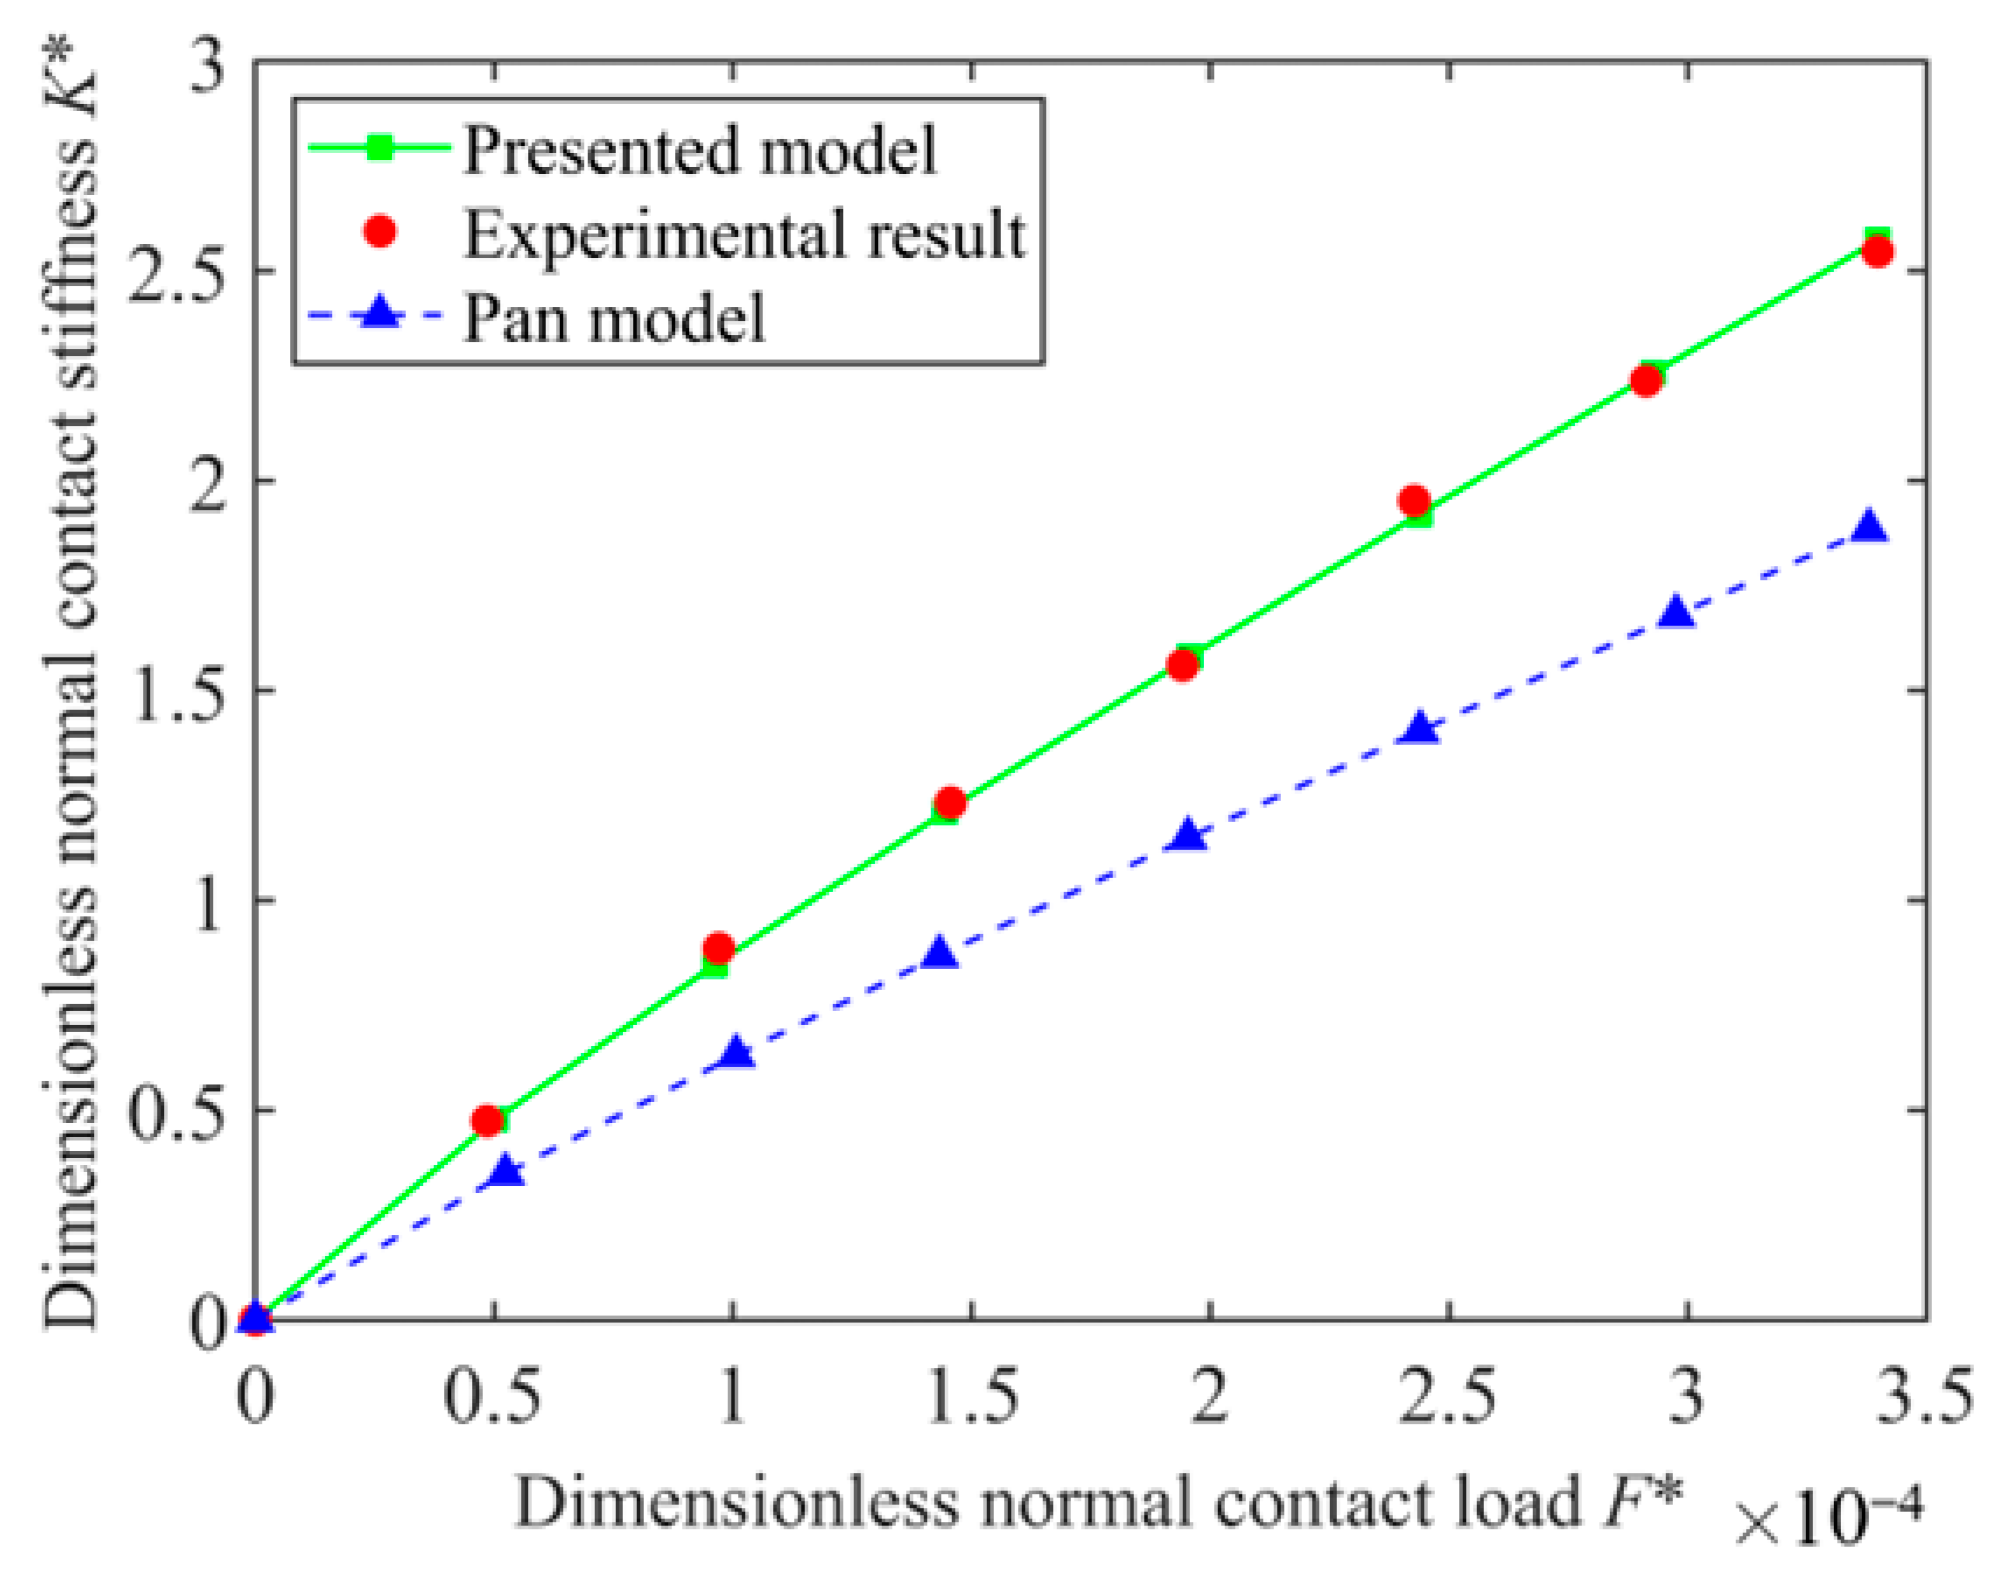
The experimental data are from reference [27]. The box-counting method [36] is used to calculate the fractal parameters of the sample surface for the 45# steel sample with a roughness of 0.672 µm in reference [27]. The fractal parameters of the sample surface are D = 2.416, G* = 2.49 × 10⁻³. By substituting the fractal parameters and material parameters of the sample into the two models, the numerical simulation results of the two models can be obtained. The experimental data and the simulation results of the two models are compared and the comparison results are shown in Figure 3.
The relationship curves between the dimensionless total normal contact load F n * and dimensionless total normal contact stiffness K n * of the 45# steel sample with a roughness of 0.672 µm are shown in Figure 3. In general, it can be seen from Figure 3 that the experimental data have the same variation character as the simulation results of the two models, and K n * increases with the increase of F n * . In terms of numerical value, the simulation results of the presented model fit the experimental results more closely. Furthermore, there is a certain gap between the simulation results of the Pan model and the experimental results, which increases with the increase of F n * .
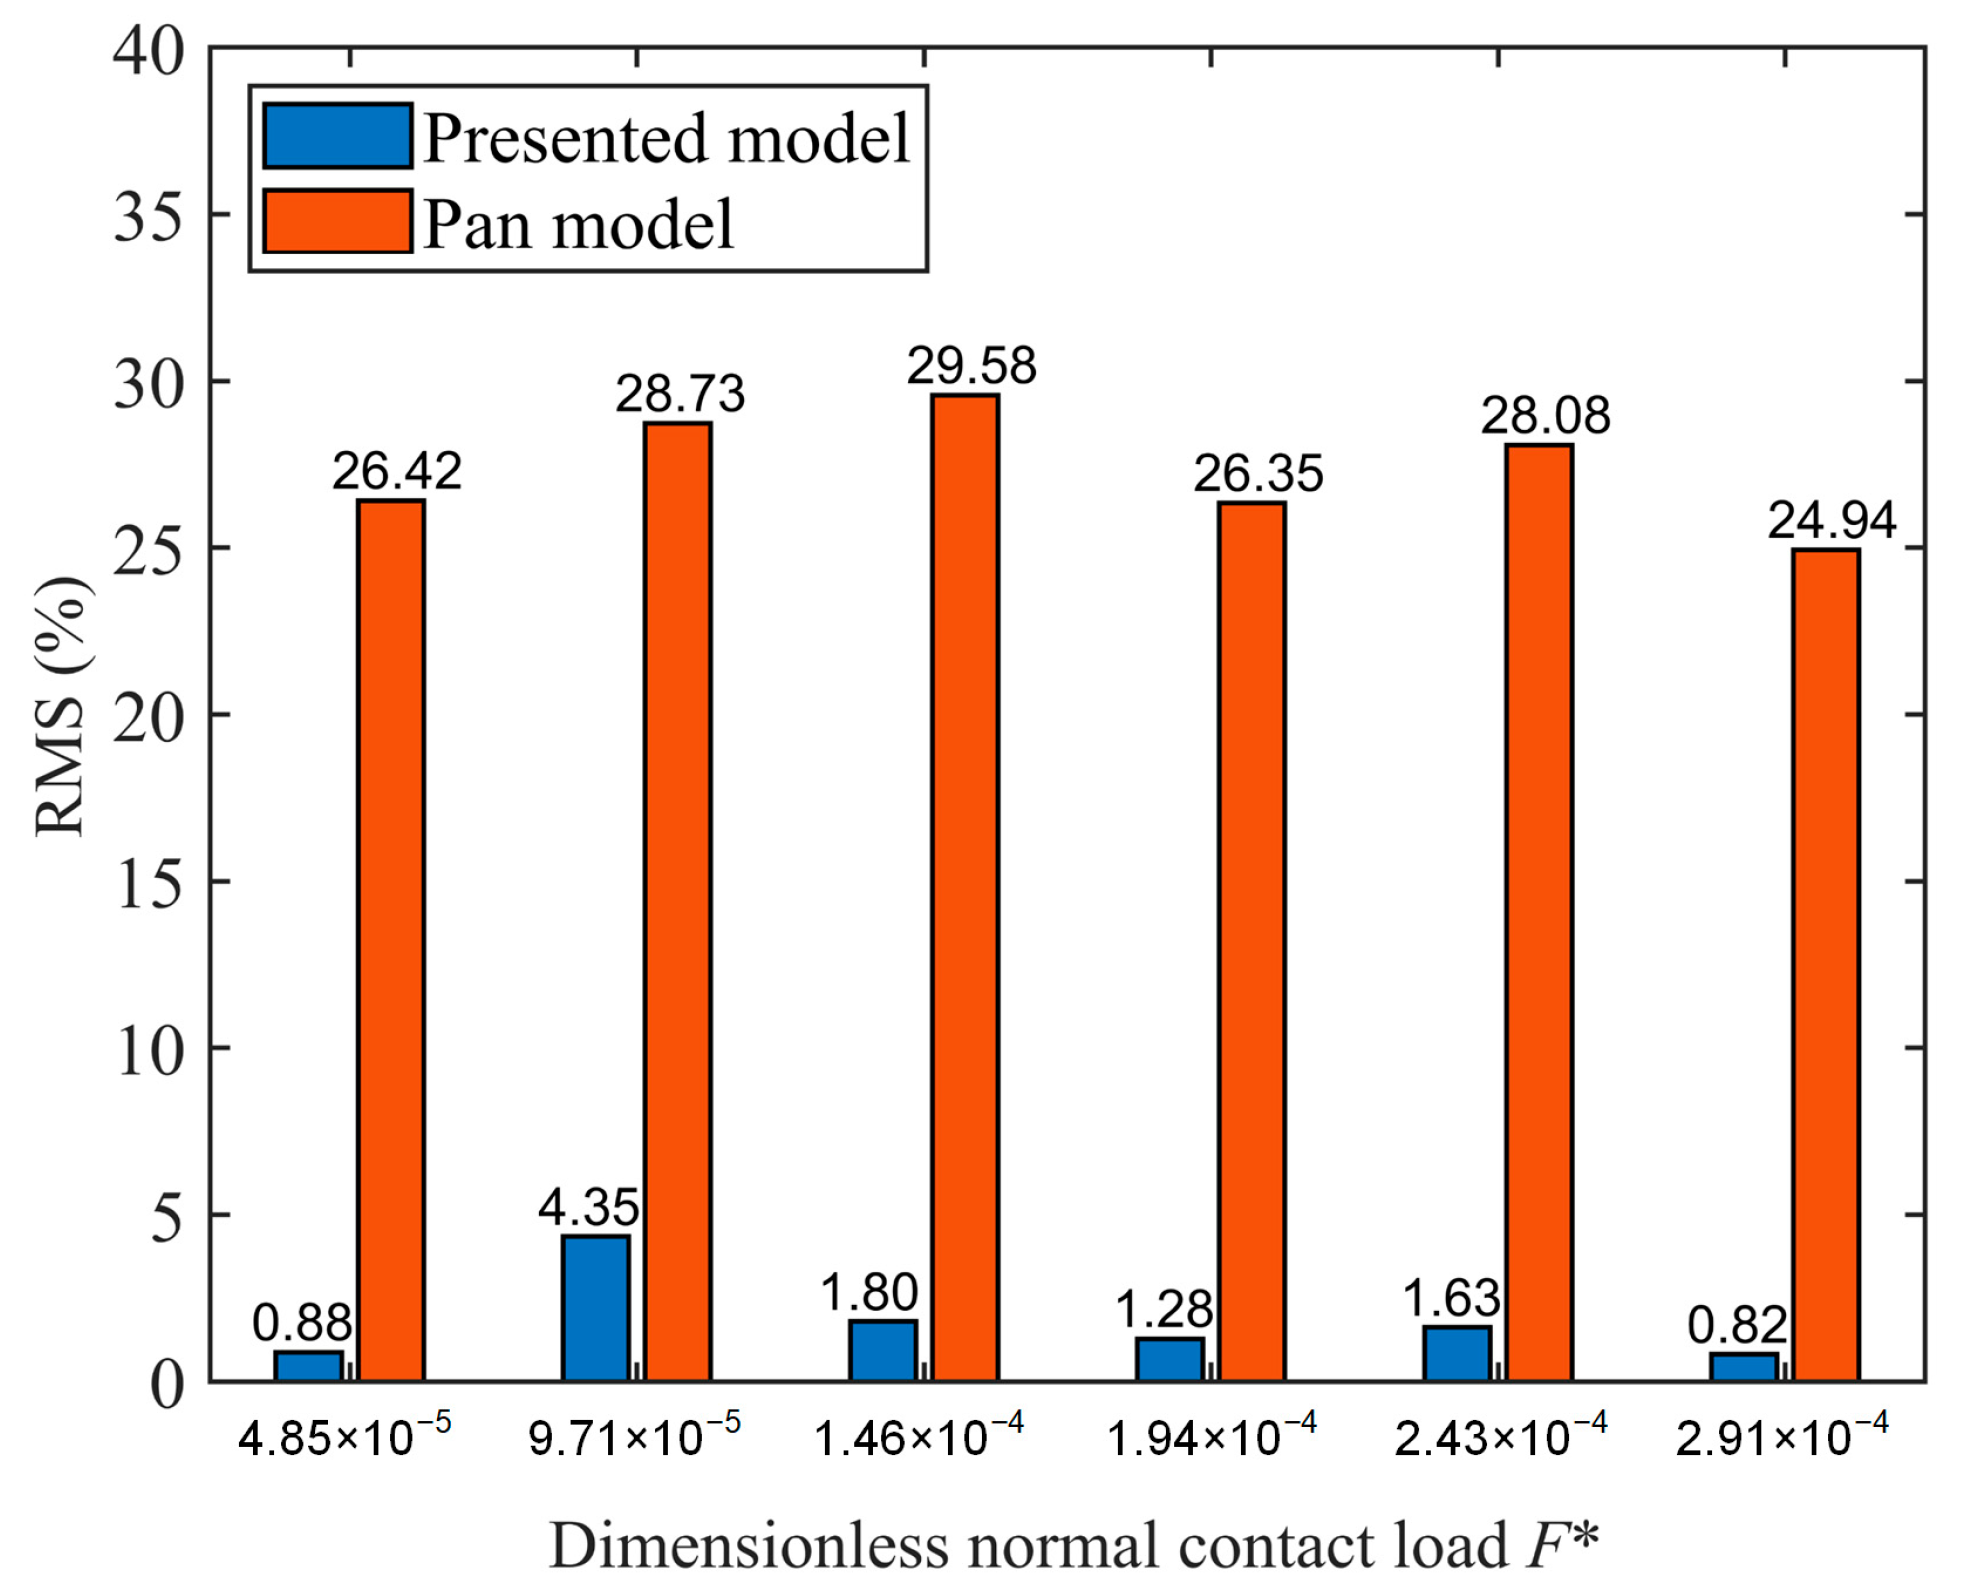
The relative error between the experimental results and the simulation results of the two models is shown in Figure 4.
For the changing trend, the relative errors between the experimental results and the simulation results of the two models have no obvious trend of change. In terms of numerical value, the relative error between the simulation results of the presented model and the experimental results is relatively small, with the maximum relative error of 4.35%. Meanwhile, the maximum relative error between the simulation results of the Pan model and the experimental results is 29.58%.
The above phenomena can be explained by analyzing the differences between the two models. The shape of asperity is the main difference between the two models. The presented model is based on axisymmetric cosinusoidal asperity and the Pan model is based on hemispherical asperity. The difference in the shape of asperity leads to the gap in the simulation results of the two models, and the gap increases with the increase of the load. The specific analysis is as follows.
The elastic deformation stage is mainly carried out at the top of the asperity. The top shapes of the two kinds of asperities are similar, so the contact deformation of the two asperities in the elastic deformation stages is similar.
The elastic–plastic deformation stage and plastic deformation stage are mainly carried out in the lower part of the asperity. When the two bodies are the same height, the volume of the lower half of the axisymmetric cosinusoidal body is larger than that of the hemispherical body. Therefore, when the asperity is in the stage of elastic–plastic deformation and plastic deformation, there will be more asperities involved in the calculation in the stiffness model established by the hemispherical asperity under the same F n * . Compared with the presented model, the real contact area of the asperity in the Pan model is smaller, and the deformation is greater, resulting in the smaller stiffness result of the Pan model.
Because of the above two factors, when F n * is small, the asperities in the elastic stage account for the majority, and the K n * value of the two models is approximate. When F n * is large, the asperities on the interface are in the elastic–plastic deformation stage and plastic deformation stage, which account for a large proportion. The K n * result of the presented model is larger than the result of the Pan model. In addition, with the increase of F n * , the proportion of the asperities on the interface in the elastic–plastic deformation stage and the plastic deformation stage increases, so the gap between the K n * values of the two models increases with the increase of F n * .

5.2. Comparison of Results under Different Fractal Parameters

The experimental results are compared with the simulation results of the two models in Section 5.1. The simulation results of the presented model and the Pan model under different fractal parameters will be compared in this section to discuss the influence of fractal parameters on the normal contact stiffness.

5.2.1. Fractal Dimension D

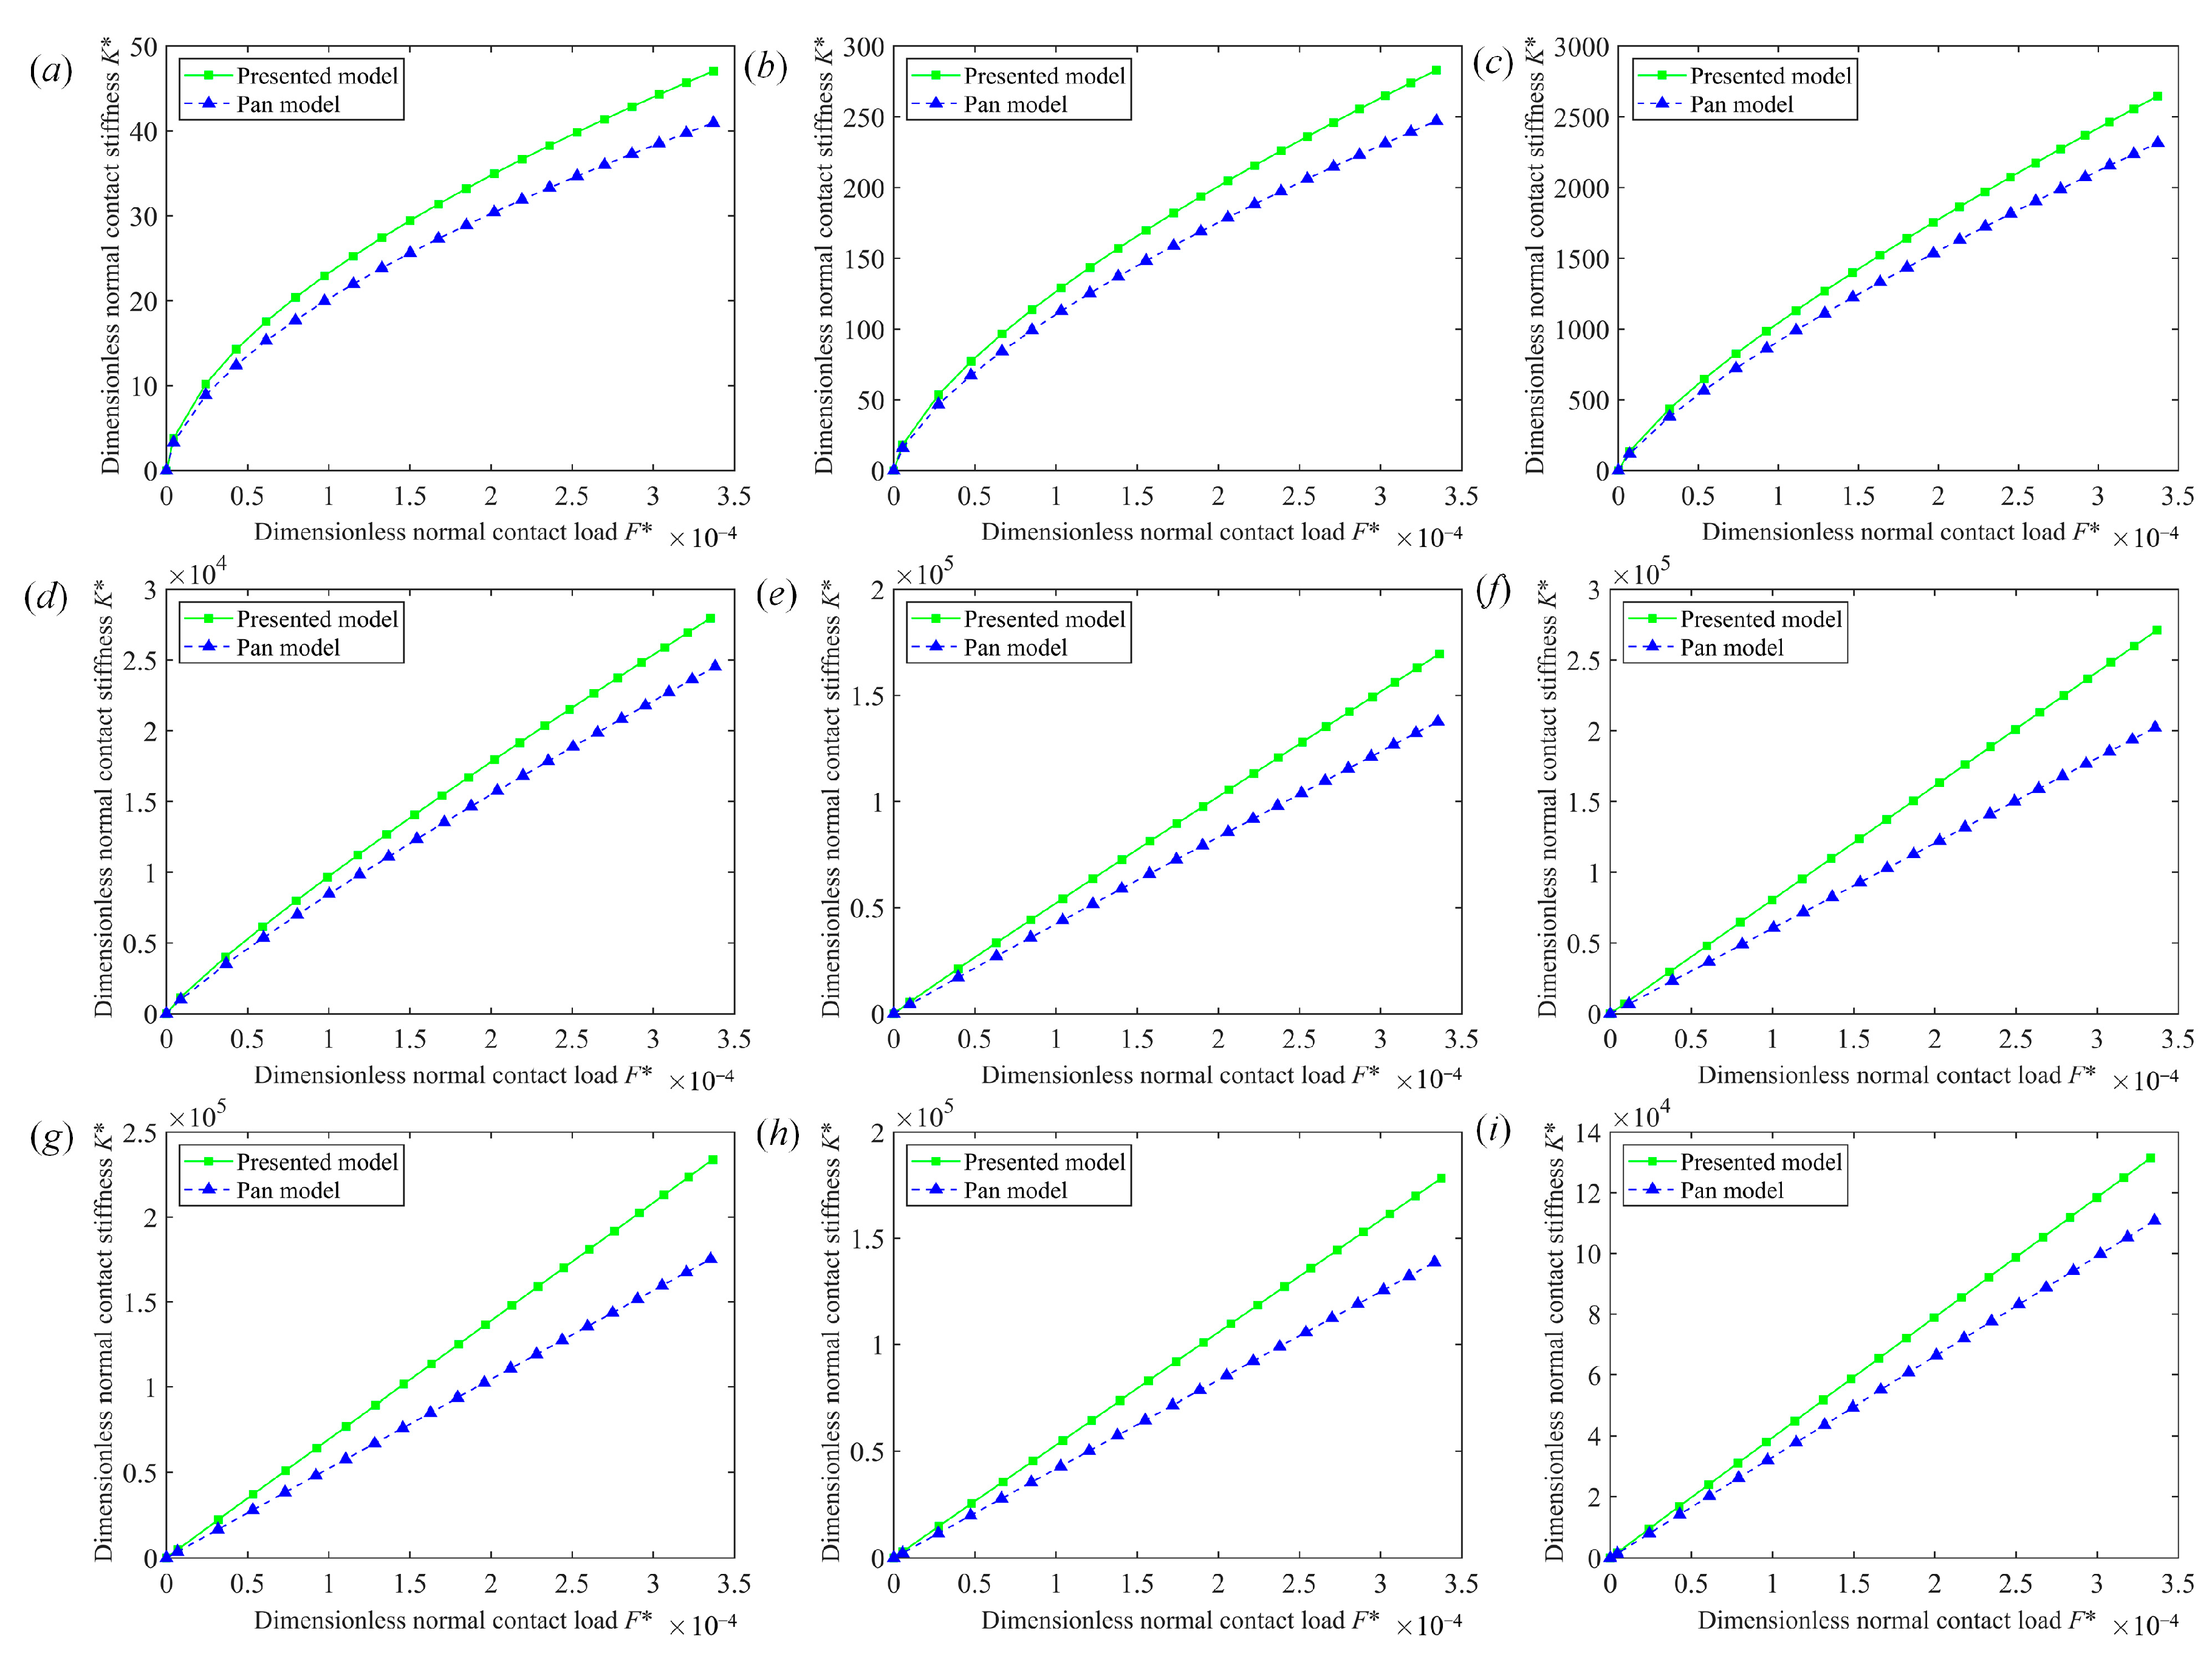
The influence of fractal dimension D on the normal contact stiffness is discussed in this section. The interface parameters are set as follows: G* = 1 × 10⁻⁸, μ = 0.1, v1 = v2 = 0.3, D = 2.1~2.9. The comparison charts between the simulation results of the two models under different D are obtained by substituting different parameters, as shown in Figure 5.
The comparison results can be obtained from Figure 5. In general, the relationship curves between F n * and K n * of the presented model and Pan model have the same variation character under different D and K n * increases with the increase of F n * . Under the same F n * , the K n * values of the presented model under different D are greater than those of the Pan model, and the gap between the K n * values of the two models increases with the increase of F n * . By comparing the differences between the two models, it is found that this phenomenon is caused by the different shapes of asperity used in the models. The relevant factors have been given in the previous section.
In addition, it can be seen from Figure 5 that when D = 2.1~2.4, the relationship curves between K n * and F n * show obvious nonlinearity. When D = 2.5~2.9, the relationship curves tend to linearity. This change shows that with the increase of D, the relationship curve between K n * and F n * tends to be linear. This phenomenon is due to the fact that the increase of D results in the smaller amplitude of asperities of the interface. During the contact process, the proportion of the asperities in the elastic–plastic deformation stage and the plastic deformation stage decrease, resulting in the gradual linear trend of the relationship curve between K n * and F n * .
By comparing the nine results, we can also find the following phenomenon. Under the same F n * , when D = 2.1~2.6, the K n * value increases monotonously with the increase of D. When D = 2.6~2.9, the value of K n * decreases monotonously with the increase of D. By analyzing the influence of D on the model, this phenomenon may be due to the fact that the D value influences both the density and amplitude of the asperity of the interface. On the one hand, the larger the D, the denser the asperities of the interface, and the smaller the real contact area of a single asperity. Under the same F n * , the deformation of a single asperity becomes larger, resulting in the reduction of the K n * value of the model. On the other hand, the larger the D, the smaller the amplitude of asperities of the interface. Under the same F n * , the deformation of a single asperity decreases, resulting in the increase of the K n * value of the model. Finally, under the combined action of the two effects of D, when under the same F n * , the K n * value increases first and then decreases with the increase of D.

5.2.2. Scale Coefficient G

The influence of scale coefficient G on normal contact stiffness is discussed in this section. The parameters are set as follows: D = 2.4, μ = 0.1, v1 = v2 = 0.3. G* = 10−2~10−10. The comparison charts between the simulation results of the presented model and the Pan model under different G are obtained by substituting different parameters, as shown in Figure 6.
The relationship curves between F n * and K n * of the presented model and Pan model are shown in Figure 6 when G* takes different values.
In general, when G* takes different values, the relationships between F n * and K n * of the two models are similar, and K n * values increase with increasing F n * . Under the same F n * , K n * values decrease monotonically with the increase of G*. This phenomenon is caused by the influence of the G on the amplitude of the asperity of the interface. The greater the G, the greater the amplitude of the asperity of the interface. Under the same F n * , the deformation of the asperity is larger, resulting in the reduction of K n * of the models.

6. Conclusions

In this paper, a novel 3D fractal model of normal contact stiffness of mechanical interface based on the axisymmetric cosinusoidal asperity is proposed. The main conclusions can be summarized as follows:
(1)
The analytical hypothetical 3D surface based on the axisymmetric cosinusoidal asperity is established. In the hypothetical surface, the shape of asperity is represented by an axisymmetric cosinusoidal body, and the distribution of the asperity follows the truncated asperity size distribution function.
(2)
Contact mechanics are used to analyze the contact deformation process of asperity. Then, combining the contact deformation analysis results of asperity and the truncated asperity size distribution function, the analytical expressions of the normal contact stiffness and normal contact load of the whole interface are obtained. The theoretical analytical model of normal contact stiffness of mechanical interface is finally obtained.
(3)
The numerical simulation results of the presented model are compared with the experimental results and the Pan model. The comparison results show that the maximum relative error between the presented model and the experimental results is 4.35%, while the maximum relative error between the Pan model and the experimental results is 29.58%. The comparison results verify the accuracy of the presented model.
(4)
The influence of different fractal parameters on normal contact stiffness is discussed. The simulation results show that under the same normal contact load, the normal contact stiffness increases first and then decreases with the increase of D. The normal contact stiffness decreases monotonically with the increase of G. In this paper, the rationality of the simulation results is reasonably explained in combination with the shape of the asperity.
However, the mechanical interface usually contains a lubricating medium in actual working conditions. The situation is not considered in the presented model and relevant work will be carried out in future research.

Author Contributions

Conceptualization and methodology, W.W. and Q.A.; validation, Q.A., S.S., Y.Y. and Y.B.; writing—original draft preparation and visualization, W.W. and Q.A.; writing—review and editing, W.W., Q.A. and G.M. All authors have read and agreed to the published version of the manuscript.

Funding

This work is financially supported by the National Natural Science Foundation of China (No. 52174154) and the National Natural Science Foundation of China (No. 11802035).

Data Availability Statement

Data available upon request from the authors.

Conflicts of Interest

The authors declare no conflict of interest.

References

  1. Chen, Y.; Li, P.; Sun, J.; Shang, M.; Shao, L. Fractal Model of Contact Thermal Stiffness. Machines 2022, 10, 464. [Google Scholar] [CrossRef]
  2. Yin, D.; Zhang, X.; Wen, S.; Lan, G.; Chen, Y. A Normal Contact Stiffness Statistical Model of Joint Interface considering Hardness Changes. Adv. Mater. Sci. Eng. 2022, 2022, 2160508. [Google Scholar] [CrossRef]
  3. Sun, X.; Meng, C.; Duan, T. Fractal model of thermal contact conductance of two spherical joint surfaces considering friction coefficient. Ind. Lubr. Tribol. 2022, 74, 93–101. [Google Scholar] [CrossRef]
  4. Ma, X.; Tong, K. Study on Contact Mechanics Modeling of Joint Surface Containing Composite Materials. Compos. Mech. Comput. Appl. Int. J. 2022, 13, 9–21. [Google Scholar] [CrossRef]
  5. Yin, Q.; Dong, G.; Yin, G.; Heng, L.; Wang, L. Research on modeling and identification of machine tool joint dynamic characteristics. J. Adv. Mech. Des. Syst. Manuf. 2019, 13, JAMDSM0046. [Google Scholar] [CrossRef] [Green Version]
  6. Yang, Y.; Zou, P.; Dai, X.; Yang, B.; Gao, F. Parametric sensitivity research of interference-fit bolted single-lap laminates joint based on an improved analytical stiffness model. J. Compos. Mater. 2021, 55, 4513–4526. [Google Scholar] [CrossRef]
  7. Liu, W.; Shen, J.; Cheng, S.; Wang, S. A Multi-Scale Stiffness Fractal Model of Joint Interfaces. Russ. Phys. J. 2021, 64, 1261–1280. [Google Scholar] [CrossRef]
  8. Zhao, G.; Li, Y.; Zhang, Z.; Xiong, Z.; Shengxiang, L.; Wang, M. Simulation and experiment of secondary contact stiffness of rough surface. J. Mech. Sci. Technol. 2022, 36, 1079–1087. [Google Scholar] [CrossRef]
  9. Li, D.; Botto, D.; Li, R.; Xu, C.; Zhang, W. Experimental and Theoretical Studies on Friction Contact of Bolted Joint Interfaces. Int. J. Mech. Sci. 2022, 236, 107773. [Google Scholar] [CrossRef]
  10. Mandelbrot, B.B. Fractals, form, chance and dimension. Math. Intell. 1977, 1, 35–37. [Google Scholar] [CrossRef]
  11. Sayles, R.S.; Thomas, T.R. Surface topography as a nonstationary random process. Nature 1978, 271, 431–434. [Google Scholar] [CrossRef]
  12. Zhang, X.; Jackson, R. An Analysis of the Multi-scale Structure of Surfaces with Various Finishes. Tribol. Trans. 2016, 60, 121–134. [Google Scholar] [CrossRef]
  13. Majumdar, A.; Bhushan, B. Role of Fractal Geometry in Roughness Characterization and Contact Mechanics of Surfaces. J. Tribol. 1990, 112, 205–216. [Google Scholar] [CrossRef]
  14. Majumdar, A.; Bhushan, B. Fractal Model of Elastic-Plastic Contact between Rough Surfaces. J. Tribol. 1991, 113, 1–11. [Google Scholar] [CrossRef]
  15. Jiang, S.; Zheng, Y.; Zhu, H. A Contact Stiffness Model of Machined Plane Joint Based on Fractal Theory. J. Tribol. 2010, 132, 011401. [Google Scholar] [CrossRef]
  16. Tian, H.; Zhong, X.; Zhao, C.; Zhao, X.; Fang, Z.; Liu, F.; Zhu, D.; Lin, W.; Yan, H. One Loading Model of Joint Interface Considering Elastoplastic and Variation of Hardness with Surface Depth. Jixie Gongcheng Xuebao/J. Mech. Eng. 2015, 51, 90–104. [Google Scholar] [CrossRef] [Green Version]
  17. Zhang, Y.; Lu, H.; Zhang, X.; Ling, H.; Fan, W.; Bao, L.; Guo, Z. A normal contact stiffness model of machined joint surfaces considering elastic, elasto-plastic and plastic factors. Proc. Inst. Mech. Eng. Part J J. Eng. Tribol. 2019, 234, 135065011986780. [Google Scholar] [CrossRef]
  18. Wang, N.; Liu, H.; Liu, Y. Normal fractal contact stiffness model among three disks of rod-fastening rotor system with considering friction and the asperities interaction. Ind. Lubr. Tribol. 2021, 73, 652–659. [Google Scholar] [CrossRef]
  19. Ausloos, M.; Berman, D. A Multivariate Weierstrass-Mandelbrot Function. Proc. R. Soc. A Math. Phys. Eng. Sci. 1985, 400, 331–350. [Google Scholar] [CrossRef]
  20. Yan, W.; Komvopoulos, K. Contact analysis of elastic-plastic fractal surfaces. J. Appl. Phys. 1998, 84, 3617–3624. [Google Scholar] [CrossRef]
  21. Komvopoulos, K.; Ye, N. Three-Dimensional Contact Analysis of Elastic-Plastic Layered Media with Fractal Surface Topographies. J. Tribol. 2001, 123, 632–640. [Google Scholar] [CrossRef]
  22. Pan, W.; Li, X.; Wang, L.; Guo, N.; Mu, J. A normal contact stiffness fractal prediction model of dry-friction rough surface and experimental verification. Eur. J. Mech.-A/Solids 2017, 66, 94–102. [Google Scholar] [CrossRef]
  23. Jiang, K.; Liu, Z.; Yang, C.; Zhang, C.; Tian, Y.; Zhang, T. Effects of the joint surface considering asperity interaction on the bolted joint performance in the bolt tightening process. Tribol. Int. 2022, 167, 107408. [Google Scholar] [CrossRef]
  24. Ghaednia, H.; Wang, X.; Saha, S.; Xu, Y.; Sharma, A.; Jackson, R. A Review of Elastic-Plastic Contact Mechanics. Appl. Mech. Rev. 2018, 69, 060804. [Google Scholar] [CrossRef] [Green Version]
  25. Chu, N.; Jackson, R.; Wang, X.; Gangopadhyay, A.; Ghaednia, H. Evaluating Elastic-Plastic Wavy and Spherical Asperity-Based Statistical and Multi-Scale Rough Surface Contact Models with Deterministic Results. Materials 2021, 14, 3864. [Google Scholar] [CrossRef]
  26. Mishra, T.; Rooij, M.; Schipper, D. The effect of asperity geometry on the wear behaviour in sliding of an elliptical asperity. Wear 2021, 470–471, 203615. [Google Scholar] [CrossRef]
  27. An, Q.; Suo, S.; Lin, F.; Shi, J. A Novel Micro-Contact Stiffness Model for the Grinding Surfaces of Steel Materials Based on Cosine Curve-Shaped Asperities. Materials 2019, 12, 3561. [Google Scholar] [CrossRef] [Green Version]
  28. Krithivasan, V.; Jackson, R. An Analysis of Three-Dimensional Elasto-Plastic Sinusoidal Contact. Tribol. Lett. 2007, 27, 31–43. [Google Scholar] [CrossRef] [Green Version]
  29. Johnson, K.; Greenwood, J. An approximate JKR theory for elliptical contacts. J. Phys. D Appl. Phys. 2005, 38, 1042. [Google Scholar] [CrossRef]
  30. Saha, S.; Xu, Y.; Jackson, R. Perfectly Elastic Axisymmetric Sinusoidal Surface Asperity Contact. J. Tribol. 2015, 138, 031401. [Google Scholar] [CrossRef]
  31. Komvopoulos, K.; Yan, W. A Fractal Analysis of Stiction in Microelectromechanical Systems. J. Tribol. 1997, 119, 391–400. [Google Scholar] [CrossRef]
  32. Li, X.; Liang, Y.M.; Guo, H.; Ju, X.; Wen, B.C. Study on equivalent model of generalized clearance of joint surface. Zhendong Gongcheng Xuebao/J. Vib. Eng. 2014, 27, 25–32. [Google Scholar] [CrossRef]
  33. Abbott, E.J.a.F. Specifying Surface Quality—A Method on Accurate Measurement and Comparison. Mech. Eng. ASME 1933, 55, 569–572. [Google Scholar]
  34. Johnson, K.L. Contact Mechanics; Cambridge University Press: Cambridge, UK, 1985; pp. 171–189. [Google Scholar]
  35. Tabor, D.J.N. Hardness of Metals. Nature 1937, 140, 260. [Google Scholar] [CrossRef]
  36. Wu, M.; Wang, W.; Shi, D.; Song, Z.; Li, M.; Luo, Y. Improved box-counting methods to directly estimate the fractal dimension of a rough surface. Measurement 2021, 177, 109303. [Google Scholar] [CrossRef]
Figure 1. Schematic of the 2D curve of the axisymmetric cosinusoidal body.
Fractalfract 07 00279 g001
Figure 2. Two-dimensional schematic of the contact deformation between a single axisymmetric cosinusoidal asperity and rigid plane.
Fractalfract 07 00279 g002
Figure 3. Comparison results of 45# steel.
Fractalfract 07 00279 g003
Figure 4. Relative errors between experimental results and simulation results of the presented model and the Pan model.
Fractalfract 07 00279 g004
Figure 5. Comparison results between simulation results of the presented model and Pan model under different D: (a) D = 2.1; (b) D = 2.2; (c) D = 2.3; (d) D = 2.4; (e) D = 2.5; (f) D = 2.6; (g) D = 2.7; (h) D = 2.8; (i) D = 2.9.
Fractalfract 07 00279 g005
Figure 6. Comparison results between simulation results of the presented model and the Pan model under different G*: (a) G* = 10−2; (b) G* = 10−3; (c) G* = 10−4; (d) G* = 10−5; (e) G* = 10−6; (f) G* = 10−7; (g) G* = 10−8; (h) G* = 10−9; (i) G* = 10−10.
Fractalfract 07 00279 g006
Disclaimer/Publisher’s Note: The statements, opinions and data contained in all publications are solely those of the individual author(s) and contributor(s) and not of MDPI and/or the editor(s). MDPI and/or the editor(s) disclaim responsibility for any injury to people or property resulting from any ideas, methods, instructions or products referred to in the content.