

Gold and Sustainable Stocks in the US and EU: Nonlinear Analysis Based on Multifractal Detrended Cross-Correlation Analysis and Granger Causality


Abstract
:1. Introduction
2. Methodology and Data
2.1. MF-DCCA
- Step 1. Let and be two time series of the same length . The cumulative deviation series, and , are calculated for both time series using (1), where and represent the averages of the time series, and :
- Step 2. The and are divided into non-overlapping segments, where is the time scale. This process is also performed from the end to the start of the series to ensure all information is used. As a result, two sets of non-overlapping segments are obtained.
- Step 3. Compute local trends with a th-order polynomial fit via the least squares method for each sub-segmentwhere ;
- Step 4. For each of the segments, we determine the local variancefor segments andfor segments .
- Step 5. Then, we compute the order wave function
2.2. Nonlinear Granger Causality
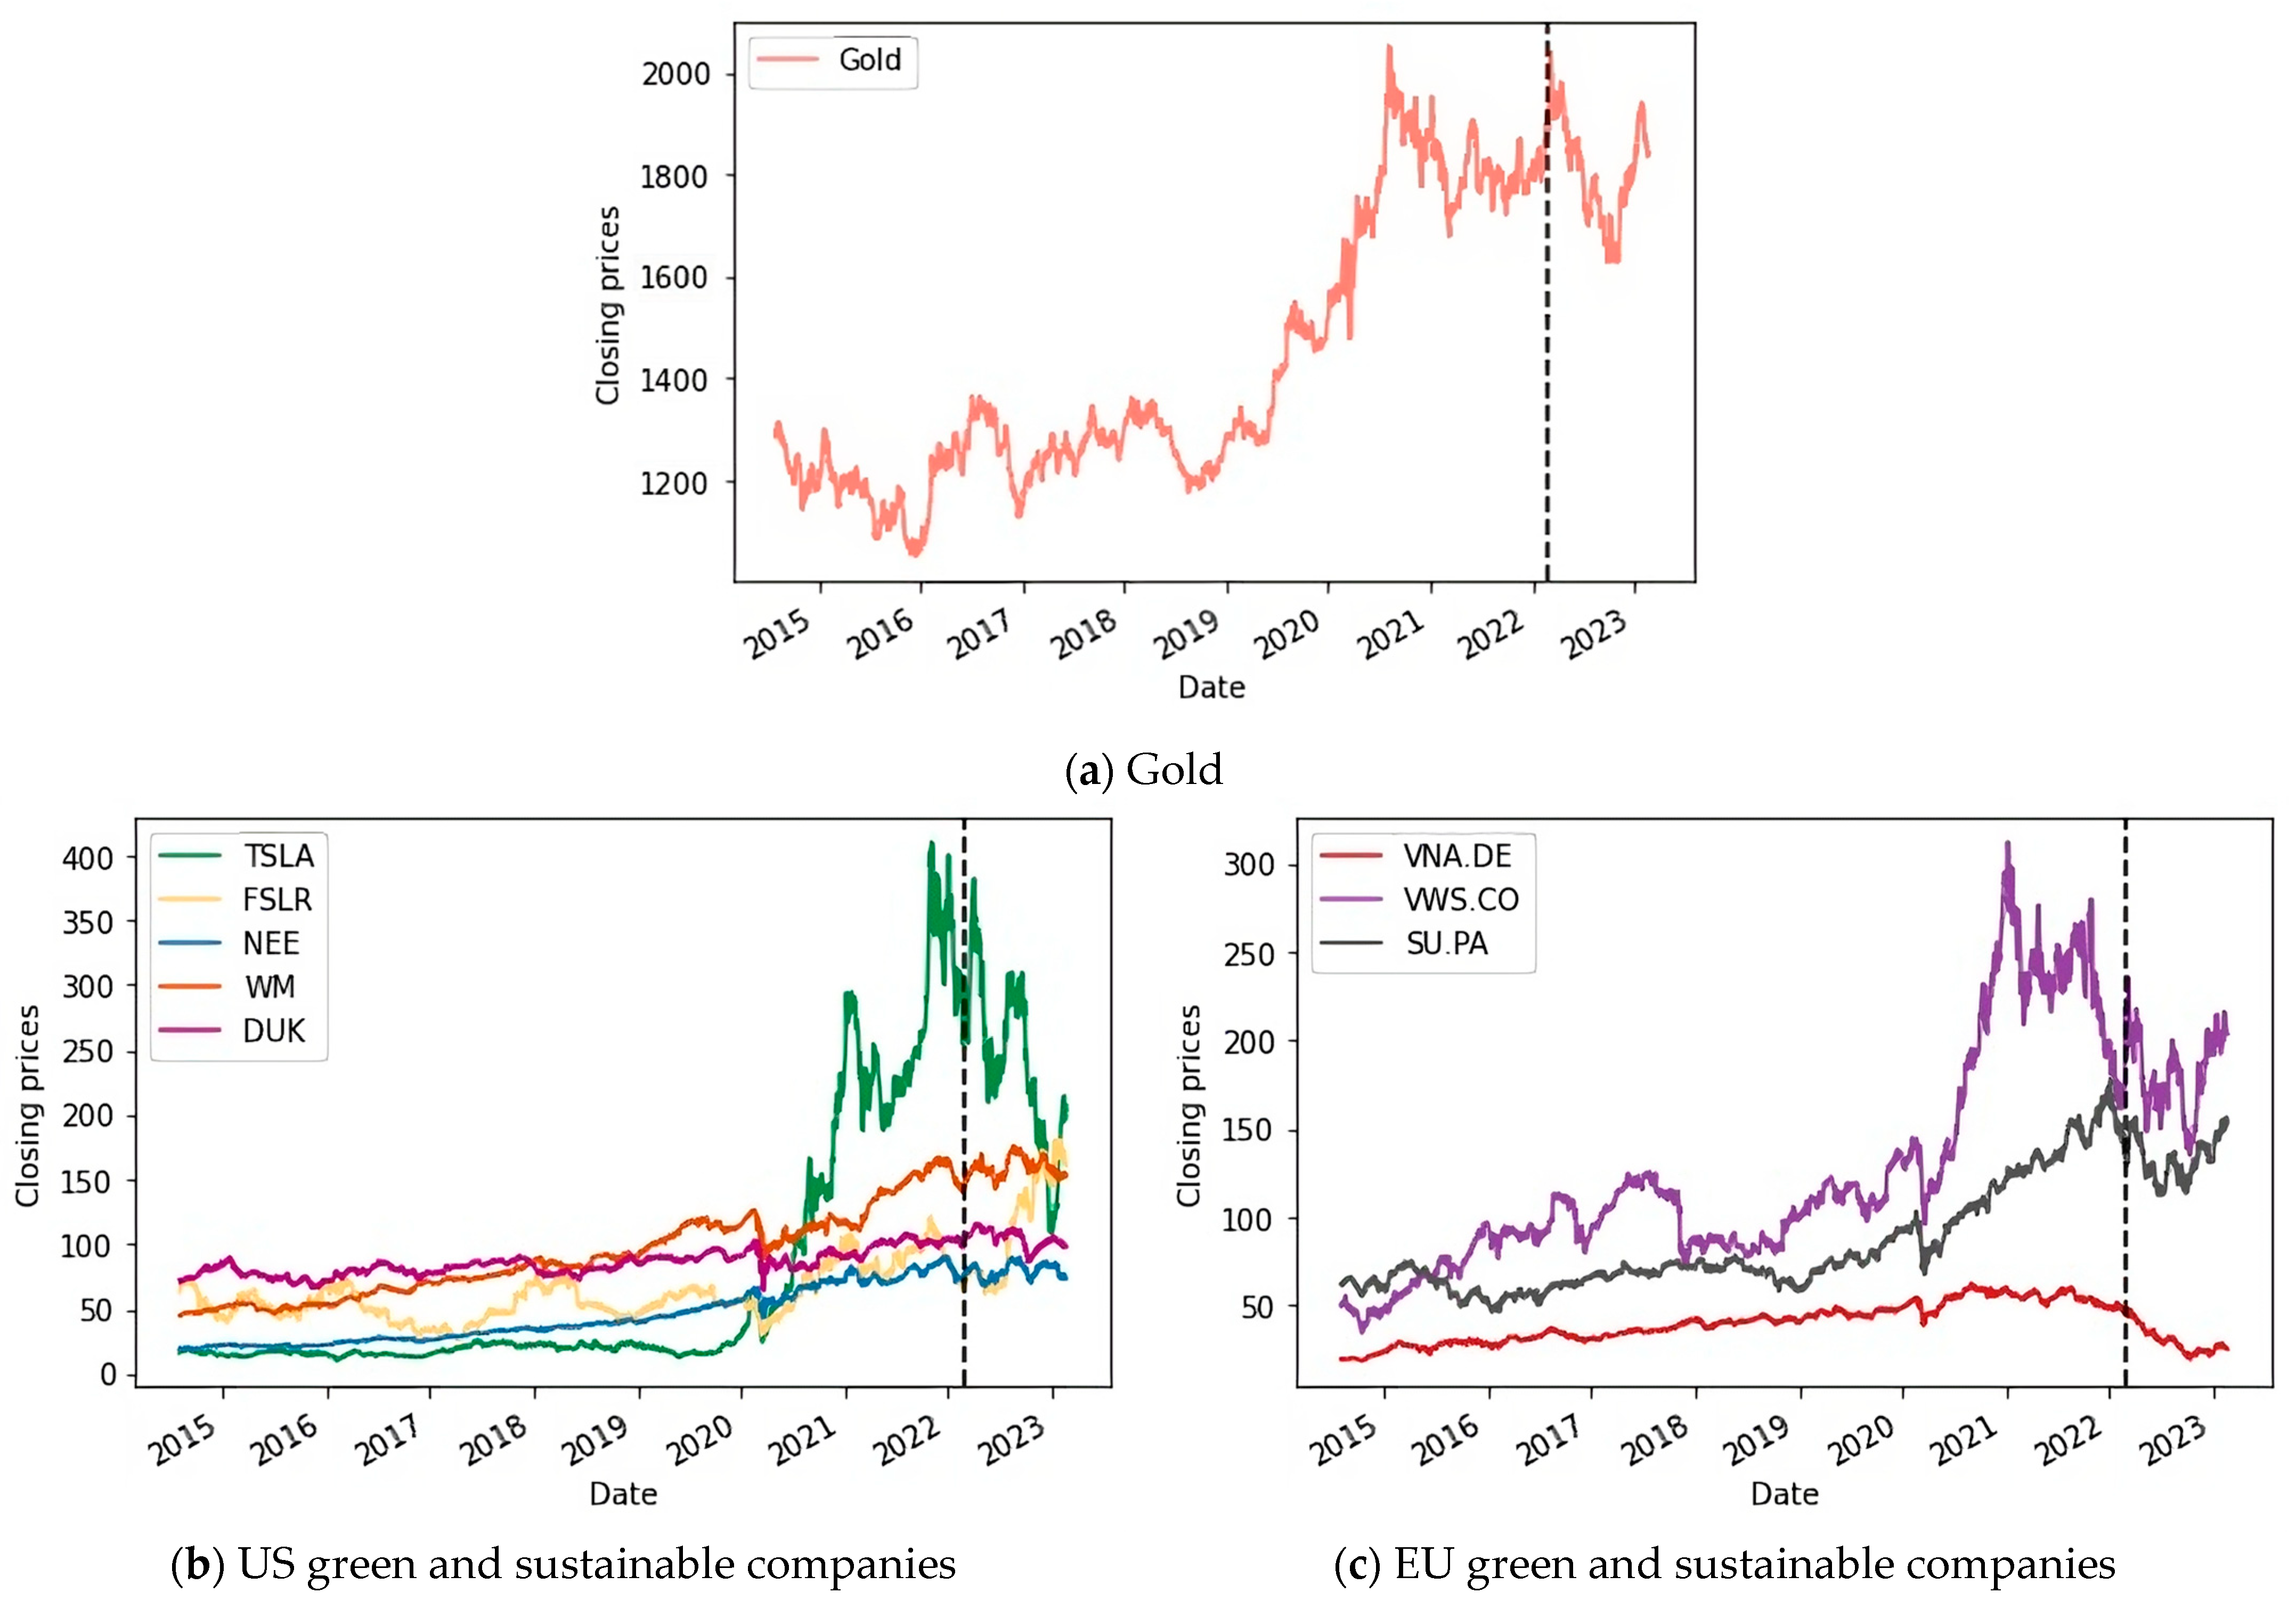
2.3. Data
3. Results
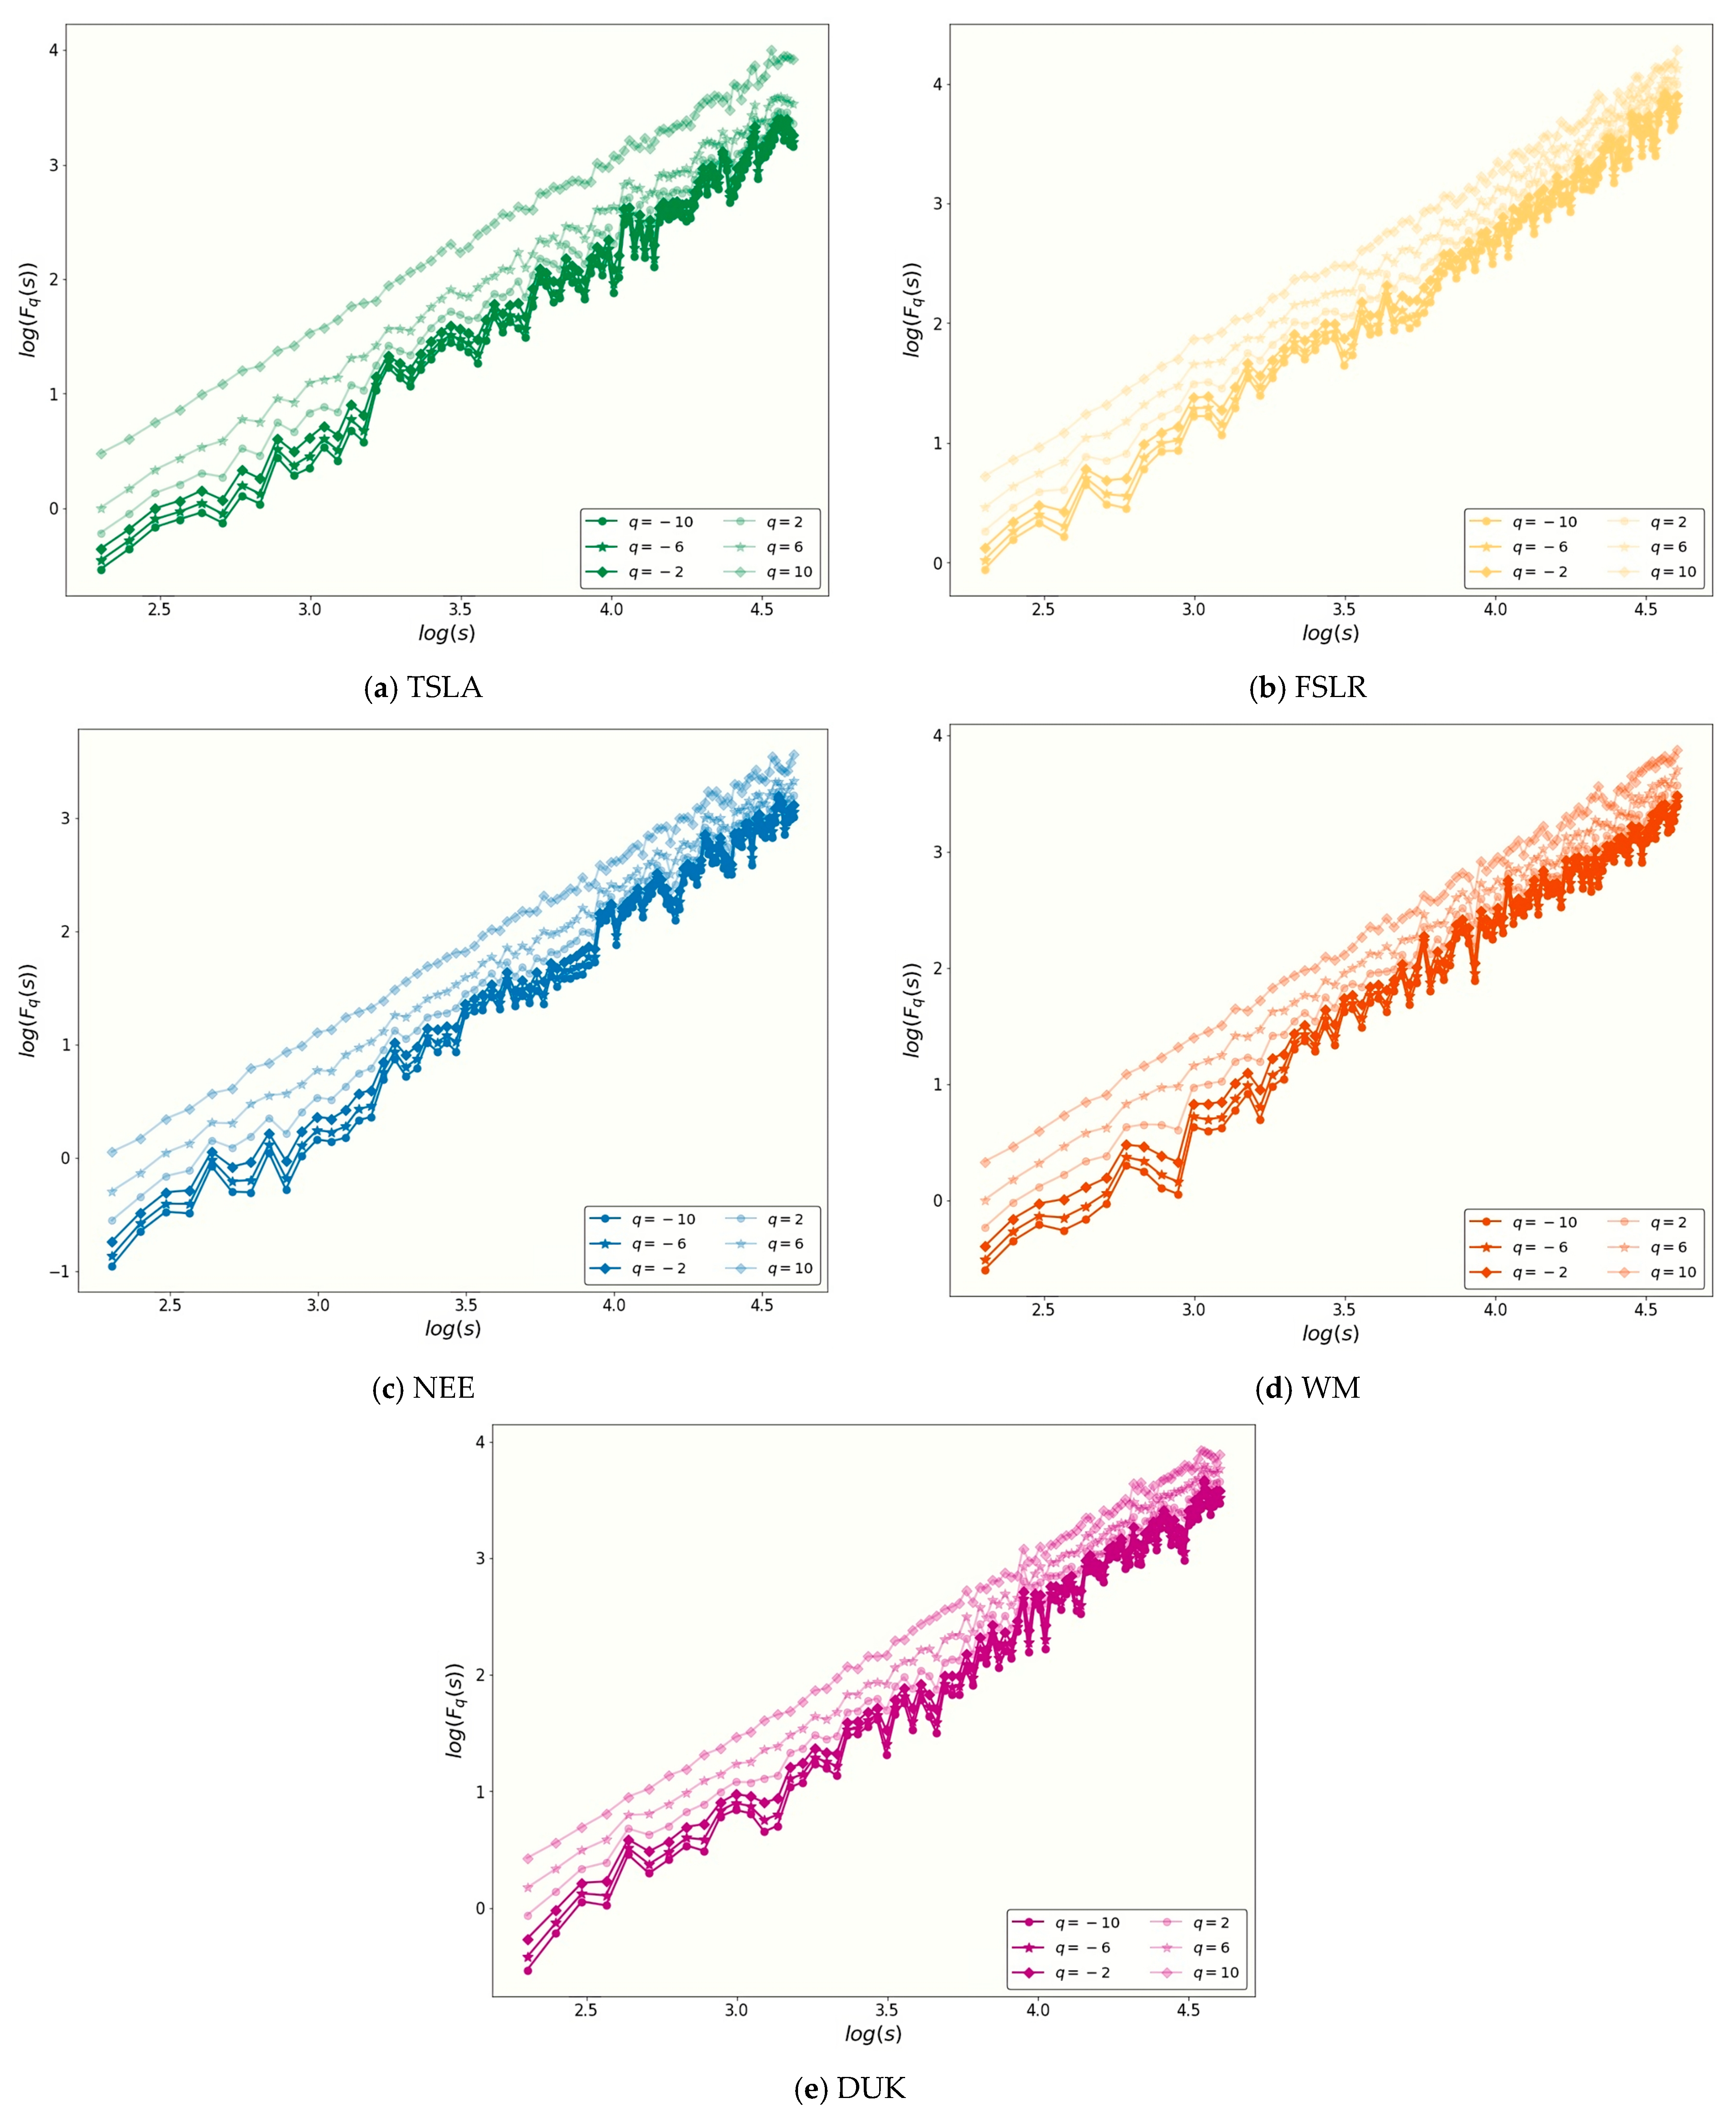
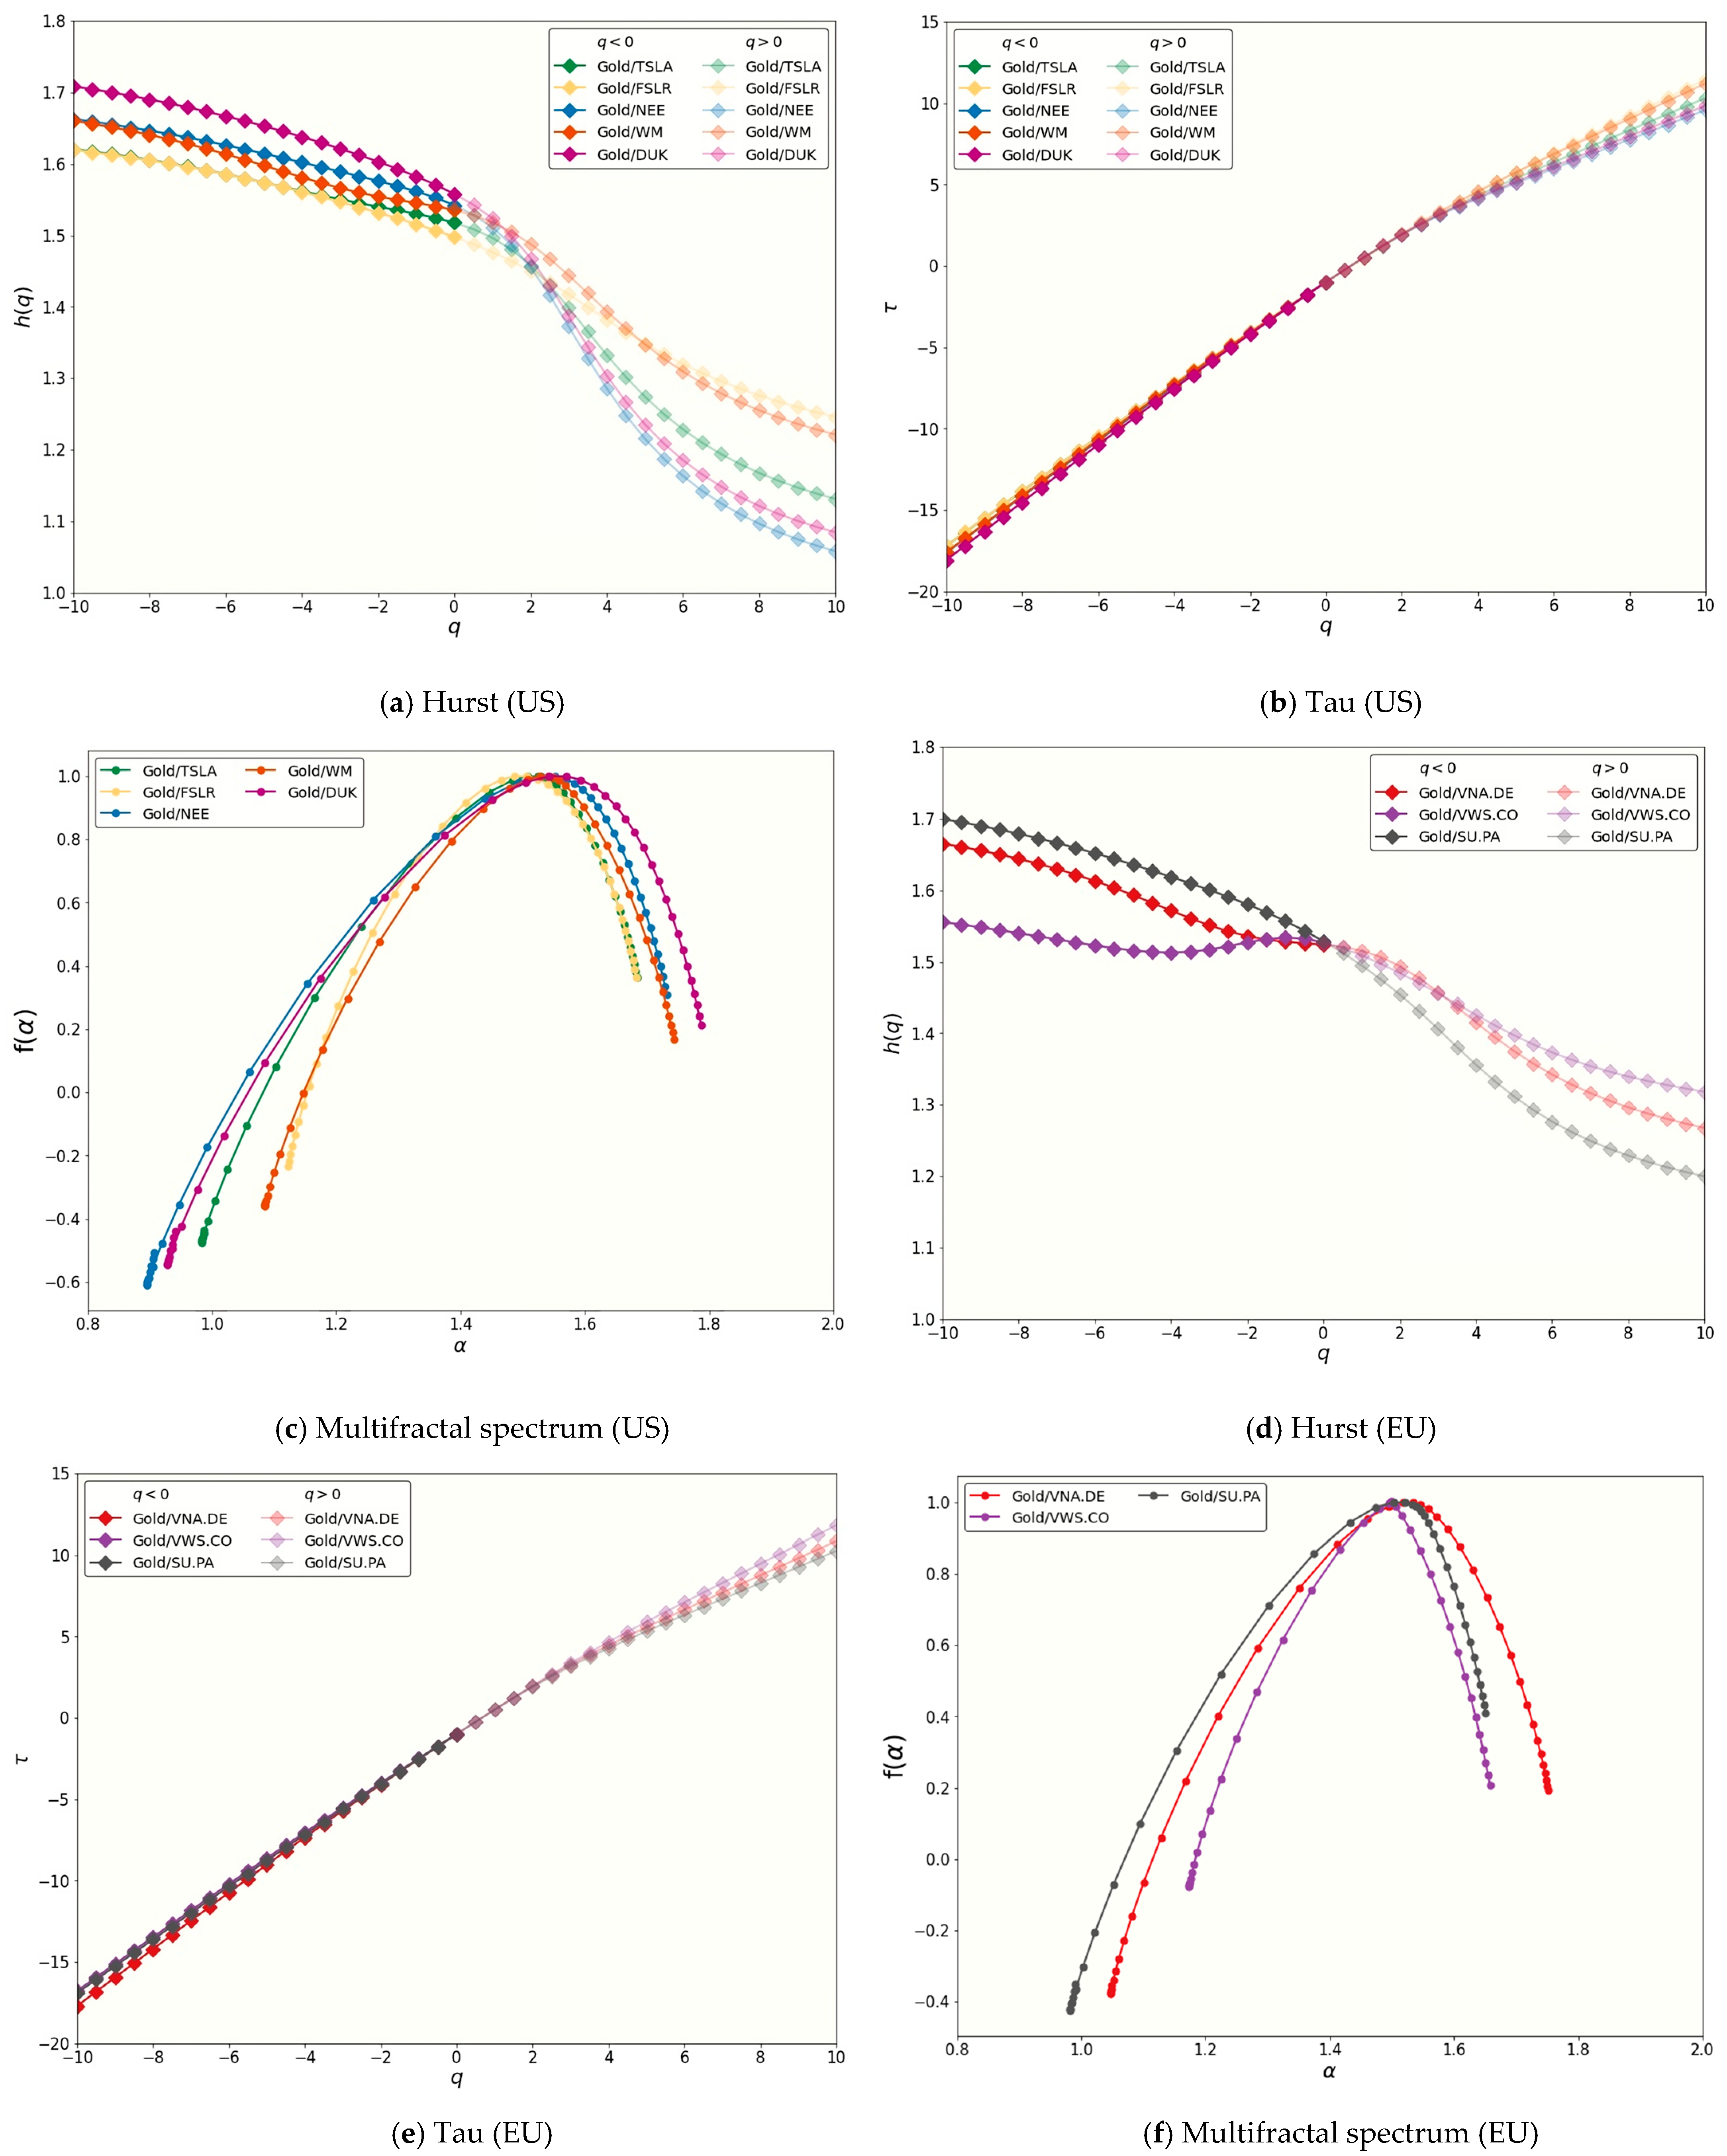
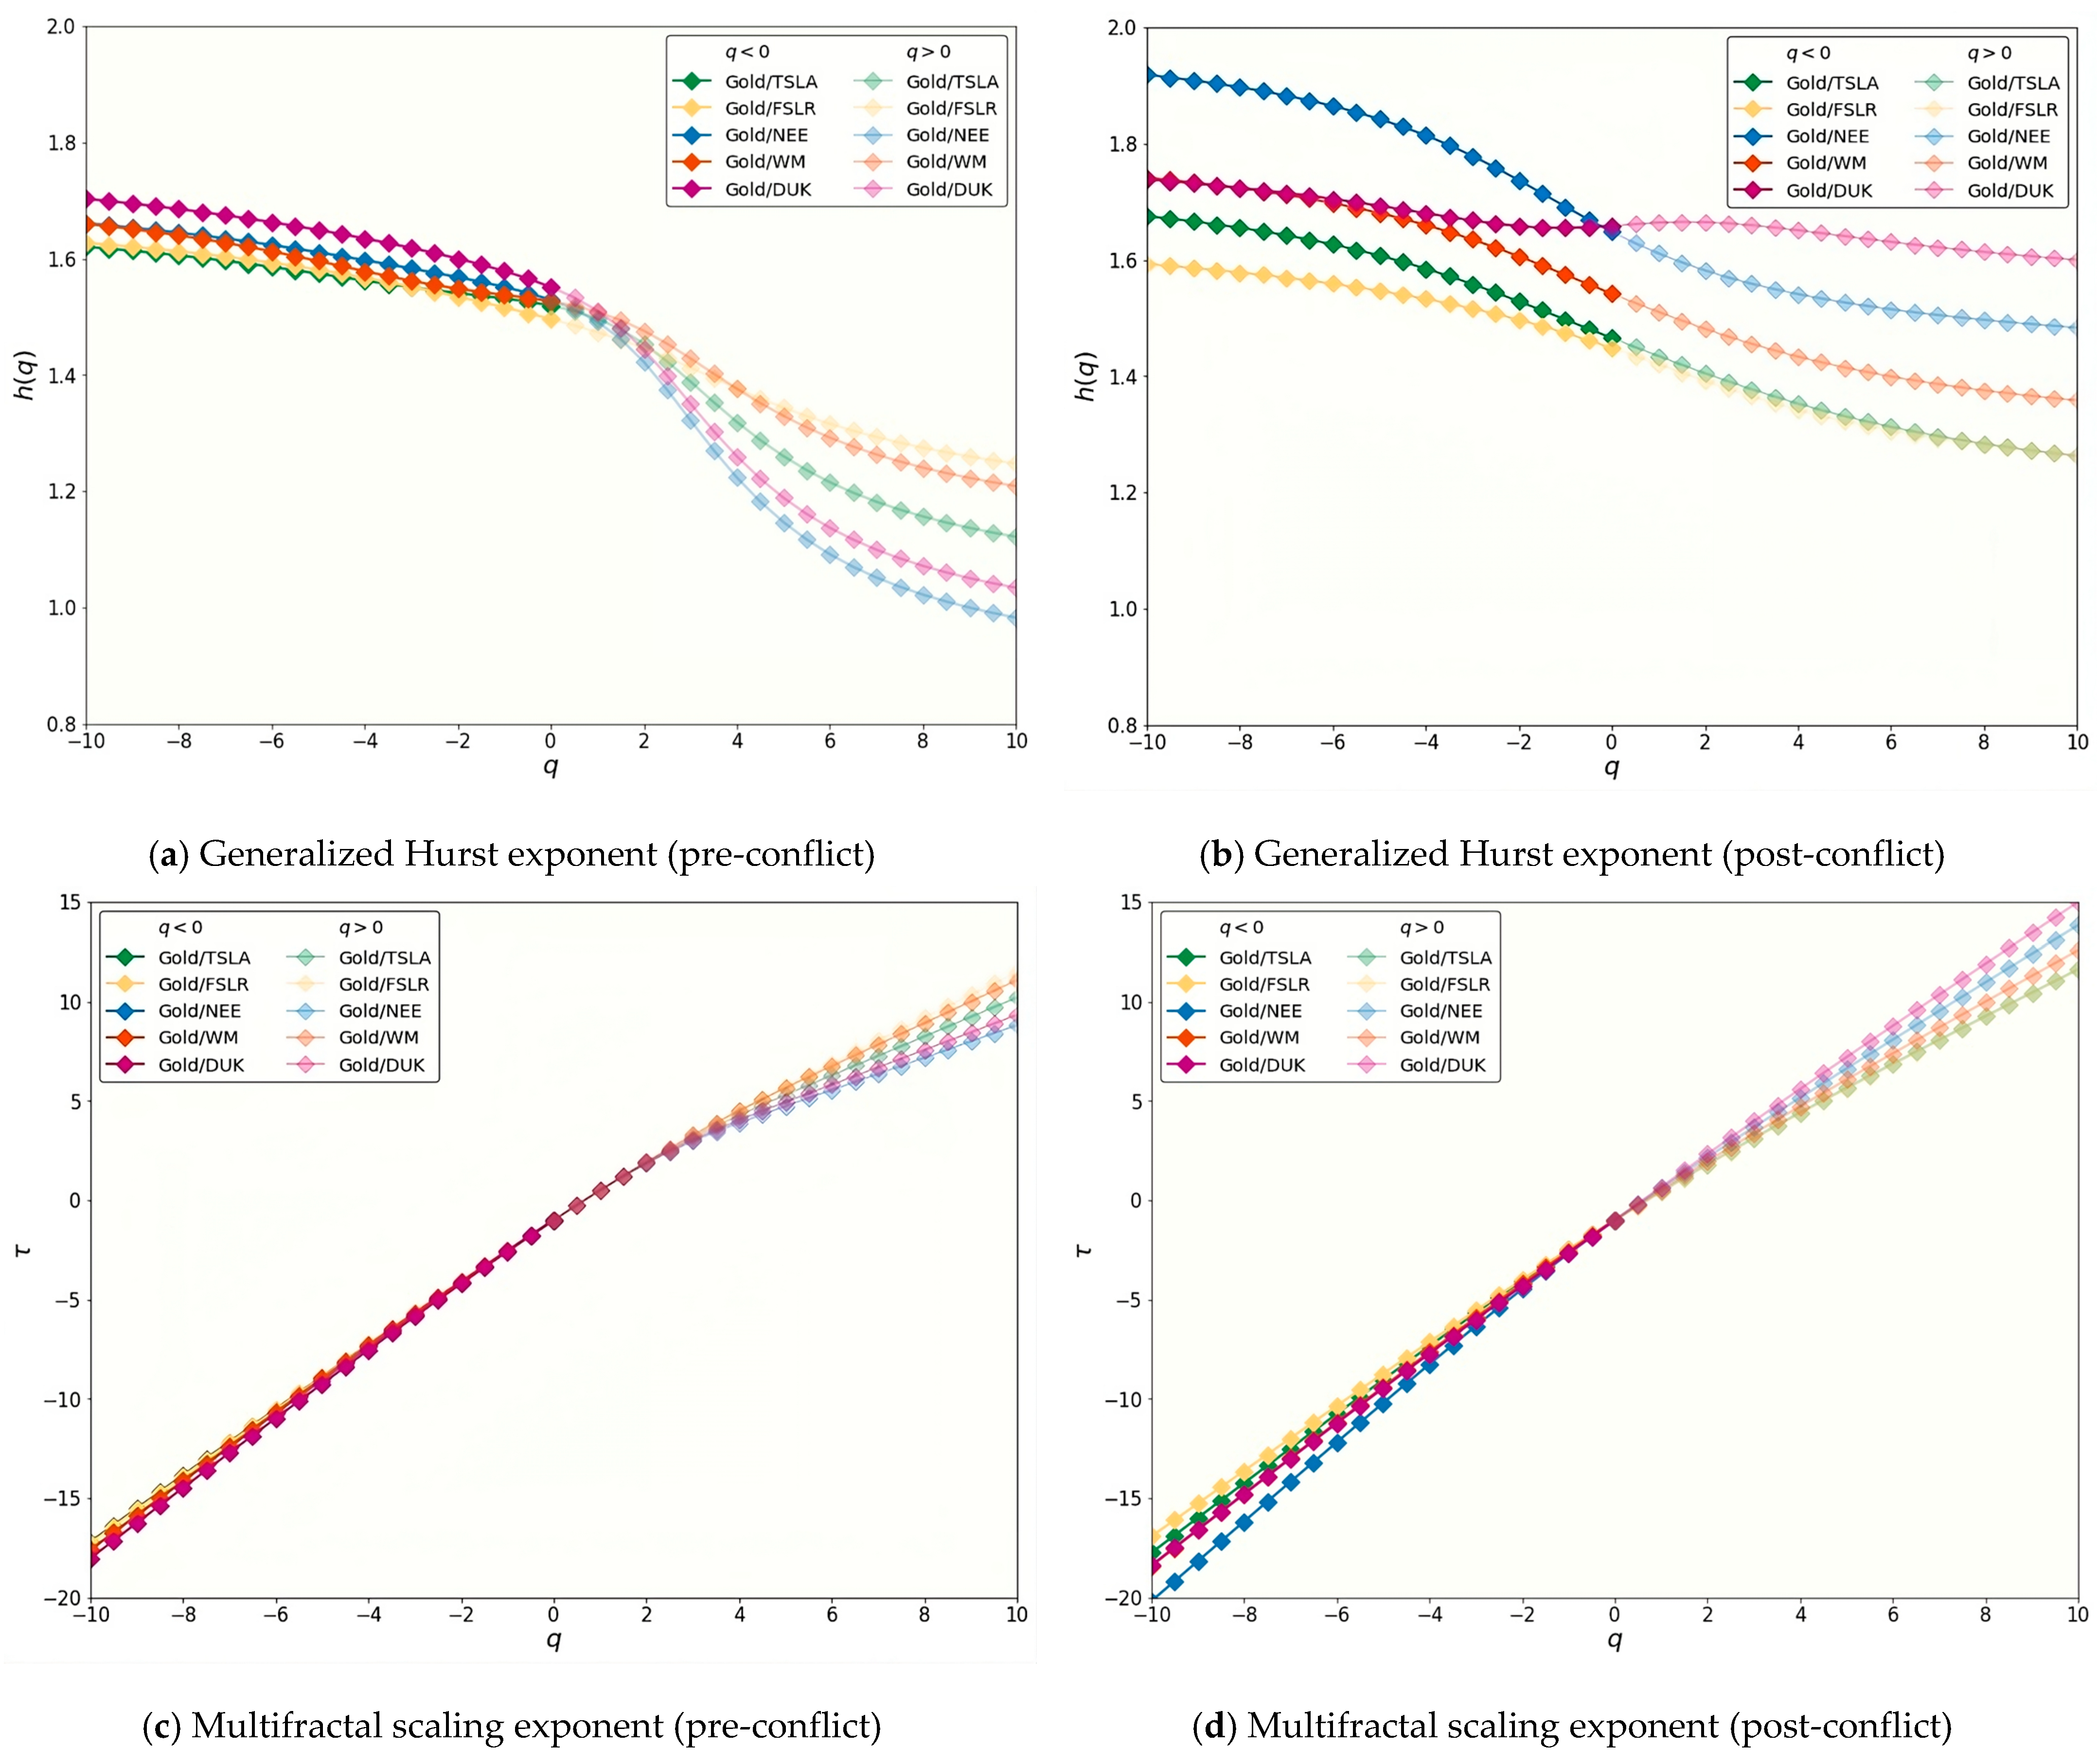
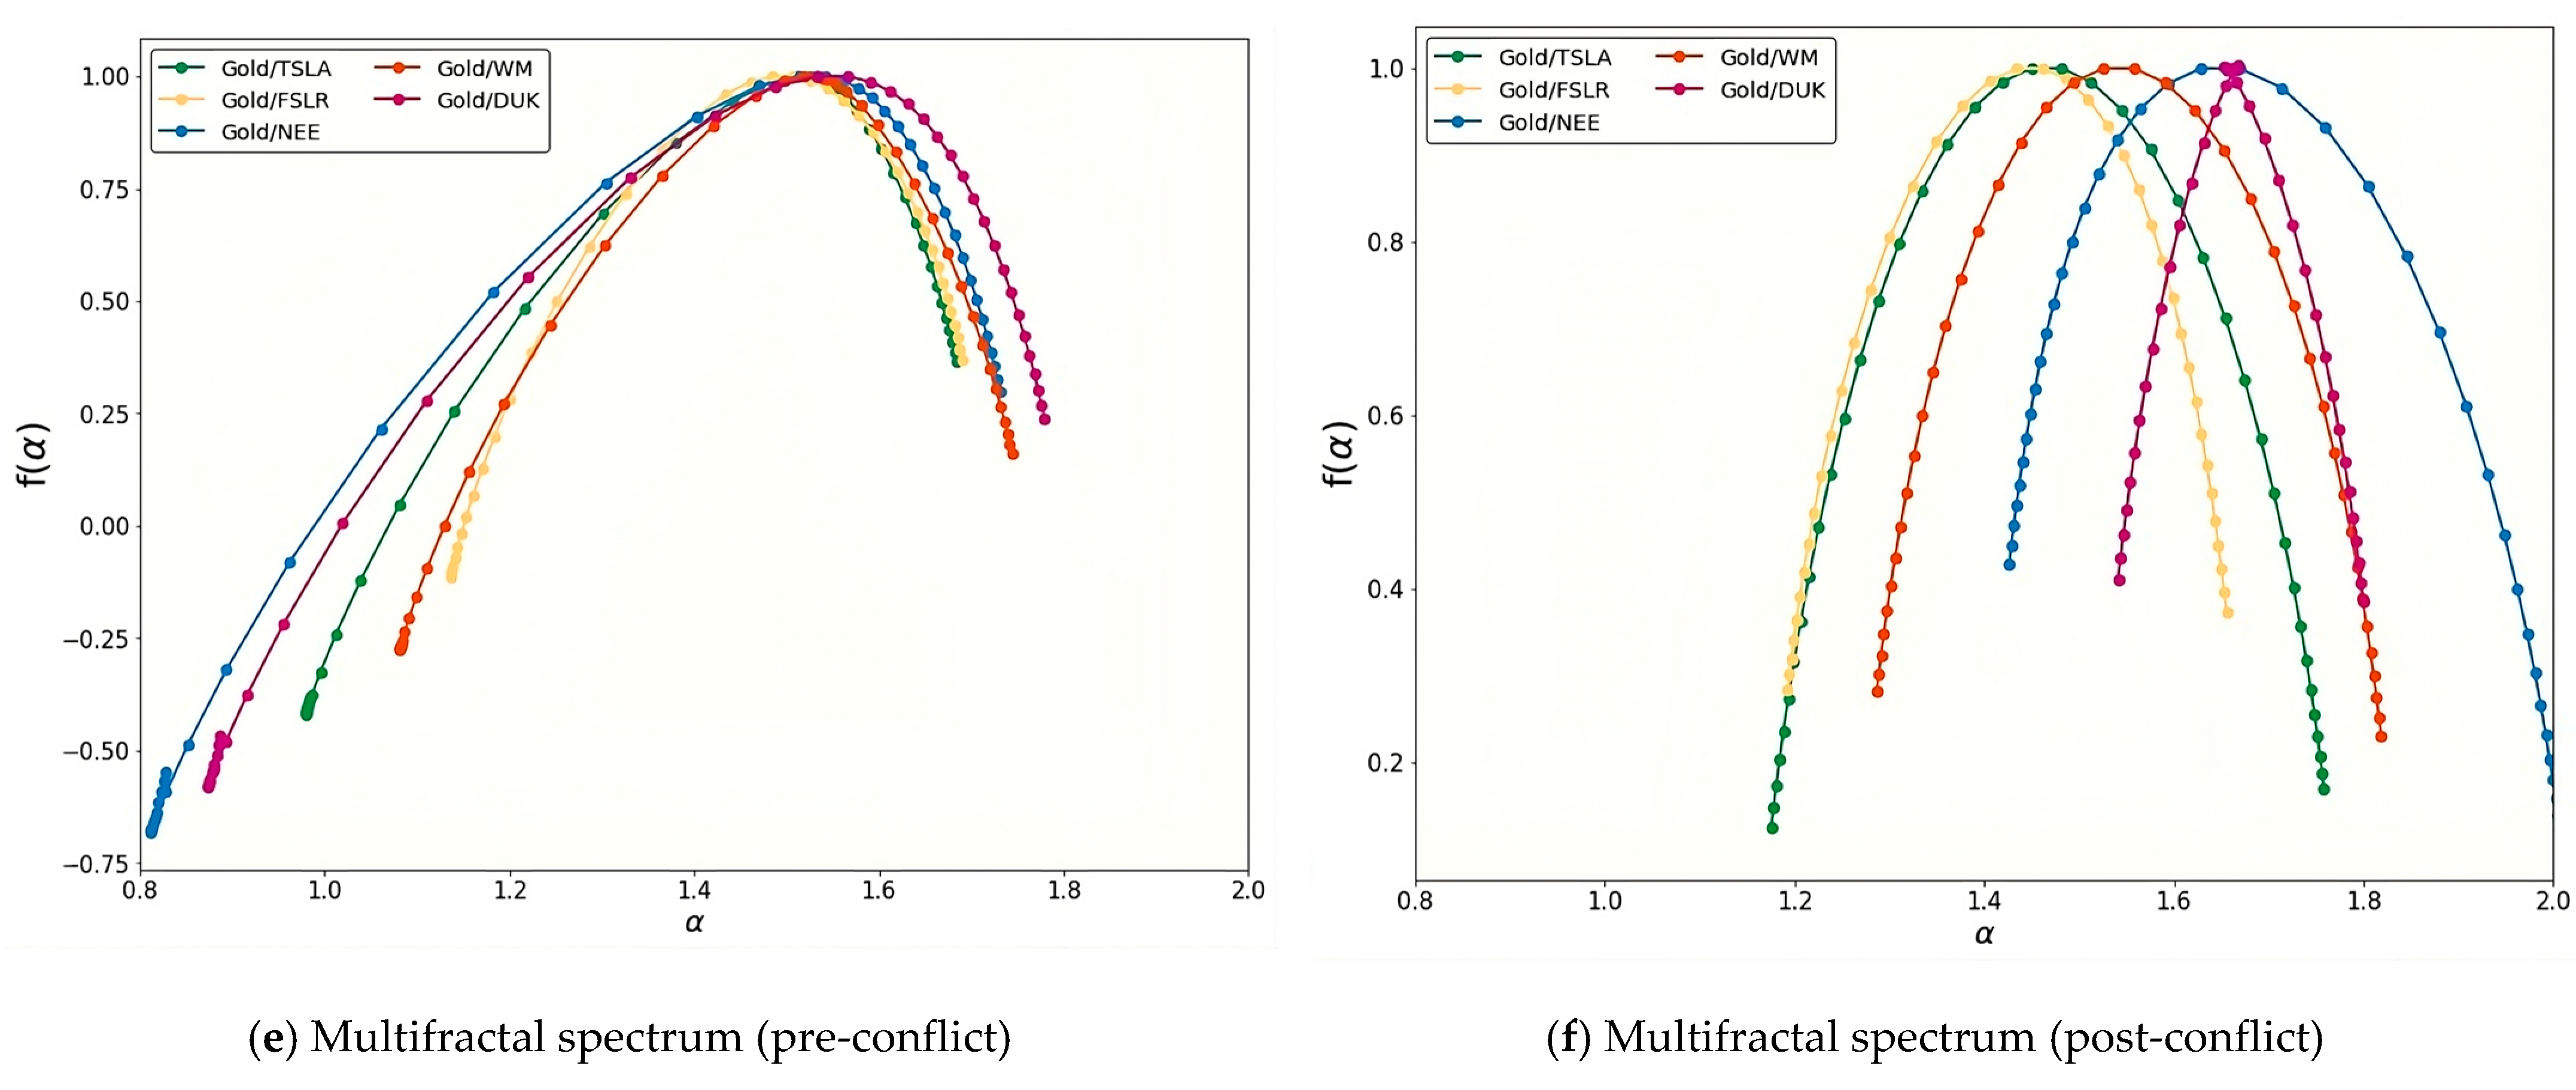
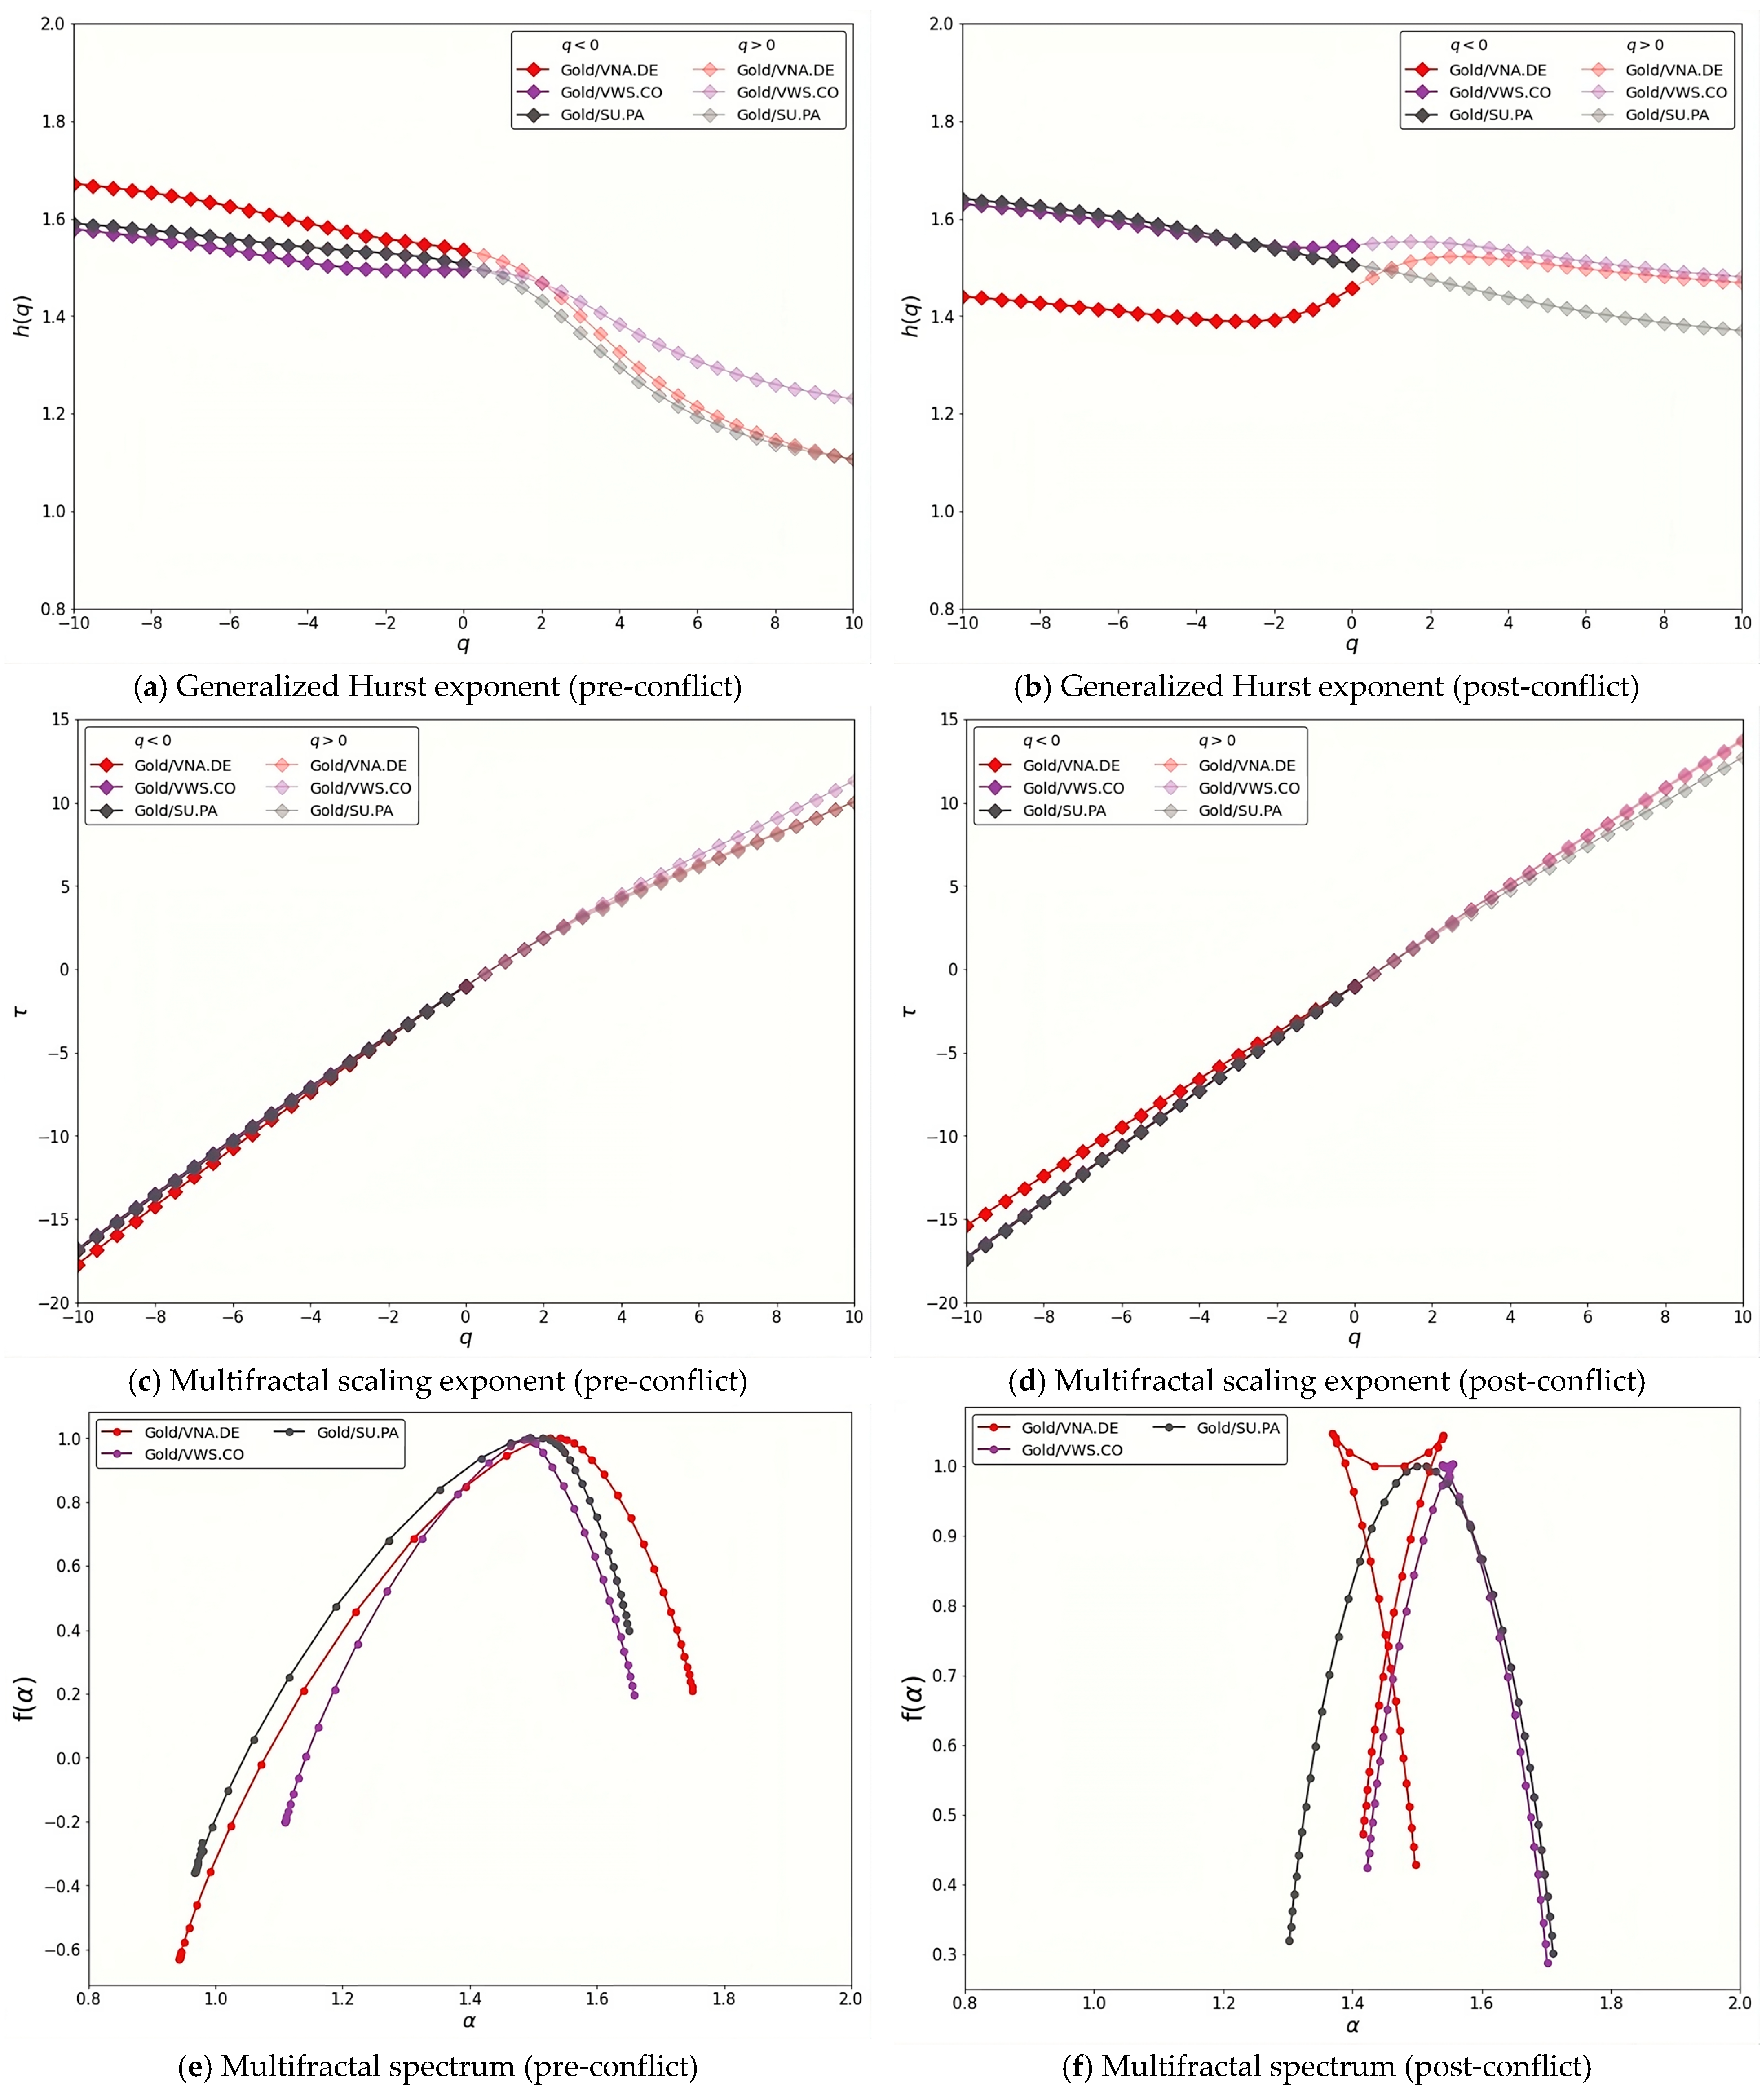
3.1. MF-DCCA
3.2. Nonlinear Granger
4. Conclusions
Author Contributions
Funding
Data Availability Statement
Conflicts of Interest
References
- Umar, M.; Riaz, Y.; Yousaf, I. Impact of Russian-Ukraine war on clean energy, conventional energy, and metal markets: Evidence from event study approach. Resour. Policy 2022, 79, 102966. [Google Scholar] [CrossRef]
- Zaremba, A.; Cakici, N.; Demir, E.; Long, H. When bad news is good news: Geopolitical risk and the cross-section of emerging market stock returns. J. Financ. Stab. 2022, 58, 100964. [Google Scholar] [CrossRef]
- Abbassi, W.; Kumari, V.; Pandey, D.K. What makes firms vulnerable to the Russia-Ukraine crisis? J. Risk Financ. 2023, 24, 24–39. [Google Scholar] [CrossRef]
- KPMG. Russia and Ukraine Conflict: Economic Implications. Available online: https://kpmg.com/xx/en/home/insights/2022/03/russia-and-ukraine-conflict-chief-economist-team.html (accessed on 11 July 2023).
- Boubaker, S.; Goodell, J.W.; Pandey, D.K.; Kumari, V. Heterogeneous impacts of wars on global equity markets: Evidence from the invasion of Ukraine. Financ. Res. Lett. 2022, 48, 102934. [Google Scholar] [CrossRef]
- Sun, M.; Zhang, C. Comprehensive analysis of global stock market reactions to the Russia-Ukraine war. Appl. Econ. Lett. 2022, 30, 2673–2680. [Google Scholar] [CrossRef]
- Bossman, A.; Gubareva, M. Asymmetric impacts of geopolitical risk on stock markets: A comparative analysis of the E7 and G7 equities during the Russian-Ukrainian conflict. Heliyon 2023, 9, e13626. [Google Scholar] [CrossRef] [PubMed]
- Basdekis, C.; Christopoulos, A.; Katsampoxakis, I.; Nastas, V. The Impact of the Ukrainian War on Stock and Energy Markets: A Wavelet Coherence Analysis. Energies 2022, 15, 8174. [Google Scholar] [CrossRef]
- Zhou, W.X. Multifractal detrended cross-correlation analysis for two nonstationary signals. Phys. Rev. E 2008, 77, 066211. [Google Scholar] [CrossRef]
- Ruan, Q.; Yang, H.; Lv, D.; Zhang, S. Cross-correlations between individual investor sentiment and Chinese stock market return: New perspective based on MF-DCCA. Phys. A Stat. Mech. 2018, 503, 243–256. [Google Scholar] [CrossRef]
- Lahmiri, S.; Bekiros, S. Nonlinear analysis of Casablanca stock exchange, Dow Jones, and S&P500 industrial sectors with a comparison. Phys. A Stat. Mech. 2020, 539, 122923. [Google Scholar] [CrossRef]
- Li, S.; Lu, X.; Liu, X. Dynamic relationship between Chinese RMB exchange rate index and market anxiety: A new perspective based on MF-DCCA. Phys. D Nonlinear Phenom. 2020, 541, 123405. [Google Scholar] [CrossRef]
- Yuan, X.; Sun, Y.; Lu, X. SHIBOR Fluctuations and Stock Market Liquidity: An MF-DCCA Approach. Emerg. Mark. Financ. Trade 2022, 58, 2050–2065. [Google Scholar] [CrossRef]
- Fernandes, L.H.; Silva, J.W.L.; De Araujo, F.H.A.; Tabak, B.M. Multifractal cross-correlations between green bonds and financial assets. Financ. Res. Lett. 2023, 53, 103603. [Google Scholar] [CrossRef]
- Lahmiri, S.; Bekiros, S. Big data analytics using multifractal wavelet leaders in high-frequency Bitcoin markets. Chaos Solit. Fractals 2020, 131, 109472. [Google Scholar] [CrossRef]
- Miao, R.; Zhang, B. Analysis on Time-Series Data from Movie Using MF-DCCA Method and Recurrent Neural Network Model under the Internet of Things. Comput. Intell. 2022, 2022, 7400833. [Google Scholar] [CrossRef] [PubMed]
- Zhang, C.; Ni, Z.; Ni, L. Multifractal detrended cross-correlation analysis between PM2.5 and meteorological factors. Phys. A Stat. Mech. 2015, 438, 114–123. [Google Scholar] [CrossRef]
- Kojić, M.; Schlüter, S.; Mitić, P.; Hanić, A. Economy-environment nexus in developed European countries: Evidence from multifractal and wavelet analysis. Chaos Solit. Fractals 2022, 160, 112189. [Google Scholar] [CrossRef]
- Wang, J.; Shao, W.; Kim, J. Cross-correlations between bacterial foodborne diseases and meteorological factors based on MF-DCCA: A case in South Korea. Fractals 2020, 28, 2050012. [Google Scholar] [CrossRef]
- Lin, M.; Wang, G.; Xie, C.; Stanley, H.E. Cross-correlations and influence in world gold markets. Phys. A Stat. Mech. 2018, 490, 504–512. [Google Scholar] [CrossRef]
- Ruan, Q.; Wei, J.; Guo, M. Cross-correlations between price and volume in Chinese gold markets. Phys. A Stat. Mech. 2016, 451, 10–22. [Google Scholar] [CrossRef]
- Jin, J.; Jiang, Y.; Hu, Y.; Shang, Y. Which one is more informative in determining price movements of hedging assets? Evidence from Bitcoin, gold and crude oil markets. Phys. A Stat. Mech. 2019, 527, 121121. [Google Scholar] [CrossRef]
- Bentes, S.R. Is gold a safe haven for the CIVETS countries under extremely adverse market conditions? Some new evidence from the MF-DCCA analysis. Phys. A Stat. Mech. 2023, 623, 128898. [Google Scholar] [CrossRef]
- Aslam, F.; Ferreira, P.; Ali, H. Analysis of the Impact of COVID-19 Pandemic on the Intraday Efficiency of Agricultural Futures Markets. J. Risk Financ. Manag. 2022, 15, 607. [Google Scholar] [CrossRef]
- Mensi, W.; Tiwari, A.K.; Yoon, S.M. Global financial crisis and weak-form efficiency of Islamic sectoral stock markets: An MF-DFA analysis. Phys. A Stat. Mech. 2017, 471, 135–146. [Google Scholar] [CrossRef]
- Aslam, F.; Slim, S.; Osman, M.; Tabche, I. The footprints of Russia-Ukraine war on the intraday (in)efficiency of energy markets: A multifractal analysis. J. Risk Financ. 2023, 24, 89–104. [Google Scholar] [CrossRef]
- Aslam, F.; Ferreira, P.; Ali, H.; José, A.E. Application of Multifractal Analysis in Estimating the Reaction of Energy Markets to Geopolitical Acts and Threats. Sustainability 2022, 14, 5828. [Google Scholar] [CrossRef]
- Fernandez, V. Linear and non-linear causality between price indices and commodity prices. Resour. Policy 2014, 41, 40–51. [Google Scholar] [CrossRef]
- Alzahrani, M.; Masih, M.; Al-Titi, O. Linear and non-linear Granger causality between oil spot and futures prices: A wavelet based test. J. Int. Money Financ. 2014, 48, 175–201. [Google Scholar] [CrossRef]
- Cao, G.; Han, Y.; Li, Q.; Xu, W. Asymmetric MF-DCCA method based on risk conduction and its application in the Chinese and foreign stock markets. Phys. A Stat. Mech. 2017, 468, 119–130. [Google Scholar] [CrossRef]
- Bal, D.P.; Dash, D. Nonlinear Granger causality between oil price and stock returns in India. J. Public Aff. 2020, 21, e2137. [Google Scholar] [CrossRef]
- Peng, Y.; Chen, W.; Wei, P.; Yu, G. Spillover effect and Granger causality investigation between China’s stock market and international oil market: A dynamic multiscale approach. J. Comput. Appl. Math. 2020, 367, 112460. [Google Scholar] [CrossRef]
- Chu, X.; Wu, C.; Qiu, J. A nonlinear Granger causality test between stock returns and investor sentiment for Chinese stock market: A wavelet-based approach. Appl. Econ. 2015, 48, 1915–1924. [Google Scholar] [CrossRef]
- Li, S.; Tu, D.; Yan, Z.; Gong, C.; Yuan, D. Does geopolitical risk matter in crude oil and stock markets? Evidence from disaggregated data. Energy Econ. 2022, 113, 106191. [Google Scholar] [CrossRef]
- Bal, D.; Mohanty, S. Sectoral nonlinear causality between stock market volatility and the COVID-19 pandemic: Evidence from India. Asian Econ. Lett. 2021, 2, 1–4. [Google Scholar] [CrossRef]
- Ruan, Q.; Zhang, M.; Lv, D.; Yang, H. SAD and stock returns revisited: Nonlinear analysis based on MF-DCCA and Granger test. Phys. A Stat. Mech. 2018, 509, 1009–1022. [Google Scholar] [CrossRef]
- Granger, C.W.J. Investigating causal relations by econometric models and cross-spectral methods. Econometrica 1969, 37, 424–438. [Google Scholar] [CrossRef]
- Baek, E.; Brock, A. A General Test for Nonlinear Granger Causality: Bivariate Model; Working Paper Iowa State University and University of Wisconsin: Madison, WI, USA, 1992. [Google Scholar]
- Hiemstra, J.D.; Jones, J. Testing for linear and nonlinear Granger causality in the stock price-volume relation. J. Financ. 1994, 49, 1639–1664. [Google Scholar] [CrossRef]


| Tesla (TSLA) | A sustainable energy company based in the United States that manufactures electric vehicles and renewable energy products to reduce the world’s dependence on fossil fuels. |
| First Solar (FSLR) | A US-based environmentally friendly technology company that specializes in solar cell manufacturing and is driving the transition to renewable energy sources. |
| NextEra Energy (NEE) | A US-based clean energy company that generates electricity from renewable sources such as wind and solar power and is committed to reducing carbon emissions. |
| Waste Management (WM) | A US-based waste management and environmental services company that works to minimize waste and promote recycling to create a more sustainable future. |
| Duke Energy (DUK) | A US-based energy company that has made significant investments in renewable energy and has a goal of zero carbon emissions by 2050. |
| Vonovia SE (VNA.DE) | A German real estate company focused on sustainable housing, promoting energy efficiency, and reducing the carbon footprint of its buildings. |
| Vestas Wind Systems A/S (VWS.CO) | A Danish wind turbine manufacturer driving the shift to renewable energy sources and reducing carbon emissions. |
| Schneider Electric (SU.PA) | A French multinational company specializing in energy management and automation solutions that help optimize energy efficiency and reduce environmental impact. |
| Gold | Many factors, including global economic trends, political events, and changes in interest rates, influence the price of gold. In recent years, gold prices have fluctuated due to different uncertainties. |
| Whole Period | Mean | Med | Max | Min | SD | Ske | Kur | JB | ADF | PP | Obs |
|---|---|---|---|---|---|---|---|---|---|---|---|
| TSLA | 87.56 | 21.68 | 409.97 | 9.58 | 107.61 | 1.21 | 2.95 | 438.99 ** | −2.03 | −2.13 | 1816 |
| FSLR | 66.14 | 59.92 | 180.19 | 26.33 | 28.95 | 1.74 | 6.35 | 1764.82 ** | −1.60 | −1.63 | 1816 |
| NEE | 47.11 | 39.44 | 90.25 | 18.53 | 22.58 | 0.38 | 1.64 | 183.64 ** | −3.26 | −3.40 | 1816 |
| WM | 98.04 | 91.08 | 175.29 | 44.05 | 37.53 | 0.37 | 1.94 | 127.08 ** | −3.45 * | 3.26 | 1816 |
| DUK | 87.16 | 85.82 | 115.43 | 64.15 | 10.77 | 0.45 | 2.41 | 88.89 ** | −4.36 ** | −4.46 ** | 1816 |
| VNA.DE | 38.78 | 29.16 | 62.22 | 18.12 | 11.17 | 0.14 | 1.96 | 87.61 ** | −0.59 | −0.42 | 1816 |
| VWS.CO | 129.64 | 110.02 | 312 | 34.06 | 61.32 | 0.82 | 2.68 | 212.8 ** | −2.66 | −2.47 | 1816 |
| SU.PA | 88.43 | 72.34 | 177.82 | 45.93 | 32.68 | 0.87 | 2.37 | 256.76 ** | −2.24 | −2.36 | 1816 |
| GOLD | 1458.49 | 1319.4 | 2051.5 | 1050.8 | 276.23 | 0.46 | 1.62 | 205.91 ** | −3.21 | −2.81 | 1816 |
| Before RU-UA conflict | |||||||||||
| TSLA | 67.95 | 20.42 | 409.97 | 9.58 | 96.31 | 1.77 | 4.8 | 1056.91 ** | −1.54 | −1.52 | 1604 |
| FSLR | 59.41 | 55.66 | 121.14 | 26.33 | 18.62 | 0.76 | 3.17 | 156.54 ** | −2.69 | −2.69 | 1604 |
| NEE | 42.83 | 36.23 | 90.25 | 18.53 | 20.41 | 0.65 | 2.08 | 168.18 ** | −2.87 | −2.81 | 1604 |
| WM | 89.99 | 85.81 | 166.83 | 44.05 | 32.14 | 0.50 | 2.36 | 95.24 ** | −2.53 | −2.92 | 1604 |
| DUK | 84.96 | 83.99 | 107.93 | 64.15 | 9.17 | 0.43 | 2.54 | 63.22 ** | −4.27 ** | −4.20 ** | 1604 |
| VNA.DE | 39.98 | 40.49 | 62.22 | 18.12 | 11.02 | 0.02 | 1.99 | 67.92 ** | −3.10 | −2.96 | 1604 |
| VWS.CO | 122.72 | 105.45 | 312 | 34.06 | 61.52 | 1.14 | 3.29 | 353.37 ** | −2.10 | −1.86 | 1604 |
| SU.PA | 82.44 | 70.69 | 177.82 | 45.93 | 29.73 | 1.35 | 3.77 | 529.71 ** | −1.85 | −1.90 | 1604 |
| GOLD | 1412.17 | 1293.5 | 2051.5 | 1050.8 | 258.41 | 0.77 | 2.11 | 212.21 ** | −2.73 | −2.50 | 1604 |
| After RU-UA conflict | |||||||||||
| TSLA | 235.96 | 236.82 | 381.82 | 108.1 | 63.95 | −0.10 | 2.32 | 4.41 | −2.06 | −2.18 | 212 |
| FSLR | 117.12 | 122 | 180.19 | 61.4 | 40.23 | 0.00 | 1.40 | 22.51 ** | −1.93 | −2.03 | 212 |
| NEE | 79.50 | 80.16 | 89.77 | 67.02 | 5.4 | −0.22 | 2.13 | 8.45 * | −1.93 | −2.56 | 212 |
| WM | 158.93 | 157.95 | 175.29 | 141.91 | 7.33 | 0.28 | 2.57 | 4.48 | −2.88 * | −2.91 * | 212 |
| DUK | 103.82 | 104.75 | 115.43 | 85.97 | 6.56 | −0.46 | 2.72 | 8.29 * | −2.60 | −2.84 | 212 |
| VNA.DE | 26.69 | 27.07 | 47.5 | 18.97 | 7.52 | 0.87 | 2.68 | 27.92 ** | −1.41 | −1.23 | 212 |
| VWS.CO | 182.02 | 184.28 | 235.4 | 134.88 | 21.66 | −0.30 | 2.22 | 8.51 * | −2.13 | −2.02 | 212 |
| SU.PA | 133.76 | 133.38 | 156.28 | 112 | 11.59 | 0.03 | 2.08 | 7.53 * | −1.79 | −1.68 | 212 |
| GOLD | 1808.9 | 1811.6 | 2040.1 | 1626.7 | 96.81 | −0.00 | 2.05 | 7.95 * | −1.45 | −1.42 | 212 |
| Stock | Metric | Total | Pre | Post |
|---|---|---|---|---|
| TSLA | 1.516 | 1.509 | 1.497 | |
| 0.323 | 0.368 | 0.526 | ||
| 0.474 | 0.525 | 0.714 | ||
| FSLR | 1.495 | 1.496 | 1.423 | |
| 0.310 | 0.289 | 0.215 | ||
| 0.446 | 0.415 | 0.344 | ||
| NEE | 1.537 | 1.522 | 1.638 | |
| 0.564 | 0.698 | 0.413 | ||
| 0.782 | 0.928 | 0.559 | ||
| WM | 1.530 | 1.520 | 1.539 | |
| 0.453 | 0.505 | 0.375 | ||
| 0.681 | 0.722 | 0.525 | ||
| DUK | 1.554 | 1.547 | 1.652 | |
| 0.591 | 0.681 | 0.170 | ||
| 0.803 | 0.903 | 0.292 |
| Stock | Metric | Total | Pre | Post |
|---|---|---|---|---|
| VNA.DE | 1.527 | 1.532 | 1.486 | |
| 0.579 | 0.616 | 0.204 | ||
| 0.797 | 0.840 | 0.343 | ||
| VWS.CO | 1.497 | 1.489 | 1.525 | |
| 0.219 | 0.271 | 0.203 | ||
| 0.346 | 0.396 | 0.339 | ||
| SU.PA | 1.505 | 1.495 | 1.499 | |
| 0.454 | 0.603 | 0.294 | ||
| 0.643 | 0.831 | 0.434 |
| Test | TSLA | Gold | FSLR | Gold | NEE | Gold | WM | Gold | DUK | Gold | |
|---|---|---|---|---|---|---|---|---|---|---|---|
| = | |||||||||||
| Gold | TSLA | Gold | FSLR | Gold | NEE | Gold | WM | Gold | DUK | ||
| 1 | Statistics | 1.145 | 65.220 | 1.011 | 65.574 | 1.180 | 68.139 | 1.895 | 74.430 | 3.611 | 3.611 |
| p-value | 0.325 | <0.01 | 0.431 | <0.01 | 0.299 | <0.01 | 1 | <0.01 | <0.01 | <0.01 | |
| 2 | Statistics | 1.4778 | 56.839 | 1.407 | 57.151 | 2.661 | 57.389 | 0.194 | 59.542 | 4.373 | 57.800 |
| p-value | 0.1 | <0.01 | 0.129 | <0.01 | <0.01 | <0.01 | 1 | <0.01 | <0.01 | <0.01 | |
| 3 | Statistics | 0.907 | 36.639 | 0.877 | 36.504 | 1.614 | 36.613 | 0.233 | 37.471 | 2.557 | 36.946 |
| p-value | 0.585 | <0.01 | 0.627 | <0.01 | 0.036 | <0.01 | 1 | <0.01 | <0.01 | <0.01 | |
| 4 | Statistics | 0.5428 | 23.868 | 0.525 | 22.962 | 0.900 | 23.213 | 0.115 | 24.103 | 1.424 | 23.427 |
| p-value | 0.976 | <0.01 | 0.981 | <0.01 | 0.615 | <0.01 | 1 | <0.01 | 0.070 | <0.01 |
| Test | VNA.DE | Gold | VWS.CO | Gold | SU.PA | Gold | |
|---|---|---|---|---|---|---|---|
| = | |||||||
| Gold | VNA.DE | Gold | VWS.CO | Gold | SU.PA | ||
| 1 | Statistics | 5.837 | 59.587 | 0.864 | 73.112 | −0.828 | 74.123 |
| p-value | <0.01 | <0.01 | 1 | <0.01 | 1 | <0.01 | |
| 2 | Statistics | 5.074 | 55.914 | 0.121 | 58.703 | 0.261 | 60.142 |
| p-value | <0.01 | <0.01 | 1 | <0.01 | 1 | <0.01 | |
| 3 | Statistics | 2.988 | 36.354 | 0.171 | 37.032 | 0.2756 | 38.078 |
| p-value | <0.01 | <0.01 | 1 | <0.01 | 1 | <0.01 | |
| 4 | Statistics | 1.688 | 23.110 | 0.123 | 23.464 | 0.193 | 24.348 |
| p-value | 0.014 | <0.01 | 1 | <0.01 | 1 | <0.01 |
Disclaimer/Publisher’s Note: The statements, opinions and data contained in all publications are solely those of the individual author(s) and contributor(s) and not of MDPI and/or the editor(s). MDPI and/or the editor(s) disclaim responsibility for any injury to people or property resulting from any ideas, methods, instructions or products referred to in the content. |
© 2023 by the authors. Licensee MDPI, Basel, Switzerland. This article is an open access article distributed under the terms and conditions of the Creative Commons Attribution (CC BY) license (https://creativecommons.org/licenses/by/4.0/).
Share and Cite
Kojić, M.; Mitić, P.; Minović, J. Gold and Sustainable Stocks in the US and EU: Nonlinear Analysis Based on Multifractal Detrended Cross-Correlation Analysis and Granger Causality. Fractal Fract. 2023, 7, 738. https://doi.org/10.3390/fractalfract7100738
Kojić M, Mitić P, Minović J. Gold and Sustainable Stocks in the US and EU: Nonlinear Analysis Based on Multifractal Detrended Cross-Correlation Analysis and Granger Causality. Fractal and Fractional. 2023; 7(10):738. https://doi.org/10.3390/fractalfract7100738
Chicago/Turabian StyleKojić, Milena, Petar Mitić, and Jelena Minović. 2023. "Gold and Sustainable Stocks in the US and EU: Nonlinear Analysis Based on Multifractal Detrended Cross-Correlation Analysis and Granger Causality" Fractal and Fractional 7, no. 10: 738. https://doi.org/10.3390/fractalfract7100738
APA StyleKojić, M., Mitić, P., & Minović, J. (2023). Gold and Sustainable Stocks in the US and EU: Nonlinear Analysis Based on Multifractal Detrended Cross-Correlation Analysis and Granger Causality. Fractal and Fractional, 7(10), 738. https://doi.org/10.3390/fractalfract7100738