Article

Application of Multifractal Analysis Theory to Interpret T2 Cutoffs of NMR Logging Data: A Case Study of Coarse Clastic Rock Reservoirs in Southwestern Bozhong Sag, China

1
School of Energy Resources, China University of Geosciences, Beijing 100083, China
2
Beijing Key Laboratory of Unconventional Natural Gas Geological Evaluation and Development Engineering, China University of Geosciences, Beijing 100083, China
3
China Oilfield Services Limited, Tianjin 300459, China
*
Author to whom correspondence should be addressed.
Fractal Fract. 2023, 7(1), 57; https://doi.org/10.3390/fractalfract7010057
Submission received: 28 November 2022 / Revised: 27 December 2022 / Accepted: 29 December 2022 / Published: 2 January 2023
(This article belongs to the Special Issue Applications of Fractal Geometry Theory in Porous Media)

Abstract

:
The Paleocene Kongdian Formation coarse clastic rock reservoir in Bozhong Sag is rich in oil and gas resources and has huge exploration potential. However, the coarse clastic rock reservoir has the characteristics of a complex pore structure and strong heterogeneity, which restrict the accuracy of evaluating the reservoir’s physical properties, such as porosity and permeability, for field evaluation. Nuclear magnetic resonance (NMR) technology has become a popular methods for unconventional reservoir evaluation because it can obtain abundant reservoir physical property information and because of its ability to identify fluid characteristics information. The transverse relaxation time (T2) cutoff (T2C) value is an important input parameter in the application of NMR technology. The accuracy of the T2C value affects the accuracy of the reservoir evaluation. The standard method for determining the T2C value requires a series of complicated centrifugation experiments in addition to the NMR experiments, and its application scope is limited by obtaining enough core samples. In this study, 14 core samples from the coarse clastic rock reservoir in the southwestern Bozhong sag of the Bohai Bay Basin were selected, and NMR measurements were carried out under the conditions of fully saturated water and irreducible water to determine the T2C value. Based on the multifractal theory, the NMR T2 spectrum of the saturated sample was analyzed, and the results show that the NMR T2 distribution of the saturated sample has multifractal characteristics, and the multifractal parameter Dq and the singular intensity range Δα have a strong correlation with the T2C value. Thus, based on multiple regression analyses of the multifractal parameters with the experimental T2C value of 10 core samples, we propose a method to predict the T2C value. After applying this method to 4 samples that were not used in the modeling, we confirmed that this method can be used to predict the T2C value of core samples. Furthermore, we expanded this method to the field application of a production well in Bozhong sag by adding an empirical index in the model. The new model can be used to directly calculate the T2C value of NMR logging data, and it does not require any other extra data, such as those from core analysis. This method is applicable in fast reservoir evaluations by only using NMR logging data in the field. The research results improve the accuracy of field NMR logging reservoir evaluations.

1. Introduction

Bohai Bay Basin is a typical rift lake basin with complex geological conditions [1]. The coarse clastic rock reservoirs are widely developed in the basin and have great potential for oil and gas exploration [2,3]. The coarse clastic rock reservoir of the Kongdian formation in the Bohai Bay Basin, as an unconventional oil and gas reservoir, has achieved extensive attention for researchers in recent years [4,5]. Coarse clastic rock, usually consisting of sandstone and conglomerate gravel, is commonly characterized by its complex mineral composition, variable lithology, poor pore connectivity, and high reservoir heterogeneity [6,7,8]. Due to the complex reservoir conditions of the coarse clastic rock in the Bohai Bay Basin, evaluating the reservoir’s characteristics, especially the reservoir`s physical properties, is extremely difficult.
Nuclear magnetic resonance (NMR) logs can directly detect fluids, independent of the rock skeleton, and they can measure the parameters of physical properties, such as pore size distribution (PSD), pore connectivity, porosity, bound/movable water saturation and permeability [9,10,11]. NMR logs have been applied for evaluating the physical properties of the coarse clastic rock reservoir in the Bohai Bay Basin [12]. For the application of NMR logs evaluation, the transverse relaxation time (T2) cutoff (T2C) value is commonly used to classify fluid types, to calculate the irreducible water saturation, to determine the PSD, and to estimate reservoir permeability [13,14]. As a key parameter for NMR logs evaluation, T2C is extremely difficult to determine when there is only the NMR log but no core analysis data.
The T2C values of rocks with different lithologies are different. In general, field-applied fixed values of 33 ms and 92 ms are commonly recommended as T2C values for sandstone and carbonate reservoirs, respectively, originally obtained from laboratory NMR experiments on core samples drilled in the Wilcox region of the Gulf of Mexico and the western Canadian field [15]. However, T2C values can be locally variable for the same rock type in different wells [16,17]. Previous investigations indicate that the coarse clastic rock of the Kongdian Formation in the study area has strong heterogeneity [5]. It is, therefore, not suitable to use a constant T2C value (e.g., 33 ms) for all wells in the study area. To accurately evaluate reservoir characteristics, it is necessary to obtain an accurate T2C value for individual wells.
For the determination of the T2C value, NMR centrifugation is a commonly used method [18]. However, it is an experimental method, and the method needs mass core samples to reflect the characteristics of the whole well. It is also unreasonable to perform the centrifuge experiment of core samples for all wells in the whole study area. Some scholars have also proposed many empirical models to predict T2C values. For example, Godefroy et al. [19] proposed an estimation model for predicting T2C values at different reservoir temperatures. Nicot et al. [20] found that the T2C value is negatively correlated with the volume magnetic susceptibility of rocks. Wang et al. [21] indicated that there is a good quadratic function relationship between T2C and the pore structure. Parra et al. [22] established a model to predict the T2C value based on Flow Zone Indicators (FZI). Note that the above empirical models all need extra experimental data (e.g., FZI and volume magnetic susceptibility). Therefore, the above methods have not been widely applied in the field.
The fractal theory is a simple and powerful tool used to study self-similar objects [23]. In recent years, the fractal theory has been widely used in the study of reservoir physical properties [24]. The traditional fractal analysis works well for rocks with simple pore structures but not for complex reservoirs [25]. In contrast, multifractal analysis can provide more comprehensive information to study the physical properties of reservoirs [26], and the multifractal parameters of the NMR T2 spectrum are linked to reservoir physical properties [26,27]. Thus, it is possible to apply the multifractal analysis of the NMR T2 spectrum to determine the T2C value. To the best of our knowledge, there are no reports about the application of multifractal analysis in estimating the T2C of NMR well-logging data.
In this study, we collected 14 coarse clastic rock samples, performed NMR and centrifugal experiments, and analyzed the experimental data using multifractal theory to achieve the following objectives: (1) present the experimental results of T2C of 14 samples; (2) study the relationship between multifractal parameters and the T2C of 10 samples; and (3) propose a prediction model that can be used to calculate any T2C value in different segments in a well without the necessity of any extra experimental data. Finally, this method was validated by comparing the predicted results with experimental results for 4 core samples that were not used for the modeling. This method can be applied in formation evaluations in the field of the Bohai Bay Basin.

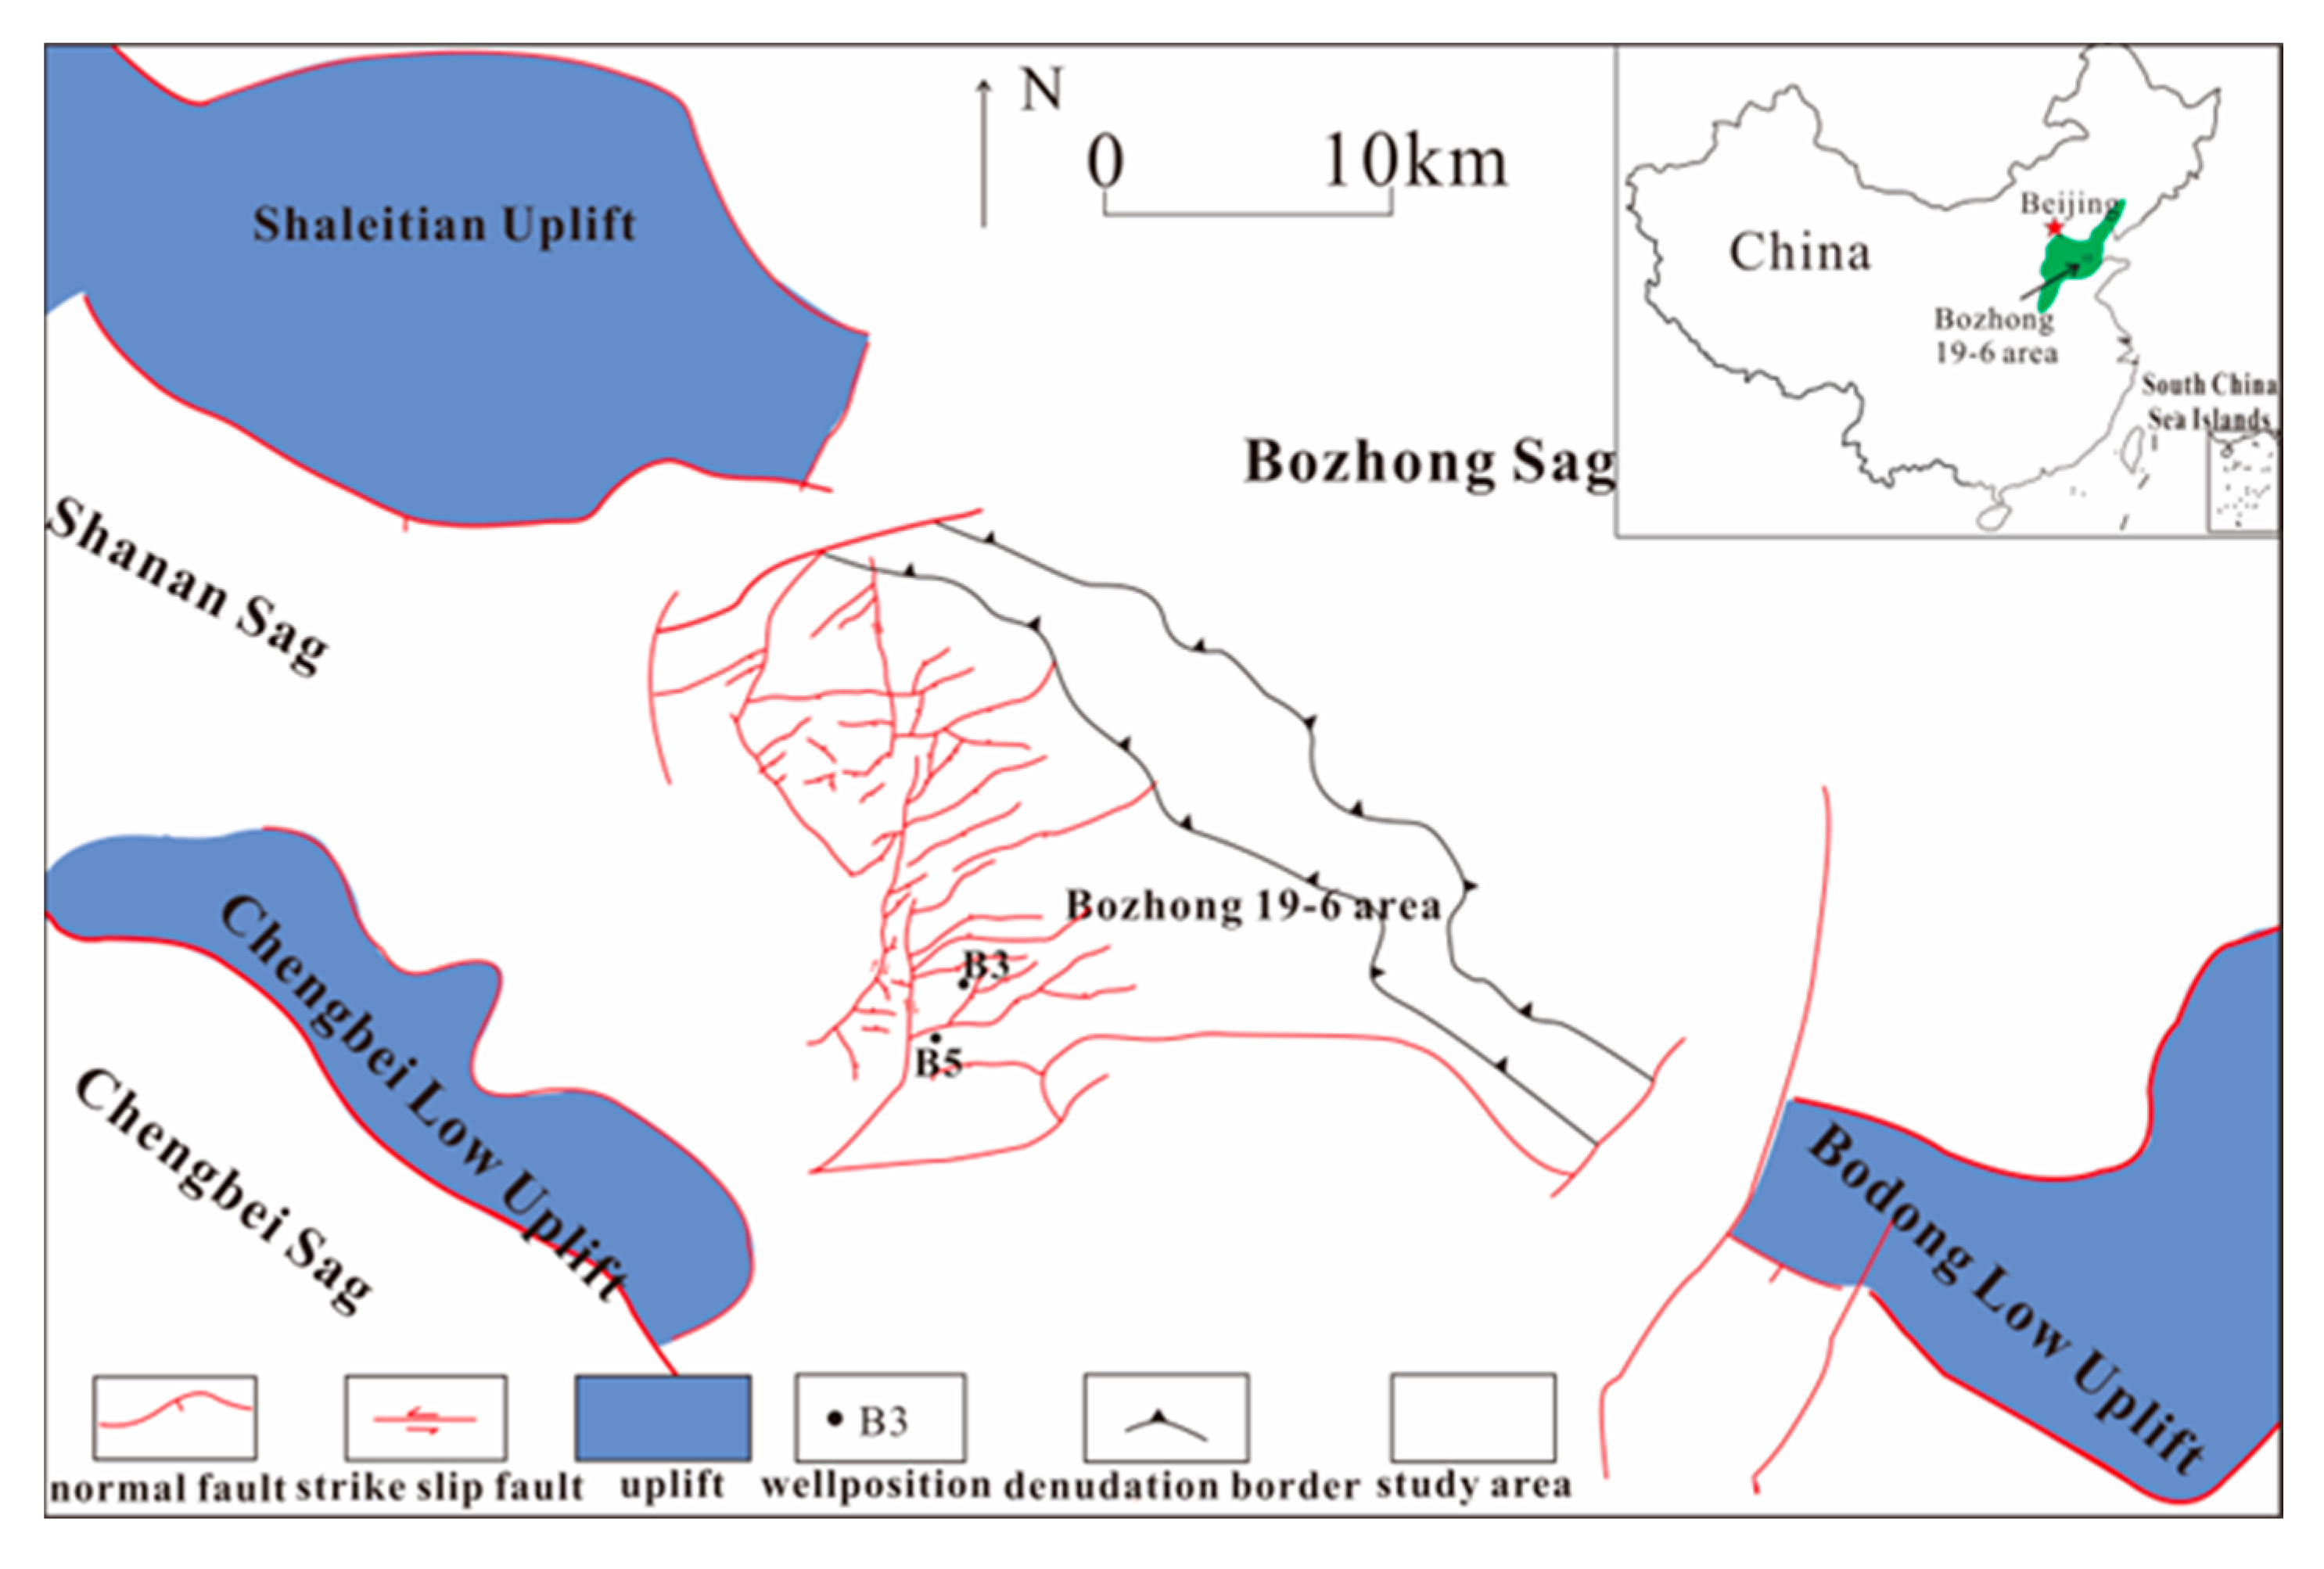
2. Geological Background

The Bohai Bay Basin has huge resource potential and is an important oil and gas exploration and development area in China [28]. Bozhong Sag is located in the central and eastern parts of the Bohai Bay Basin and is the depositional center of the Bohai Bay Basin [29,30]. The study area is the Bozhong 19-6 area (Figure 1), which is an anticline area restricted by four faults [31] in the Bozhong sag.
The Paleocene tectonic evolution of the Bohai Bay Basin mainly experienced four rifting stages. The first rift occurred from the Paleocene to the early Eocene, depositing the Kongdian Formation—the target seam of this study (Figure 2), which is widely distributed in the study area. The sand body type of the coarse clastic rock reservoir in the study area is the fan delta. The Shahejie Formation includes the 1st to 4th members, in which the 4th member represents the second rifting period, and the 3rd–1st members belong to the third rifting period. The Dongying Formation was deposited in the Oligocene, belonging to the fourth rifting period (Figure 2).
The coarse clastic rock of the Kongdian Formation and sandstones of the Shahejie Formation are the main reservoirs of Paleogene [3]. The buried depth of the coarse clastic rock reservoir in the Kongdian Formation is 3500 m–4200 m. The dark mudstones of the Shahejie Formation and the Dongying Formation are the main source rocks and cap rocks in the study area (Figure 2). The dark mudstone cap rocks overlying the Kongdian Formation have a continuous thickness of more than 400 m.

3. Samples and Methods

3.1. Samples

In total, 14 coarse clastic rock samples were collected from the Kongdian Formation of Well-B3 in the 19-6 area of the Bozhong Sag, Bohai Bay Basin (Figure 1). The sampling depths for these samples were from 3853.15 m to 4054.80 m (Table 1). All samples were prepared in cylinders with diameters of 25 mm and lengths of 25 mm.
All 14 samples were glutenite. The mineral compositions of the 14 samples were dominated by quartz, potash feldspar, and sodium feldspar, followed by clay minerals (Figure 3). The pores in the samples were mainly composed of intragranular pores, dissolution pores, and microfractures. Intergranular pores are important reservoir spaces formed with the mutual support of particles, and they are usually triangular or polygonal in shape with smooth, straight edges (Figure 4a,b,d). Dissolution pores are formed by the dissolution of unstable minerals under the action of fluid, which is common in the study area. Dissolution pores are mainly formed in feldspar particles, with a pore size of 0.03–0.15 mm, and have an irregular shape (Figure 4e,f). The microfracture in the study area was mainly related to tectonic movement and weathering leaching. The study area had strong geological activities, and the reservoir microfracture was relatively developed (Figure 4c,e). The microscopic observations show that the pore structures of the samples were complex, which makes it difficult to evaluate the reservoir’s physical properties.

3.2. NMR and Centrifugal Experiments

All samples were tested for helium porosity, water porosity, and air permeability and were then subjected to the NMR and centrifugal experiments.
The NMR transverse relaxation time (T2) was measured for the samples. The measured T2 is commonly composed of three parts [32]:
1 T 2 = 1 T 2 S + 1 T 2 B + 1 T 2 D
where T2S, T2B and T2D are the surface relaxation time, bulk relaxation time, and diffusion relaxation time, respectively. When a uniform magnetic field and Carr-Purcell-Meiboom-Gill (CPMG) sequence are used for T2 measurement for a water-saturated porous medium, the bulk relaxation time and diffusion relaxation time can be ignored [33], and T2 can be expressed as a relationship with pore size [34]:
1 T 2 = 1 T 2 S = ρ 2 S V = F S ρ 2 r
where ρ2 is the surface relaxivity in μm/s, S is the pore surface in μm2 and V is the pore volume in μm3. Fs is the pore shape factor, and r is the pore radius in μm.
For the T2 spectrum of a 100% saturated sample, the NMR signal intensity can be converted to porosity using a standard calibration method [35]:
φ N M R = m M × V v × 100 %
where m is the total signal intensity of a 100% saturated sample, M is the total signal intensity of the standard sample, V is the volume of water in the standard sample in cm3 and v is the volume of the 100% saturated sample in cm3.
In this study, the low-field (magnetic field of 0.047 T and frequency of 2 MHz) NMR measurements were performed on all 14 samples under 100% saturated and irreducible water conditions at 25 °C. The experimental process included (1) vacuuming and saturating the sample with 6000 mg/L KCL solution for 24h; (2) performing NMR measurements on the 100% water-saturated sample to obtain a T2 spectrum; (3) putting the sample into a high-speed centrifuge and performing a centrifugation experiment with a centrifugal force of 2.07MPa (300psi) to obtain an irreducible water condition for the sample; and (4) performing NMR measurements again to obtain a T2 spectrum of the sample in irreducible conditions.
The T2C values of the samples can be obtained by analyzing the T2 spectra of the samples obtained in steps 2 and 4. The T2C can be used to calculate the irreducible water saturation (Swirr) [36]:
S w i r r = T 2 m i n T 2 c S T d t T 2 m i n T 2 m a x S T d t × 100
where Swirr is the irreducible water saturation in %. T2min is the minimum T2 relaxation time in ms, and T2max is the maximum T2 relaxation time in ms. S(T) is the porosity distribution function under 100% water-saturated conditions.

3.3. Multifractal Analysis

In this paper, we used the box-counting method to perform a multifractal analysis of the NMR T2 spectra data. First, the multifractal parameters (e.g., τ(q), Δα and Dq) were calculated based on the multifractal analysis. Then, a practical T2C prediction model was proposed by analyzing the relationship among Dq, Δα and T2C. Finally, the model was applied to NMR logging interpretation. The details of the modeling and application process can be found in Section 5.
Many scholars have described the multifractal theory in detail [37,38]. Here is a brief review of the multifractal analysis theory.
In this procedure, the research object is divided into N equal boxes with the box-counting method, and the size of each box is ε. Then, the probability mass function of the ith box with size ε can be expressed as [39]:
P i ε = N i ε i = 1 N ε N i ε
where Ni(ε) is the cumulative porosity or cumulative pore volume of interval i. Pi(ε) is the probability mass function.
If the research object has multifractal characteristics, the probability mass function Pi(ε) and the box size ε have a power exponential relationship, which can be expressed as [40]:
P i ε ε α i
where αi is the Lipschitz-Hölder singularity exponent, and the position of the box affects the value of αi.
Nα(ε) is the number of boxes with the same α value, and Nα(ε) conforms to [40]:
N α ε ε f α
where f(α) is the spectrum of the fractal dimensions formed by boxes with the same α value, and the relationship between f(α) and α is a unimodal curve. α(q) and f(α) can be calculated based on the following equations [41]:
α q [ i = 1 N ( ε ) u i q , ε × l n p i ε ] / ln ε
f q [ i = 1 N ε u i q , ε × l n u i q , ε ] / ln ε
where
u i q , ε = P i q ε i = 1 N ε P i q ε
where q is an order of the matrix, and the value range is from −∞ to +∞. The value of q in this study is an integer in the interval [−10,10]. The denominator in Equation (10) is the partition function. It can be expressed as [42]:
X q , ε = i = 1 N i P i q ε ε q 1 D q
where Dq is the generalized dimension related to q, which is defined as [41]:
D q = 1 q 1 lim ε 0 l o g i = 1 N ε p i q ε l o g ε
For q, when q < 0, Dq represents the low probability measurement region of the NMR T2 distributions; when q > 0, Dq represents the high probability measurement region of the NMR T2 distributions [43].
The mass exponent τ(q) can be defined as [44]:
τ q = lim ε 0 log X q , ε log ε = lim ε 0 i = 1 N ε P i q ε log ε
Combining Equations (12) and (13), the mass exponent τ(q) can be expressed as [40]:
τ q = 1 q D q
Through the Legendre transformation [41], relationships between the singularity strength α(q) and q and τ(q) can be expressed as [41]:
α q = d τ q d q
f α = q α q τ q
Generally, the multifractal dimension Dq and singularity strength range Δαα = αmaxαmin) are two important parameters used to study the multifractal characteristics, singularity, and heterogeneity of the pore structures of porous media [42].

4. Results

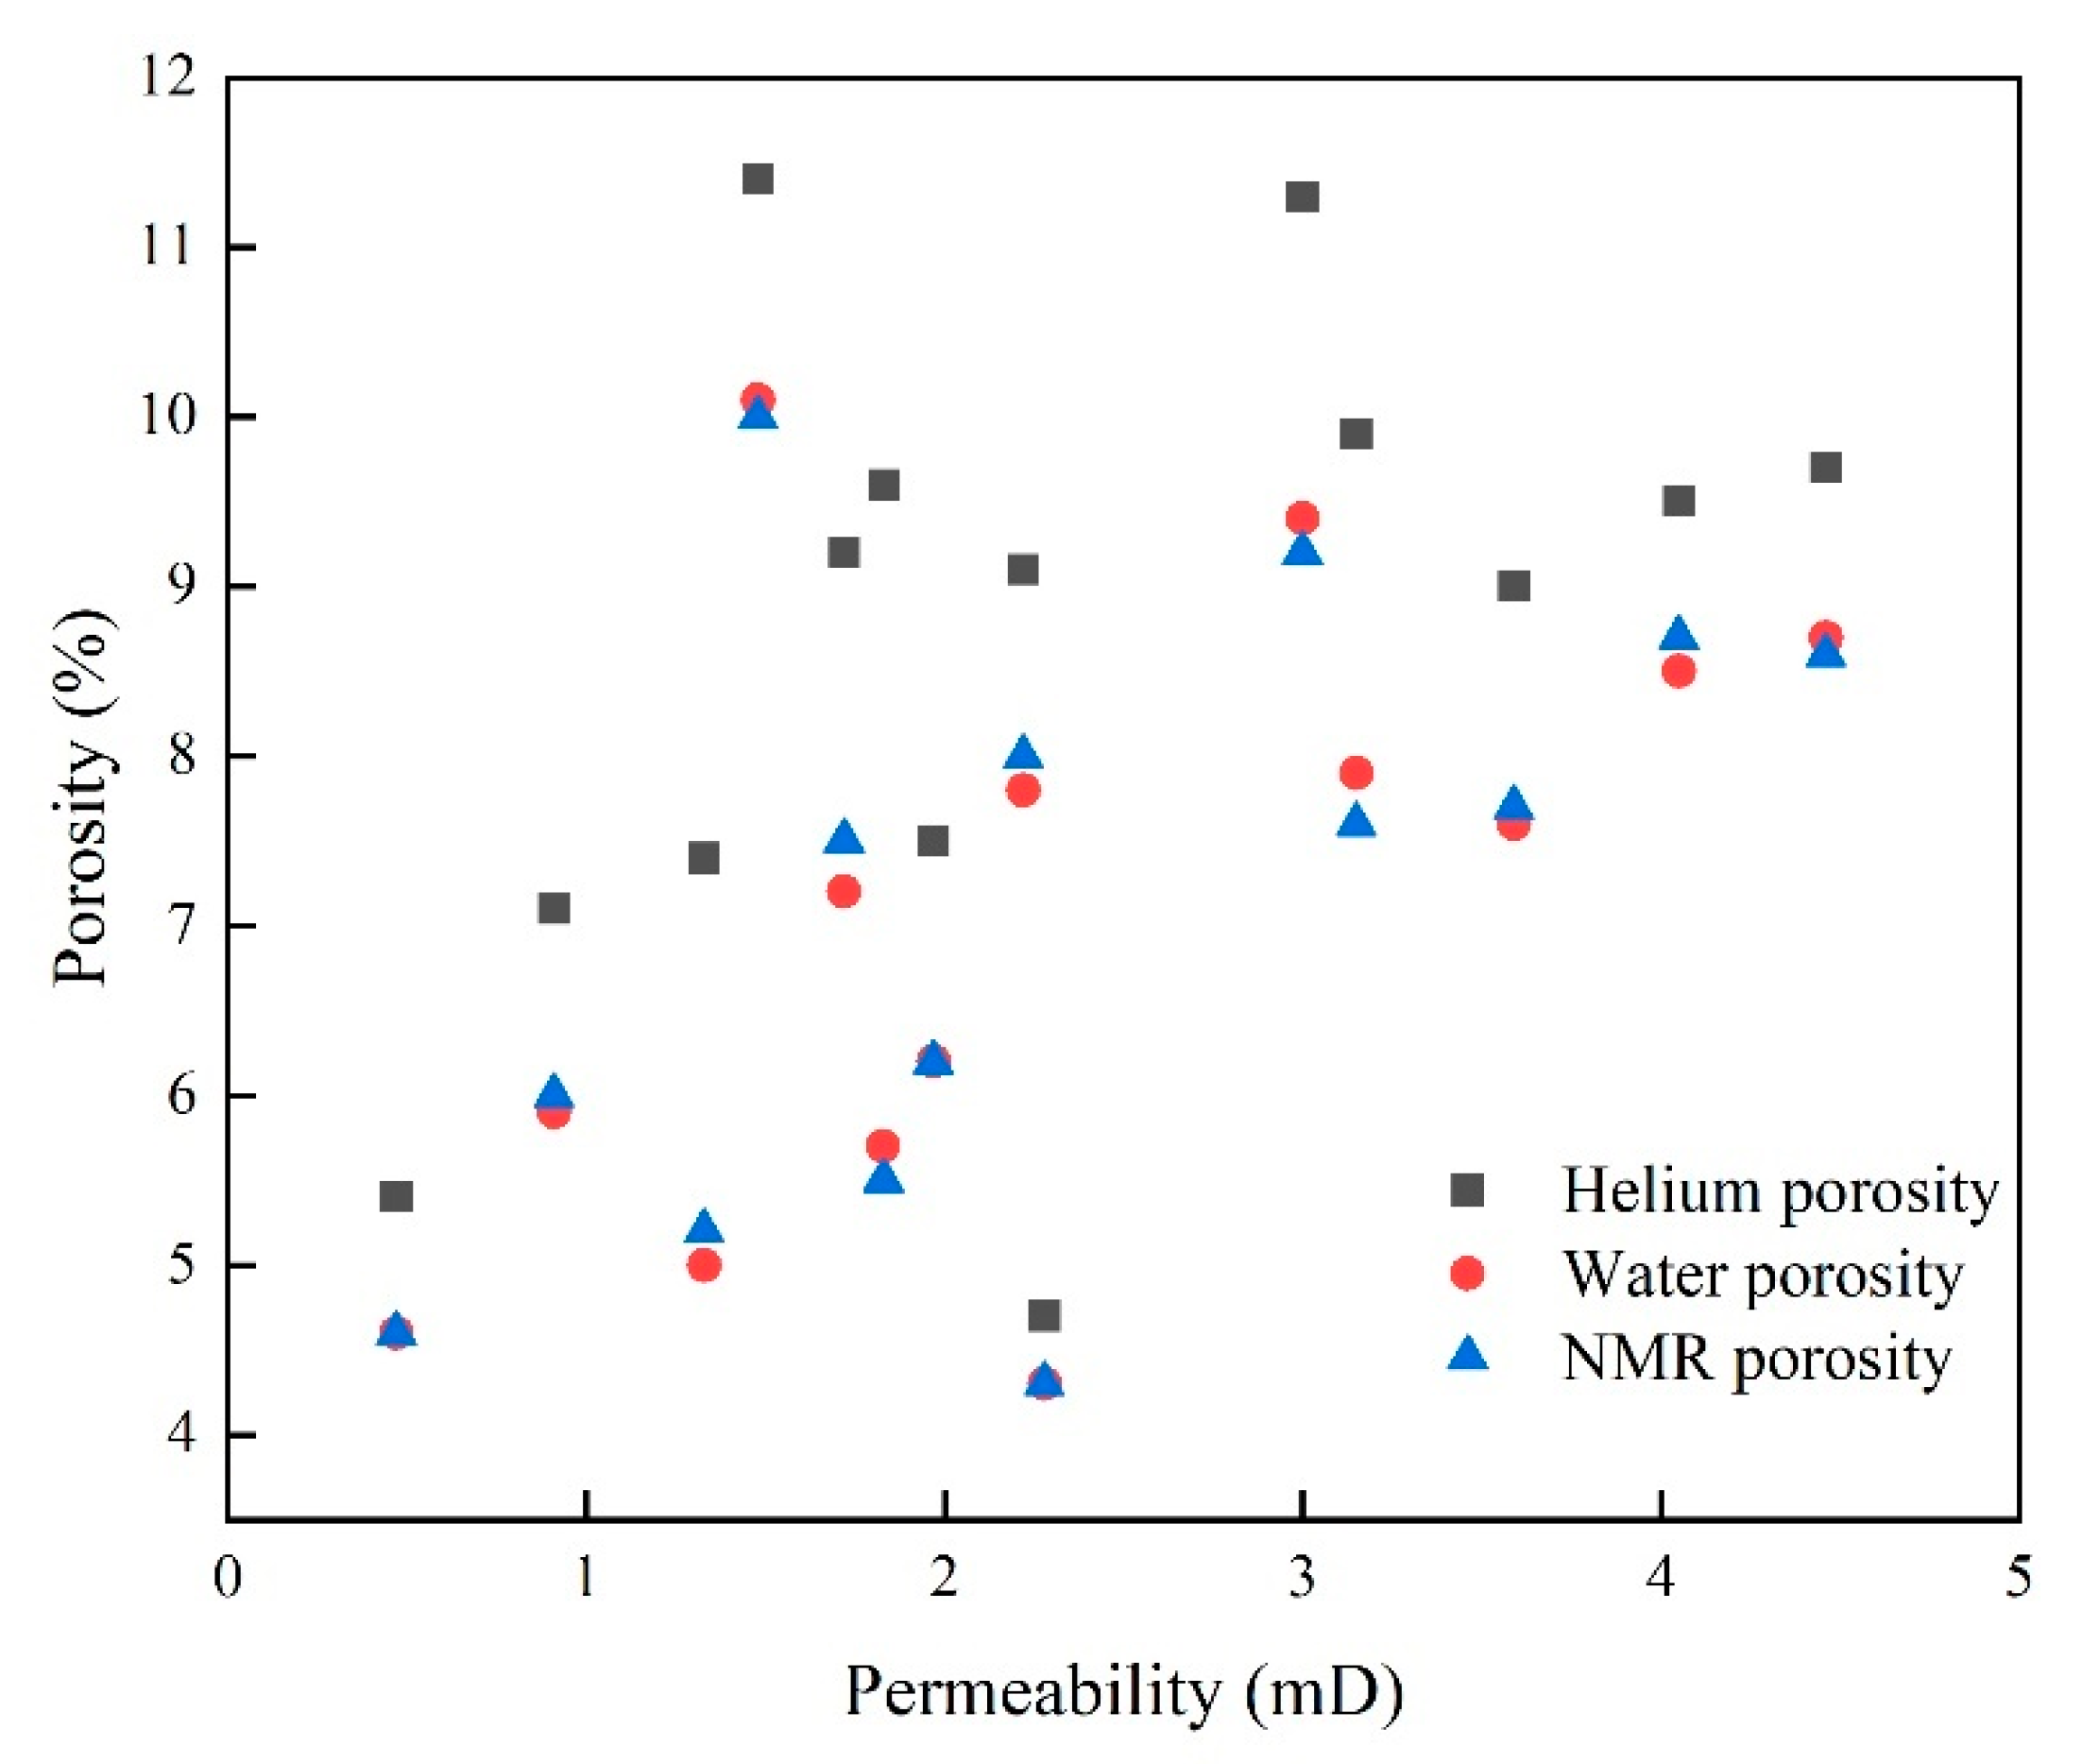
4.1. Porosity and Permeability

Table 1 shows the petrophysical properties of the 14 samples, including helium porosity (Φ-helium), water porosity (Φ-water), NMR porosity (Φ-NMR), and air permeability. The samples’ porosity measured with helium gas was in the range of 4.7%–11.4%, and the helium porosity was higher than both the water porosity (4.3%–10.1%) and NMR porosity (4.3%–10%). Φ-NMR revealed an excellent correlation with both Φ-helium and Φ-water (Figure 5), indicating the high credibility of the NMR measurement results. The value of Φ-helium was larger than the value of Φ-water and Φ-NMR, because a helium molecule has higher accessibility to pores than a water molecule [45]. The air permeability of all samples was less than 5 mD. The relationship between permeability and porosity was poor (Figure 6), which reflects complex pore structures and high reservoir heterogeneity.

4.2. Calculation of T2C Based on Core Analysis

The 100% water saturation NMR T2 distributions of the 14 samples are shown in Figure 7. These samples all exhibited a bimodal distribution, with the left peak centering at approximately 0.01–12 ms. The irreducible water condition was completed by centrifugal experiments. The red curves in Figure 7 show the T2 spectra of the samples in irreducible water conditions. After centrifuging, the T2 spectrum area for each sample was reduced greatly. The left peak area reduced slightly, whereas the right peak area decreased significantly or even disappeared totally, indicating that the movable fluid was centrifuged out from the larger pores of the sample (Figure 7).
The T2C was calculated by comparing the T2 spectrum at full water saturation and under irreducible water conditions, as illustrated in Figure 7. The details of the calculation method can be found in the work by Yao et al. [33] (2010). In this study, we calculated the T2C for all samples. The T2C values of the 14 samples ranged from 5.94 ms to 25.93 ms (Table 1), which confirmed the high pore heterogeneity of the selected samples.

4.3. Multifractal Analysis of the NMR Data

We used the box-counting method to analyze the multifractal characteristics of the NMR T2 spectra data of the 100% saturated water samples and obtained the multifractal parameters (τ(q), f(α) and Dq). The method for the multifractal analysis of the NMR data is described in Section 3.3. The multifractal analysis results for the 14 fully water-saturated samples are presented in Figure 8, Figure 9 and Figure 10. Note that, among the 14 samples, 10 samples were used for modeling, and the other 4 samples (#5, #9, #10, #14) were used for validating the model. Before establishing the T2C calculation method based on multifractal analysis, the multifractal characteristics of the samples should be evaluated first.
To determine whether the data have multifractal characteristics, the following points should be satisfied: (1) The mass exponent τ(q) strictly monotonically increases with q and is nonlinear; (2) f(α) has a convex function relation with α; and (3) Dq strictly monotonically decreases with q, and in different probability regions, the trend is different [46].
The relationship between τ(q) and q for the 14 samples (Figure 8) shows that τ(q) increases with increases in q. The curve can be divided into two sections: with the increase in q, τ(q) increases significantly when q < 0, and the increasing trend becomes slow when q > 0. In Figure 8, the τ(q) − q curves of the 14 samples meet the first requirement.
Figure 9 shows the multifractal spectra of 14 samples. The multifractal spectra reveal the shape of an upwardly convex parabola, with characteristics of an asymmetric distribution. Each spectrum can be divided into left and right branches: the left branch corresponds to the high probability measurement area, where f(α) increases sharply with increases in α, whereas the right branch represents the low probability measurement area, where f(α) decreases as α increases. In Figure 9, the f(a) − a curves of the 14 samples meet the second requirement. The range of Δαα = the maximum of α − the minimum of α) is 2.382–3.316. As Δα becomes greater, the pore distribution becomes more complex, and the heterogeneity has a higher degree [43]. In Figure 9, it can be seen that different samples have different Δα, and the heterogeneity of #6 is the strongest.
Figure 10 shows the relationship between Dq and variable q. Dq reflects the complexity of multifractal sets. D0 is defined as the capacity dimension or the box-counting dimension, which reflects the average distribution of the structure [47]. D1 is the information dimension, as a measure of the concentration of the aperture distribution [48]. D2 is the correlation dimension, which represents the scaling behavior at the second sampling moment [49]. ΔD = D−10D10 is the bending degree of the generalized dimension curve; as the value becomes larger, the heterogeneity of the reaction pores becomes stronger [38]. In Figure 10, with increases in q, Dq decreases significantly when q < 0, whereas it decreases slowly when q > 0. For each sample, the Dq − q curves meet the third requirement.
In summary, the multiple parameter characteristics of the 14 samples meet the above three requirements, indicating that the samples have multifractal characteristics. The relationship between the multifractal parameters (Dq, Δα, etc.) and T2C is further discussed in Section 5.

5. Discussion

5.1. Relationships between T2C and Multifractal Parameters

Many scholars have confirmed that the multifractal parameters (such as Dq and Δα) of the 100% water saturation T2 spectrum are distinctly correlated with the petrophysical properties [50,51], and there is a strong correlation between the T2C value and the petrophysical properties [42,52]. Ge et al. [50] proposed a prediction model for the T2C value by analyzing the relationship between the multifractal parameters of the T2 spectrum and the T2C of sandstones. Based on this logic, this study established a prediction model for the T2C value by studying the relationship between multifractal parameters and the T2C value.
In order to establish the model, 14 samples were divided into two groups with random sampling. One group contained 10 samples (including #1, #2, #3, #4, #6, #7, #8, #11, #12, and #13) to establish the model, and the other group contained 4 samples (included #5, #9, #10 and #14) to verify the accuracy of the model.
Figure 11 shows the relationship between the multifractal dimension Dq (q = 10, 2, 1, −1, −2, −10) and the T2C of ten modeling samples. As shown in the figure, when q < 0, the T2C value is positively correlated with Dq, and as q changes, the goodness of fit is greater than 0.8. When q > 0, T2C is negatively correlated with Dq, and the correlation is poor. In order to further study the relationship between the T2C value and Dq when q < 0 and q > 0, the difference between the multifractal dimension D−q-Dq and the ratio of the multifractal dimension D−qDq was investigated.
Figure 12 shows the relationships of the T2C value vs. the D−qDq and D−q/Dq of ten modeling samples. As shown in Figure 12a, with the increase in the T2C value, as q changes, the goodness of fit is 0.80–0.81. This means that T2C has a strong correlation with D−qDq. Similarly, there is also a positive correlation between the T2C value and D−q/Dq. As shown in Figure 13, with the increase in the T2C value, the value of the Δα of ten modeling samples also increases, and the goodness of fit is 0.80. This means that Δα is also an influence factor for the T2C value.

5.2. Model and Its Validation

As discussed before, the T2C value of the 10 samples is distinctly correlated with their D−10/D10, D−10D10 and Δα. To combine the influences of the three parameters with the T2C value, we propose an empirical model using multiple linear regression:
T 2 C y = 77.788 D 10 D 10 14.409 D 10 D 10 + 115.594 Δ α 39.085
where T2Cy is the T2C value predicted based on the NMR experiment. The goodness of fit of this model (Equation (17)) is 0.82, which shows an excellent fitting result. We calculated the T2C values of another group of 4 samples using the model and compared them with the T2C values measured with the experiment to achieve the purpose of model testing. Figure 14 is the cross-plot of the experimental results and the predicted results. The solid line in the figure indicates that the predicted results are equal to the experimental results, and the two dotted lines indicate that the error between the predicted results and the experimental results is within 1 ms. Thus, the model is applicable to predict the T2C values of the samples.
The model can quickly and accurately obtain the T2C value of the samples by relying only on the NMR T2 spectrum without other experimental tests. Combining this method with NMR logging data, one can obtain the T2C value of the reservoir at different depths, which is very beneficial for field applications.

5.3. Well Logs Applications

The case selected in this study was a production well adjacent to Well-B3, named Well-B5. The strata studied was the Kongdian Formation with a depth of 3478 m–4219 m. In this study, the gamma-ray logging, spontaneous potential logging, resistivity logging, acoustic logging, neutron logging, density logging and NMR logging data of Well-B5 were collected.

5.3.1. Expanding to Applications for NMR Logging

To predict the T2C value with the above method, the first necessary step is to investigate whether the NMR logging data have multifractal characteristics. In this study, the NMR logging data at different depths were randomly selected with random sampling, and a total of 10 groups of data were extracted. The multifractal parameter map is shown in Figure 15. To determine whether a group of data has multifractal characteristics, the requirements in Section 4.3 should be satisfied.
As shown in Figure 15, the multifractal parameter atlas of the 10 groups of data meets the above three requirements. The T2 distribution of the NMR logging data has multifractal characteristics, and thus we can introduce the multifractal prediction model of T2C values to field applications.

5.3.2. Model Correction from the Laboratory to the Field

Section 5.2 establishes a model based on the multifractal method to predict the T2C value and verifies its reliability by comparing it with the T2C value obtained with the NMR and centrifugal experiments. However, in practical applications, due to differences in core and NMR logging measurement conditions, there is a certain shape difference between the core NMR T2 spectrum and the NMR logging T2 spectrum. The multifractal parameter is a parameter that reflects the characteristics of the image. Therefore, the model obtained with the laboratory experiment cannot be directly applied to the NMR logging data. Therefore, it is necessary to eliminate the deviation of the laboratory model in the application of actual NMR logging data and to correct the model.
In this study, Well-B5 is a production well drilled recently, and no coring operation was made for this well. Well-B3 is adjacent to Well-B5, and the data show that the physical characteristics of the Kongdian Formation of the two wells are highly consistent. Therefore, 14 cores from Well-B3 were chosen as the replacement in this study.
Figure 16 shows the cross-plot of the T2C calculated directly using the predictive model and the T2C obtained from the laboratory cores using well NMR logging data. It can be seen from the figure that the predicted T2C value is much larger than the T2C value of the core obtained in the laboratory. However, there is a high correlation between them, and the goodness of fit is 0.69. Therefore, an empirical T2C prediction model was built:
T 2 C j = 0.09921 T 2 C y 2.74245
where T2Cj is the corrected T2C value in ms, and T2Cy is the T2C value, directly calculated based on the core evaluation model in ms.

5.3.3. Results of the Case Well

In this section, a case well is used to present the realization of the conversion from theory to field applications. Figure 17 shows the logging interpretation results of the depth of 3495 m–3750 m in Well-B5. As shown in Figure 17, the first trace in the figure is the formation depth, the second to fourth traces are the conventional logging curves, the fifth trace is the NMR logging curve and the sixth trace is the calculated irreducible water saturation.
In the fifth track, the T2 spectral shapes at different depths are different, and the T2 spectrum of the whole formation has no obvious change trend from top to bottom (Figure 17). In the interpreted well sections, there is a unimodal distribution, bimodal distribution and multimodal distribution for the T2 spectral shapes. The red line in the fifth track is the calculated T2C value based on the method discussed above. The results show that the T2C value in the investigated depth is 0.36 ms–60.56 ms. The range of the T2C value is variable by a large degree, which reflects that the coarse clastic rock reservoir has strong heterogeneity at different depths. Based on the T2C values, we also calculated the irreducible water saturations at different depths, which range from 2.6% to 94.4%.
The interpreted results agree well with the production data of this well. For example, at 3530–3573 m, the calculated irreducible water saturations are lowest (Figure 17), and the average daily gas and oil productions are 186018m3 and 135.34m3, respectively, acting as the highest oil/gas productions in the interpreted well intervals. The irreducible water saturation of section 3690–3750 m is high (Figure 17), and the daily amount of oil and gas is very little. The above results indicate that the interpreted results are effective for reservoir evaluations and predicting oil/gas production in the field.
The T2C value is an important parameter used for evaluating reservoir characteristics using NMR techniques. Compared with the conventional fixed T2C value method, the proposed method in this study is effective for predicting T2C values and irreducible water saturation with the purpose of fast formation evaluation, and this method is applicable to interpretations of the whole well section in the field. Thus, this study is significant for improving accurate and fast reservoir evaluations of coarse clastic rock reservoirs in southwestern Bozhong Sag, China. However, much more data or investigations are required to expand the model so that it can be applied to other clastic rock reservoirs in other research areas, due to the lack of research on other regions and different lithologic reservoirs.

6. Conclusions

(1)
The saturated T2 spectra of the coarse clastic rock commonly show bimodal distributions, with measured T2C values of 5.94 ~ 25.53 ms for 14 samples.
(2)
Both the NMR logging T2 spectrum of the Kongdian Formation and the saturated T2 spectrum of the samples have typical multifractal characteristics. The multifractal parameters of the difference (D−qDq), the product (D−q/Dq), and Δα reveal strong correlations with the T2C value.
(3)
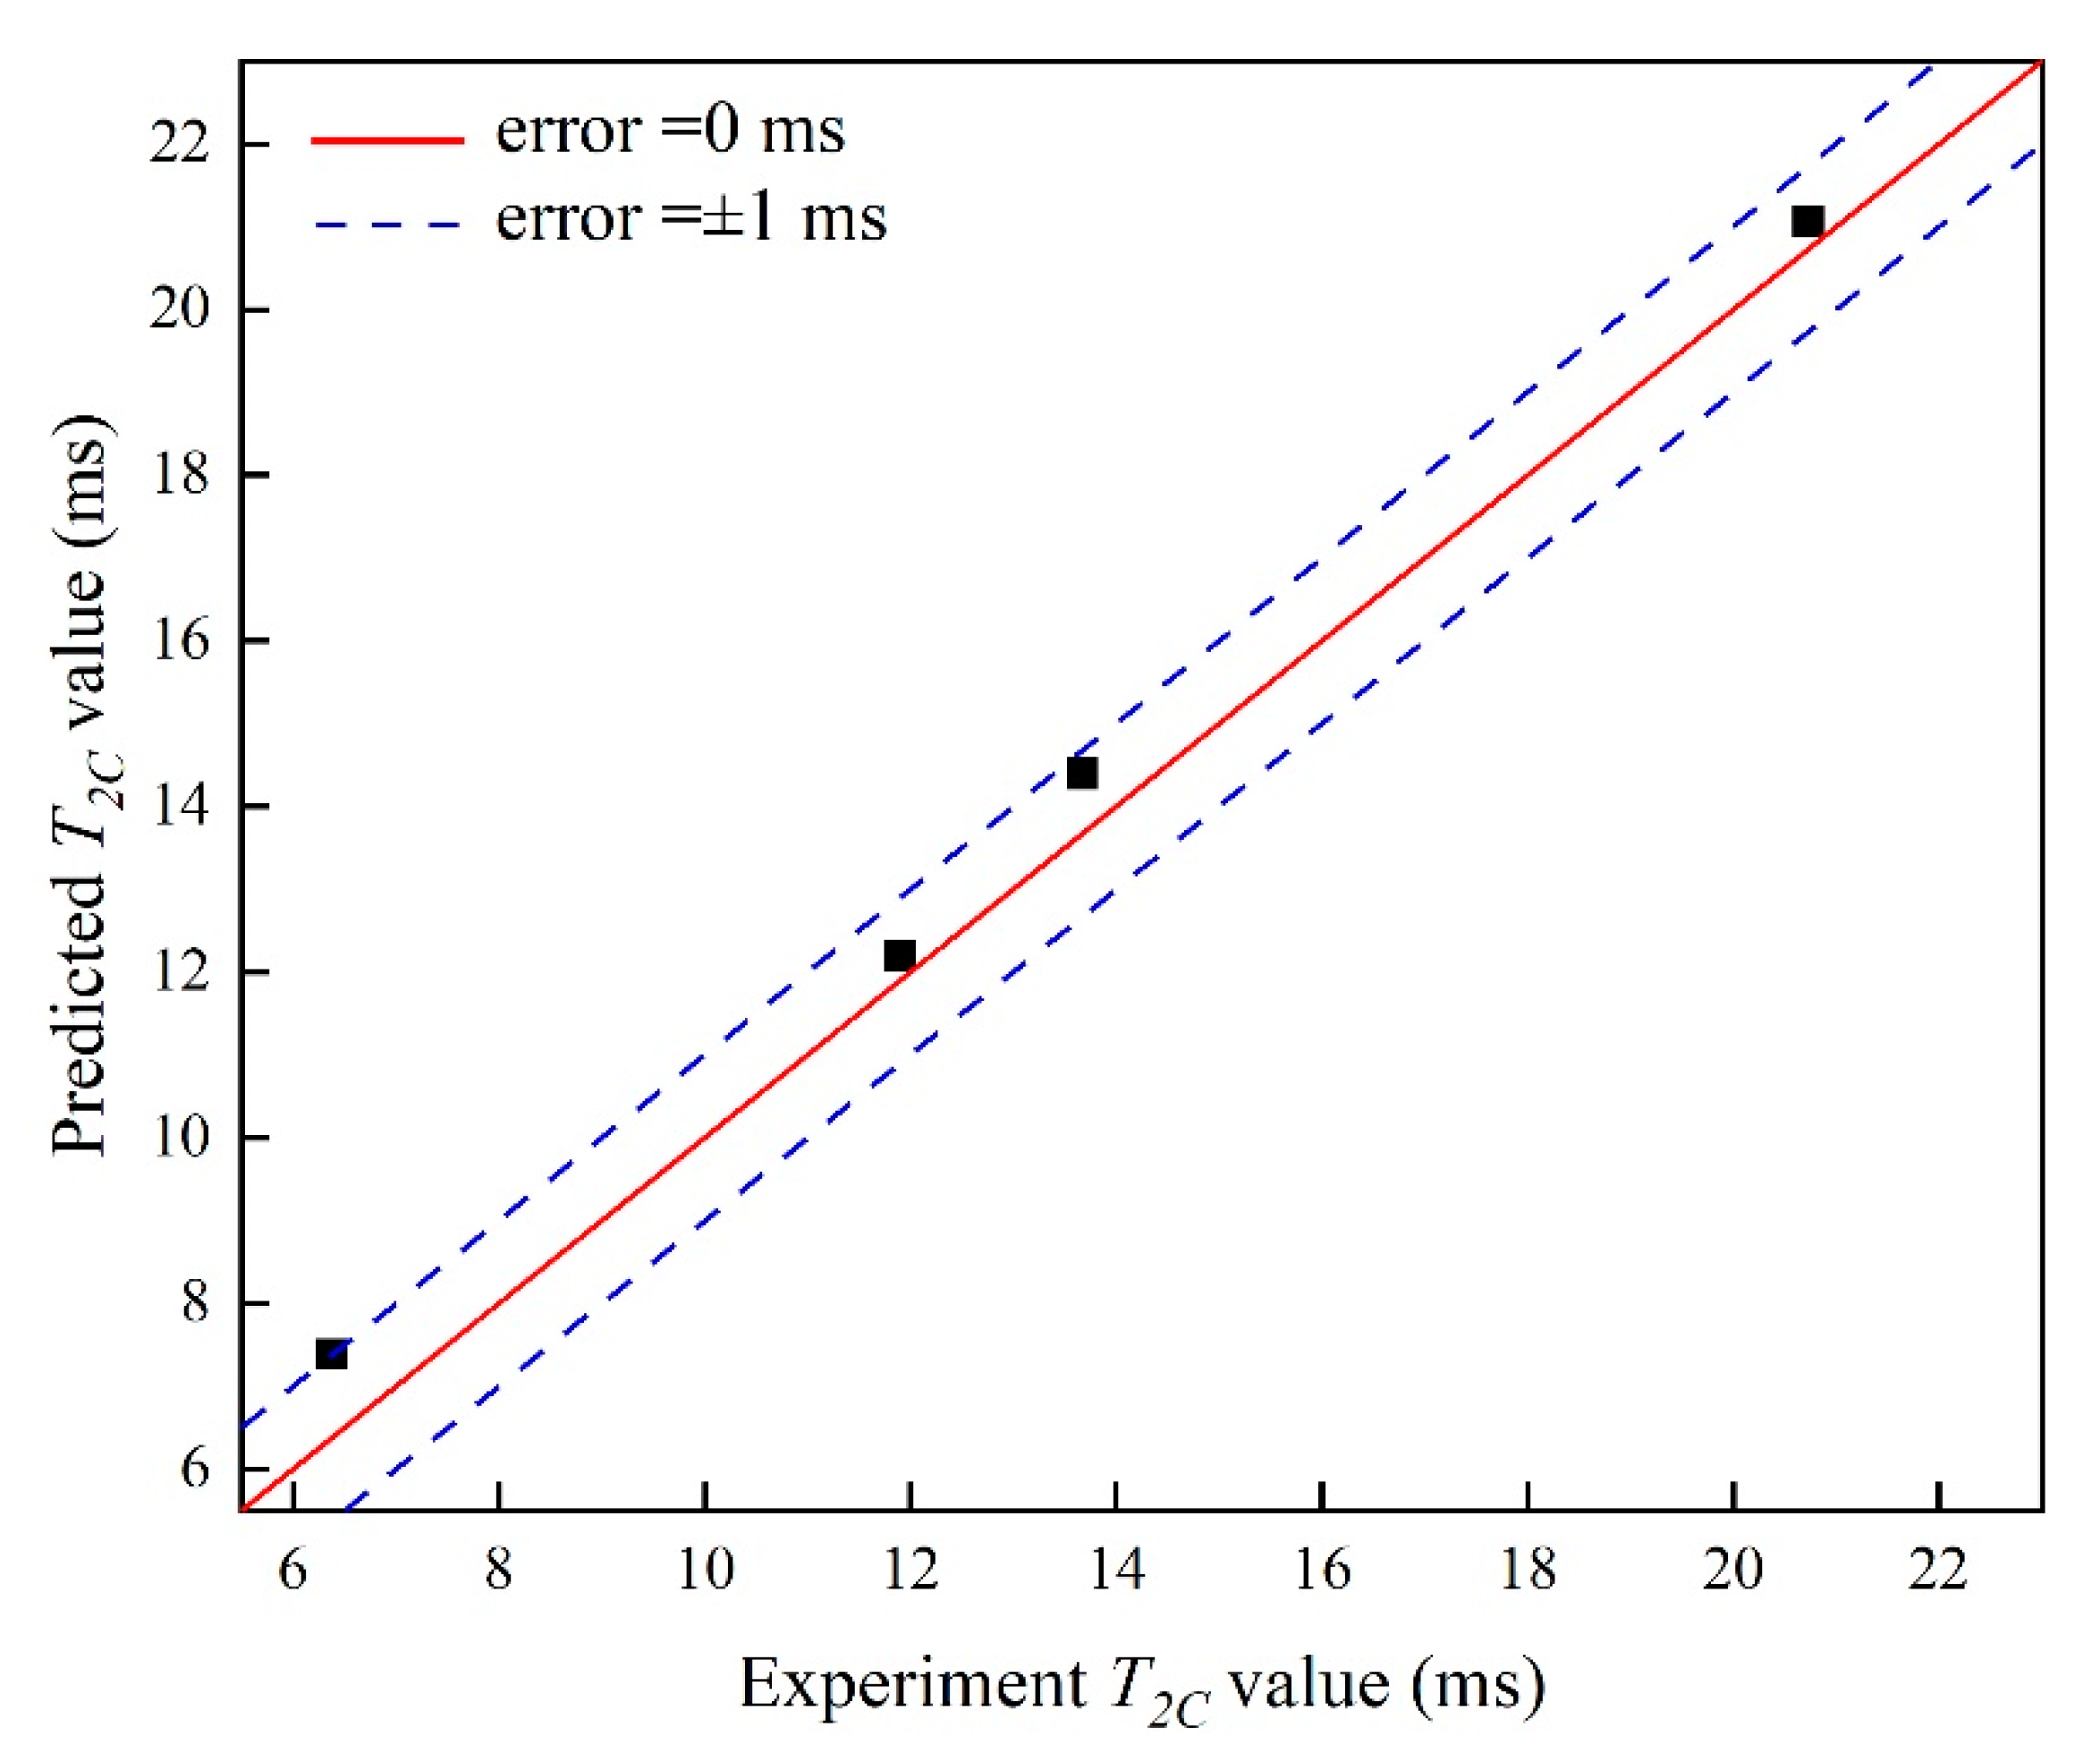
Based on the NMR experiment of 10 samples and multifractal theory, a prediction model for the T2C value was established, which was verified using the experimental results of 4 samples. The error between the predicted results and the experimental data is within 1 ms.
(4)
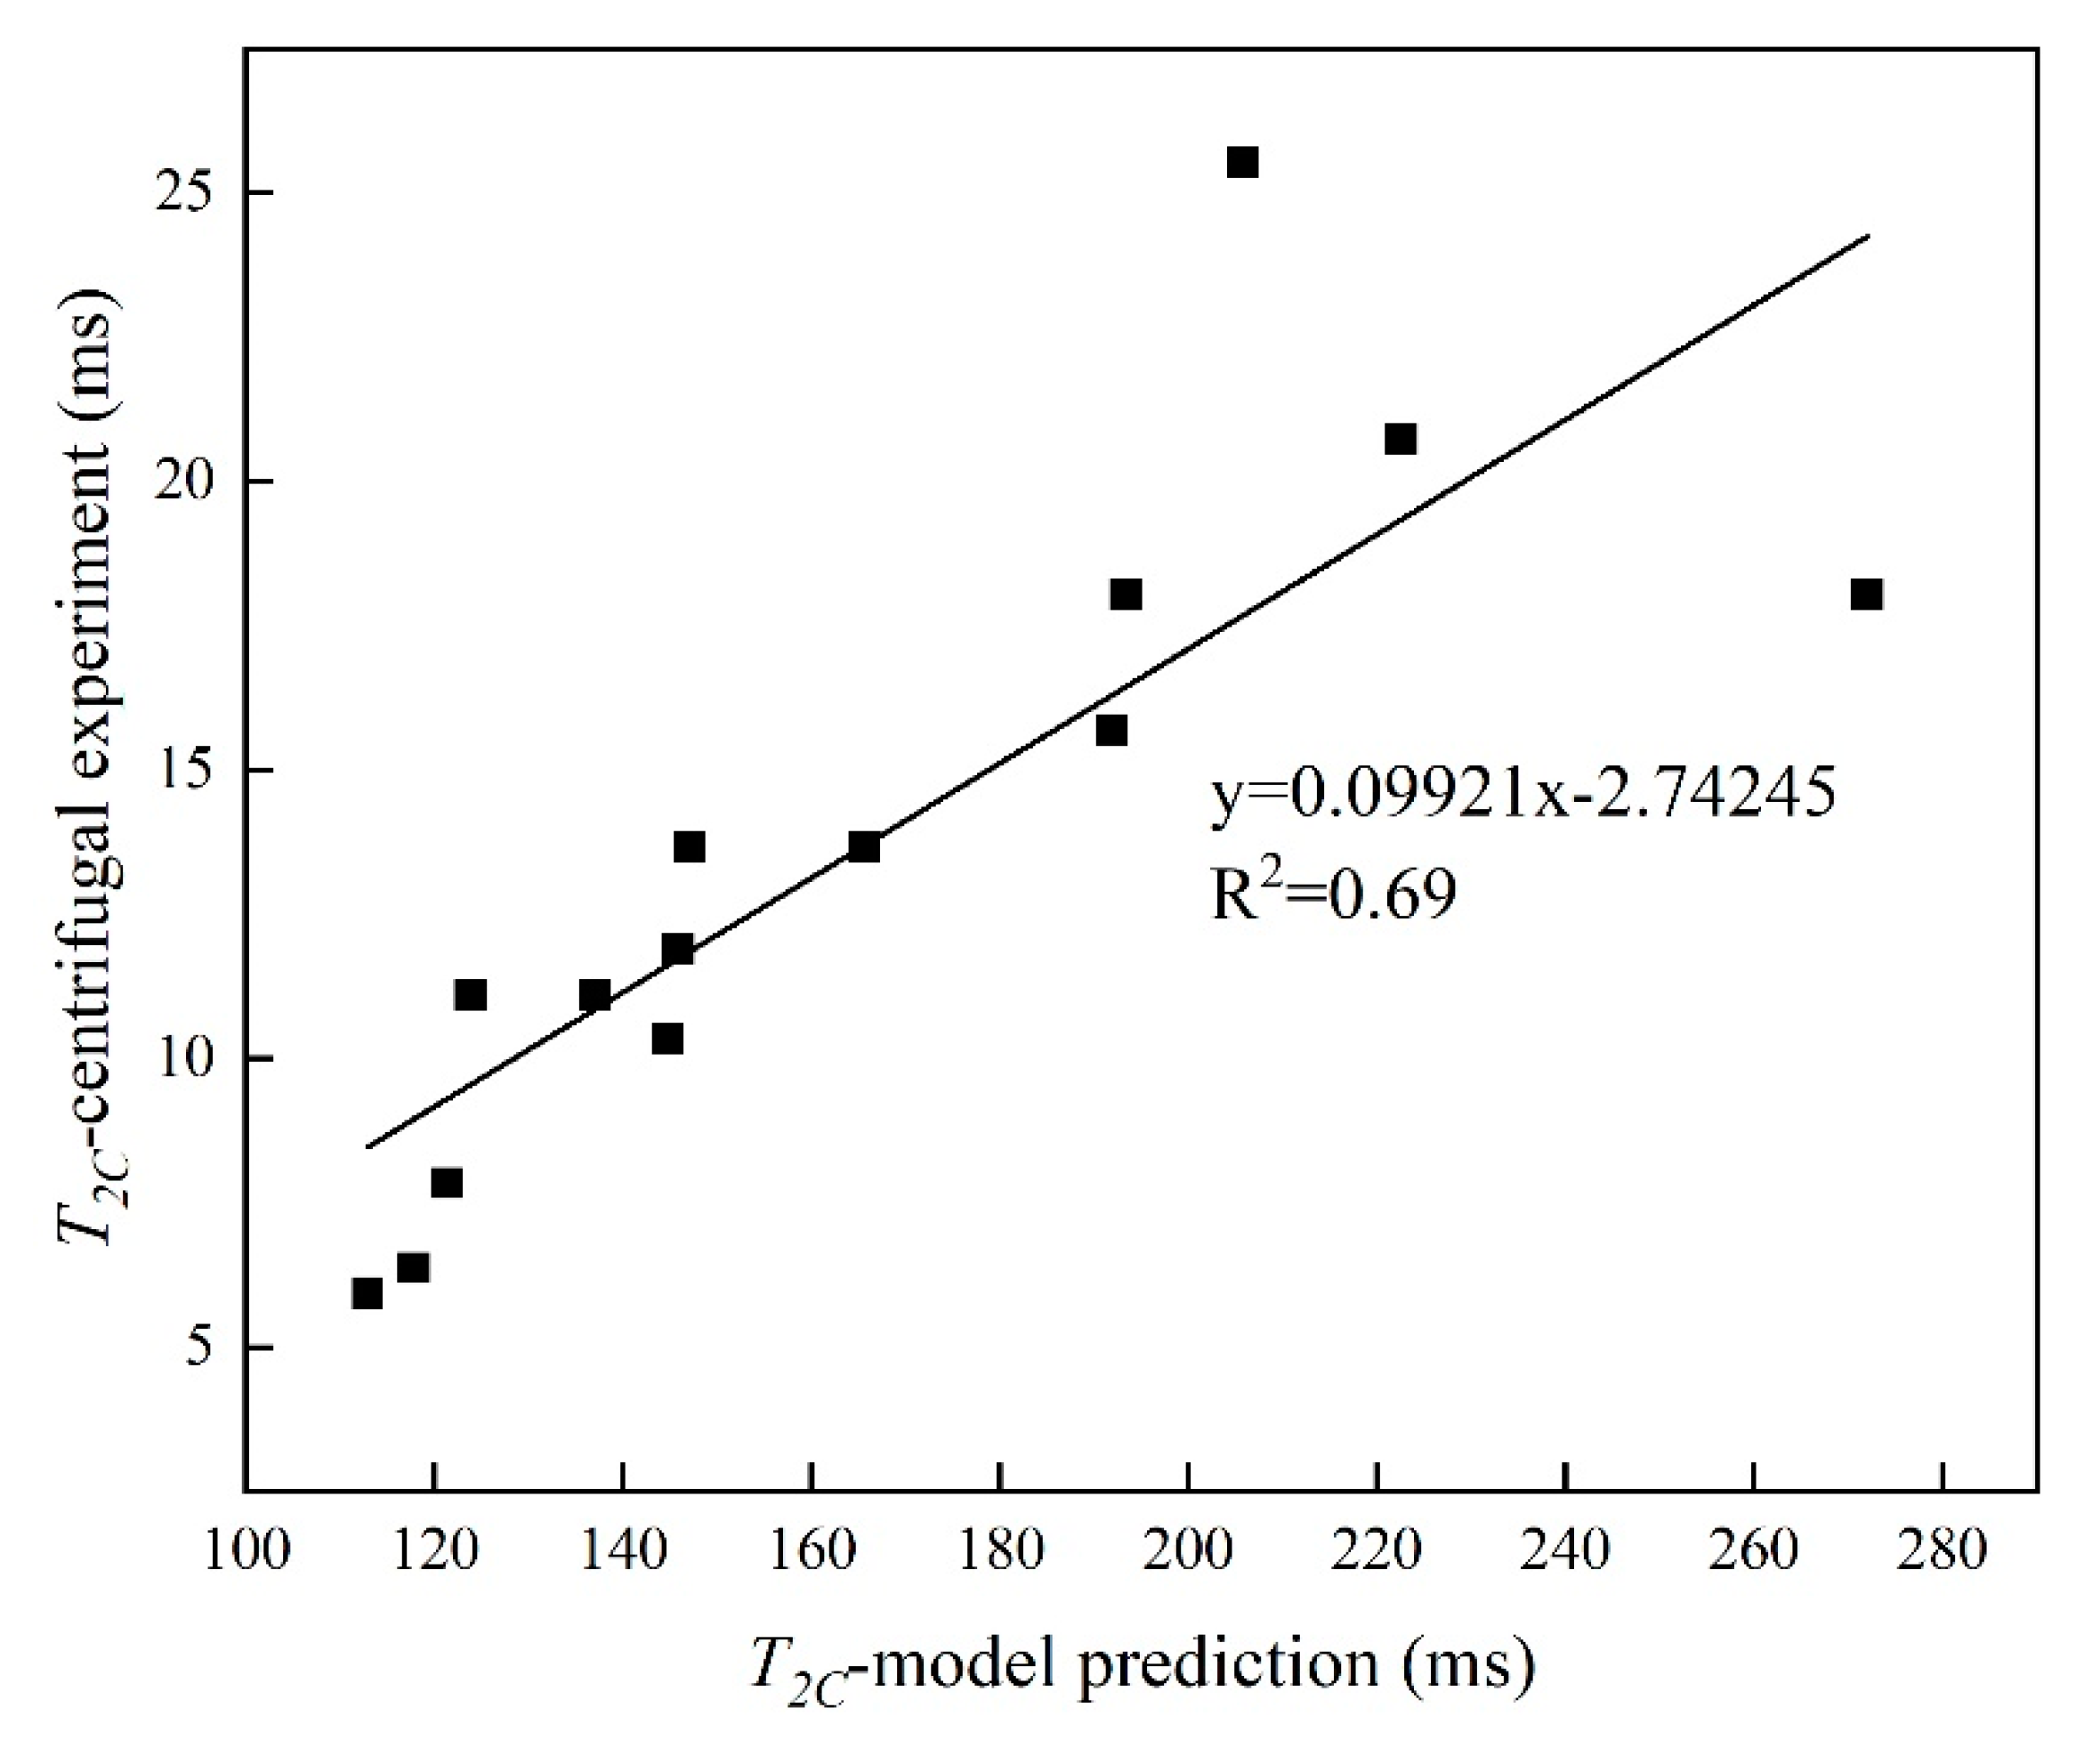
The model built in the laboratory was expanded to be used in the field. The goodness of fit of the new model is 0.69, indicating a good matching degree.
(5)
This method was applied to Well-B5, and a continuous T2C value curve was obtained. The result of the interpretation is consistent with the production data, which indicates that the method is reliable.

Author Contributions

Conceptualization, Y.Y.; methodology, Y.Y. and Z.W.; validation, Z.W.; investigation, Z.W., R.M. and X.Z.; resources, G.Z.; writing—original draft preparation, Z.W.; writing—review and editing, Y.Y.; visualization, Y.Y. and Z.W.; supervision, Y.Y.; project administration and funding acquisition, Y.Y. All authors have read and agreed to the published version of the manuscript.

Funding

This research was funded by the National Natural Science Foundation of China (42125205).

Data Availability Statement

The data is unavailable due to a non-disclosure agreement about partial experimental data and well-logging data from China Oilfield Services Limited (COSL) of CNOOC.

Acknowledgments

This study would not have been possible without the assistance of China Oilfield Services Limited (COSL) of CNOOC, who provided sidewall core samples and well-logging data for this study.

Conflicts of Interest

The authors declare no conflict of interest.

References

  1. Qi, J.; Yang, Q. Cenozoic structural deformation and dynamic processes of the Bohai Bay basin province, China. Mar. Pet. Geol. 2010, 27, 757–771. [Google Scholar] [CrossRef]
  2. Guo, X.; He, S.; Liu, K.; Song, G.; Wang, X.; Shi, Z. Oil generation as the dominant overpressure mechanism in the Cenozoic Dongying depression, Bohai Bay Basin, China. Aapg Bull. 2010, 94, 1859–1881. [Google Scholar] [CrossRef]
  3. Du, X.; Wang, Q.; Zhao, M.; Liu, X. Sedimentary characteristics and mechanism analysis of a large-scale fan delta system in the Paleocene Kongdian Formation, Southwestern Bohai Sea, China. Interpretation 2020, 8, SF81–SF94. [Google Scholar] [CrossRef]
  4. Zeng, L.; Jiang, J.; Yang, Y. Fractures in the low porosity and ultra-low permeability glutenite reservoirs: A case study of the late Eocene Hetaoyuan formation in the Anpeng Oilfield, Nanxiang Basin, China. Mar. Pet. Geol. 2010, 27, 1642–1650. [Google Scholar] [CrossRef]
  5. Zhang, L.; Lu, S.; Xiao, D.; Gu, M. Characterization of full pore size distribution and its significance to macroscopic physical parameters in tight glutenites. J. Nat. Gas Sci. Eng. 2017, 38, 434–449. [Google Scholar] [CrossRef]
  6. Li, L.; Meng, Q.; Wang, S.; Li, G.; Tang, C. A numerical investigation of the hydraulic fracturing behaviour of conglomerate in Glutenite formation. Acta Geotech. 2013, 8, 597–618. [Google Scholar] [CrossRef]
  7. Rui, Z.; Guo, T.; Feng, Q.; Qu, Z.; Qi, N.; Gong, F. Influence of gravel on the propagation pattern of hydraulic fracture in the glutenite reservoir. J. Pet. Sci. Eng. 2018, 165, 627–639. [Google Scholar] [CrossRef]
  8. Tian, W.; Lu, S.; Huang, W.; Wang, S.; Gao, Y.; Wang, W.; Li, J.; Xu, J.; Zhan, Z. Study on the Full-Range Pore Size Distribution and the Movable Oil Distribution in Glutenite. Energy Fuels 2019, 33, 7028–7042. [Google Scholar] [CrossRef]
  9. Ge, X.; Myers, M.T.; Liu, J.; Fan, Y.; Zahid, M.A.; Zhao, J.; Hathon, L. Determining the transverse surface relaxivity of reservoir rocks: A critical review and perspective. Mar. Pet. Geol. 2021, 126, 104934. [Google Scholar] [CrossRef]
  10. Singer, P.M.; Asthagiri, D.; Chapman, W.G.; Hirasaki, G.J. Molecular dynamics simulations of NMR relaxation and diffusion of bulk hydrocarbons and water. J. Magn. Reson. 2017, 277, 15–24. [Google Scholar] [CrossRef]
  11. Singer, P.M.; Chen, Z.; Wang, X.; Hirasaki, G.J. Diffusive coupling in heptane-saturated kerogen isolates evidenced by NMR T-1-T-2 and T-2-T-2 maps. Fuel 2020, 280, 118626. [Google Scholar] [CrossRef]
  12. Zhang, X.; Wei, B.; You, J.; Liu, J.; Wang, D.; Lu, J.; Tong, J. Characterizing pore-level oil mobilization processes in unconventional reservoirs assisted by state-of-the-art nuclear magnetic resonance technique. Energy 2021, 236, 121549. [Google Scholar] [CrossRef]
  13. Ge, X.; Zhao, J.; Zhang, F.; Fan, Y.; Liu, J.; Cai, J.; Nie, S.; Wang, C. A Practical Method to Compensate for the Effect of Echo Spacing on the Shale NMR T-2 Spectrum. Earth Space Sci. 2019, 6, 1489–1497. [Google Scholar] [CrossRef] [Green Version]
  14. Siavashi, J.; Najafi, A.; Sharifi, M.; Fahimpour, J.; Shabani, M.; Liu, B.; Liu, K.; Yan, J.; Ostadhassan, M. An insight into core flooding experiment via NMR imaging and numerical simulation. Fuel 2022, 318, 123589. [Google Scholar] [CrossRef]
  15. Timur, A. Pulsed Nuclear Magnetic Resonance Studies of Porosity, Movable Fluid, and Permeability of Sandstones. J. Pet. Technol. 1969, 21, 775–786. [Google Scholar] [CrossRef]
  16. Gao, H.; Li, H. Determination of movable fluid percentage and movable fluid porosity in ultra-low permeability sandstone using nuclear magnetic resonance (NMR) technique. J. Pet. Sci. Eng. 2015, 133, 258–267. [Google Scholar] [CrossRef]
  17. Liu, Y.; Yao, Y.; Liu, D.; Zheng, S.; Sun, G.; Chang, Y. Shale pore size classification: An NMR fluid typing method. Mar. Pet. Geol. 2018, 96, 591–601. [Google Scholar] [CrossRef]
  18. Oraby, M.; Chafai, N.; Hussing, R.B.; Massengill, D.R.; Pletcher, D. A New NMR Interpretation Technique Using Error Minimization with Variable T2 Cutoff. In Proceedings of the SPE Annual Technical Conference and Exhibition, SPE-38734-MS, San Antonio, TX, USA, 5 October 1997. [Google Scholar]
  19. Godefroy, S.; Fleury, M.; Deflandre, F.; Korb, J.P. Temperature Effect on NMR Surface Relaxation. In Proceedings of the SPE Annual Technical Conference and Exhibition, SPE71700, New Orleans, LA, USA, 30 September 2001. [Google Scholar]
  20. Nicot, B.; Ligneul, P.; Akbar, M. T2 Cutoff Determination Using Magnetic Susceptibility Measurements: U.S. Patent Application. U.S. Patent US20130265043A1, 23 August 2016. [Google Scholar]
  21. Wang, Z.H.; Zhang, C.G.; Xiao, C.W.; Chen, X.L.; Song, F. Experimental Study of T2 cutoff values in low-permeability reservoirs (in Chinese with English abstracts). Prog. Geophys. 2004, 19, 652–655. [Google Scholar]
  22. Parra, J.O.; Hackert, C.L.; Antonio, S.; Collier, T.; Bennet, M. NMR and Acoustic Signatures in Vuggy Carbonate Aquifers. In Proceedings of the SPWLA 42nd Annual Logging Symposium, SPWLA2001-II, Houston, TX, USA, 17 June 2001. [Google Scholar]
  23. Hutchinson, J.E. Fractals and Self Similarity. Indiana Univ. Math. J. 1981, 30, 713–747. [Google Scholar] [CrossRef]
  24. Jiang, F.; Chen, D.; Chen, J.; Li, Q.; Dai, J. Fractal analysis of shale pore structure of continental shale gas reservoir in the Ordos Basin, NW China. Energy Fuels 2016, 30, 4676–4689. [Google Scholar] [CrossRef]
  25. Gould, D.J.; Vadakkan, T.J.; Poché, R.; Dickinson, M.E. Multifractal and Lacunarity Analysis of Microvascular Morphology and Remodeling. Microcirculation 2015, 18, 136–151. [Google Scholar] [CrossRef] [PubMed]
  26. Qu, K.; Guo, S. Investigation of the Pore Structure of Tight Sandstone Based on Multifractal Analysis from NMR Measurement: A Case from the Lower Permian Taiyuan Formation in the Southern North China Basin. Energies 2020, 13, 4067. [Google Scholar] [CrossRef]
  27. Peng, J.; Han, H.; Xia, Q.; Li, B. Evaluation of the pore structure of tight sandstone reservoirs based on multifractal analysis: A case study from the Kepingtage Formation in the Shuntuoguole uplift, Tarim Basin, NW China. J. Geophys. Eng. 2018, 15, 1122–1136. [Google Scholar] [CrossRef] [Green Version]
  28. Kai, J.; Ding, W.L.; Huang, W.H.; Zhang, Y.; Zhao, S. Fractures of lacustrine shale reservoirs, the Zhanhua Depression in the Bohai Bay Basin, eastern China. Mar. Pet. Geol. 2013, 48, 113–123. [Google Scholar] [CrossRef]
  29. Allen, M.B.; Macdonald, D.; Xun, Z.; Vincent, S.J.; Brouet-Menzies, C. Early Cenozoic two-phase extension and late Cenozoic thermal subsidence and inversion of the Bohai Basin, northern China. Mar. Pet. Geol. 1997, 14, 951–972. [Google Scholar] [CrossRef]
  30. Xu, C.; Yu, H.; Wang, J.; Liu, X. Formation conditions and accumulation characteristics of Bozhong 19-6 large condensate gas field in offshore Bohai Bay Basin. Pet. Explor. Dev. 2019, 46, 27–40. [Google Scholar] [CrossRef]
  31. Xu, C.; Du, X.; Zhu, H.; Jia, D.; Xu, W.; Lu, H. Source-to-sink system and its sedimentary records in the continental rift basins: An example from the Paleogene in the Bohai Sea Area, China. Interpretation 2017, 5, ST35–ST51. [Google Scholar] [CrossRef]
  32. Munn, K.; Smith, D.M. A NMR technique for the analysis of pore structure: Numerical inversion of relaxation measurements. J. Colloid Interface Sci. 1987, 119, 117–126. [Google Scholar] [CrossRef]
  33. Yao, Y.; Liu, D.; Che, Y.; Tang, D.; Tang, S.; Huang, W. Petrophysical characterization of coals by low-field nuclear magnetic resonance (NMR). Fuel 2010, 89, 1371–1380. [Google Scholar] [CrossRef]
  34. Daigle, H.; Thomas, B.; Rowe, H.; Nieto, M. Nuclear magnetic resonance characterization of shallow marine sediments from the Nankai Trough, Integrated Ocean Drilling Program Expedition 333. J. Geophys. Res. Solid Earth 2014, 119, 2631–2650. [Google Scholar] [CrossRef]
  35. Kenyon, W. Petrophysical principles of applications of NMR logging. Log Anal. 1997, 38, SPWLA-1997-v38n2a4. [Google Scholar]
  36. Morriss, C.; Rossini, D.; Straley, C.; Tutunjian, P.; Vinegar, H. Core analysis by low-field NMR. Log Anal. 1997, 38, SPWLA-1997-v38n2a3. [Google Scholar]
  37. Martínez, F.; Martín, M.; Caniego, F.J.; Tuller, M.; Guber, A.; Pachepsky, Y.; García-Gutiérrez, C. Multifractal analysis of discretized X-ray CT images for the characterization of soil macropore structures. Geoderma 2010, 156, 32–42. [Google Scholar] [CrossRef]
  38. Liu, K.; Ostadhassan, M.; Zou, J.; Gentzis, T.; Rezaee, R.; Bubach, B.; Carvajal-Ortiz, H. Multifractal analysis of gas adsorption isotherms for pore structure characterization of the Bakken Shale. Fuel 2018, 219, 296–311. [Google Scholar] [CrossRef] [Green Version]
  39. Tarquis, A.; Giménez, D.; Saa, A.; Díaz, M.; Gascó, J.; Pachepsky, J.; Radcliffe, D.; Selim, H. Scaling and multiscaling of soil pore systems determined by image analysis. Scaling Methods Soil Phys. 2003, 19, 24–34. [Google Scholar]
  40. Halsey, T.C.; Jensen, M.H.; Kadanoff, L.P.; Procaccia, I.; Shraiman, B.I. Fractal measures and their singularities: The characterization of strange sets. Phys. Rev. A 1986, 33, 1141. [Google Scholar] [CrossRef]
  41. Chhabra, A.; Jensen, R.V. Direct determination of the f (α) singularity spectrum. Phys. Rev. Lett. 1989, 62, 1327. [Google Scholar] [CrossRef]
  42. Zheng, S.; Yao, Y.; Liu, D.; Cai, Y.; Liu, Y.; Li, X. Nuclear magnetic resonance T2 cutoffs of coals: A novel method by multifractal analysis theory. Fuel 2019, 241, 715–724. [Google Scholar] [CrossRef]
  43. Hou, X.; Zhu, Y.; Chen, S.; Wang, Y.; Liu, Y. Investigation on pore structure and multifractal of tight sandstone reservoirs in coal bearing strata using LF-NMR measurements. J. Pet. Sci. Eng. 2020, 187, 106757. [Google Scholar] [CrossRef]
  44. Gouyet, J.-F. Physics and Fractal Structures; Elsevier Masson: Amsterdam, The Netherlands, 1996. [Google Scholar]
  45. Yao, Y.; Sun, X.; Zheng, S.; Wu, H.; Zhang, C.; Liu, Y.; Chang, Y. Methods for petrological and petrophysical characterization of gas shales. Energy Fuels 2021, 35, 11061–11088. [Google Scholar] [CrossRef]
  46. Sun, Y.; Zhai, C.; Zhao, Y.; Xu, J.; Cong, Y.; Zheng, Y.; Tang, W. Multifractal Analysis and Neural Network Prediction of Pore Structures in Coal Reservoirs Based on NMR T2 Spectra. Energy Fuels 2021, 35, 11306–11318. [Google Scholar] [CrossRef]
  47. Liu, K.; Ostadhassan, M.; Kong, L. Fractal and Multifractal Characteristics of Pore Throats in the Bakken Shale. Transp. Porous Media 2018, 126, 579–598. [Google Scholar] [CrossRef]
  48. Caniego, F.J.; Martin, M.A.; San Jose, F. Singularity features of pore-size soil distribution: Singularity strength analysis and entropy spectrum. Fractals-Complex Geom. Patterns Scaling Nat. Soc. 2001, 9, 305–316. [Google Scholar] [CrossRef]
  49. Zhao, P.; Wang, X.; Cai, J.; Luo, M.; Zhang, J.; Liu, Y.; Rabiei, M.; Li, C. Multifractal analysis of pore structure of Middle Bakken formation using low temperature N-2 adsorption and NMR measurements. J. Pet. Sci. Eng. 2019, 176, 312–320. [Google Scholar] [CrossRef]
  50. Ge, X.; Fan, Y.; Zhu, X.; Chen, Y.; Li, R. Determination of nuclear magnetic resonance T2 cutoff value based on multifractal theory—An application in sandstone with complex pore structure. Geophysics 2014, 80, D11–D21. [Google Scholar] [CrossRef]
  51. Hu, Y.; Guo, Y.; Zhang, J.; Shangguan, J.; Li, M.; Quan, F.; Li, G. A method to determine nuclear magnetic resonance T2 cutoff value of tight sandstone reservoir based on multifractal analysis. Energy Sci. Eng. 2020, 8, 1135–1148. [Google Scholar] [CrossRef] [Green Version]
  52. Zhao, Y.; Lin, B.; Liu, T.; Zheng, Y.; Sun, Y.; Zhang, G.; Li, Q. Multifractal analysis of coal pore structure based on NMR experiment: A new method for predicting T2 cutoff value. Fuel 2021, 283, 119338. [Google Scholar] [CrossRef]
Figure 1. Study area of the Bozhong 19-6 area in the Bozhong Sag.
Fractalfract 07 00057 g001
Figure 2. Stratigraphic column of Bohai Bay Basin showing the lithologies and the source–reservoir–cap combinations. The study interval is the Paleocene Kongdian Formation.
Fractalfract 07 00057 g002
Figure 3. Ternary diagram shows the compositions of quartz, feldspar and debris of the samples.
Fractalfract 07 00057 g003
Figure 4. SEM and pore-casted thin section analyses of Well-B3: (a) Potassium feldspar dissolution, intragranular pore development, 3853.55 m. (b) Intergranular pores between potassium feldspar particles, 3855.06 m. (c) Calcite dissolution forms microfracture, 3855.76 m. (d) Autogenic quartz filling intergranular pores, 3854.62 m. (e) Gravel structure, debris particles are mostly sub-circular–sub-angular, development of dissolution pores and microfracture, 3853.29 m. (f) Development of inter grain dissolved pores and intergranular dissolved pores, 4049.87 m.
Fractalfract 07 00057 g004
Figure 5. Correlations of helium porosity vs. NMR porosity and water porosity.
Fractalfract 07 00057 g005
Figure 6. Correlations of permeability vs. helium porosity, NMR porosity and water porosity.
Fractalfract 07 00057 g006
Figure 7. NMR T2 distributions of the samples at 100% water saturation and under irreducible water conditions.
Fractalfract 07 00057 g007
Figure 8. Relationship between τ(q) and q (samples of solid lines used to establish the model, samples of dotted line used to verify the model).
Fractalfract 07 00057 g008
Figure 9. Relationship between f(a) and a (samples of solid lines used to establish the model, samples of dotted line used to verify the model).
Fractalfract 07 00057 g009
Figure 10. Relationship between Dq and q (samples of solid lines were used to establish the model, samples of dotted lines were used to verify the model).
Fractalfract 07 00057 g010
Figure 11. Relationship between T2C and multifractal dimension (Dq) of the ten modeling samples. Note that q was chosen as −10, −2, −1, 1, 2, and 10.
Fractalfract 07 00057 g011
Figure 12. Relationship between T2C and multifractal dimension of the ten modeling samples: (a) Relationship between T2C and D−qDq. (b) Relationship between T2C and D−q/Dq.
Fractalfract 07 00057 g012
Figure 13. Relationship between T2C and Δα of the ten modeling samples.
Fractalfract 07 00057 g013
Figure 14. Cross-plot of experimental results and predicted results.
Fractalfract 07 00057 g014
Figure 15. NMR logging multifractal parameter atlas: (a) Relationship between τ(q) and q. (b) Relationship between f(α) and α; (c) Relationship between Dq and q.
Fractalfract 07 00057 g015
Figure 16. Cross-plot of the model’s prediction of T2C and centrifugal experiment’s T2C.
Fractalfract 07 00057 g016
Figure 17. Logging diagram of Well-B5 in Bozhong Sag.
Fractalfract 07 00057 g017
Table 1. Petrophysical properties of selected coarse clastic rock samples.
Sample IDDepth
(m)
Φ-Helium
(%)
Φ-Water
(%)
Φ-NMR
(%)
Permeability
(mD)
T2C
(ms)
Swiir
(%)
#13853.1597.67.73.5913.6741.40
#23853.2711.410.1101.48 18.0442.60
#33853.979.58.58.74.05 15.7038.30
#43854.8511.39.49.23.00 11.1032.80
#53855.719.27.27.51.7210.3540.20
#63856.329.97.97.63.1520.7340.80
#73857.219.78.78.64.4611.1037.30
#84047.459.65.75.51.836.3736.30
#94048.154.74.34.32.285.94 58.10
#104048.815.44.64.60.4711.9060.40
#114050.467.15.960.9113.6749.70
#124052.79.17.882.2225.5342.80
#134054.647.56.26.21.977.8440.70
#144054.777.45.05.21.3318.0442.50
Notes: Swiir is irreducible water saturation.
Disclaimer/Publisher’s Note: The statements, opinions and data contained in all publications are solely those of the individual author(s) and contributor(s) and not of MDPI and/or the editor(s). MDPI and/or the editor(s) disclaim responsibility for any injury to people or property resulting from any ideas, methods, instructions or products referred to in the content.

