Abstract
Rock permeability, defined as the ability of fluid to flow through the rocks, is one of the most important properties of rock. Many researchers have developed models to predict the permeability of rock from the porosity and pore size based on the mercury intrusion. However, these existing models still have some limitations. In this study, based on data regarding the fractal nature of the mercury intrusion of the rocks, we built a new model to predict the permeability of the rocks. In order to verify the new model, we extracted data regarding different kinds of samples from the literature and estimated the permeability using the new model. The results showed that the model could predict various types of rocks, such as tight sandstone, carbonates, and shale. The comparison of the calculated permeability using the new model is closer to the measured value than the value estimated from the existing models, indicating that the new model is better in predicting the permeability of rock samples.
1. Introduction
Rock permeability, quantifying the fluid flow through porous rocks, is one of the most important rock properties and is correlated with rock type, porosity, pore throat size, pore shape, and pore connections [1]. Understanding the permeability data is essential for production forecasting and also for the operational performance of the enhanced oil recovery. For the permeability measurements, three experimental methods are now used, including the steady method, the unsteady method, and the alternative experimental method [2]. For low-permeability rocks, such as shale or tight sandstone, the measurement of their low permeability is very time consuming and costly. In order to save time in the experiments, many researchers have made full use of the known data of samples and then built permeability estimation models [3,4,5,6,7]. The accurate estimation of the permeability is crucial for the reservoir development design.
Mercury injection saturation data to estimate rock permeability have been used for around 40 years, and the models based on these data can be divided into two groups: (1) permeability estimation models based on the porosity and the pore throat size data [3,4,5,6,7,8,9,10]; and (2) fractal permeability models, which are based on the Kozeny–Carman equation and the grain-packing model [11]. Recently, new models for the prediction of permeability based on geometric microstructure characteristics have been derived, e.g., in [12,13]. However, these models all have certain limitations. For the models belonging to group 1, all the existing models use only one aperture value, at a critical mercury saturation, as the input to predict the permeability. However, the single aperture value sometimes cannot represent the entire pore structure of the rock, especially if the pore structure of the rock is very complex and heterogeneous, as in the case of tight sandstone and shale. In addition, finding the suitable critical aperture for the specific rocks to estimate the permeability is very challenging. Winland used the aperture at a mercury saturation of 35% to estimate his samples (mixed carbonates and sandstones) in 1980 [3], while Pittman (1992) found that r20 (the aperture at the 20% saturation volume) and r25 (the aperture at the 20% saturation volume) produced good results in sandstones [4]. Rezaee et al. (2006, 2012) found that r50 (the aperture at the 50% saturation volume) and r10 (the aperture at the 10% saturation volume) were the best permeability predictors for carbonate and tight sandstone, respectively [5,6]. Ngo et al. (2015, 2018) found that r55 (the aperture at the 55% saturation volume) and r20 were useful for the prediction of the permeability of sandstones and carbonate rocks, respectively [8,9]. Wang et al. (2018) analyzed 17 sandstone samples and found that r5 (the aperture at the 5% saturation) can be used for permeability estimations [14]. Recently, we built a model to predict the permeability of rock by considering the full pore size distribution, producing better prediction results in the case of the carbonate and shale samples compared with models based on a single aperture [15]. However, in our previous model, an aperture value which represents the transition zone is still required, and this aperture value depends on the rock type. The abovementioned studies led us to the question: which aperture value should be used to estimate the permeability in our model? For the models in group 2, the difficulty in determining the tortuosity and the real average grain radius limits the application of these models [16,17,18,19,20]. The shortcomings of these existing models are very difficult to solve. In this study, a new model, which is based on the fractal theory, is proposed, which can solve the limitations of the exiting models, showing excellent application potential in real contexts. We applied the fractal theory to build our new permeability estimation model and verified our model based on a wealth of published data from the literature. The new model does not require the identification of the critical aperture, the tortuosity, and the real average grain radius as the inputs, and can be used to predict the permeability of different kinds of rocks, such as carbonates, sandstone, and shale.
2. Model Built in the Study
The fractal theory is a powerful tool for characterizing the complexity of the pore structures in rock. The correlation between the pore number and pore radius can be described with the fractal theory as follows [16]:
where r is the pore radius, N is the total number of pores with a pore size larger than r, and D is the fractal dimension.
Based on the power law function [3,4,5,6,7,8,9,10,17], we replaced the critical aperture value in the equations of earlier studies and built the new model:
where k is the air permeability, D1 is the fractal dimension, and φ is the porosity. b0, b1, and b2 are the fitting coefficients.
For the fractal dimension analysis of the high-pressure mercury intrusion, six different fractal models have been proposed in the literature and are summarized in Table 1 [10]. Finding the suitable fractal model for the permeability estimation was the next question to address. We used the data based on tight sandstones that were published by Wang et al. (2018) [10]. The fractal dimensions from the different models of these samples were calculated and are summarized in Table 2. For the other five fractal models, only one fractal dimension value could be derived, while for Model 3, two fractal dimensions Df3s and Df3l were required (Df3s refers to the fractal dimensions of the small pores, while Df3l denotes the fractal dimensions of the large pores).

Table 1.
The existing models for the mercury intrusion method.

Table 2.
The information about the tight sandstones.
Once the fractal dimensions of each fractal model are known, the unknown parameters in Equation (2) can be calculated from the curve fitting by using the partial least square regression method. Note that Equation (2) is only useful for five of the models, excluding Model 3. For Model 3, which has two fractal dimension values, the unknown parameters should be calculated by using the following equation:
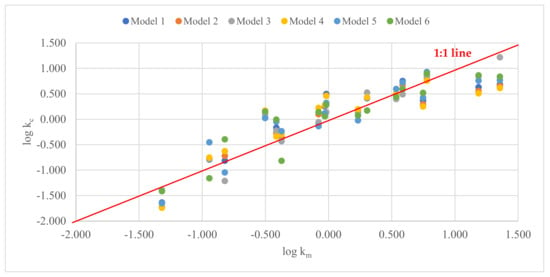
After we derived the unknown values of the parameters for each model (Equation (3) for Model 3 while Equation (2) for other 5 models), we calculated the permeability of these samples and compared the results with the measured permeability. The calculated permeability based on all the models was very close to the measured permeability (all the data points were distributed around the 1:1 line), indicating that the fractal model can be used to estimate the permeability of tight sandstones (Figure 1). The detailed comparison of the correlations between the calculated and the measured permeability values of each model in Table 3 shows that the calculated permeability from Model 3 was closer to the measured permeability than the calculated values based on the other models. The fractal dimensions of Model 3 reflect the information about the pore size distribution [10]. Applying the fractal dimensions of Model 3 could lead to a better permeability estimation, showing that permeability has a strong correlation with the pore size distribution, a finding that is in line with the observations of other researchers [3,4,5,6].

Figure 1.
The comparison of the calculated permeability values using different fractal models and the measured permeability.

Table 3.
Comparison of the different fractal models.
3. Model Comparison and Verification
In this part of the study, we attempted to test whether this new model could be used for the permeability estimation of shale samples. Eight Shale samples were derived from the shale reservoir in the Songliao Basin, China. The basic information about these shale samples, such as their permeability, porosity, and the fractal dimensions based on Model 3, are summarized in Table 4.

Table 4.
The basic information about the shale samples in this study.
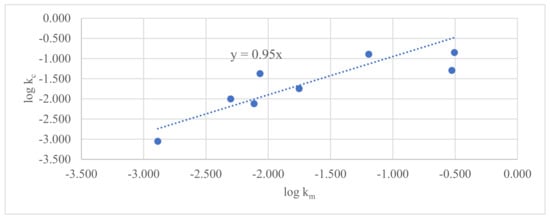
Based on Equation (3), the permeability of the shale samples was calculated and compared with the measured permeability. Figure 2 shows that the calculated permeability was around 0.95 times the measured permeability value, indicating that this new model could be used to predict the permeability of shale samples.

Figure 2.
The comparison of the calculated permeability values of different models (shale).
4. Other Rock Case Studies
4.1. Sandstone
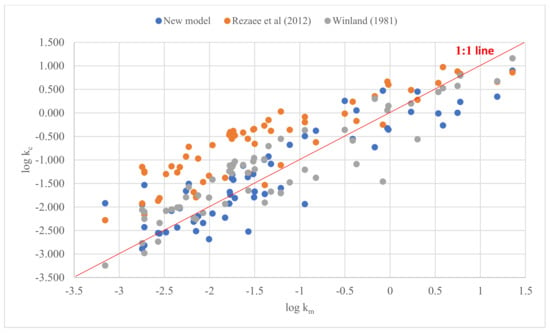
A total of 42 sandstone samples were selected from the Kelasu thrust belt in the Kuqa depression of the Tarim Basin. These sandstones were fine- to coarse-grained sandstones with a low porosity, low permeability, and strong heterogeneity. The mercury injection experimental data of these samples was published by Lai and Wang (2015) [17]. We estimated their permeability using Equation (3) and compared the results with the measured permeability, and the correlations between each are shown in Figure 3 (42 sandstones from the Kupa depression and 17 from Section 2). The calculated permeability (y axis) using the new model was very close to the measured permeability (x axis). We further compared the results using the new model in this study and the existing models proposed by Rezaee et al. (2012) [6] and Winland (1981) [3]. The results in Figure 3 and Table 5 show that the permeability predicted from the fractal model was closer to the measured permeability than the predicted permeability using the other models.

Figure 3.
The comparison of the calculated permeability values of different models.

Table 5.
Comparison of the different fractal models (tight sandstone).
4.2. Carbonates
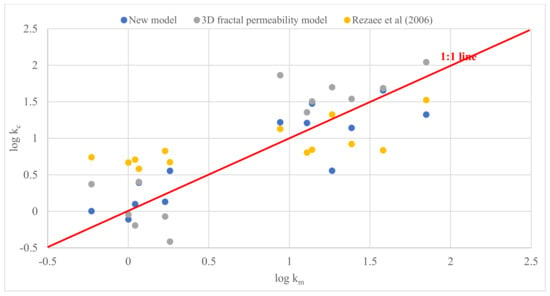
A total of 13 carbonate samples, which were analyzed and published by Wang et al. (2018) [14], were chosen for the model verification. The permeability of these 13 samples varied from 0.591 mD to 70.556 mD, and the porosity value ranged between 12.49% and 20.06%. Similarly, we applied Equation (3) to calculate the permeability of these carbonates and then compared the results with the measured permeability. Figure 3 shows that the calculated permeability was very close to the measured permeability. We also employed the 3D fractal permeability model by Pape et al. (2000) [11] and the model provided by Rezaee et al. (2006) [5] to estimate the permeability of the samples and compared the results with the results calculated from the new model. Figure 4 and Table 6 show that the calculated permeability using our model was closer to the measured permeability than the permeability based on the other models.

Figure 4.
The comparison of the calculated permeability values of different models (carbonates).

Table 6.
Comparison of the different fractal models (carbonates).
5. Discussion
In this study, we proposed a fractal model to predict the permeability of rocks. The case studies showed that using the fractal dimension as the input parameter is better for predicting permeability than using a single aperture value. The potential reason for this may be that the single radius represents the pore sizes of rock samples with simple pore structures but cannot well describe samples with complicated pore structures. The fractal dimension may represent the whole pore size distribution, based on the mercury intrusion data, which can better reflect the information about the pore size distribution than the single aperture, thus predicting more accurate permeability values. From this study, we can observe that even Equation (3) can be used for predicting the permeability of tight sandstone, carbonates, and shale, though the fitting parameters of different rocks are not the same. In this study, the equations for predicting these three different rocks are:
where Equations (4)–(6) refer to tight sandstone, carbonate and shale, respectively. One aspect that we must emphasize regarding the above equations is that these equations are based on a limited number of samples, and the fitting parameters could vary if the number of the sample were to be increased. However, for the limited number of samples used in this study, the fractal model showed a good permeability estimation ability.
6. Conclusions
In this study, based on the mercury intrusion data, we proposed the fractal model for predicting the permeability of rock samples and verified our new model by using data from three kinds of rocks. The main findings are as follows: (1) The fractal dimensions from the mercury intrusion can be used for the estimation of the permeability of rock samples. Fractal dimensions from Model 3 can better estimate the permeability of the samples than the fractal dimensions calculated from other fractal models. (2) The new model can predict the permeability of sandstones, carbonates, and shale samples. (3) The new model proposed in this study does require the identification of the critical aperture, the tortuosity, or the real average grain radius, which are the essential input parameters for other models. The calculated permeability based on the new model was close to the measured values.
Author Contributions
K.L. is responsible for the data analysis and manuscript writing; M.O. is responsible for the paper’s organization and language improvements. All authors have read and agreed to the published version of the manuscript.
Funding
This research was funded by the National Natural Science Foundation of China (42090020,42090025).
Institutional Review Board Statement
Not applicable.
Informed Consent Statement
Not applicable.
Data Availability Statement
The data are available from the corresponding author upon request.
Acknowledgments
The authors appreciate the time and effort of the reviewers, who provided valuable comments and suggestions on how to improve the quality of this manuscript.
Conflicts of Interest
The authors declare no conflict of interest.
References
- Ling, K. Correlation between rock permeability and formation resistivity factor-a rigorous and theoretical derivation. In Proceedings of the SPE Middle East Unconventional Gas Conference and Exhibition Society of Petroleum Engineers, Abu Dhabi, United Arab Emirates, 23–25 January 2012. [Google Scholar]
- Sander, R.; Pan, Z.; Connell, L.D. Laboratory measurement of low permeability unconventional gas reservoir rocks: A review of experimental methods. J. Nat. Gas Sci. Eng. 2017, 37, 248–279. [Google Scholar] [CrossRef]
- Kolodzie, S. Analysis of pore throat size and use of the Waxman-Smits equation to determine OOIP in Spindle field, Colorado. In Proceedings of the SPE Annual Technical Conference and Exhibition, Dallas, TX, USA, 21–24 September 1980; p. SPE-9382-MS. [Google Scholar]
- Pittman, E.D. Relationship of porosity and permeability to various parameters derived from mercury injection-capillary pressure curves for sandstone. AAPG Bull. 1992, 76, 191–198. [Google Scholar]
- Rezaee, M.R.; Jafari, A.; Kazemzadeh, E. Relationships between permeability, porosity and pore throat size in carbonate rocks using regression analysis and neural networks. J. Geophys. Eng. 2006, 3, 370–376. [Google Scholar] [CrossRef]
- Rezaee, R.; Saeedi, A.; Clennell, B. Tight gas sands permeability estimation from mercury injection capillary pressure and nuclear magnetic resonance data. J. Pet. Sci. Eng. 2012, 88, 92–99. [Google Scholar] [CrossRef] [Green Version]
- Wu, S.; Yu, C.; Hu, X.; Yu, Z.; Jiang, X. Characterization of mineral and pore evolution under CO2-brine-rock interaction at in-situ conditions. Adv. Geo-Energy Res. 2022, 6, 177–178. [Google Scholar] [CrossRef]
- Ngo, V.T.; Lu, V.D.; Nguyen, M.H.; Hoang, T.M.; Nguyen, H.M.; Le, V.M. A comparison of permeability prediction methods using core analysis data. In Proceedings of the SPE Reservoir Characterization and Simulation Conference and Exhibition, Abu Dhabi, United Arab Emirates, 14–16 September 2015; Society of Petroleum Engineers: Richardson, TX, USA, 2015. [Google Scholar]
- Ngo, V.T.; Lu, V.D.; Le, V.M. A comparison of permeability prediction methods using core analysis data for sandstone and carbonate reservoirs. Geomech. Geophys. Geo-Energy Geo-Resour. 2018, 4, 129–139. [Google Scholar] [CrossRef]
- Wang, F.; Jiao, L.; Liu, Z.; Tan, X.; Wang, C.; Gao, J. Fractal analysis of pore structures in low permeability sandstones using mercury intrusion porosimetry. J. Porous Media 2018, 21, 1097–1119. [Google Scholar] [CrossRef]
- Pape, H.; Clauser, C.; Iffland, J. Variation of Permeability with Porosity in Sandstone Diagenesis Interpreted with a Fractal Pore Space Model. Pure Appl. Geophys. 2000, 157, 603–619. [Google Scholar] [CrossRef]
- Röding, M.; Ma, Z.; Torquato, S. Predicting permeability via statistical learning on higher-order microstructural information. Sci. Rep. 2020, 10, 15239. [Google Scholar] [CrossRef] [PubMed]
- Neumann, M.; Stenzel, O.; Willot, F.; Holzer, L.; Schmidt, V. Quantifying the influence of microstructure on effective conductivity and permeability: Virtual materials testing. Int. J. Solid Struct. 2020, 184, 211–220. [Google Scholar] [CrossRef]
- Wang, F.; Lian, P.; Jiao, L.; Liu, Z.; Zhao, J.; Gao, J. Fractal analysis of microscale and nanoscale pore structures in carbonates using high-pressure mercury intrusion. Geofluids 2018, 2018, 1–15. [Google Scholar] [CrossRef]
- Liu, K.; Mirzaei-Paiaman, A.; Liu, B.; Ostadhassan, M. A new model to estimate permeability using mercury injection capillary pressure data: Application to carbonate and shale samples. J. Nat. Gas Sci. Eng. 2020, 84, 103691. [Google Scholar] [CrossRef]
- Mandelbrot, B.B. The Fractal Geometry of Nature; W.H. Freeman: New York, NY, USA, 1983. [Google Scholar]
- Lai, J.; Wang, G. Fractal analysis of tight gas sandstones using high-pressure mercury intrusion techniques. J. Nat. Gas Sci. Eng. 2015, 24, 185–196. [Google Scholar] [CrossRef]
- Purcell, W.R. Capillary Pressures- Their Measurement using Mercury and the Calculation of Permeability Therefrom, Pet Trans. AIME. J. Petrol. Technol. 1949, 1, 9–48. [Google Scholar] [CrossRef]
- Li, K. Analytical Derivation of Brooks–Corey Type Capillary Pressure Models using Fractal Geometry and Evaluation of Rock Heterogeneity. J. Petrol. Sci. Eng. 2010, 73, 20–26. [Google Scholar] [CrossRef]
- Friesen, W.I.; Mikula, R.J. Fractal Dimensions of Coal Particles. J. Colloid Interf. Sci. 1987, 120, 263–271. [Google Scholar] [CrossRef]
- Zhang, B.; Liu, W.; Liu, X. Scale-Dependent Nature of the Surface Fractal Dimension for Bi- and Multi-Disperse Porous Solids by Mercury Porosimetry. Appl. Surf. Sci. 2006, 253, 1349–1355. [Google Scholar] [CrossRef]
- He, C.Z.; Hua, M.Q. Fractal Geometry Description of Reservoir Pore Structure. Oil Gas Geol. 1998, 19, 15–23. [Google Scholar]
Publisher’s Note: MDPI stays neutral with regard to jurisdictional claims in published maps and institutional affiliations. |
© 2022 by the authors. Licensee MDPI, Basel, Switzerland. This article is an open access article distributed under the terms and conditions of the Creative Commons Attribution (CC BY) license (https://creativecommons.org/licenses/by/4.0/).