Article

Dynamic Response and Damage Regularity of Sandstone with Different Moisture States under Cyclic Loading

1
School of Resources and Environmental Engineering, Shandong University of Technology, Zibo 255049, China
2
School of Resources and Safety Engineering, Central South University, Changsha 410083, China
*
Author to whom correspondence should be addressed.
Fractal Fract. 2022, 6(4), 226; https://doi.org/10.3390/fractalfract6040226
Submission received: 1 February 2022 / Revised: 7 April 2022 / Accepted: 13 April 2022 / Published: 18 April 2022
(This article belongs to the Special Issue Fractures and Fragments by Fractal Analysis)

Abstract

:
In the process of geotechnical engineering excavation, wet and water-filled rock masses are inevitable. To obtain the mechanical properties of these rocks, indoor tests are required, and most of the rock tests rock tests are dry or nearly dry. They cannot really reflect the true nature of the rock, let alone its nature under a dynamic load. The rock was repeatedly impacted during the blasting excavation process. To determine the mechanical response characteristics and damage evolution of rocks with different moisture states under cyclic dynamic loads, rock samples with three saturation levels were prepared. In the experiment, the Hopkinson pressure bar equipment was utilized to perform five cycles of impact with the same incident energy, and the dynamic response of rocks with different impact times was recorded. Nuclear magnetic resonance technology was employed to obtain the change law of the pores of rock specimens after impact, and the cumulative damage rules of rock were combined with the fractal theory. From the experiments, it can be observed that the stress-strain curves of all rock samples are similar, in that they all have stress addition and unloading stages. The peak stress is proportional to the impact time and moisture content, whereas the opposite is true for the peak strain. After the impact, the small and large pores closed and increased, respectively. The porosity and porosity change rate increased with an increase in the impact time. With an increase in moisture content, this trend is more obvious. It can be observed via magnetic resonance imaging that the internal fractures of the water-bearing rock are obvious after multiple impacts. In particular, the saturated rock specimens exhibited severe damage. Fractal analysis of the NMR figures revealed that after three impact times, the fractal dimension change in the water-bearing rock samples was not obvious. This phenomenon indicated that a macro gap appeared. The fractal dimensions of the dry rock samples continued to increase, and the internal damage was less obvious.

1. Introduction

Blasting is an indispensable excavation method in geotechnical engineering. On the one hand, the drilling and blasting methods can perform blasting and exfoliation on a preconcerted rock mass for the purpose of excavation. On the other hand, in addition to its use for crushing rock bodies, explosion shock waves will be transmitted to the surrounding rock mass, causing damage or destruction to the surrounding rock, which will affect the stability and safety of surrounding rocks and adjacent structures [1,2,3,4,5]. Since the excavation of rock and soil is limited by production and construction techniques, it cannot be completed after one excavation and often requires multiple blasting excavations. Therefore, the impact of explosion shock waves on surrounding rocks and nearby buildings is significant.
During excavation, the rock is subjected to cyclical impact, and cracks in the rock are expanded under cyclic loading to expand the degree of rock damage. In terms of macroscopic performance, as the strength of the rock decreases, its ability to resist deformation decreases as well [6]. The near-water rock mass project is more obvious in terms of rock mass damage. The presence of water weakens the rock and reduces its strength and ability to resist deformation. Under the same blasting capacity, the damage to the moist rock mass is greater than that of the dry rock mass; therefore, the excavation of rock masses with different moisture contents results in different damage levels. It is necessary to study the dynamic response and damage law of rock masses with different moisture contents, particularly rocks subjected to cyclic dynamic loads.
Currently, several researchers have studied the mechanical properties of water-bearing rocks. However, most of these studies are limited to statics, and few scholars have studied the influence of moisture content on the mechanical properties of rocks from the perspective of dynamics. Yuan Pu et al. [7,8,9] utilized the split Hopkinson pressure bar device (hereinafter referred to as SHPB) to study the dynamic mechanical properties of sandstone in different moisture states. They then studied the effect of sandstone moisture content on mechanical properties from the perspective of stress-strain and energy. Using SHPB tests to obtain the dynamic breaking strength of dry and water-saturated granites, Rubin [10] and Lou Weitao [11] indicated that water-saturated granites are harder to break off than when dry. After performing uniaxial impact compression tests on sandstone under air-dry and saturated conditions, Wang Bin et al. [12] determined that the saturated strength of sandstone was similar to that in the air-dry state. By summarizing the research results of hydrous rock dynamics, it was determined that when the rock sample was processed, the scholars did not rule out the influence of other factors than water, such as the temperature factor and test environment where the rock sample was located.
Significant progress has been made in studying the dynamic response of rocks based on the SHPB system; however, there are few studies on the dynamic cumulative damage of rocks. Li Diyuan [13] and Mei Nianfeng [14] studied the damage law of granite under multiple impacts and adopted the change in rock longitudinal wave velocity to characterize the damage characteristics of rock. Combining the dynamic statistical damage model based on the Weibull distribution, Zhu Jingjing [15] studied the mechanical properties and energy absorption of granite under cyclic impact loading, and analyzed the evolution law of the cumulative damage of rocks. Using the rock wave velocity and logistic curve equation, Jin Jiefang [16] studied the cumulative damage of sandstone under dynamic cyclic loading, and established a cumulative evolution model of rock damage under cyclic impact. Earlier studies did not consider the state of moisture in the rocks. In addition, the error in the degree of damage was determined by the acoustic velocity. Therefore, the accuracy of the obtained results is not high, and research on cumulative damage using the formula does not intuitively reflect the degree of rock damage.
Based on earlier research, to obtain cyclic dynamic mechanical responses and cumulative damage rules for rocks with different moisture contents, impact tests combined with pore scanning and fractal theory were employed to obtain the dynamic response characteristics of rocks in different moisture content states under multiple dynamic shocks, and master the change law of rock internal damage. The SHPB system was utilized to cyclically impact sandstones with three types of moisture content to obtain the dynamic constitutive relationship of rocks and changes in the peak stress and peak strain. Furthermore, the nuclear magnetic resonance system (hereinafter referred to as NMR) was utilized to scan the rock samples after impact, obtain the porosity of the rock and its change, and intuitively obtain the damage evolution rules of the rock. The fractal theory was employed to reveal the variation law of rock pore [17,18,19,20], and the degree of rock destruction was characterized by the fractal dimension.

2. Experimental Scheme and Sample Preparation

2.1. Rock Impact Test

The diameter of the SHPB system utilized in the test was 50 mm, length of the incident beam was 2.00 m, and length of the transmission rod was 1.50 m. The material was 40Cr alloy steel with a density of 7795 kg·m−3 and elastic wave velocity of 5410 m·s−1. To achieve a stable half-sine wave loading, the punch utilized a “spindle type” that eliminates P-C oscillations. It has the same material as the rod, and its maximum diameter is 50 mm [21,22,23,24].
An SHPB device was utilized to dynamically load the sandstone specimens. To study the mechanical properties of the rock under different loading times, the cylinder pressure of the gun bore was set to 0.4 MPa [25]. Each impact was performed on dry, semi-saturated, and saturated rock specimens with the same incident energy. Five cyclic impacts were applied to each rock sample moisture state, and the dynamic response data of the rock at each impact were recorded. To reduce the fluctuation of the curve, the median obtained for every three tests was recorded as standard data.

2.2. NMR Test

The NMR analysis of the rock was performed using an AniMR-150 Rock Magnetic Resonance Imaging Analysis System manufactured by Shanghai Niumag Electronic Technology Co., Ltd (Shanghai, China). The NMR test determines the change in rock pores by measuring the relaxation time of pore water. Generally, the pore characteristics of rocks are characterized by a change in the T2 curve. Usually, the smaller the pore size, the smaller the measured T2 value. In the curve diagram, the area enclosed by the T2 curve and horizontal axis represents the porosity of the entire rock sample; therefore, if the NMR is adopted to measure rock pores, all the rock pores need to be filled with water. Before the test, the rock samples were subjected to a full-water treatment, and then the samples of the SHPB test were subjected to NMR scanning. The porosity and pore imaging of the rock were analyzed by analyzing the T2 spectral curves and pore images [26] based on the scan results.
To avoid the influence of water saturation and drying tests on the rock, different rock specimens were taken for different impact times. The initial state of the rock was recorded before NMR testing. In other words, before the impact test, all the rock samples were saturated, saturated weights of all the samples were recorded, and initial data of the rock pores were obtained by NMR scanning. Finally, the samples were dried to obtain the required samples.

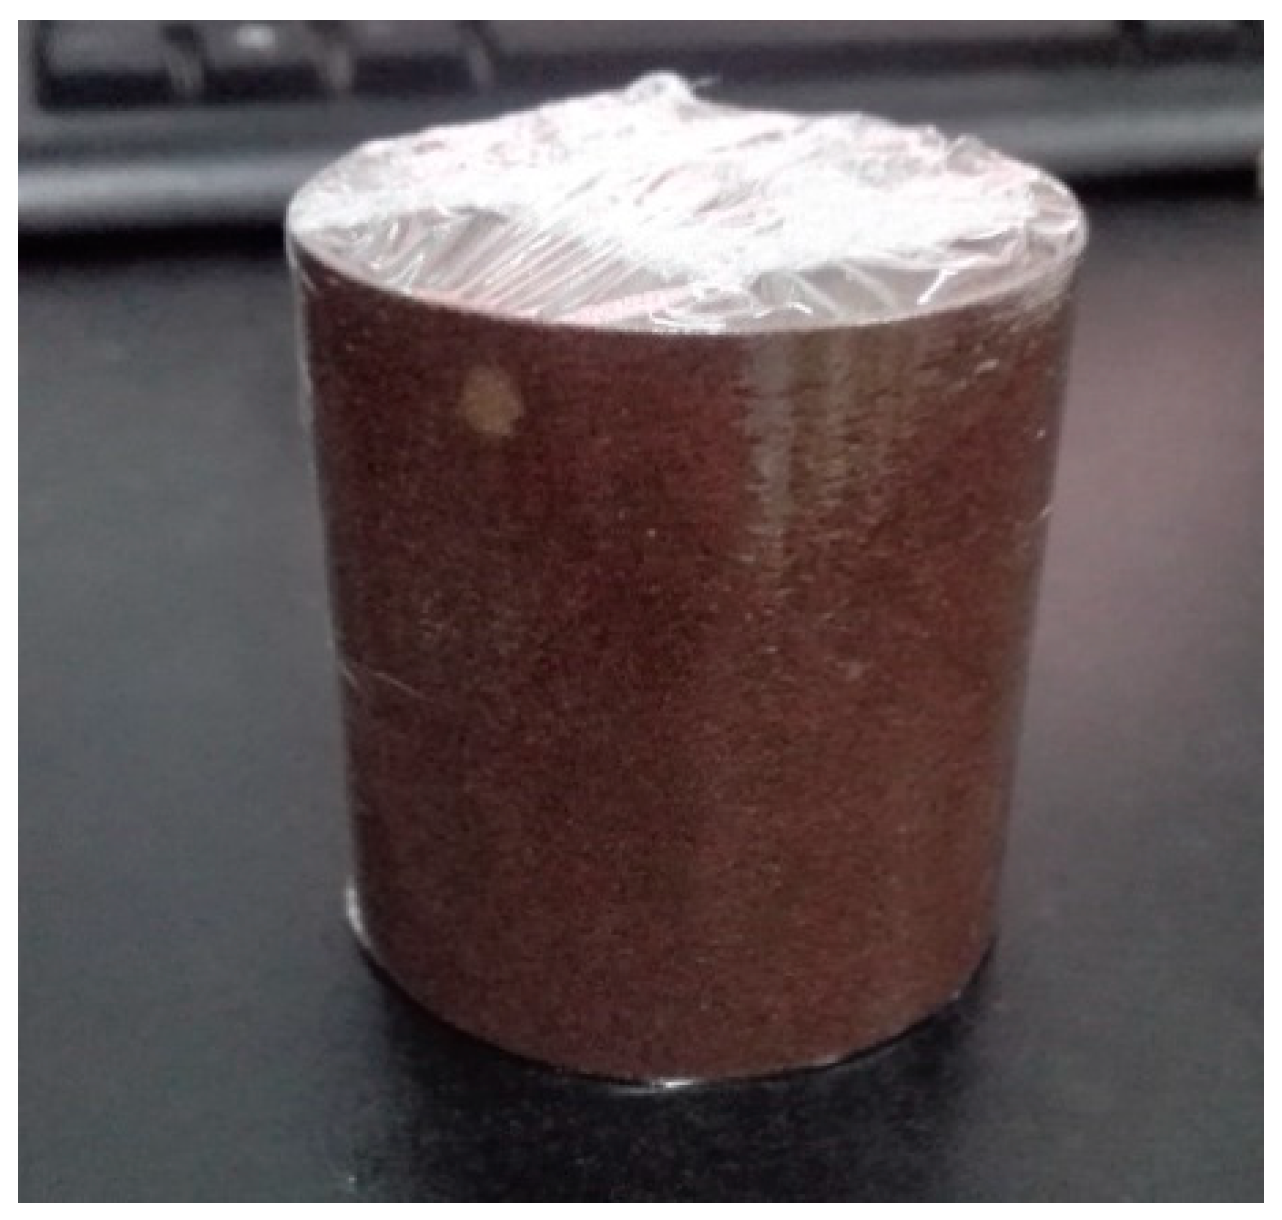
2.3. Sample Preparation

The sandstone core sample utilized in the test was obtained from a quarry in Jvnan, Linyi, Shandong Province. The brown-red rock sample had a medium-grained or fine-grained sand-like structure with a uniform texture. The smoothness and perpendicularity of the sample surface and axis met the specification requirements. The sample surfaces were visually observed without joints, cracks, or defects.
To obtain good test results and eliminate influencing factors apart from moisture content, all the samples were dried. The sandstone samples were placed in an oven and baked at 108 °C for at least 24 h. The samples were weighed every 4 h and considered dried when the continuous measured mass difference was less than 0.1% of the samples. After the rock sample was cooled, it was removed and weighed immediately to record its weight under test in a very dry state.
A vacuum test was performed to determine the water saturation of the dried samples. When the samples were saturated, the water surface in the saturated container was higher than the upper surface of the samples, and the vacuum pressure dial degree was approximately one atmosphere (0.1 MPa). The time required for pumping air in the saturated sample was 6 h. After pumping was completed, the saturated rock samples were placed in water for 30 d for maintenance. During the curing process, it was ensured that the water surface was at least 2 cm above the upper surface of the rock. To prepare semi-saturated samples, the samples were subjected to vacuum saturation, and the saturation time was 1 h. After the extraction was completed, the samples were wrapped in plastic. As illustrated in Figure 1, the wrapped sample was placed in a sealed box for 30 d for curing.
The size of the sandstone samples utilized in the test was ϕ50 mm × 50 mm. The samples utilized in the test were named using the water content state and impact times. We used letters d/h/s for the dry/half-saturated/saturated states and numbers for the impact times. For example, sample d-3 indicates dry rock samples that have received or will receive three impact times.
After curing, the saturated samples were weighed and the sample density and corresponding moisture content were calculated using the following formula:
ω s = m w m s m s · 100 %
K ω = ω s ω s a
where m is the weight of the rock sample, mw is the weight of the rock specimen, ms is the weight of the dry rock (kg), ωs is the rock moisture content, ωsa is the moisture content of the rock under saturation conditions, and Kω is the rock saturation coefficient adopted to characterize the rock saturation. The rock specimen saturation is presented in Table 1, where mp is the weight of the sample before the test, and K ω ¯ is the average saturation coefficient of the rock.

3. SHPB Dynamic Pressure Test and Result Analysis

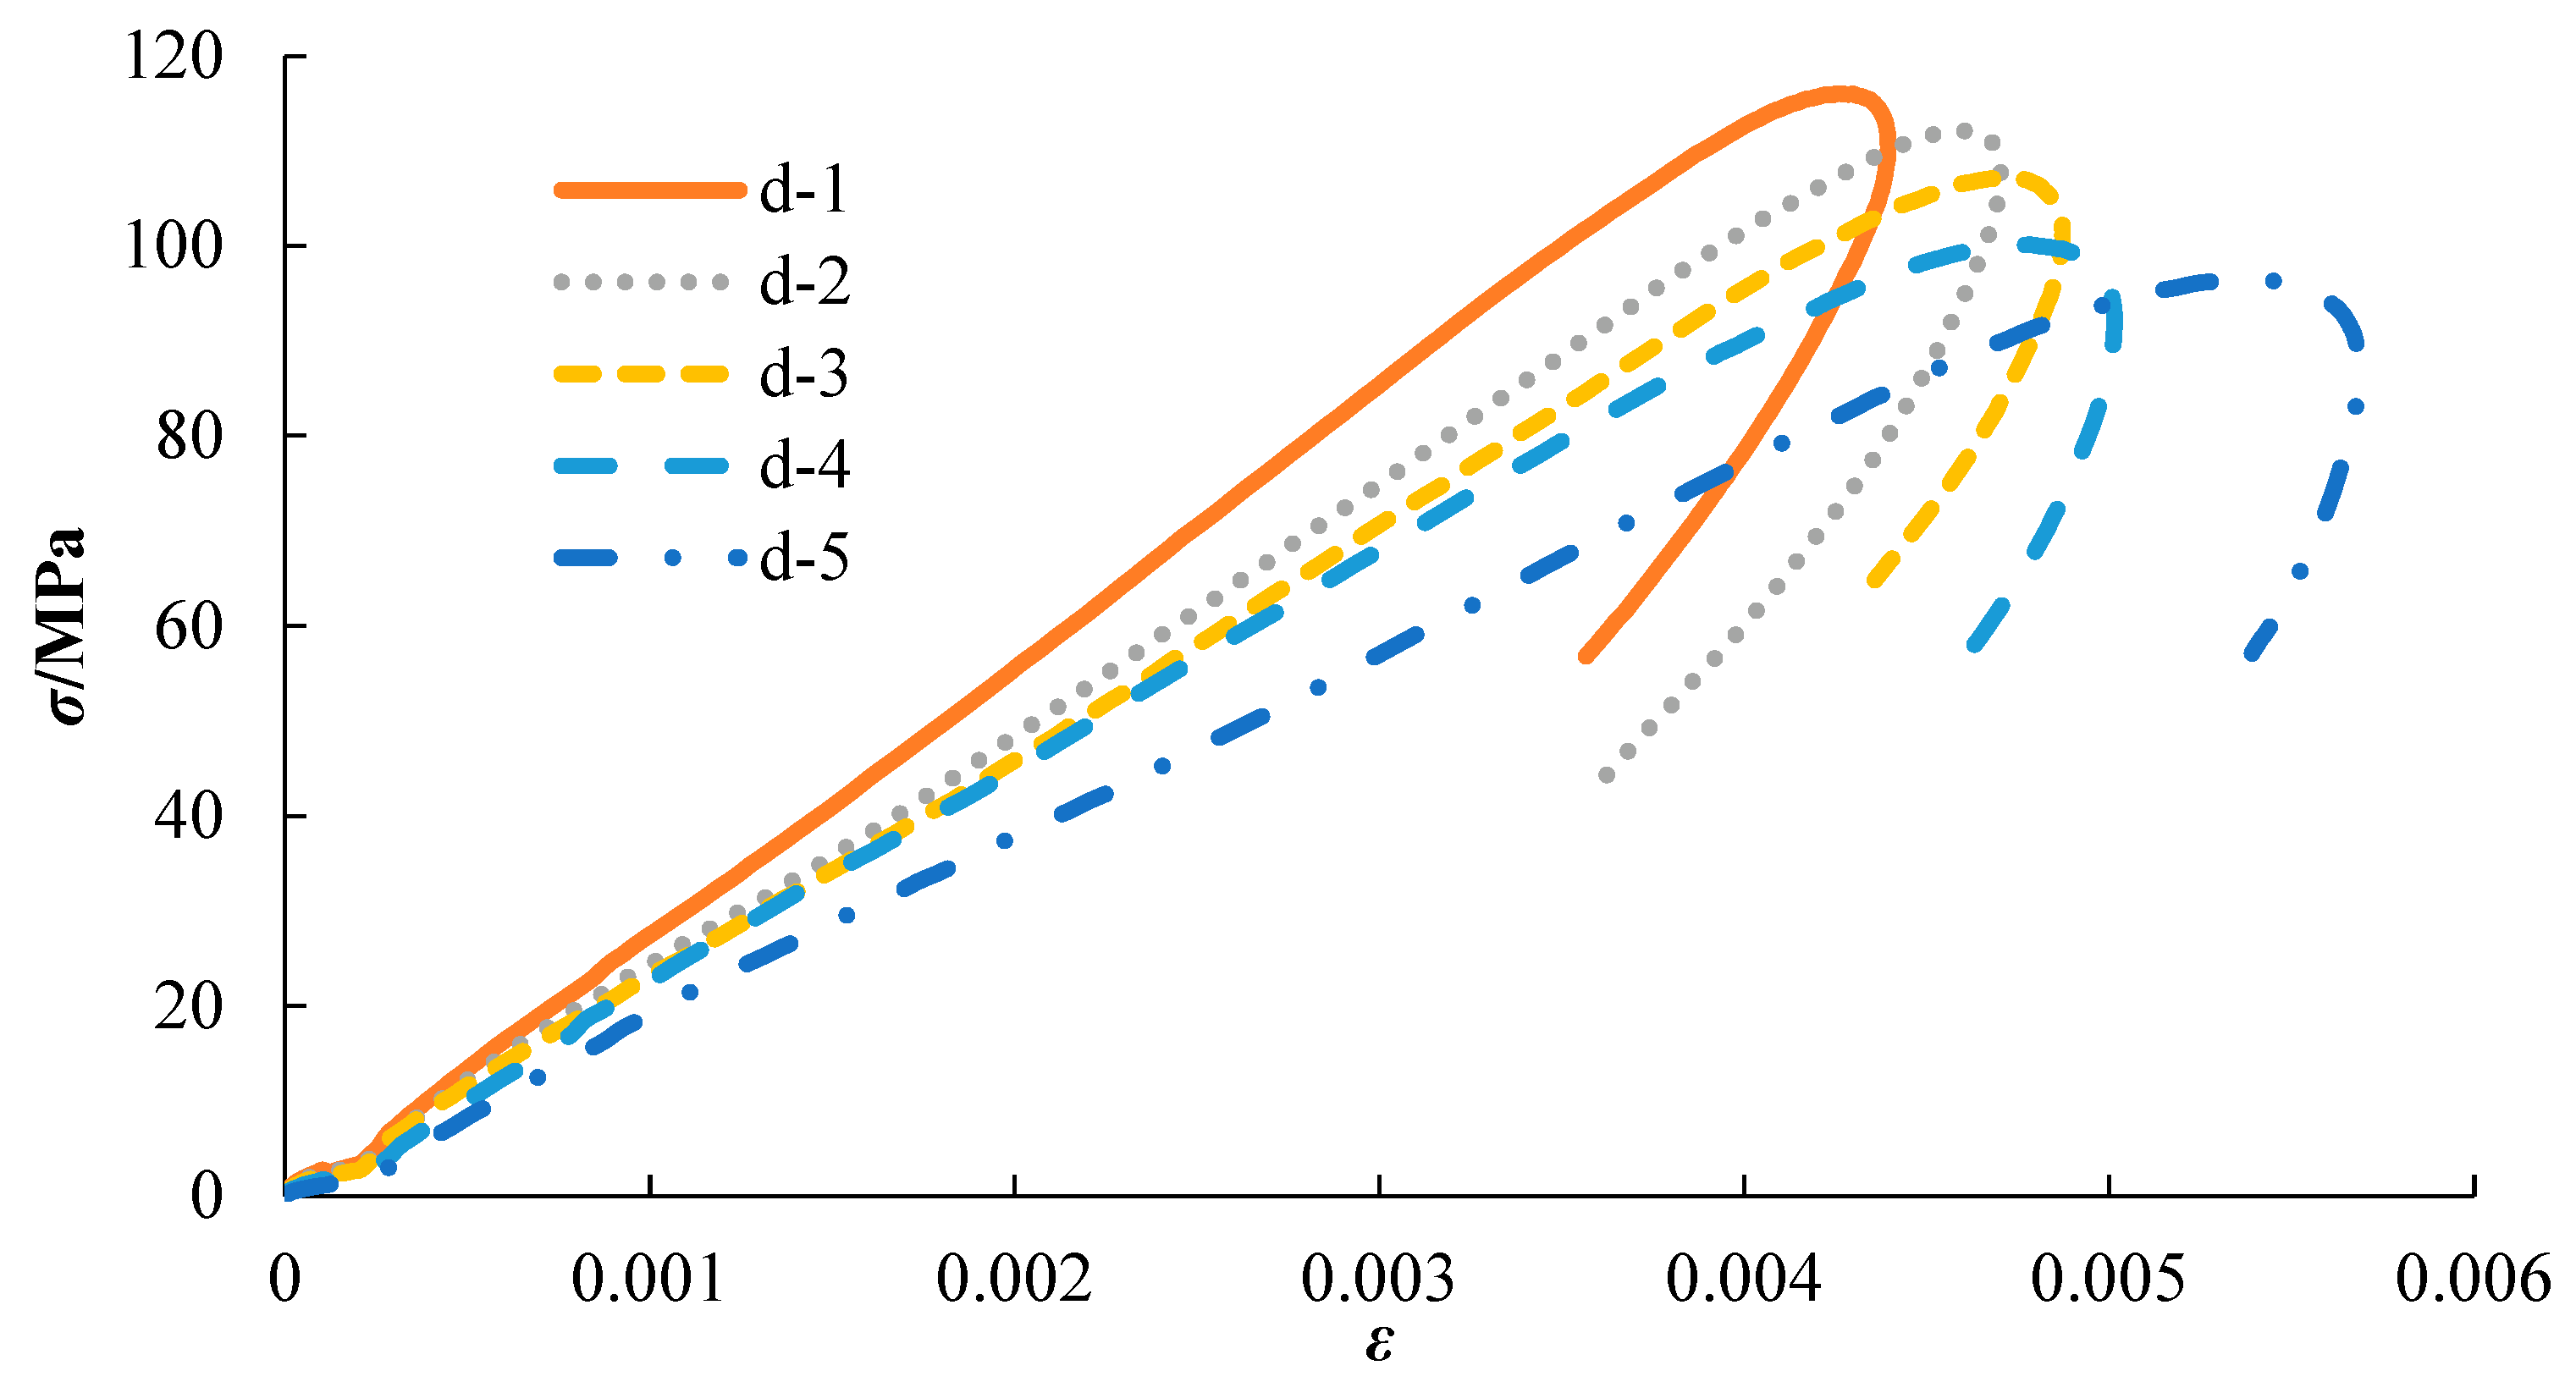
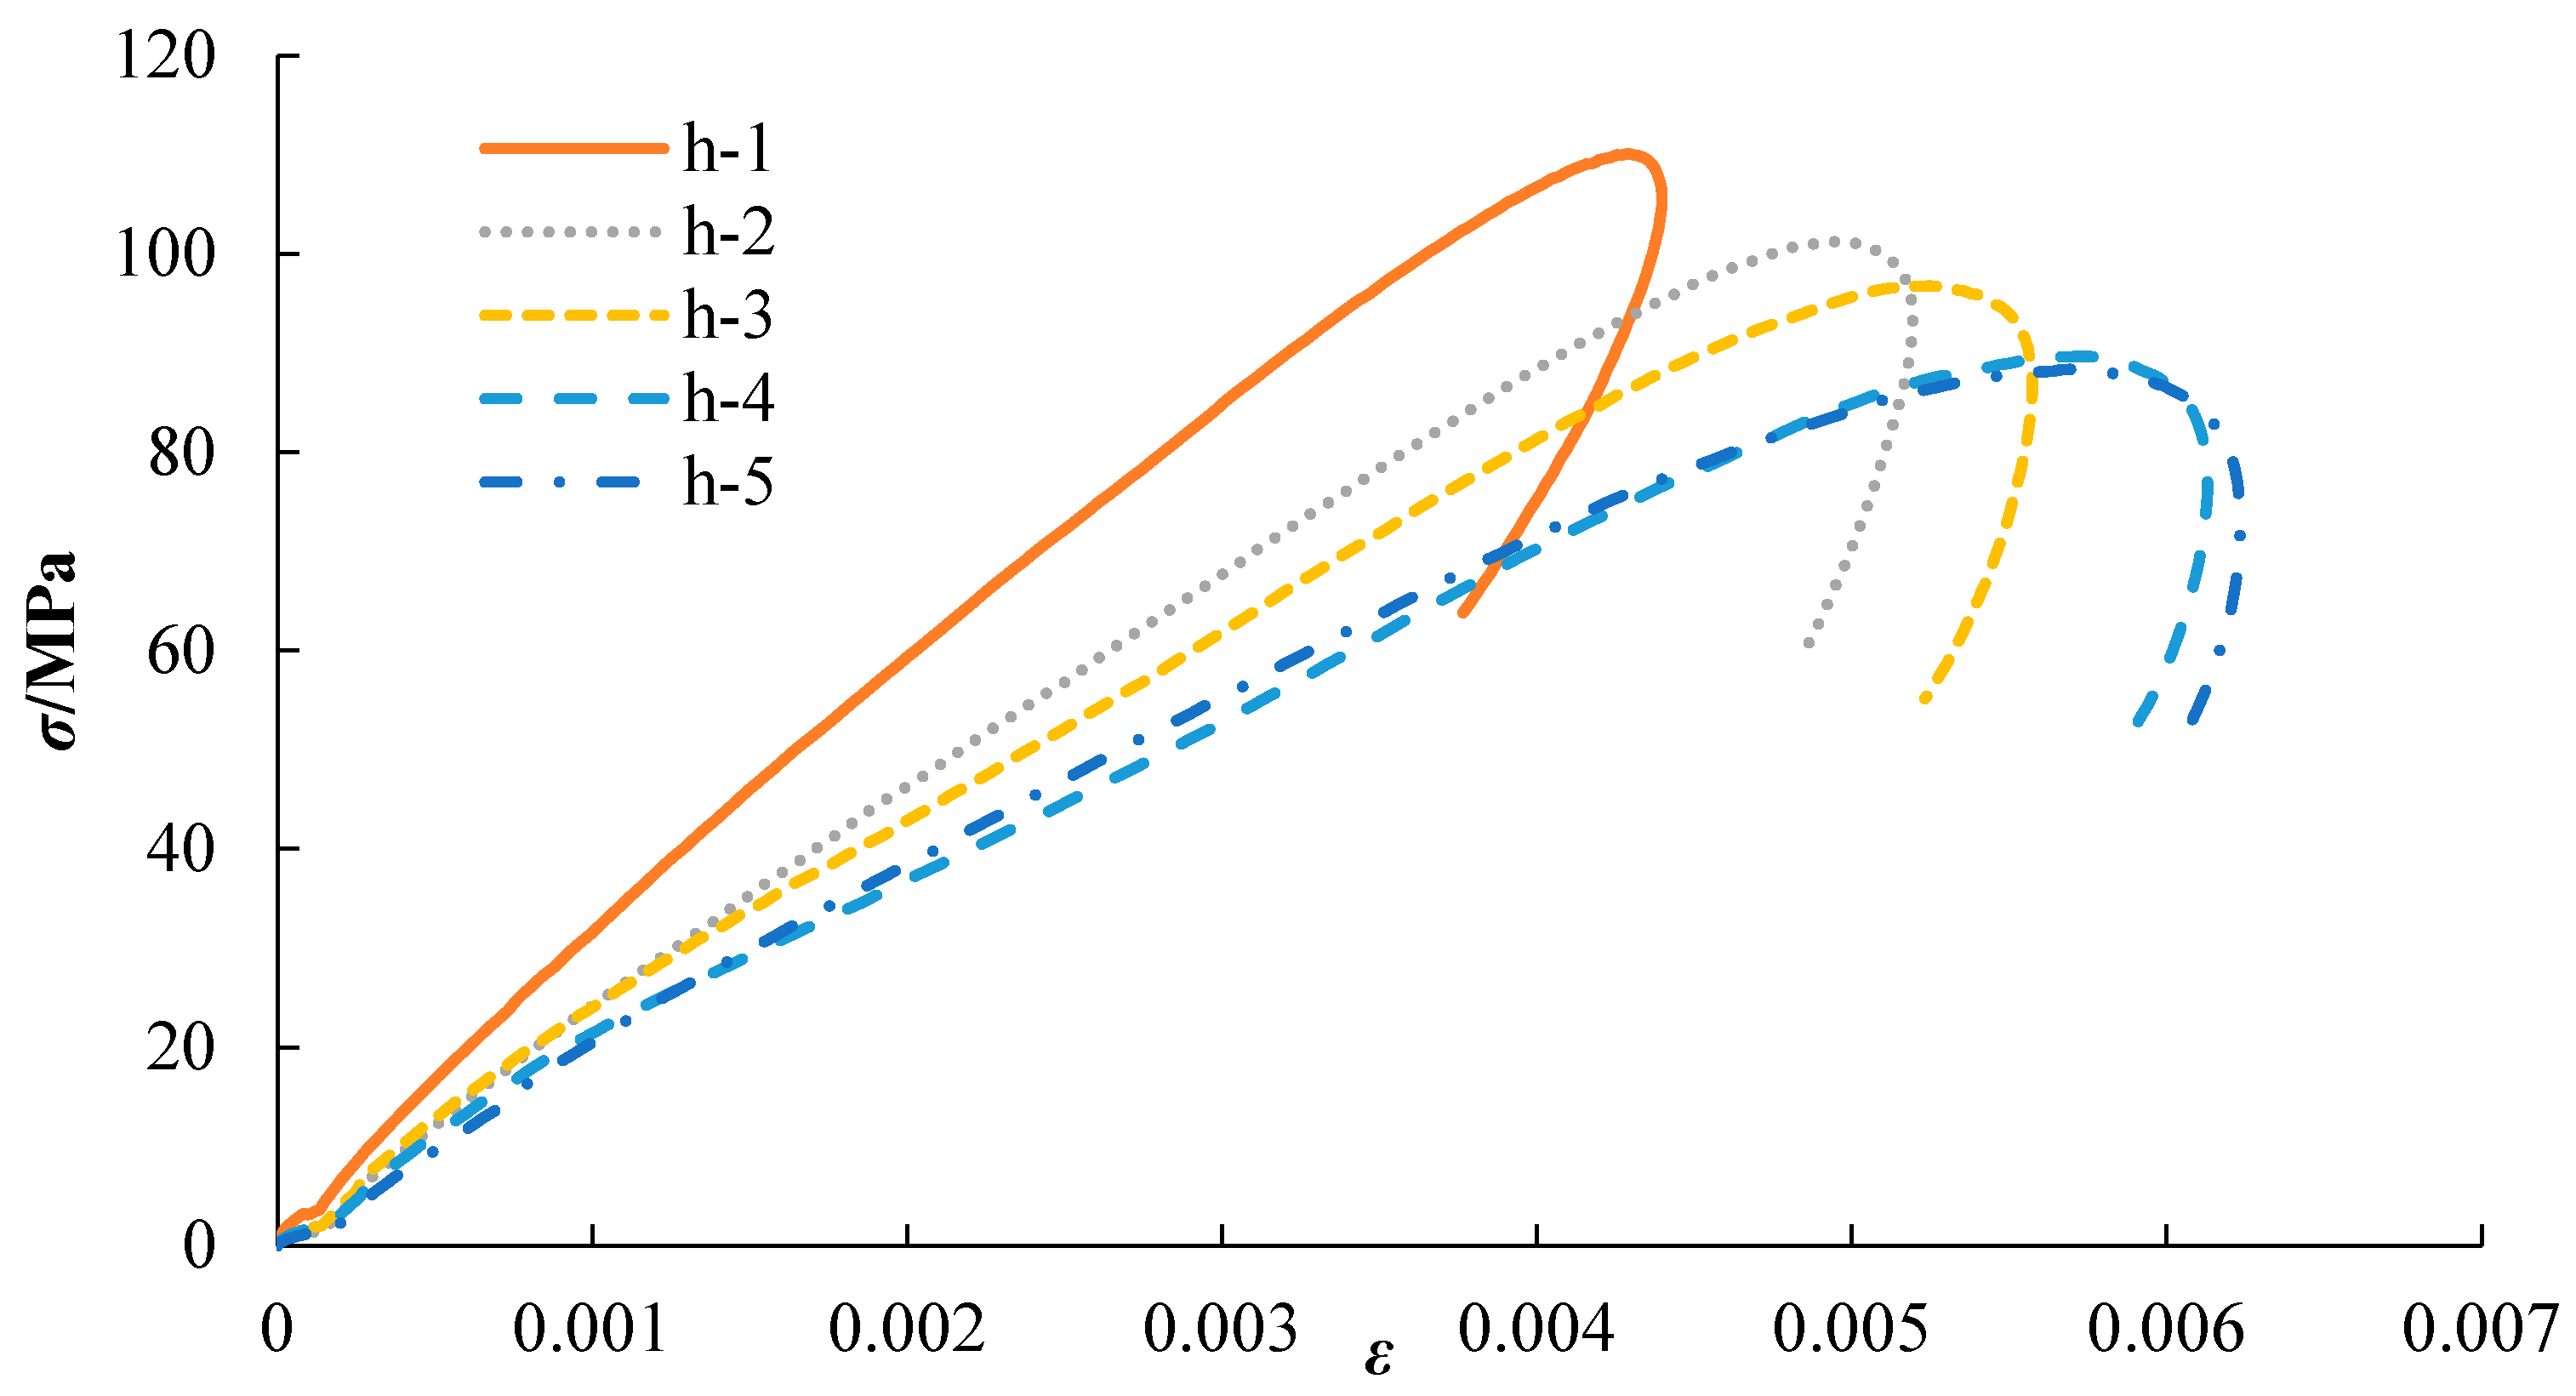
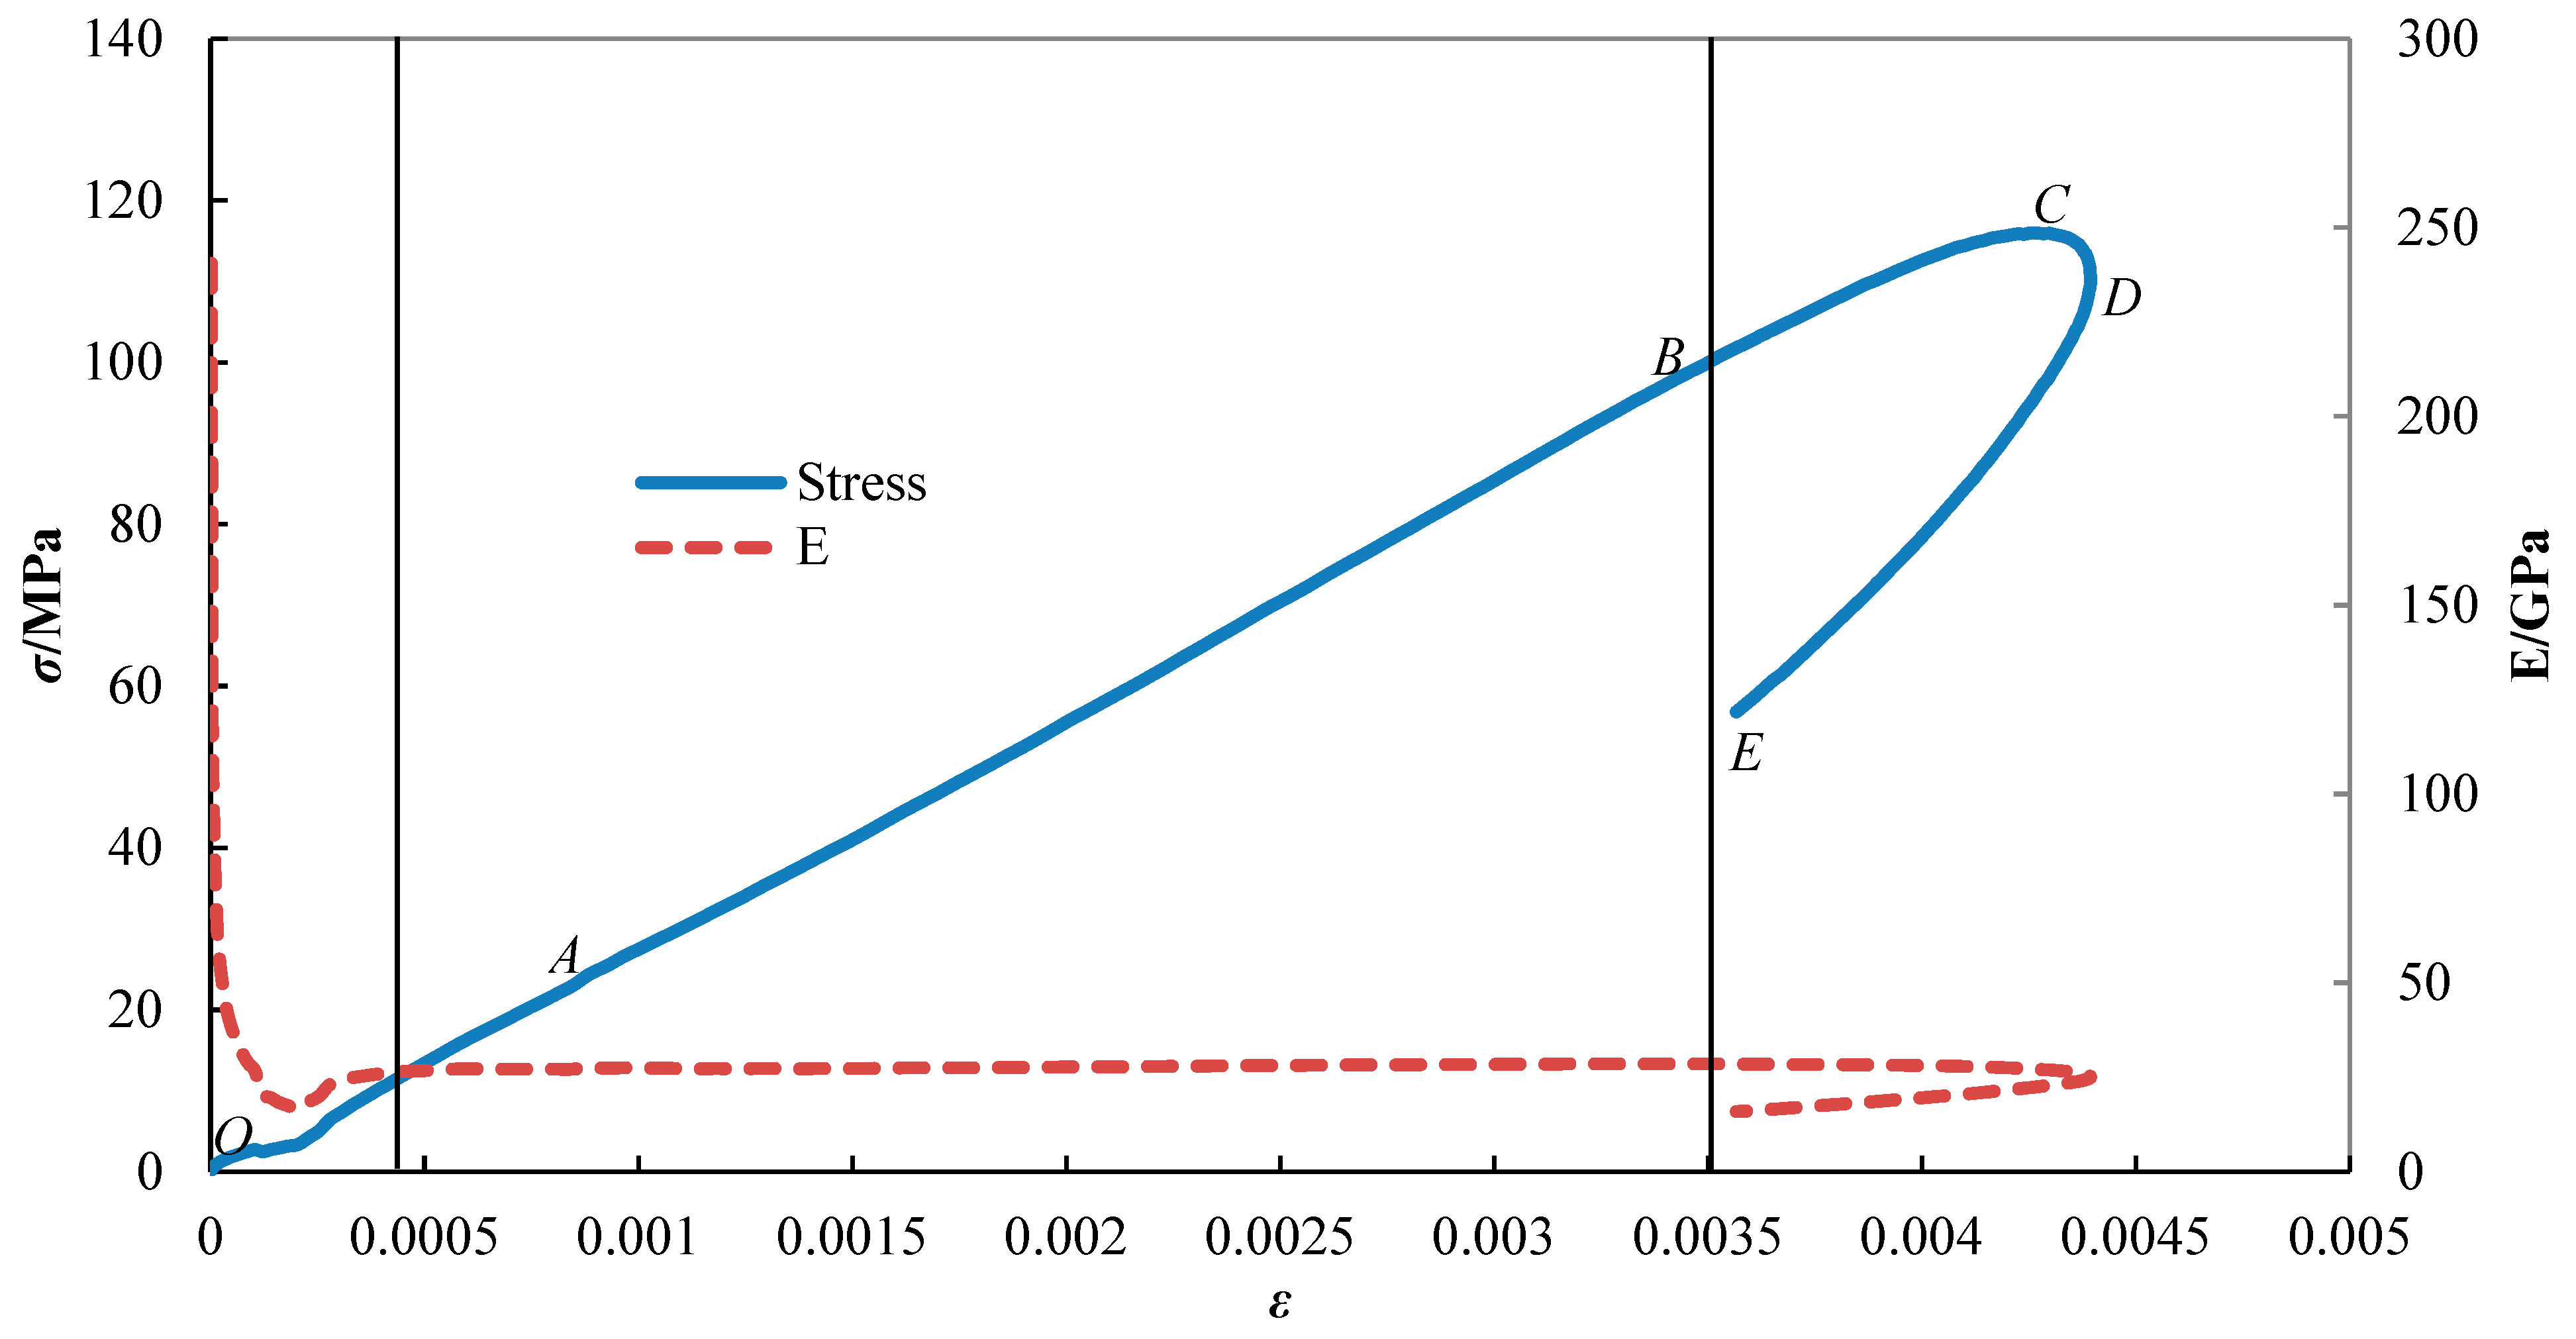
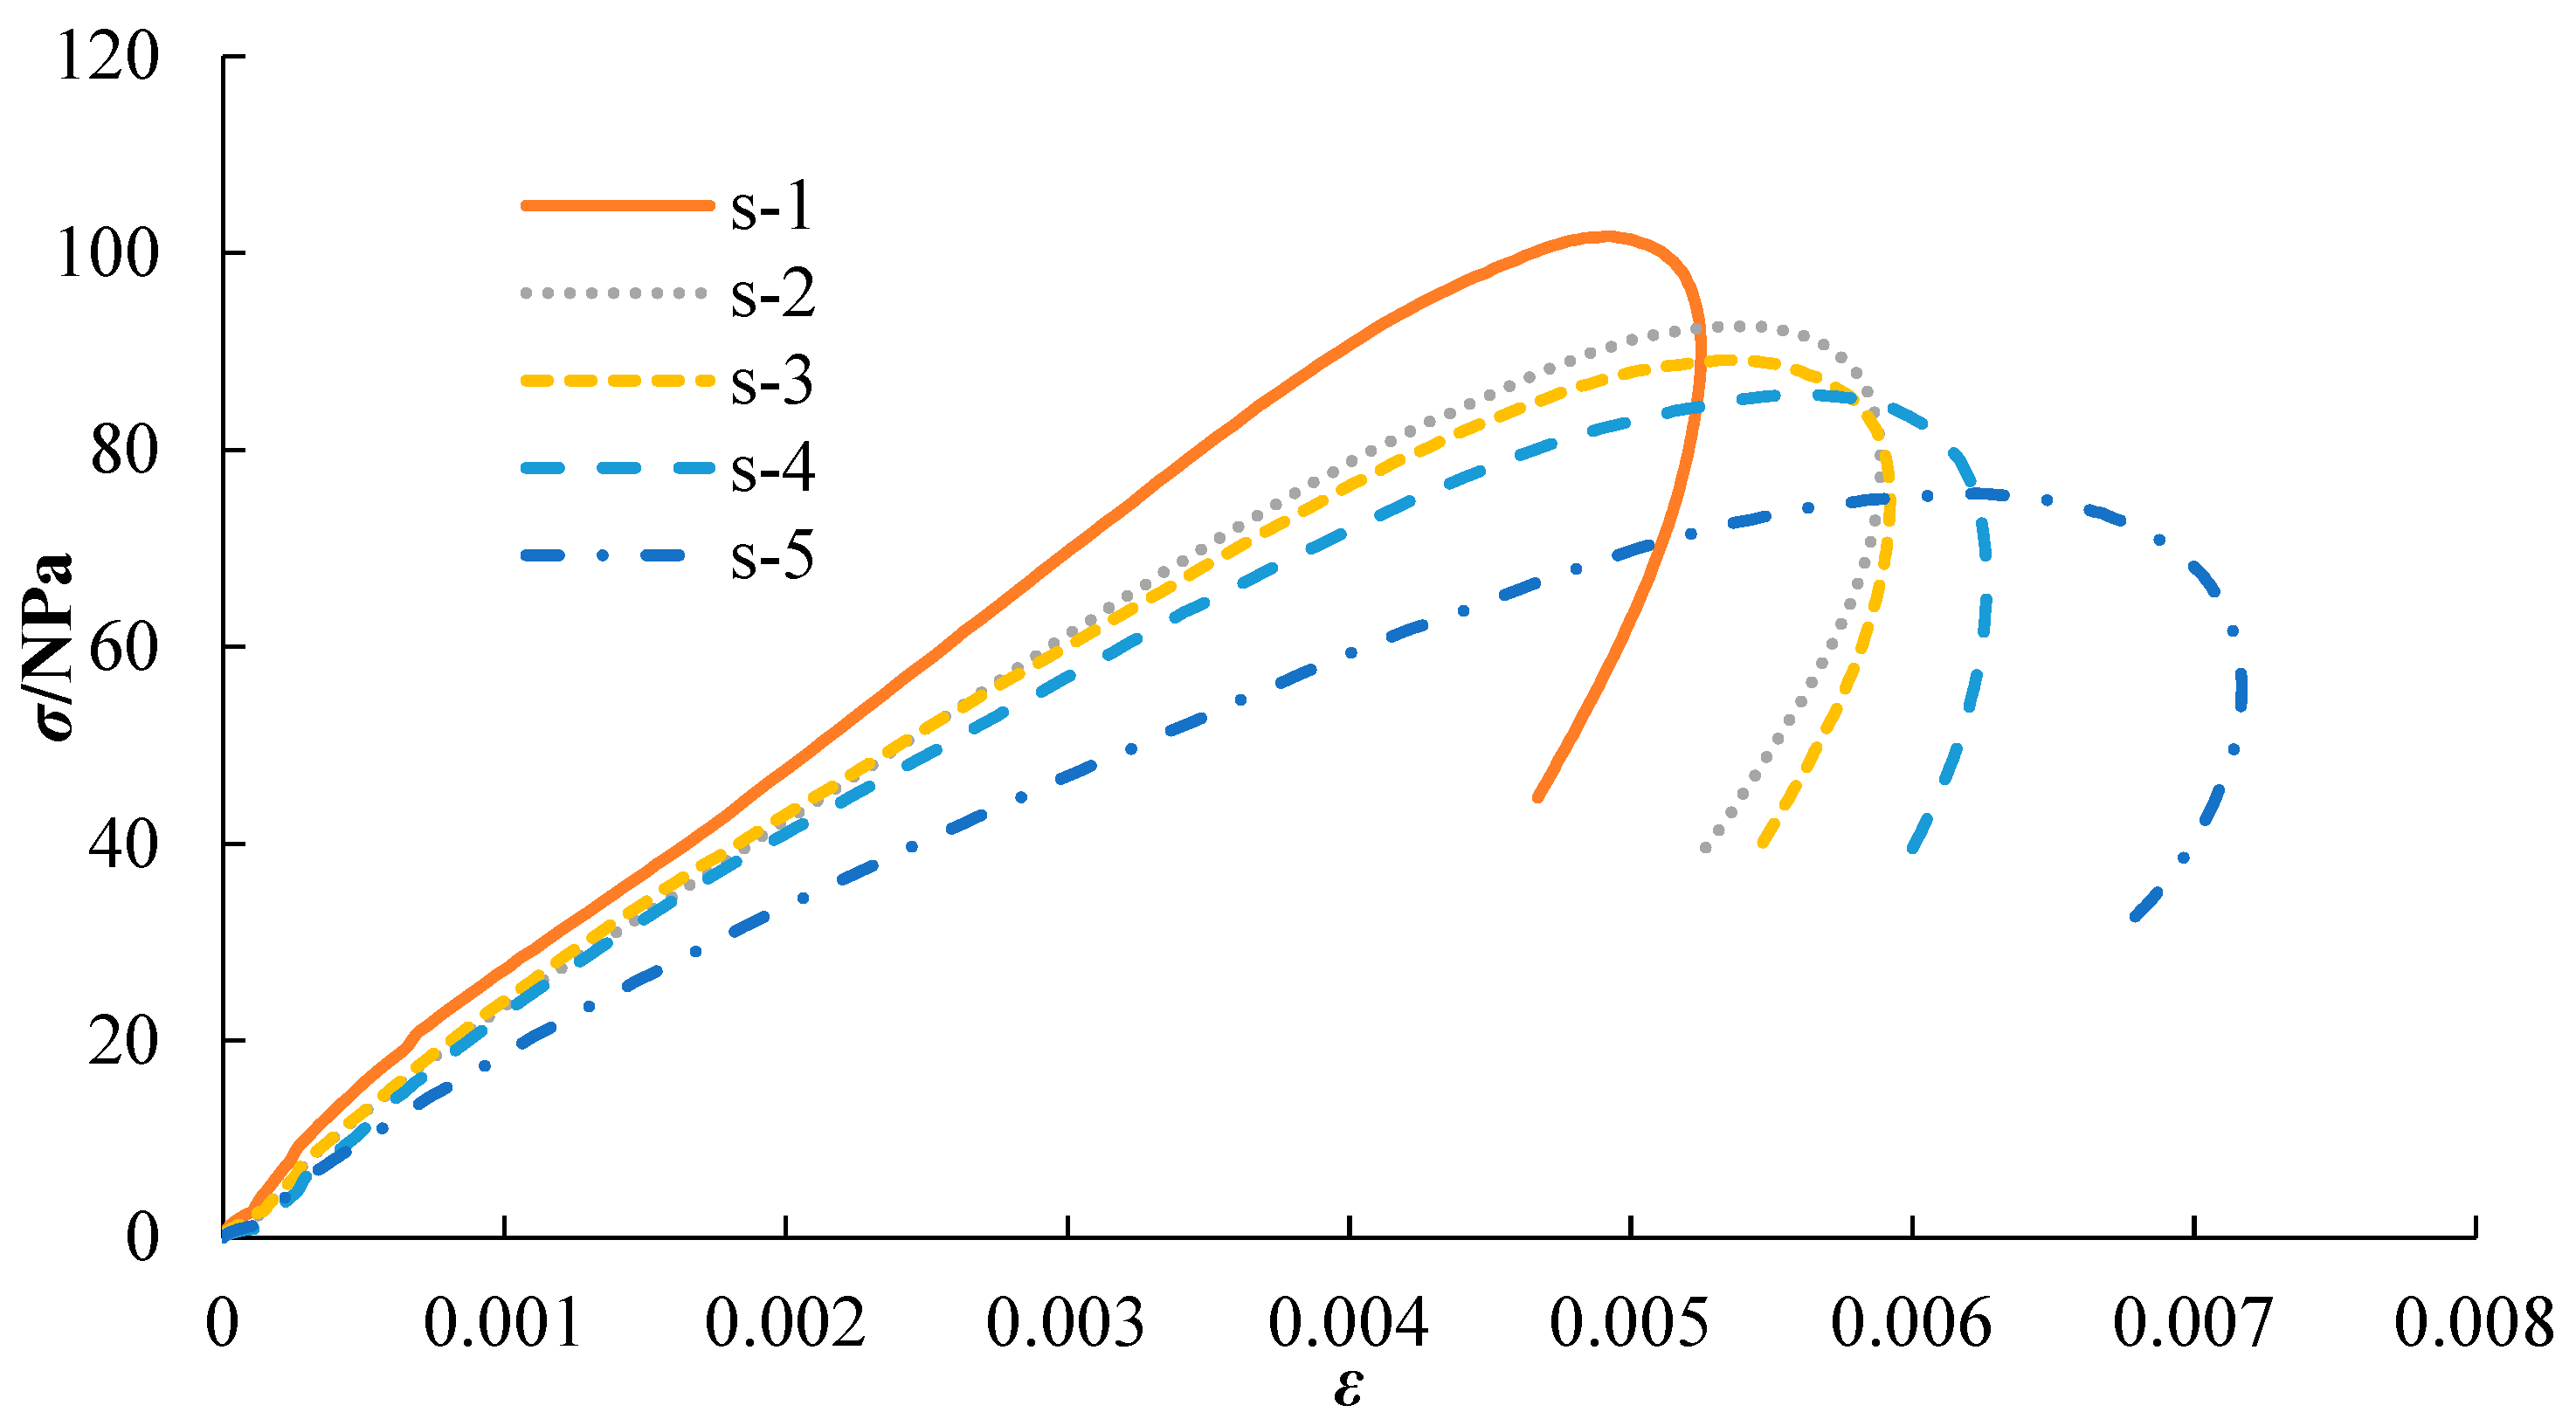
3.1. Stress-Strain Analysis

The stress-strain curves of the rocks under different conditions are illustrated in Figure 2, Figure 3 and Figure 4. As can be observed, all the curves have two stages: stress rise and stress drop [1]. At the initial stage of the dynamic load, the rock stress increases with an increase in strain. At this time, the stress increases, and this stage is defined as the loading stage. When the stress reaches its peak and then decreases, the strain continues to increase. When the strain reaches the peak, both the stress and strain decrease, the curve appears “springback”. The stage at which the stress drops after it reaches its peak is defined as the unloading phase of the rock. With an increase in the impact time, the entire rock stress-strain curve moves toward the lower right. The g-1 stress-strain curve is used for a typical analysis, as illustrated in Figure 5.
It can be observed from Figure 5 that the OC stage where the stress rises, is the loading stage, and the CE stage where the stress is reduces, is the unloading stage. This stage is also called the post-destruction stage for rocks that have been destroyed.
In the curve, the OA segment is a compact stage. At this stage, the rock pores are compacted under the action of external stress, and the elastic modulus of the rock is unstable. After reaching point A, the rock enters the elastic AB stage. During this stage, the rock is elastically deformed, and the microcracks begin to expand. The stress-strain curve is approximately linear, and the elastic modulus is approximately constant. After entering the BC stage, the slope of the stress-strain curve of the rock decreases slightly. This phase is the stage of plastic deformation of the rock, the elastic modulus exhibits a downward trend, and the rock interior crack propagation is slow. Point C represents the peak stress of the rock. If the rock is weak, it will be macroscopically damaged when it reaches this point. The magnitude of the peak stress is not only related to the impact times, but also to its ability to resist load. For the same rock sample, the magnitude of the peak stress characterizes the degree of damage within the rock. After point C is crossed, the stress gradually decreases. The CD stage is the first unloading phase that represents the extension of the rock plastic stage. At this stage, the curve is short, and the internal damage of the rock continues to expand. When the rock strain peak is reached at point D, the rock strain will not continue to expand, and rock unloading is complete. The second unloading phase, DE segment, enters through the D-point rock. At this stage, the rock strain decreases with a decrease in stress; therefore, this stage is the elastic recovery stage of the rock. The longer the DE segment distance, the greater the elasticity of the rock.
The peak stress and peak strain of the rock under various conditions were extracted, and their relationship with the impact times was established, as illustrated in Figure 6 and Figure 7, where it can be observed that the peak stress, peak strain, and impact times are approximately linear. As the impact time increases, the peak stress gradually decreases and the peak strain gradually increases. For the same number of impacts, the peak stress is inversely proportional to the rock saturation, whereas the peak strain increases with an increase in moisture content. The curve is fitted linearly, and the fitted formula is presented in Table 2.

3.2. Destructive Morphology Analysis

Under cyclic impact, the cumulative damage within the rock increases with the number of cycles, and macro-damage occurs when the internal damage reaches a certain level. Due to their high compressive strength, dry rock samples have a strong resistance to deformation, and there is no obvious damage after five impact cycles. However, the water-containing rock samples exhibited macroscopic damage after several impacts. As illustrated in Figure 8, the numbers in the figure refer to the impact times.
From Figure 8, it is known that as the impact time increases, the rock damage increases, but the rocks with less moisture content have a lower degree of damage when compared to rocks with higher moisture content. For the semi-saturated sample, a crack appeared on the surface of the sample after four impact cycles, and the depth was still shallow. Only part of the sample surface fell off when the fifth impact occurred. For the saturated sample, after the third impact, there were two obvious cracks on the surface of the sample, which penetrated the interior of the rock. A negligible number of stones fell off the rock surface, but the sample remained intact. On the fourth impact, a few rock fragments fell off and formed a typical split fracture. On the fifth impact, the rock was completely destroyed, more stones were peeled from the sample, and only half of the samples were not completely broken. It can be observed that rocks with higher moisture content have a weak resistance to deformation.

4. Study on Rock Dynamic Damage Test

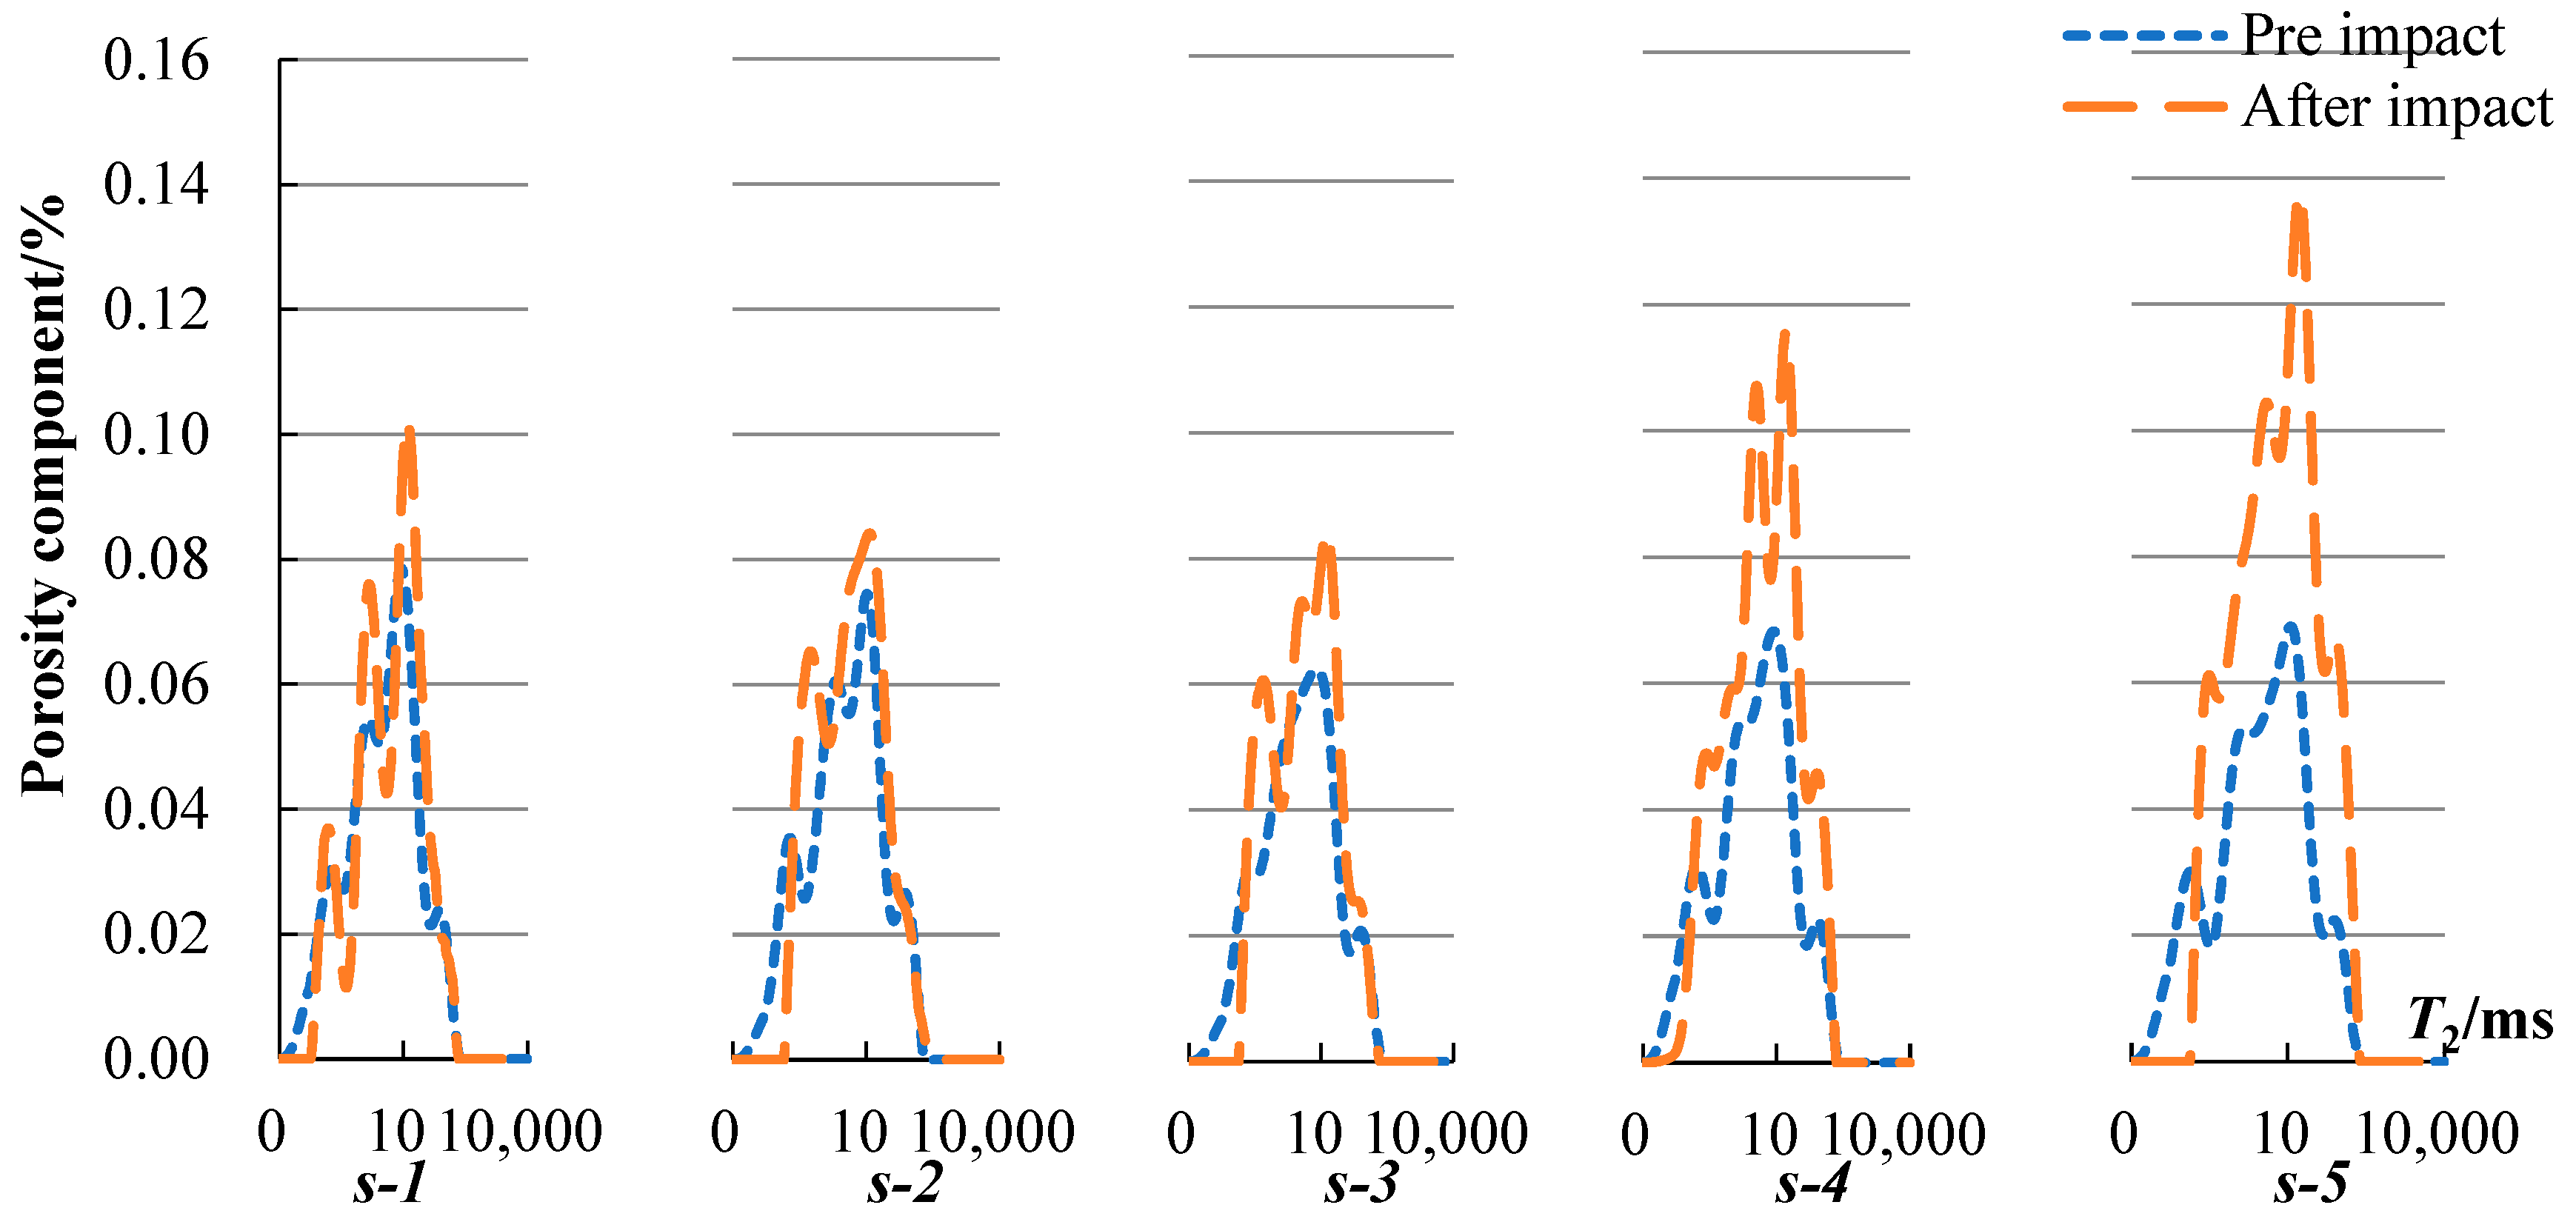
4.1. T2 Spectral Curve Analysis

Samples with the same impact energy and different impact times were compared with the T2 spectrum curves before and after impact. The results are illustrated in Figure 9, Figure 10 and Figure 11.
As can be observed from Figure 9, Figure 10 and Figure 11, under impact, the T2 spectrum curve exhibits an obvious phenomenon that shifts to the right, and peaks rise. This phenomenon proves that as the impact time increases, the pore volume of the sample and number of rock pores increase. The damage inside the sample expands under the action of external forces and increases with interaction time. Spectral curves with a relaxation time <0.1 ms develop toward the zero coordinate and most have been zeroed. This is due to the closure of the small pores caused by external forces. Owing to the difference in lithology, the number of pores decreases to varying degrees, but with the increase in impact time, the phenomenon in which the number of pores increases occurs mostly in the stratum with smaller and larger pore sizes. For large pores, the T2 value is reduced when the impact times are negligible; however, as the impact times increase, the peak of the large pore spectrum curve gradually increases and even exceeds the peak of the curve before the impact. Under the same impact, the peak value of the macropore curve increases with an increase in core moisture content. Similar to small pores, macropores are closed in the case of small impacts. However, owing to the presence of water pressure, the water-containing sample offsets part of the external load. Therefore, it can be observed from the figure that the peak value of the macropore curve of the sample with a high moisture content has a smaller decrease. As the impact time increases, the rock damage increases, pores expand or penetrate, number of large pores increase, and the peak point of the macropore curve increases. Meanwhile, for the water in the pores that soften the rock, the damage to the water-containing sample is greater under the same impact energy and impact times. It can be observed from the figure that the curve peak of the water-bearing rock is higher under the same impact times. Comparing the curves before and after impact, it is observed that the porosity component of samples with a large moisture content has a larger increment.

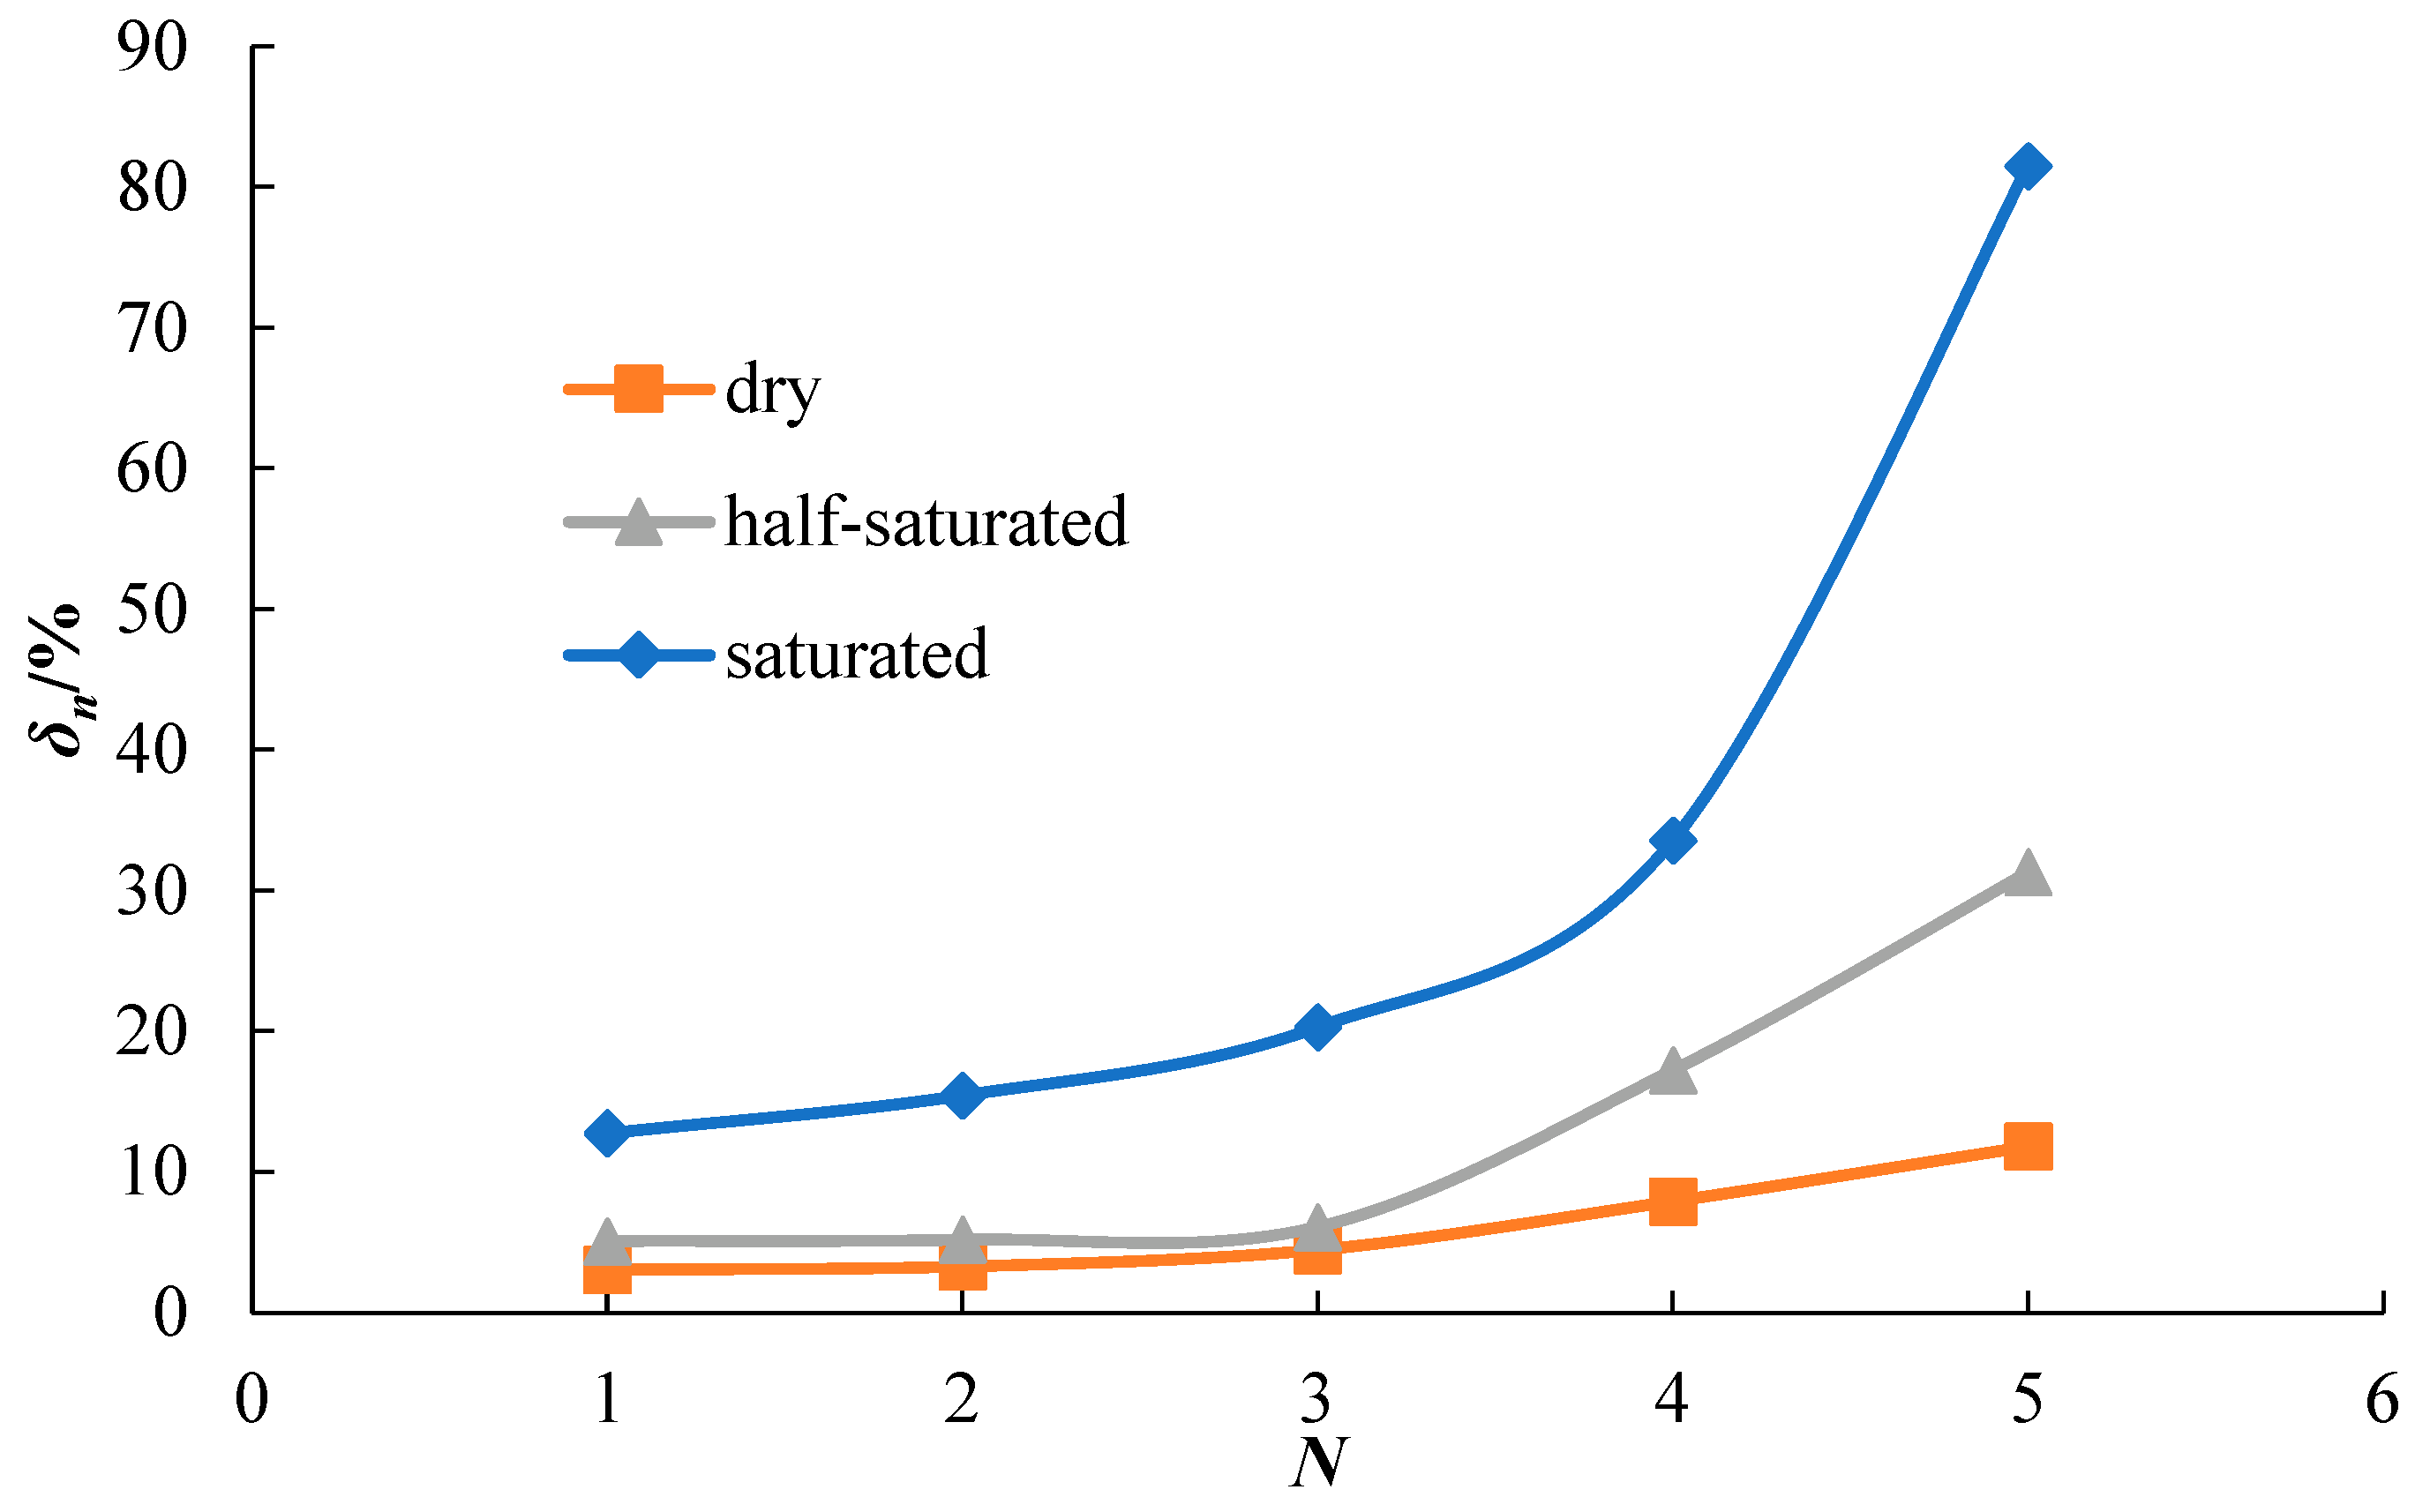
4.2. Porosity Analysis

To reduce the difference between individual rock samples, the porosity of the samples before and after the impact test are compared. The porosity change rate is defined as follows:
δ = n b n a n a
where na is the porosity before the sample is impacted (%) and nb is the porosity after the sample is impacted (%).
The calculation result of Equation (3) can be adopted as a measure of the degree of damage to a rock sample. The change in porosity of the sample before and after the impact is presented in Table 3. The curves utilized for fitting the data in the table are illustrated in Figure 12.
It can be observed from Figure 12 that as the impact time increases, the rate of porosity change also increases. This phenomenon proves that under multiple impacts, the rock damage gradually increases, pores expand, number of pores increase, and rate of porosity change increases. For the same impact times, the change in porosity of the water-containing sample is greater than that of the dry rock, and the porosity change rate of the saturated sample is several times that of the semi-saturated and dry rock samples. It can be observed that the presence of water under the action of external loads aggravates the destruction of the rock. As the moisture content increases, the ability of the rock to resist deformation weakens and the rock softens. Fit the data to obtain the relationship between the impact times and porosity change rate for dry, semi-saturated, and saturated rock samples. The formula is as follows:
δd = 0.0068 N2 − 0.0190 N + 0.0427 R2 = 0.9970
δh = 0.0273 N2 − 0.0991 N + 0.1273 R2 = 0.9915
δs = 0.0707 N2 − 0.2684 N + 0.3550 R2 = 0.9656
It can be observed from Figure 12 and Equations (4)–(6) that the porosity change rate and impact times exhibit a quadratic polynomial relationship, and the slope of the curve increases with impact time. This phenomenon indicates that the more impact times, the faster the development of rock damage. Using the second derivative of the fitted formula as the criterion for characterizing the degree of bending of the curve, we can conclude that the second derivative results of the curve fitting equations of the dry, semi-saturated, and saturated rock samples are 0.0136, 0.0546, and 0.1414, respectively. The larger the data in the above results, the more severe the bending of the curve. Combined with the results of the second derivative and Figure 12, it can be observed that as the moisture content increases, the curvature of the curve gradually increases, and change rate of the porosity aggravates the change trend with an increase in the strain rate. Therefore, the greater the moisture content of the rock, the worse the rock damage caused by the increased number of impacts, and the more sensitive the rock damage is to the change in the number of impacts.

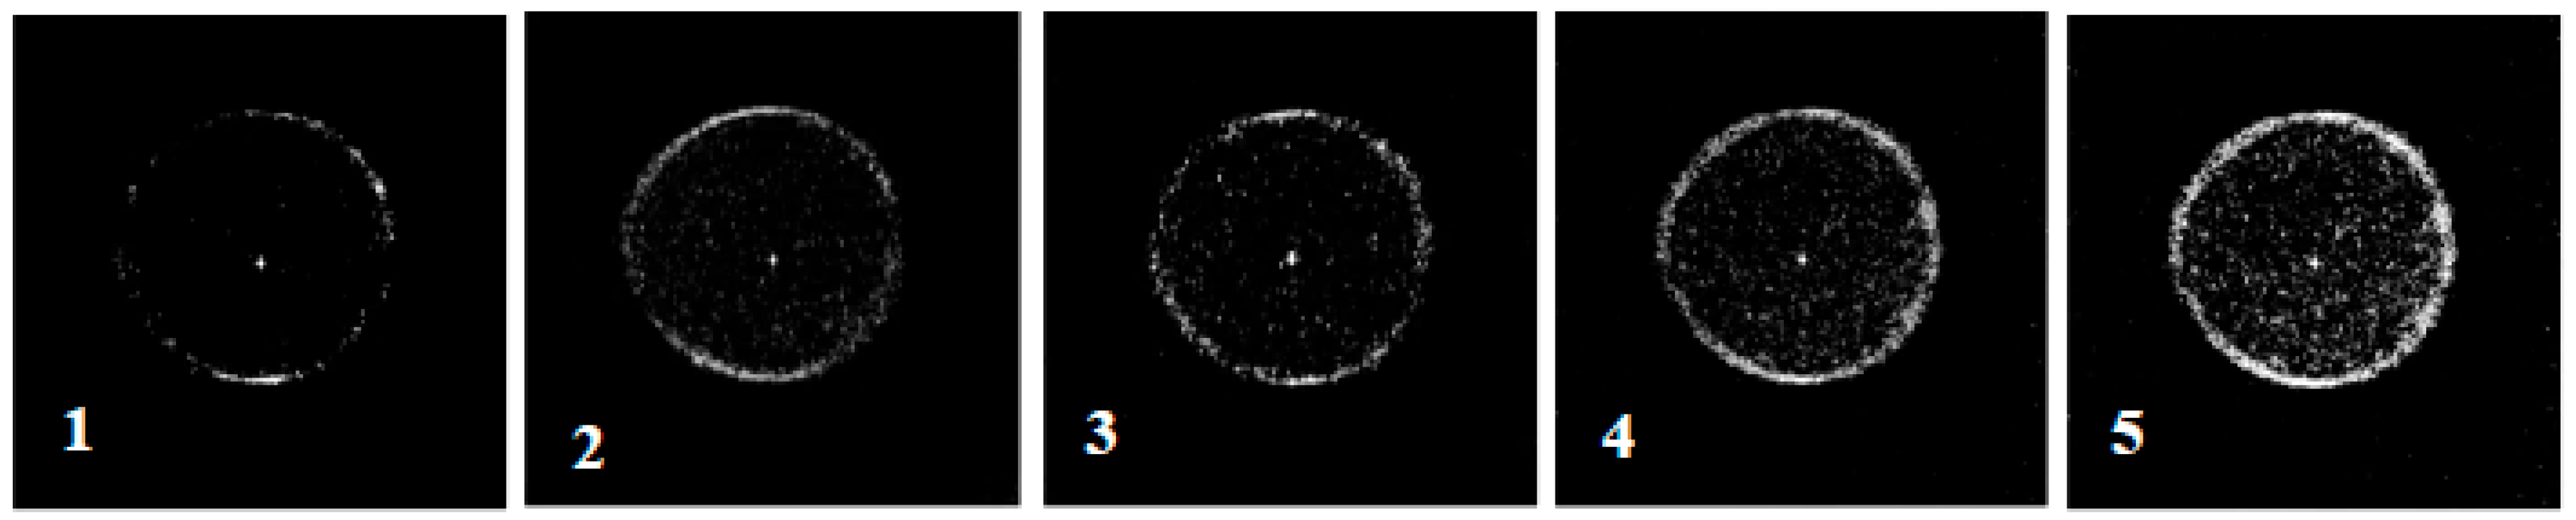
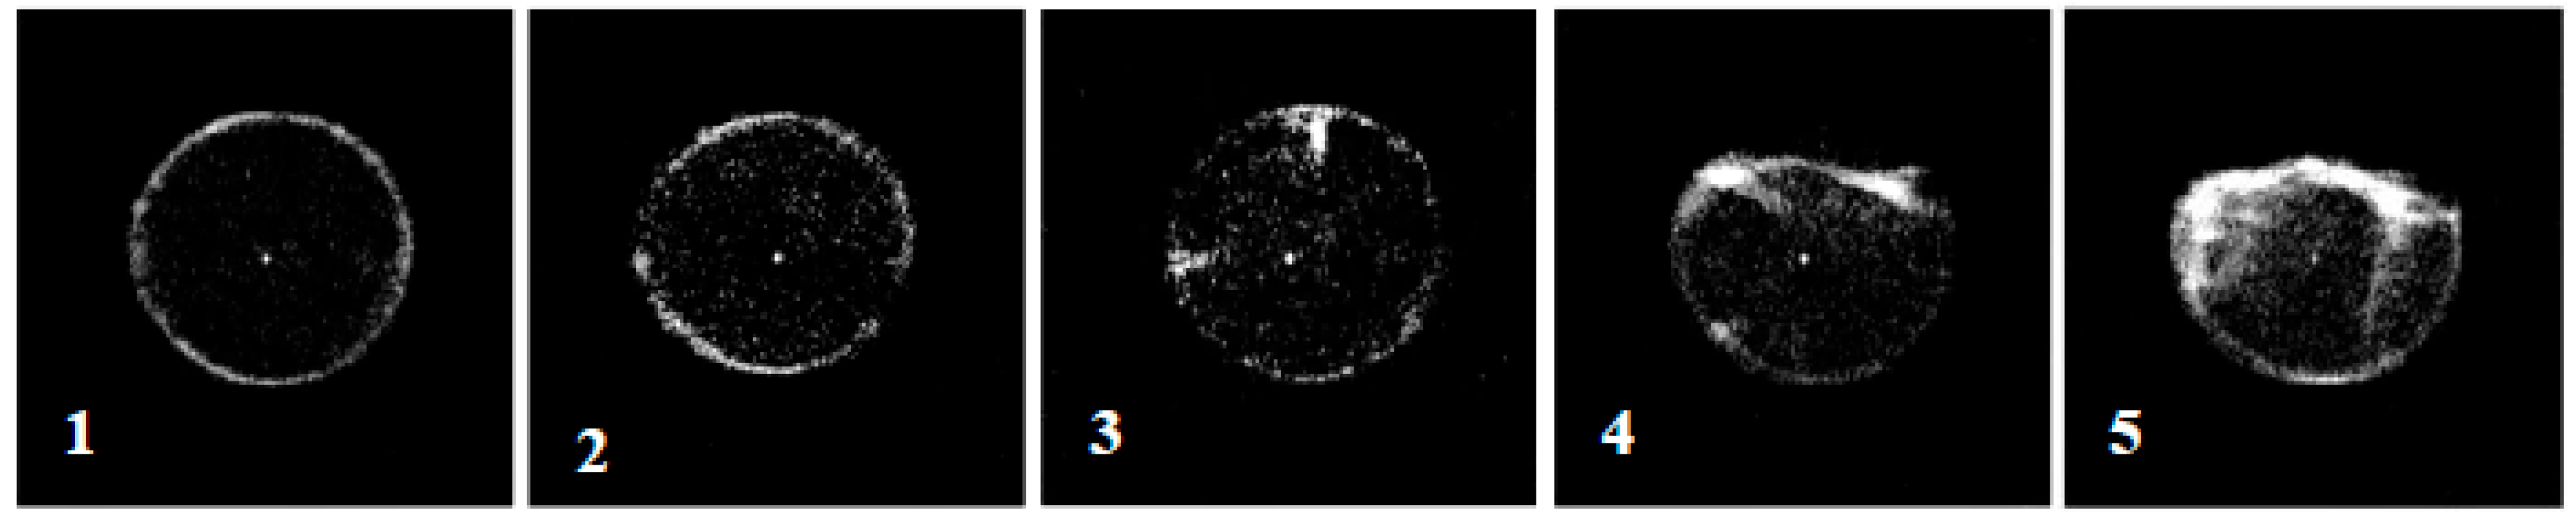
4.3. Magnetic Resonance Imaging Analysis

Figure 13 illustrate magnetic resonance imaging (hereinafter referred to as MRI) of multiple impacts after cyclic impact of rock samples with different moisture states. The number in the lower left corner of the picture represents the impact times.
From Figure 13, it can be observed that the dry rock sample has no damage or cracks under the five impacts. The white spots in the sample are more evenly distributed, and density of the white spots also increases with impact time. This phenomenon indicates that the rock pores are evenly distributed, and with an increase in the impact time, the pores are also more uniform. In the case of a short impact time, the pores of the water-containing and dry rock samples were basically the same, and the white spots were uniformly distributed inside the samples. However, cracks and damage were observed in the water-bearing rock samples after repeated impacts.
As illustrated in Figure 14 and Figure 15, a semi-saturated rock sample appears as a large white spot inside the sample after the fourth impact. This phenomenon indicates that there were cracks inside the rock at this time. The rocks were destroyed after the fifth impact. The MRI image indicates banded stripes on the damaged surface, and the stripes have larger brightness and size. This indicates that the impact led to the development of fractured surface cracks, resulting in increased porosity. At this moment, the white spots in the undamaged area of the sample were evenly distributed, and there were no obvious cracks in the undamaged area of the sample. After the third impact, two large white spots appeared in the saturated rock samples. At this time, the rock began to crack and was destroyed. After the fourth impact, the saturated sample was partially destroyed and the NMRI of the failure surface had a white mark. After the fifth impact, rock damage was further aggravated. The brightness and size of the white markings on the damaged surface also increased. There were also a few brightly colored markings inside the sample. This phenomenon indicates that rock damage was severe at this time. In addition to the cracks on the damaged surface, cracks with varying degrees of penetration appeared within the sample, thereby increasing the porosity.

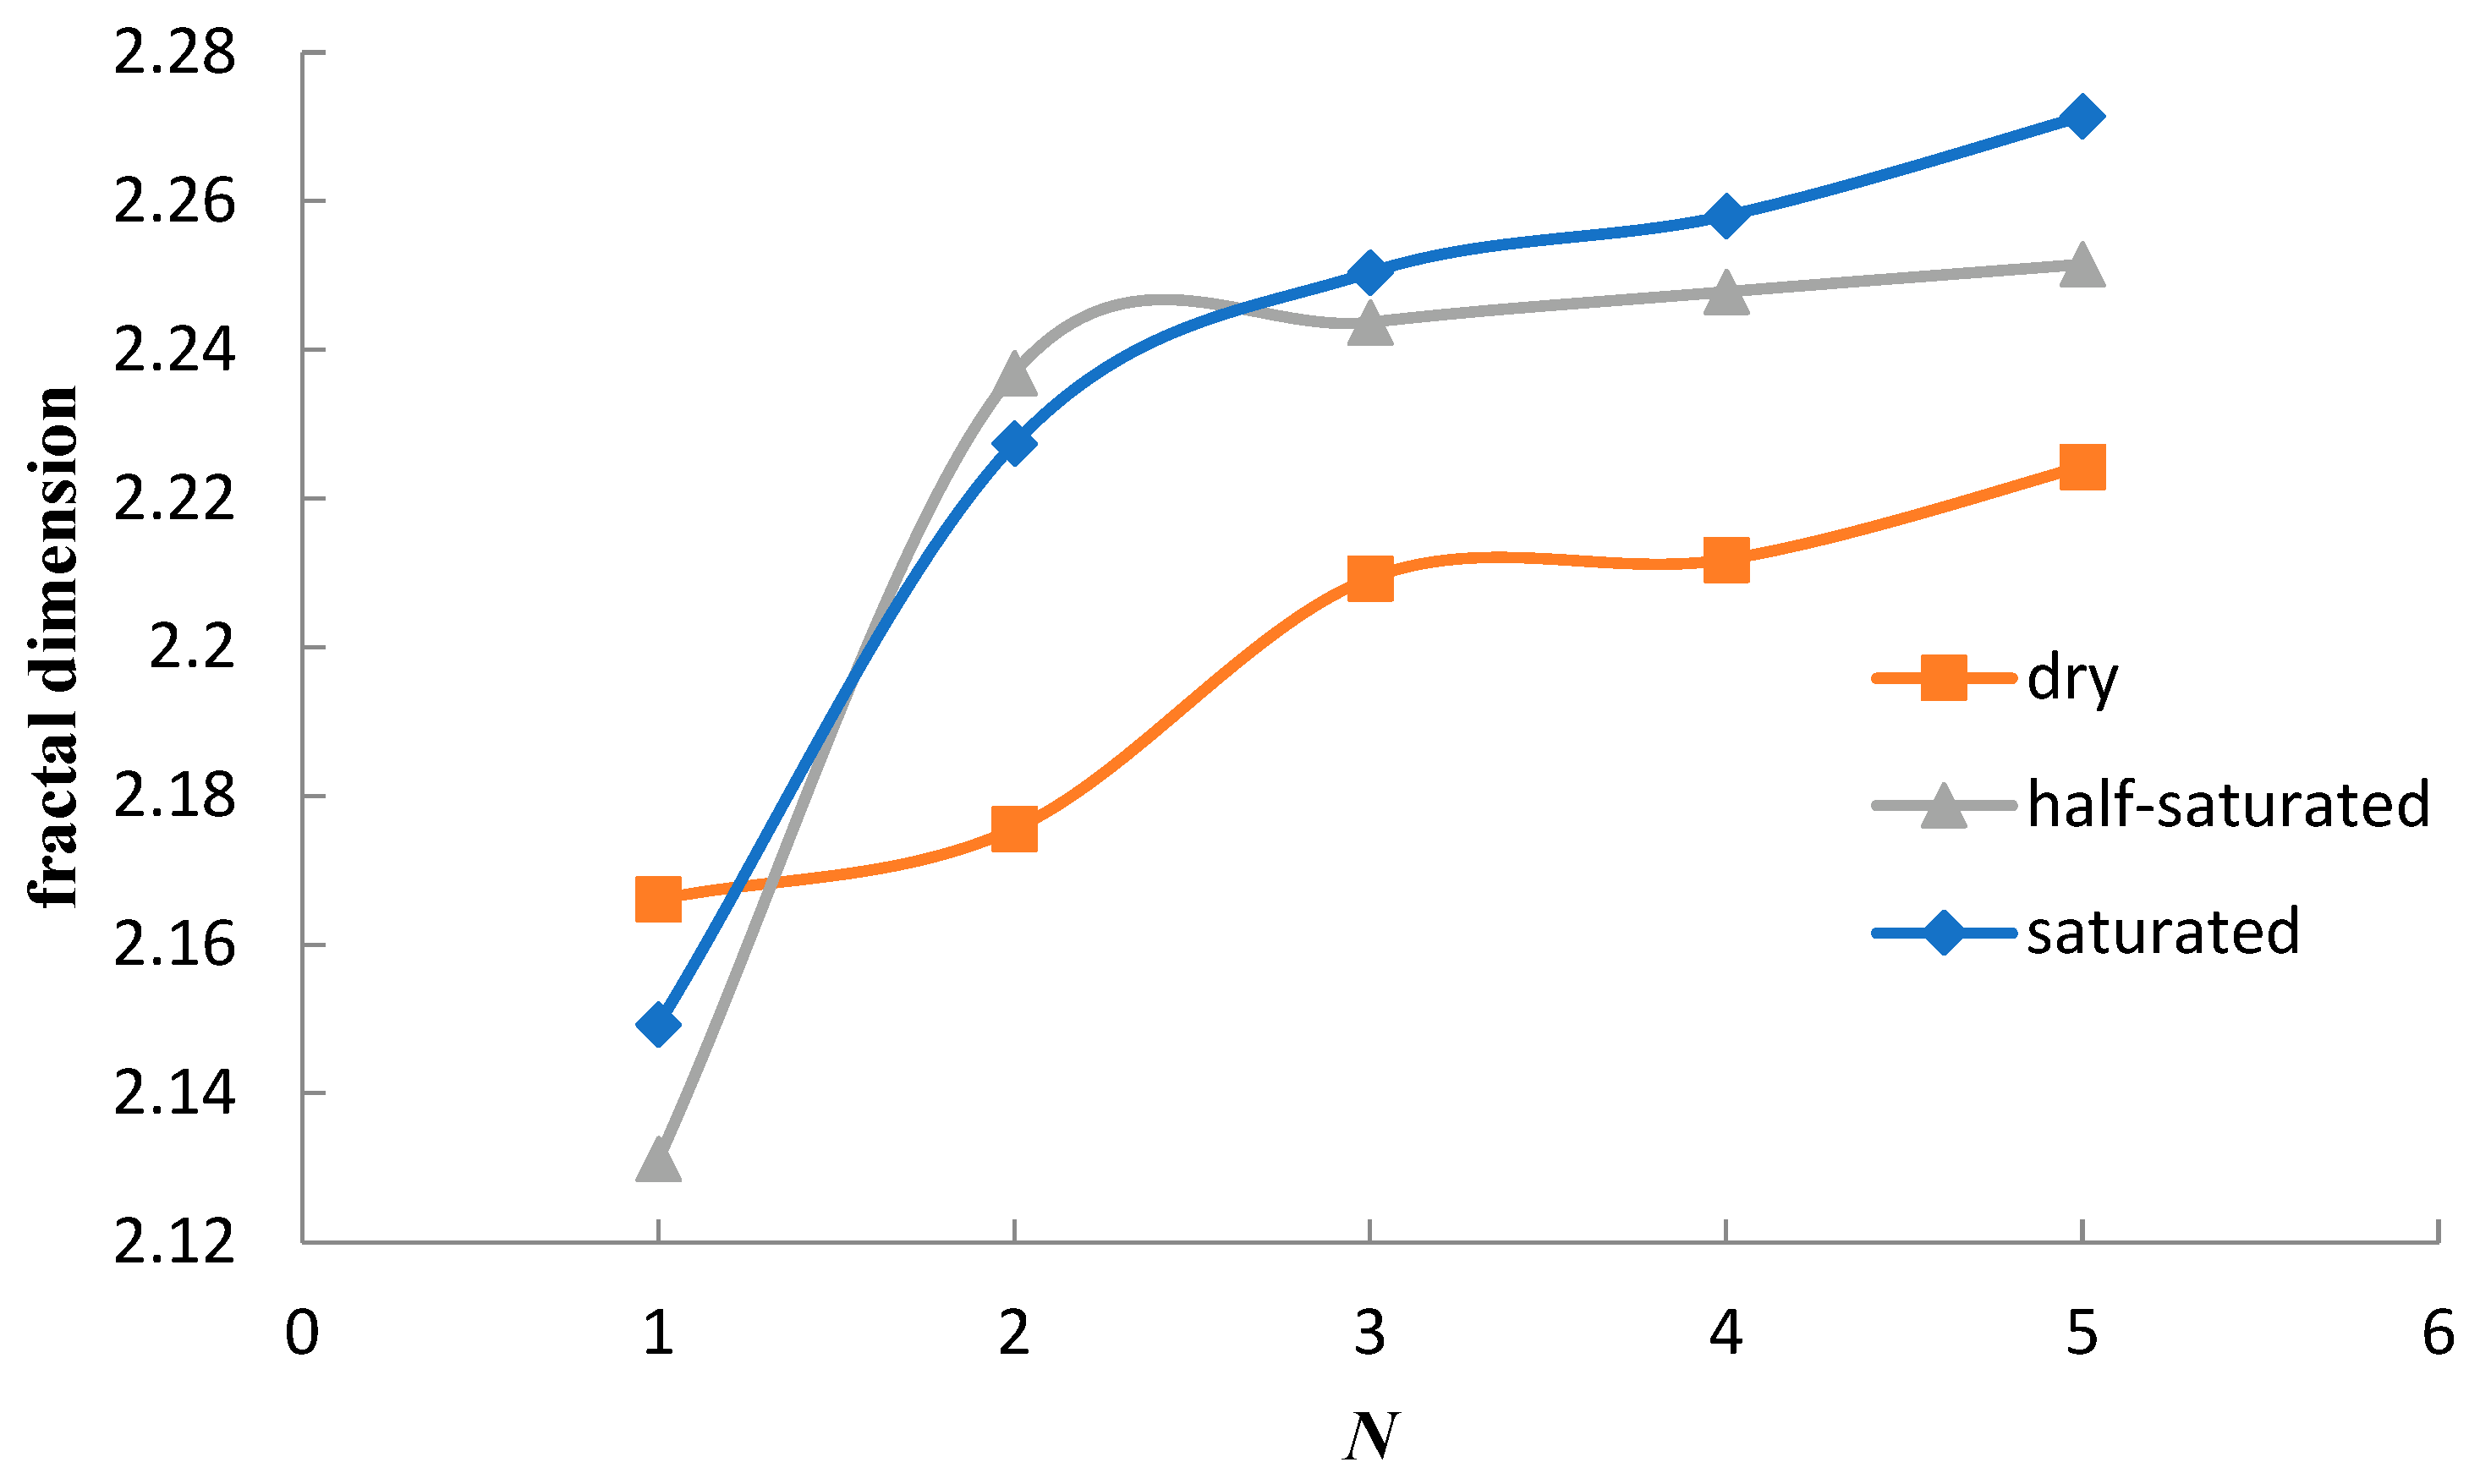
4.4. Fractal Analysis

Fractal analysis of the broken rock core sample was performed to establish the relationship between the fractal dimension, impacts, and δn. The curves are illustrated in Figure 16 and Figure 17.
From Figure 16 and Figure 17, it can be observed that the fractal dimension is positively proportional to the impact time and porosity change rate. Judging from the change trend of the curve in Figure 16, the impact times of dry rocks are approximately linearly related to the fractal dimension. After two impacts of water-bearing rocks, the change in fractal dimension was not obvious with an increase in the number of impacts. This indicates that after the second impact, the damage of the water-bearing rocks was relatively obvious, and change in pores was maximized; however, at this time, the rock can still maintain integrity and there will be no penetrating cracks inside it. After three impacts, the damage further expanded, and the crack ran through, resulting in a destructive effect.
According to Figure 17, all rocks began to have obvious inflection points during the third impact in the relationship curves of δn and fractal dimension. Owing to its high strength and relatively negligible destruction effect, the fractal dimension of dry rocks changed significantly after multiple impacts. For water-bearing rocks, the third impact caused evident damage cracks inside the rock. At this time, the internal stress underwent recombination and the relationship between the rock particles stabilized. The expansion and aggravation of the cracks caused more damage in the subsequent impact.

5. Conclusions

To study the mechanical response and damage evolution of rocks under cyclic dynamic loading and different moisture contents, as well as reduce or even eliminate the effects of other factors; dry, semi-saturated, and saturated sandstone specimens with different moisture contents were prepared via drying, water treatment, and maintenance. The SHPB system was utilized to perform five impact cycles on each rock sample, and an NMR system was employed to scan the rock samples after impact. A small energy impact was utilized in the test because it did not cause serious damage to the sample, which is also similar to real engineering. Compared with references [13,14,16] using an acoustic method to measure rock damage, NMR technology in this study can obtain the changes in rock pores intuitively; therefore, we can master the damage development law. Compared with the same type of research, this study has higher rigor and can obtain more realistic conclusions.
The results presented in this paper indicate that water negatively affects the mechanical properties of rocks; however, the studies in references [7,12] had different or even opposite results, concluding that an increased water content might enhance the dynamic properties of the rock. This phenomenon may be related to the small impact capacity employed in this study and perhaps is largely due to differences in the rocks.
By analyzing the damage properties of rocks, we observed that frequent impacts can cause intensification of rock damage. The images of the pores in this study present the projection of all the pores on one surface, which may lead to pore overlap, and therefore does not truly reflect the distribution of the pores, which is caused by technical limitations. Therefore, the fractal analysis of the images is not very accurate. Existing CT and NMR technologies can completely present the three-dimensional distribution of pores. However, few scholars have conducted in-depth research in this field. Therefore, the next step of this research is to analyze the damage properties of rocks from a three-dimensional perspective.
The main results are as follows:
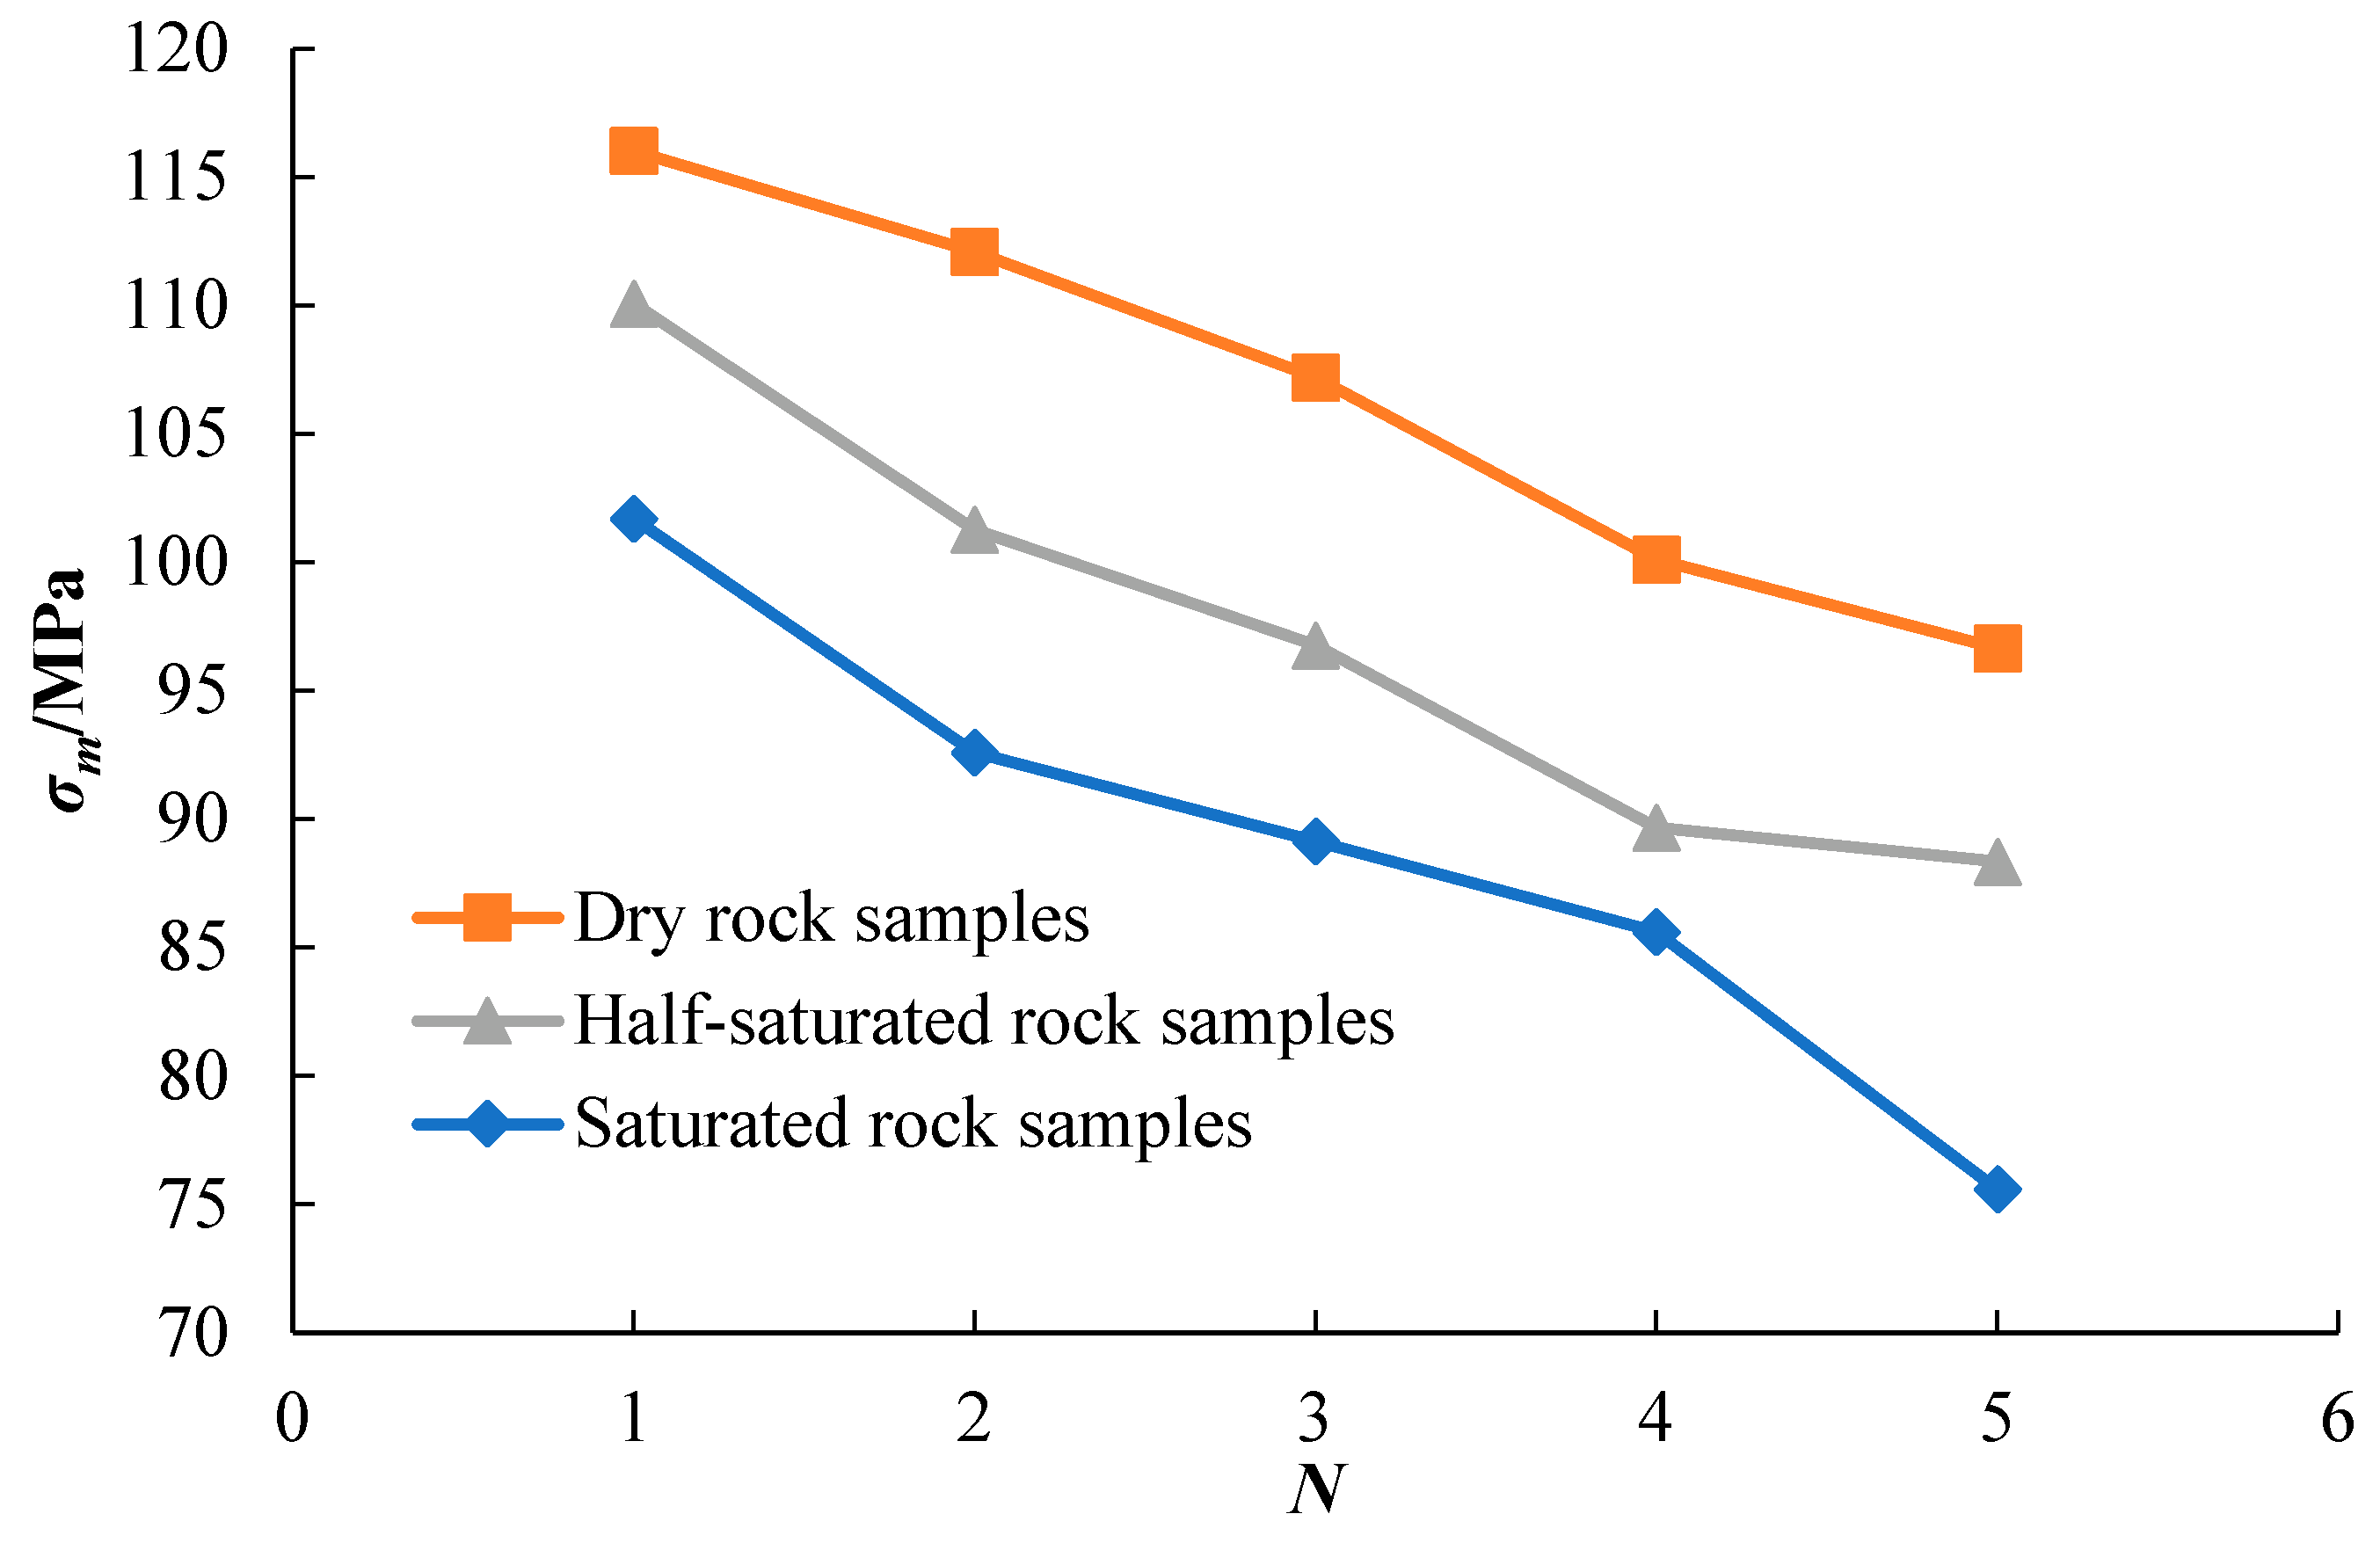
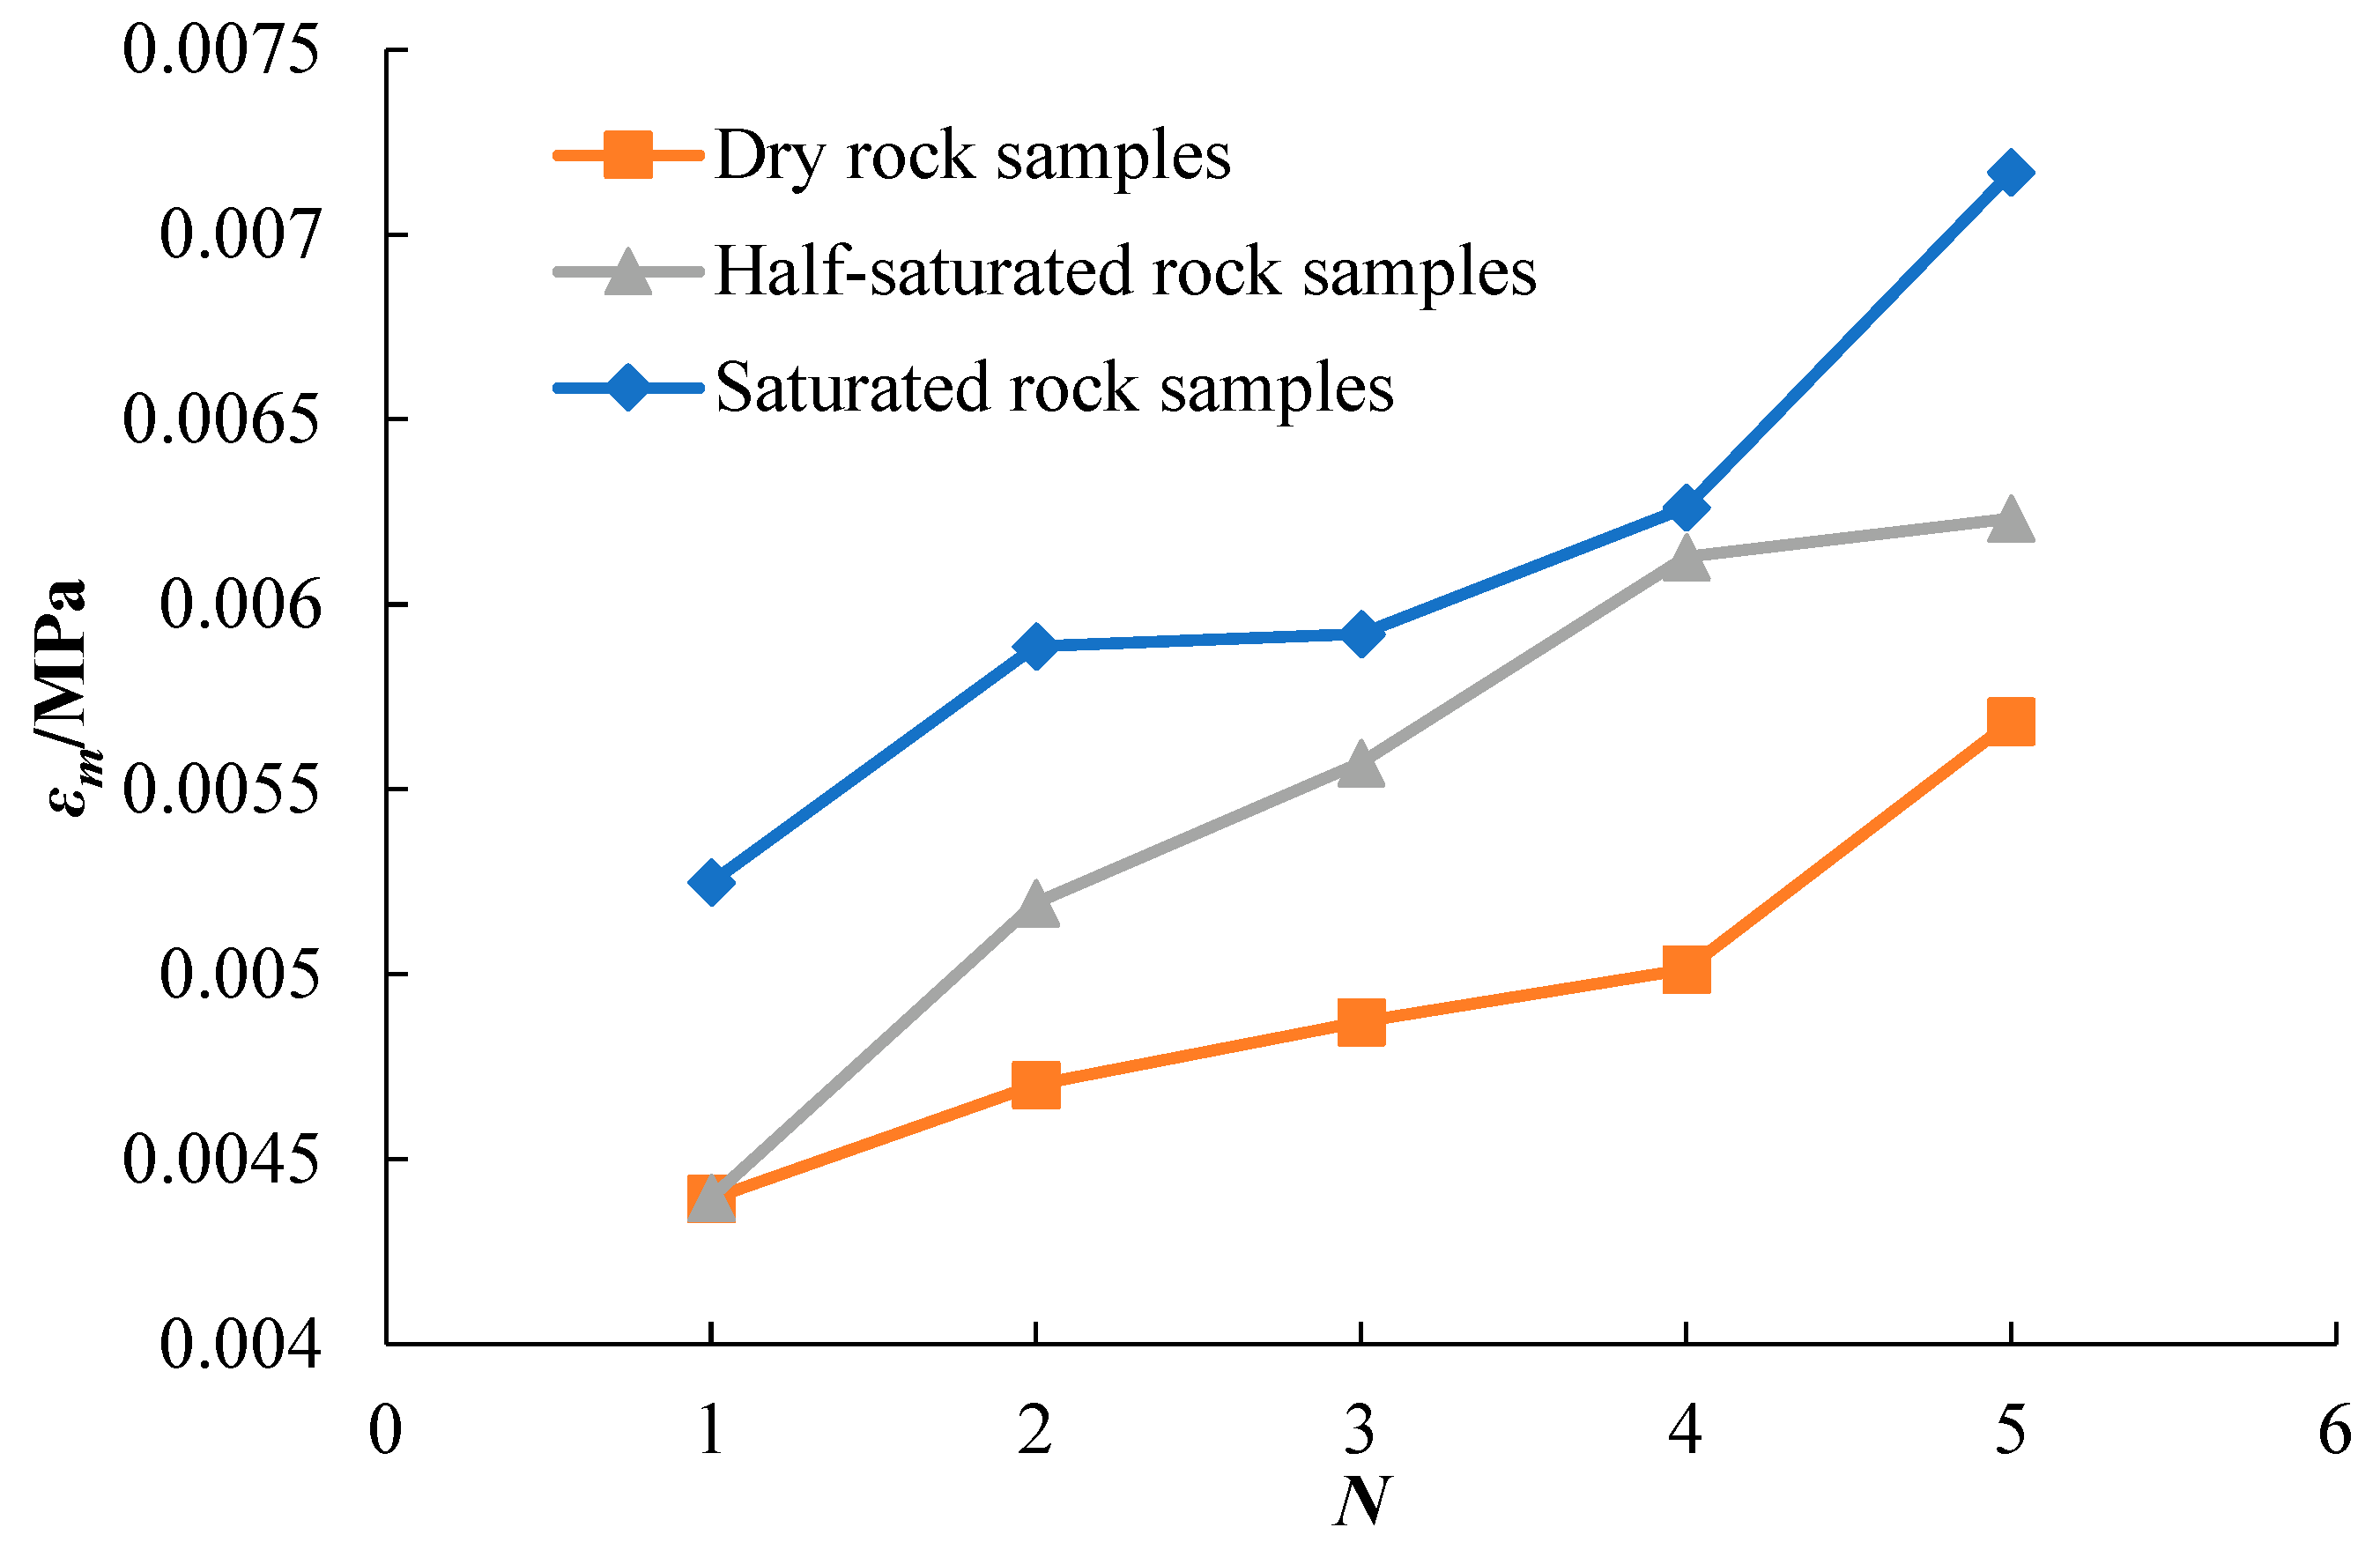
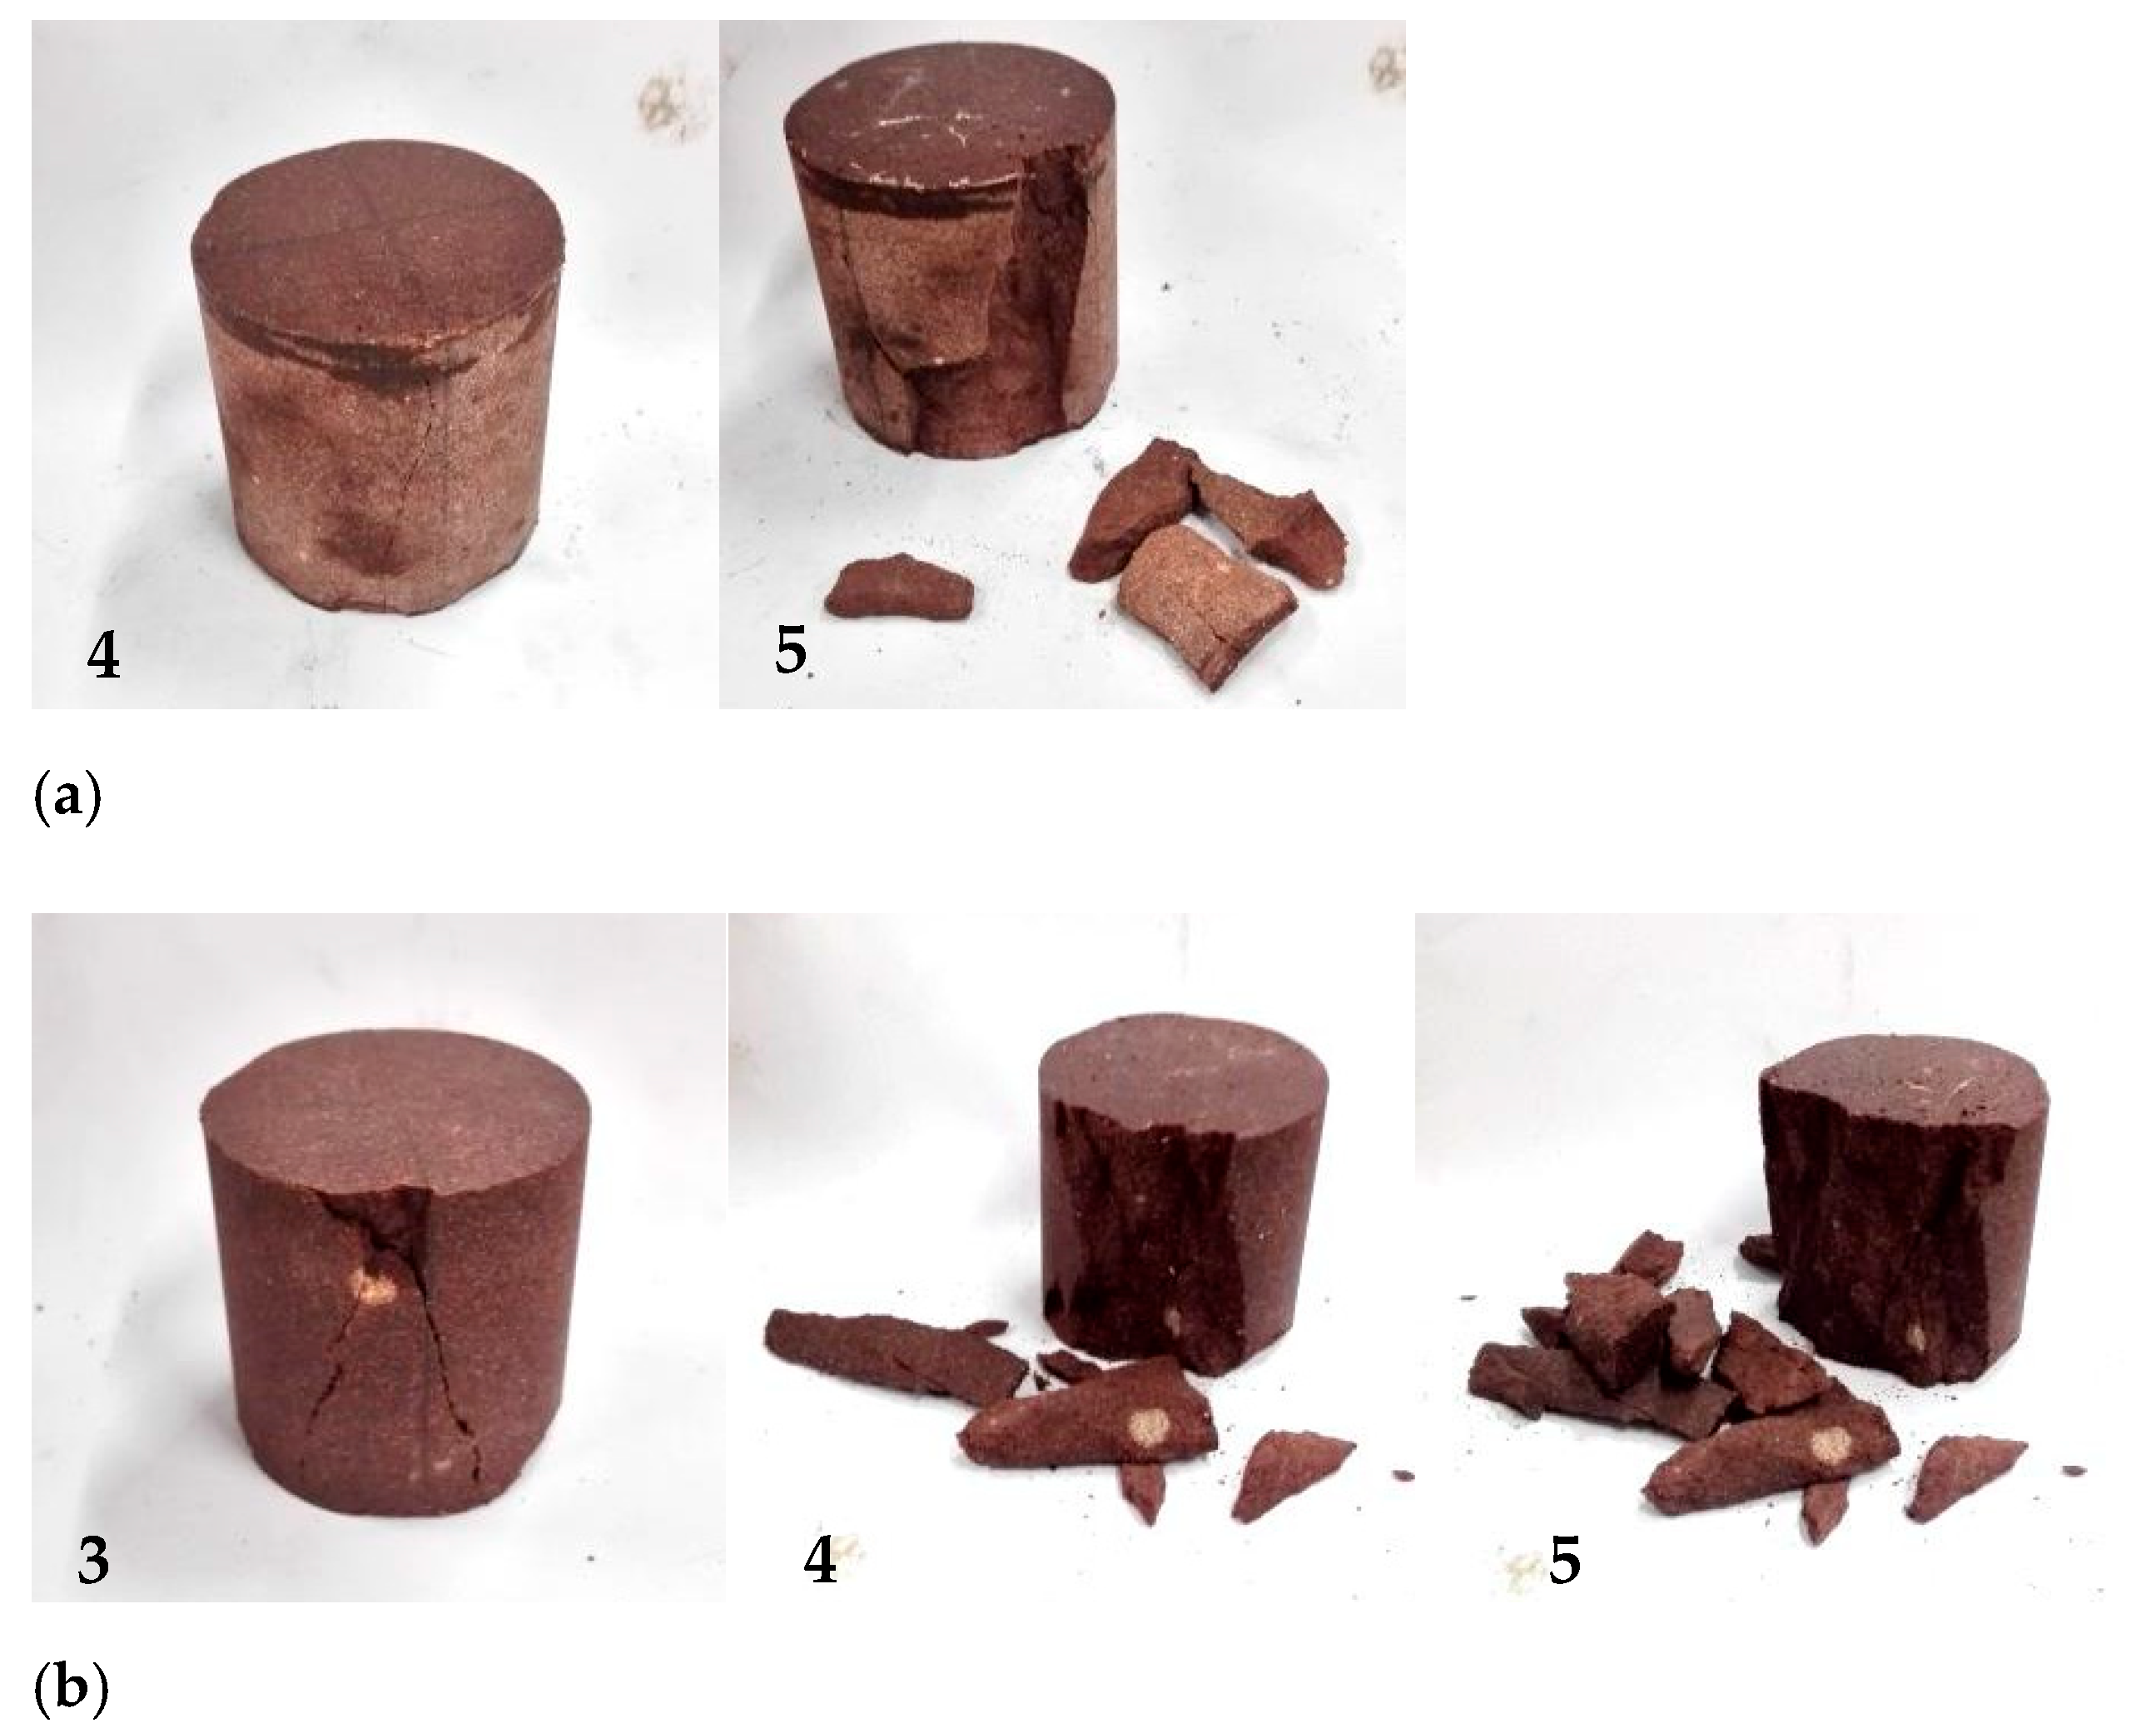
  • Dynamic cyclic compression impact tests on rocks indicate that, as the impact time increased, the stress-strain curve of the rock moved to the lower right. The stress and strain curves of all the rock samples appeared during the loading and unloading stages. The peak stress of the rock was inversely proportional to the impact time, and the relationship between the peak strain and impact time was contrary to the above relationship. This phenomenon indicates that with the accumulation of rock damage, rock deformation became increasingly severe and its strength gradually decreased. At the same impact energy and frequency, few obvious damages occurred in the dry rock, and the damage to the saturated rock was the most severe. When the impact reached the third time, there was a very obvious crack on the surface of the rock sample, and the more the impact time, the more serious the damage. Therefore, the influence of water content in the rock on the mechanical properties, especially the dynamic properties, was evident.
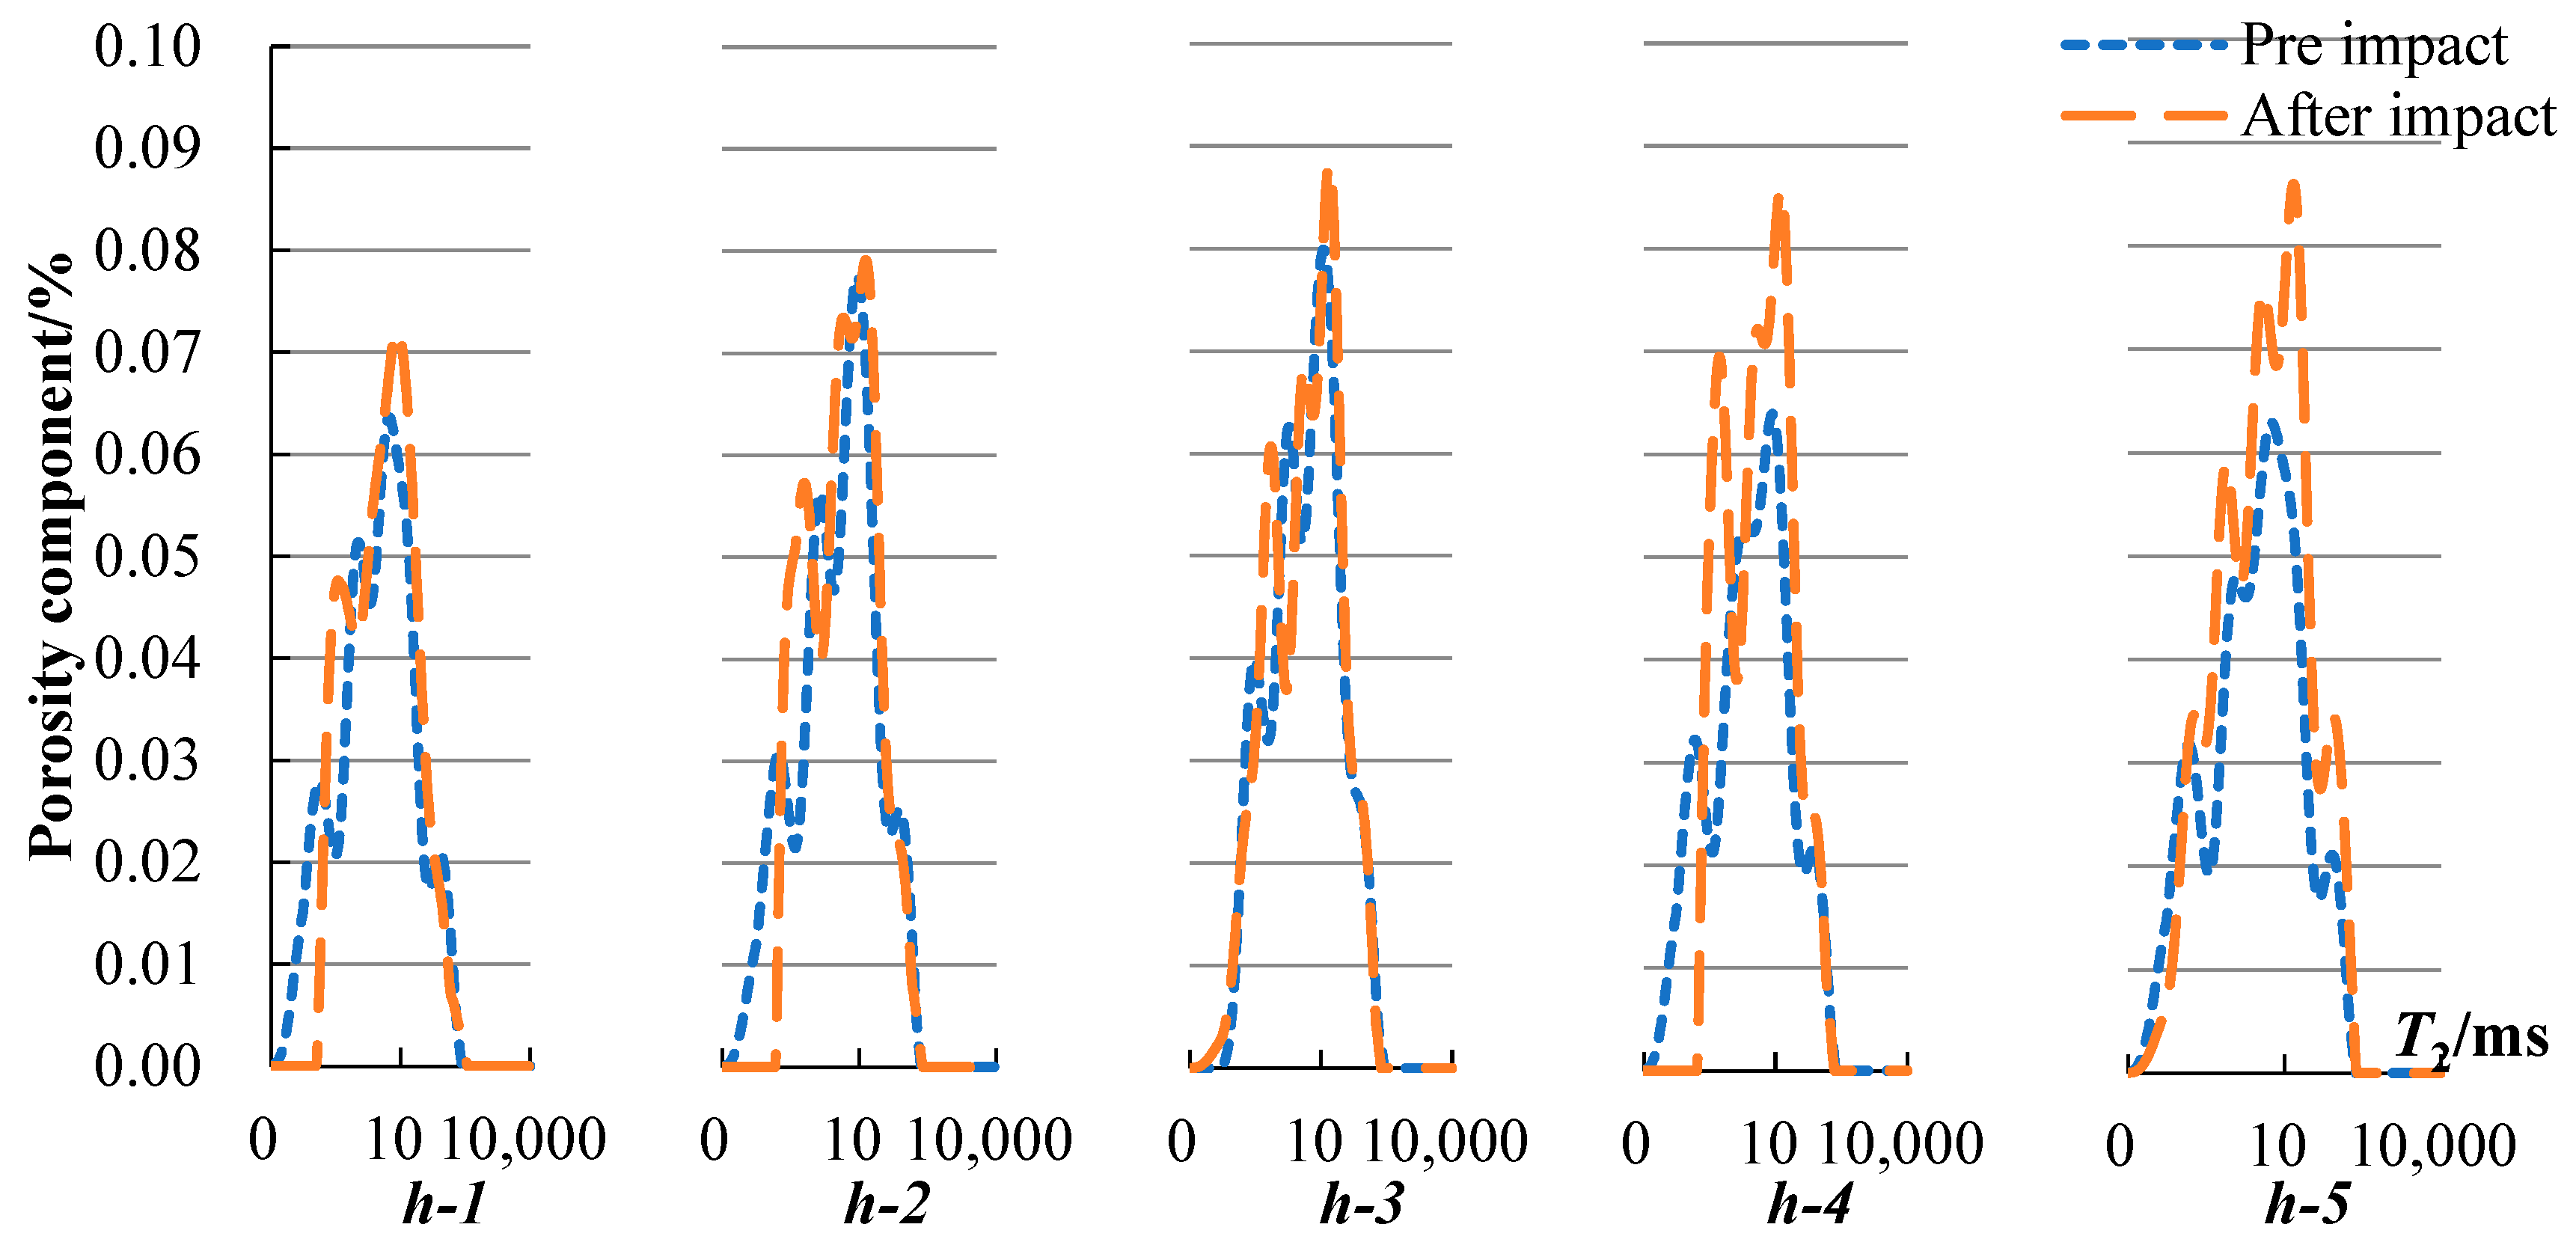
  • According to the NMR scan of rock samples subjected to dynamic disturbance, the peak value of the T2 spectrum curve of the rock sample increased, especially for the water-containing samples and those with more frequent impacts. Small pores with a relaxation time < 0.1 ms were still reduced after impact compared to before impact. The peaks of the large pores increased or even exceeded the peaks before the impact in the case of more impacts. The analysis of porosity changes indicates that the porosity change rate and impact times exhibited a quadratic polynomial relationship, and the porosity change rate increased with the increase in moisture content under impact times. From the MRI images, it was observed that the internal pores of the dry rock sample were evenly distributed, and the porosity change rate was relatively stable after multiple impacts. The semi-saturated and saturated rock samples suffered damage and cracks on the fourth and third impacts, respectively. As the impact time increased, the rock was destroyed, and streaks with white and bright features appeared on the failure surface. In addition to streaks on the damaged surface of the saturated sample, several white markings also appeared inside the sample. This phenomenon indicates that there were obvious cracks inside the sample, and this was also confirmed by the fractal analysis. After 2–3 impacts on the sample, the internal pores reached equilibrium. If the impact continues, a pore will be formed internally. In the initial stage of penetration, a macrocrack was not formed. Continuous impact will form an obvious penetrating crack and lead to destruction.

Author Contributions

Conceptualization, F.C.; methodology, D.L.; software, G.Z.; validation, X.Z.; formal analysis, G.Z.; investigation, F.C.; resources, D.L.; data curation, H.Y.; writing—original draft preparation, F.C.; writing—review and editing, X.Z.; visualization, H.Y.; supervision, F.C.; project administration, F.C.; funding acquisition, F.C., X.Z., G.Z. All authors have read and agreed to the published version of the manuscript.

Funding

This research was funded by [X.Z.] grant number [ZR2020ME098] and [G.Z.] grant number [ZR2019BEE078] and The APC was funded by [F.C.].

Institutional Review Board Statement

The study did not require ethical approval.

Informed Consent Statement

Informed consent was obtained from all subjects involved in the study.

Data Availability Statement

The study did not report any data.

Conflicts of Interest

The authors declare no conflict of interest.

Abbreviations

MRIMagnetic resonance imaging
NMRNuclear magnetic resonance
SHPBSplit Hopkinson pressure bar
T2Transverse relaxation time
mwWeight of rock specimen (kg)
msWeight of dry rock (kg)
ωsRock moisture content
ωsaMoisture content of rock under saturation conditions
KωRock saturation coefficient
mpWeight of sample before the test (kg)
K ω ¯ Average saturation coefficient of rock
σ Stress (MPa)
σ m Peak stress (MPa)
ε Strain
ε m Peak strain
NImpact times
R2Goodness of fit
naPorosity before sample is impacted
nbPorosity after sample is impacted
δnPorosity change rate

References

  1. Yang, X.L. Discussion on damage effect on surrounding rock mass in tunneling blasting. Blasting 2003, 20, 19–23. [Google Scholar]
  2. Ramulu, M.; Chakraborty, A.K.; Sitharam, T.G. Damage assessment of basaltic rock mass due to repeated blasting in a railway tunnelling project—A case study. Tunn. Undergr. Space Technol. 2009, 24, 208–221. [Google Scholar] [CrossRef]
  3. Jong, H.S.; Hoon, G.M.; Sung, E.C. Effect of blast-induced vibration on existing tunnels in soft rocks. Tunn. Undergr. Space Technol. 2011, 26, 51–61. [Google Scholar]
  4. Wang, Z.L.; Li, Y.C.; Wang, J.G. Numerical analysis of blast-induced wave propagation and spalling damage in a rock plate. Int. J. Rock Mech. Min. Sci. 2008, 45, 600–608. [Google Scholar] [CrossRef]
  5. Kaushik, D.; Murthy, V.M.S.R. Prediction of blast-induced overbreak from uncontrolled bum-cut blasting in tunnels driven through medium rock class. Tunn. Undergr. Space Technol. 2012, 28, 49–56. [Google Scholar]
  6. Lv, X.C.; Xu, J.Y.; Ge, H.H.; Zhao, D.H.; Bai, E.L. Effects of confining pressure on mechanical behaviors of sandstone under dynamic impact loads. Chin. J. Rock Mech. Eng. 2010, 29, 193–201. [Google Scholar]
  7. Yuan, P.; Ma, R.Q. Analysis on energy absorption of rock under various water absorption contents in SHPB test. Acta Armamentarii 2013, 34 (Suppl. 1), 328–332. [Google Scholar]
  8. Yuan, P.; Ma, Q.Y. Split Hopkinson pressure bar tests on sandstone in coalmine under cyclic wetting and drying. Rock Soil Mech. 2013, 34, 2557. [Google Scholar]
  9. Yuan, P.; Ma, R.Q. Split Hopkinson pressure bar tests and analysis of coalmine sandstone with various moisture contents. Chin. J. Rock Mech. Eng. 2015, 34 (Suppl. 1), 2888. [Google Scholar]
  10. Rubin, A.M.; Ahrens, T.J. Dynamic tensile-failure-induced velocity deficits in rock. Geophys. Res. Lett. 1991, 18, 219. [Google Scholar] [CrossRef] [Green Version]
  11. Lou, W.T. Dynamic fracture behaviour of dry and waterlogged granites. Combust. Explos. Shock Waves 1994, 14, 249. [Google Scholar]
  12. Wang, B.; Li, X.B.; Yin, T.B.; Ma, C.D.; Yin, Z.Q.; Li, Z.G. Split Hopkinson pressure bar (SHPB) experiments on dynamic strength of water-saturated sandstone. Chin. J. Rock Mech. Eng. 2010, 29, 1003. [Google Scholar]
  13. Li, D.Y.; Sun, X.L.; Zhou, Z.L.; Cai, X.; Qiu, J.D. On the dynamic accumulated damage characteristics of granite subjected to repeated impact load action. J. Exp. Mech. 2016, 31, 827–835. [Google Scholar]
  14. Mei, N.F. Research on Fatigue Damage and Mechanical Characteristics of Brittle Rock under Cycle Dynamic Loading. Master’s Thesis, China University of Geosciences, Wuhan, China, 2014. [Google Scholar]
  15. Zhu, J.J. Experimental Study of Rock Mechanical Properties and Damage Model under Cyclical Dynamic Loads. Master’s Thesis, Central South University, Changsha, China, 2012. [Google Scholar]
  16. Jin, J.F. Study on Rock Mechanical Properties under Coupled Static-Cyclic Impact Loading. Ph.D. Thesis, Central South University, Changsha, China, 2012. [Google Scholar]
  17. Vsevolod, B.; Volodymyr, B. Fractional-Fractal Modeling of Filtration-Consolidation Processes in Saline Saturated Soils. Fractal Fract. 2020, 4, 59. [Google Scholar]
  18. Ullah, A.S.; D’Addona, D.M.; Seto, Y.; Yonehara, S.; Kubo, A. Utilizing Fractals for Modeling and 3D Printing of Porous Structures. Fractal Fract. 2021, 5, 40. [Google Scholar] [CrossRef]
  19. Malyk, I.V.; Gorbatenko, M.; Chaudhary, A.; Sharma, S.; Dubey, R.S. Numerical Solution of Nonlinear Fractional Diffusion Equation in Framework of the Yang–Abdel–Cattani Derivative Operator. Fractal Fract. 2021, 5, 64. [Google Scholar] [CrossRef]
  20. He, S.H.; Ding, Z.; Hu, H.B.; Gao, M. Effect of Grain Size on Microscopic Pore Structure and Fractal Characteristics of Carbonate-Based Sand and Silicate-Based Sand. Fractal Fract. 2021, 5, 152. [Google Scholar] [CrossRef]
  21. Peroni, M.; Solomos, G.; Pizzinato, V. Impact behaviour testing of aluminium foam. Int. J. Impact Eng. 2013, 53, 74–83. [Google Scholar] [CrossRef]
  22. Zhang, H.; Gao, Y.; Li, F.; Lu, F.; Sun, H. Experimental study on dynamic properties and constitutive model of polypropylene fibre concrete under high-strain rates. Eur. J. Environ. Civ. Eng. 2013, 17, 294–303. [Google Scholar] [CrossRef]
  23. Corporation, H.P. Wave dispersion and attenuation in viscoelastic split hopkinson pressure bar. Shock Vib. 2013, 5, 307–315. [Google Scholar]
  24. Rougier, E.; Knight, E.E.; Broome, S.T.; Sussman, A.J.; Munjiza, A. Validation of a three-dimensional finite-discrete element method using experimental results of the split hopkinson pressure bar test. Int. J. Rock Mech. Min. Sci. 2014, 70, 101–108. [Google Scholar] [CrossRef]
  25. Tan, L.; Ren, T.; Dou, L.; Cai, X.; Yang, X.; Zhou, Q. Dynamic response and fracture evolution of marble specimens containing rectangular cavities subjected to dynamic loading. Bull. Eng. Geol. Environ. 2021, 80, 7701–7716. [Google Scholar] [CrossRef]
  26. Chu, F.J.; Liu, D.W.; Tao, M.; Peng, H.D. Dynamic damage laws of sandstone under different water bearing conditions based on nuclear magnetic resonance. Chin. J. Eng. 2017, 40, 144–151. [Google Scholar]
Figure 1. Maintenance of sample package.
Fractalfract 06 00226 g001
Figure 2. Stress-strain curves of dry samples.
Fractalfract 06 00226 g002
Figure 3. Stress-strain curves of half-saturated samples.
Fractalfract 06 00226 g003
Figure 4. Stress-strain curves of saturated samples.
Fractalfract 06 00226 g004
Figure 5. Typical stress-strain curves.
Fractalfract 06 00226 g005
Figure 6. Peak stress variation trend (   σ m : peak stress; N: impact times).
Fractalfract 06 00226 g006
Figure 7. Peak strain variation trend (   ε m : peak strain).
Fractalfract 06 00226 g007
Figure 8. Failure form of rock samples. (a) Semisaturated sample. (b) Saturated samples.
Fractalfract 06 00226 g008
Figure 9. T2 spectrum curves of dry samples.
Fractalfract 06 00226 g009
Figure 10. T2 spectrum curves of half-saturated samples.
Fractalfract 06 00226 g010
Figure 11. T2 spectrum curves of saturated samples.
Fractalfract 06 00226 g011
Figure 12. The relationship curve of porosity change rate—impact times.
Fractalfract 06 00226 g012
Figure 13. Pore images of dry rock samples.
Fractalfract 06 00226 g013
Figure 14. Pore images of half-saturated rock samples.
Fractalfract 06 00226 g014
Figure 15. Pore images of saturated rock samples.
Fractalfract 06 00226 g015
Figure 16. The relationship curve of fractal dimension—impact times.
Fractalfract 06 00226 g016
Figure 17. The relationship curve of fractal dimension—δn.
Fractalfract 06 00226 g017
Table 1. Rock specimen saturation.
Sample Namems/gmp/gKω K ω ¯
d-1229.31229.483.00%2.61%
d-2227.37227.52.45%
d-3231.6231.752.96%
d-4227.06227.172.11%
d-5230.46230.592.54%
h-1227.36230.2255.86%54.04%
h-2222.19225.0153.92%
h-3230.25233.1856.56%
h-4232.02234.9653.36%
h-5231.92234.5750.48%
s-1225.59230.89100.00%100.00%
s-2229.51234.67100.00%
s-3227.41232.69100.00%
s-4229.96235.31100.00%
s-5229.63235.11100.00%
Table 2. Relationship between σ m , ε m , and N.
Rock Type σ m N ε m N
Dry σ m d = −5.0727 N + 121.63
(R2 = 0.9888)
ε m d = 0.0003 N + 0.0041
(R2 = 0.9107)
Half-saturated σ m h = −5.5056 N + 113.74
(R2 = 0.9544)
ε m h = 0.0005 N + 0.0041
(R2 = 0.9441)
Saturated σ m s = −5.9221 N + 106.69
(R2 = 0.9591)
ε m s = 0.0004 N + 0.0048
(R2 = 0.9016)
R2: goodness of fit.
Table 3. Rock sample porosity.
Sample Namena/%nb/%δn/%
d-14.224.343.06
d-24.564.713.29
d-34.344.534.47
d-44.454.807.92
d-54.374.8911.81
h-14.344.565.09
h-24.694.945.20
h-34.845.136.10
h-44.345.0917.24
h-54.305.6531.31
s-14.765.3612.76
s-24.655.3715.44
s-34.275.1420.29
s-44.586.1233.56
s-54.578.2981.49
Publisher’s Note: MDPI stays neutral with regard to jurisdictional claims in published maps and institutional affiliations.

