
CNN-Based Framework for Classifying COVID-19, Pneumonia, and Normal Chest X-Rays

 ,
,  ,
,  , and
, and 
Abstract
1. Introduction
2. Related Work
3. Proposed Framework
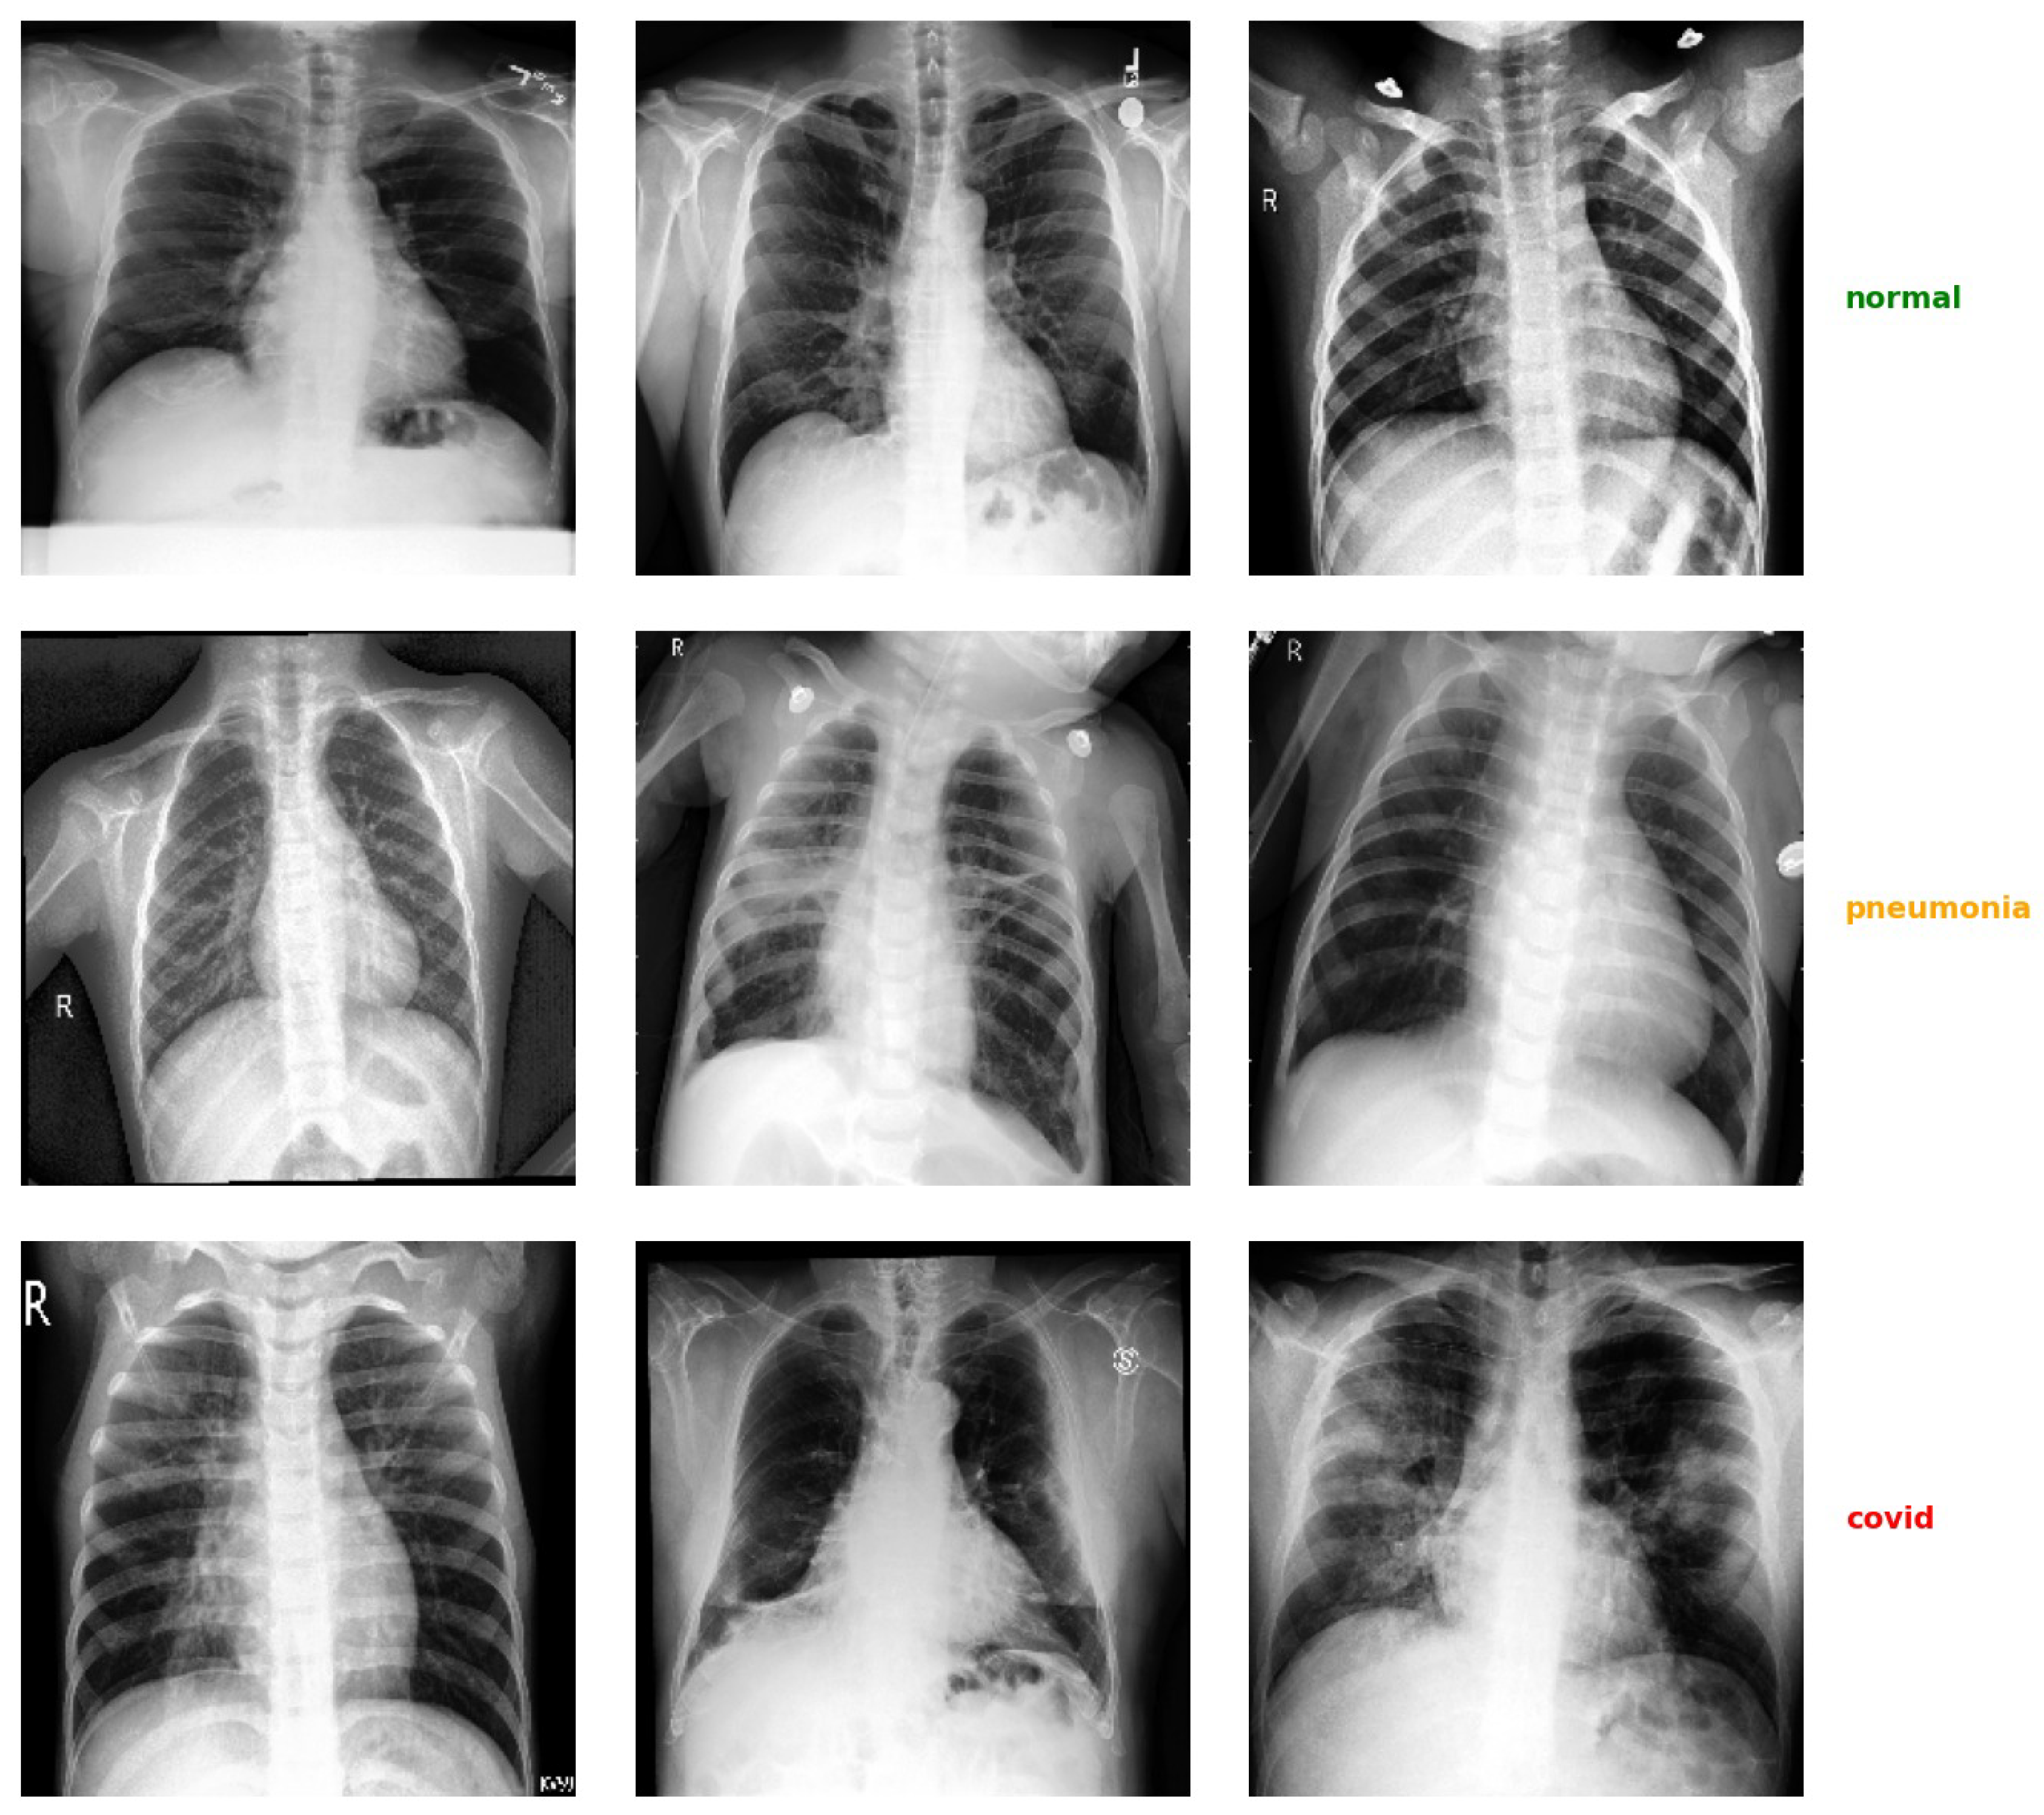
3.1. Dataset
3.2. Data Pre-Processing
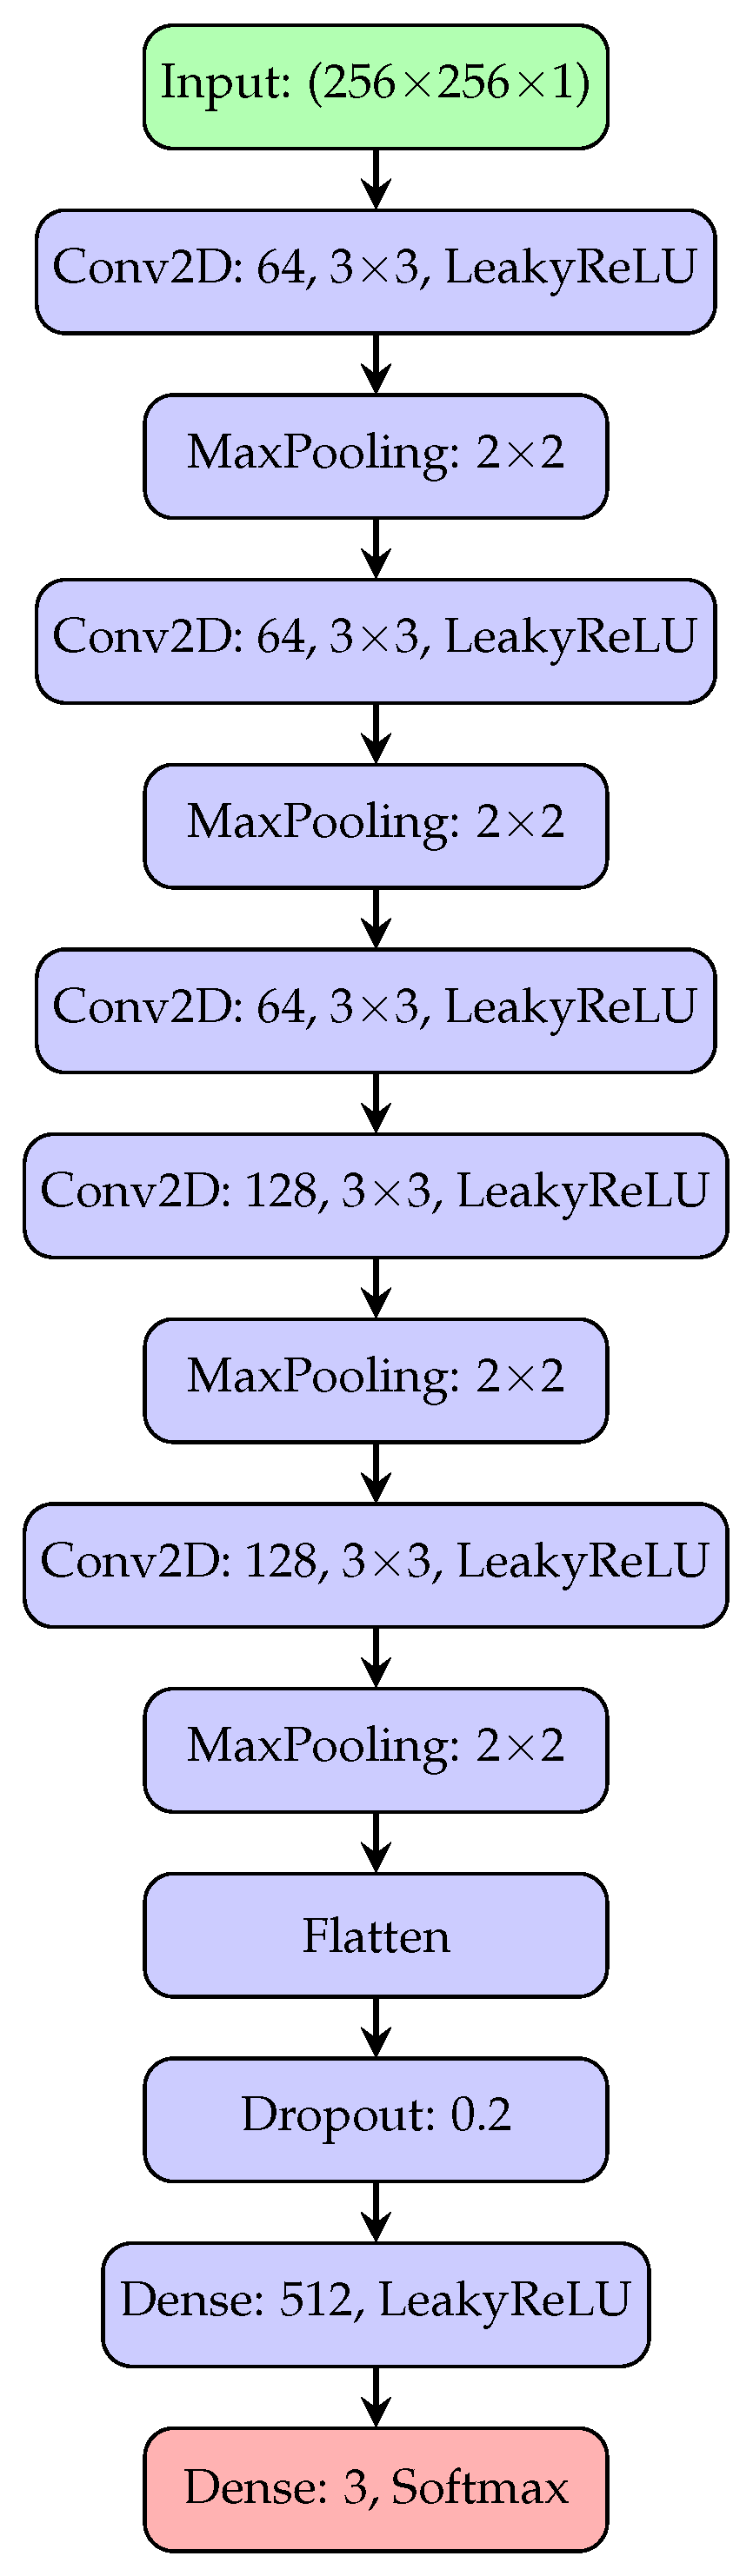
3.3. Network Architecture
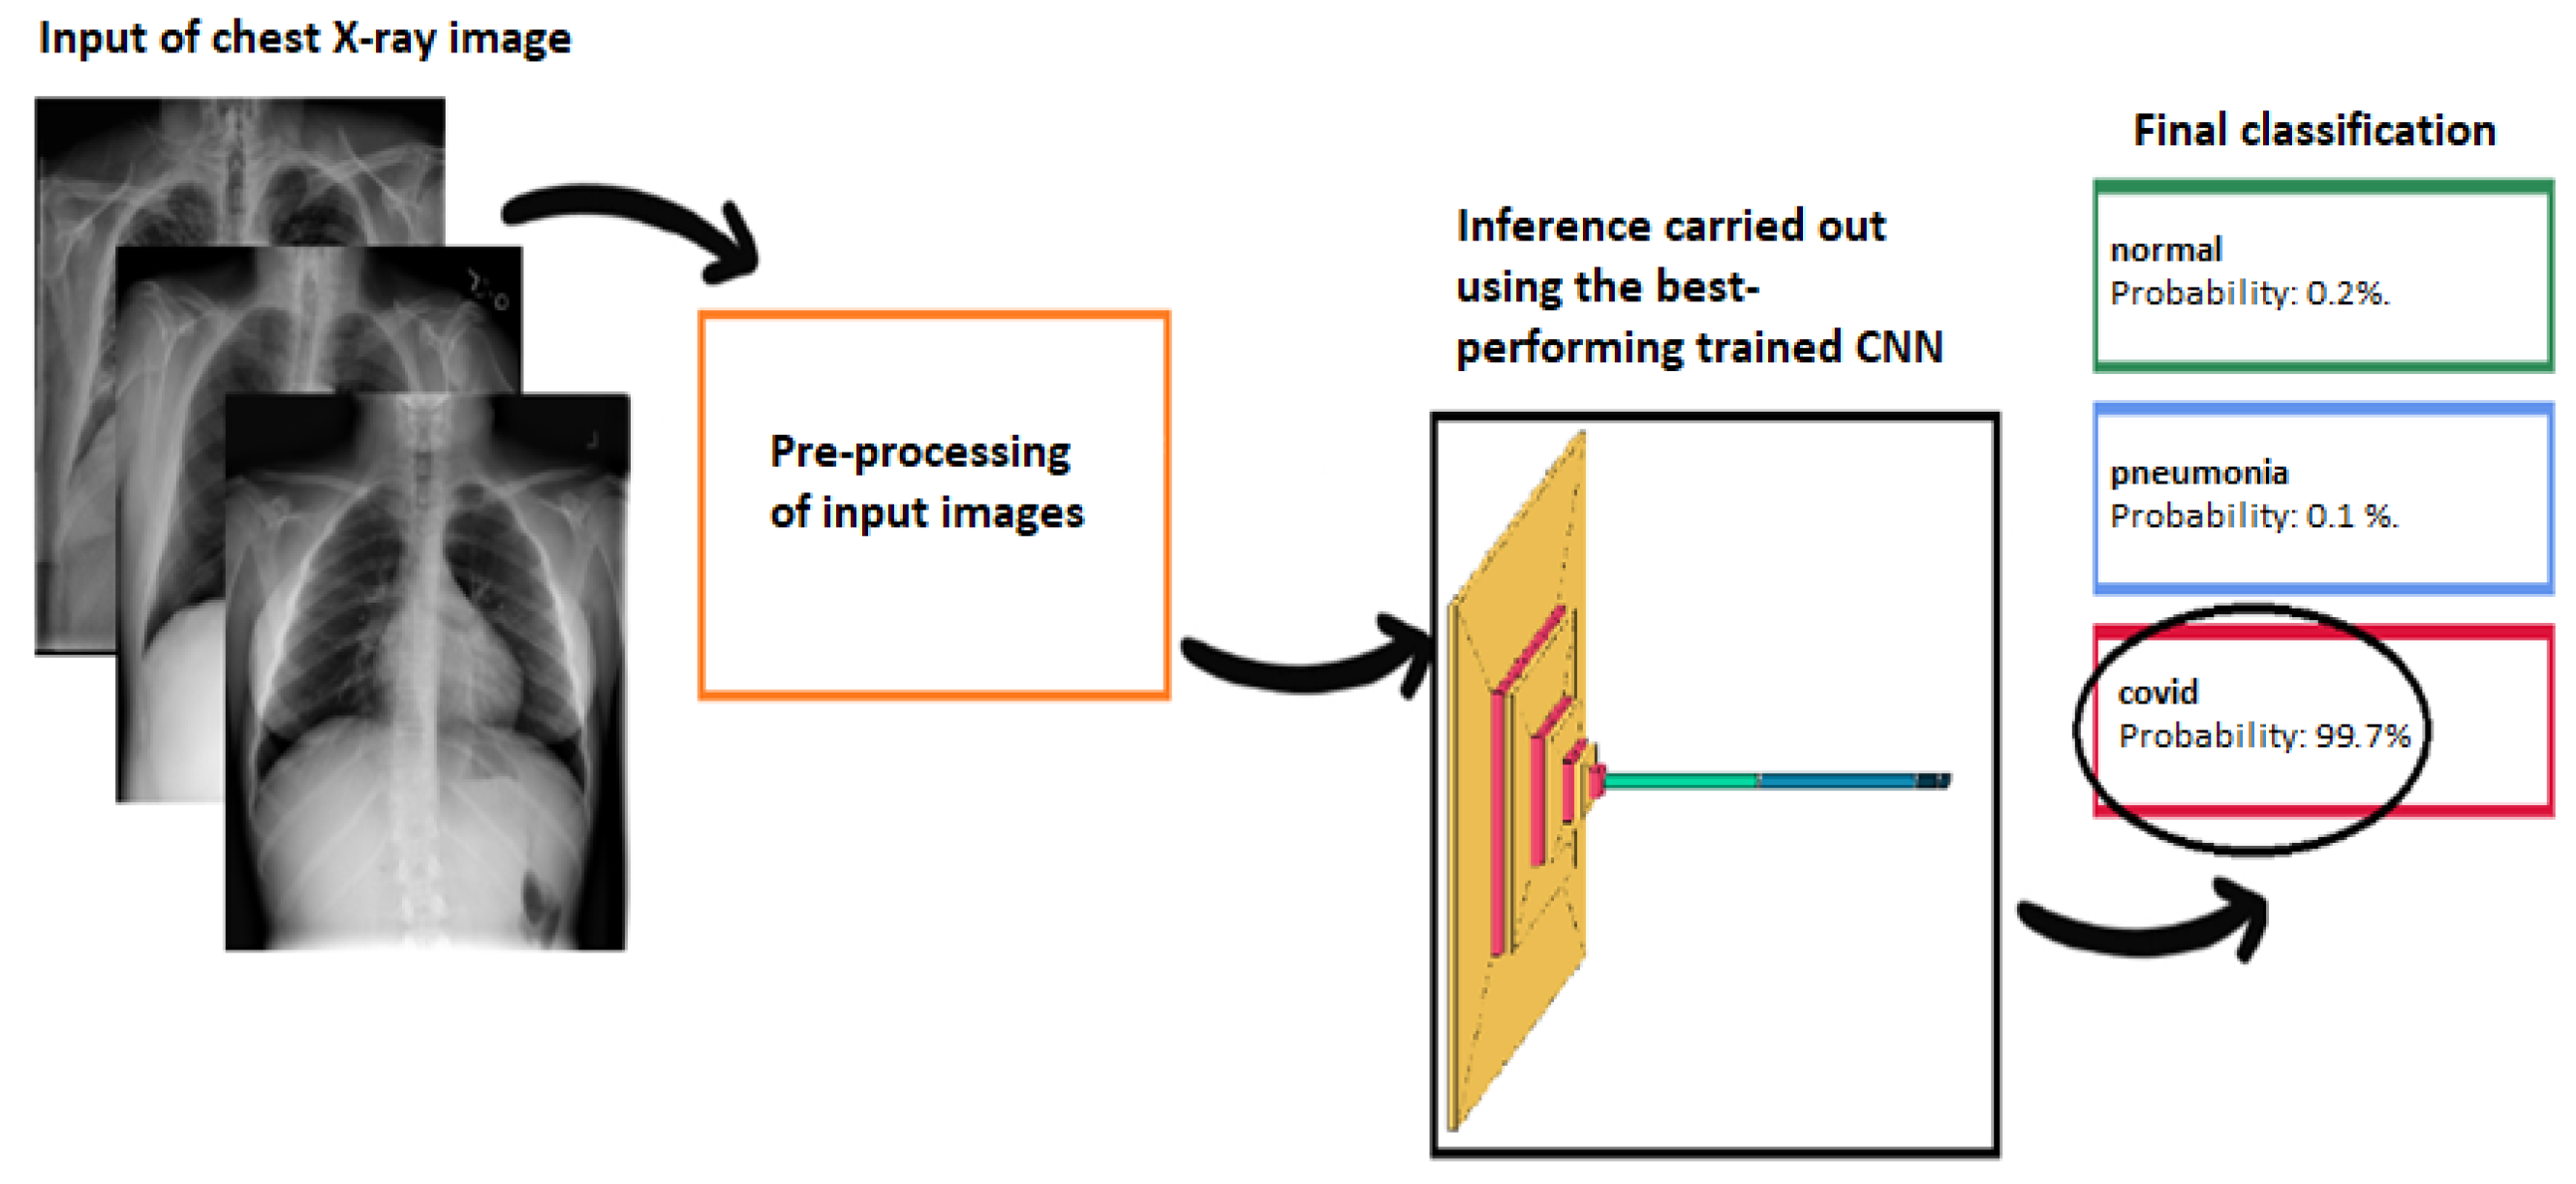
| Algorithm 1: Pseudocoded flowchart of the proposed framework for automatic classification of chest X-ray images. |
Input: Chest X-ray images Output: Prediction: Normal / Pneumonia / COVID-19
|
4. Results
4.1. Performance Comparison
4.2. Advantages of the Implemented Solution
5. Conclusions
Author Contributions
Funding
Institutional Review Board Statement
Data Availability Statement
Acknowledgments
Conflicts of Interest
References
- Tahamtan, A.; Ardebili, A. Real-time RT-PCR in COVID-19 detection: Issues affecting the results. Expert Rev. Mol. Diagn. 2020, 20, 453–454. [Google Scholar] [CrossRef]
- Yüce, M.; Filiztekin, E.; Özkaya, K.G. COVID-19 diagnosis—A review of current methods. Biosens. Bioelectron. 2021, 172, 112752. [Google Scholar] [CrossRef]
- Mak, G.C.; Lau, S.S.; Wong, K.K.; Chow, N.L.; Lau, C.; Lam, E.T.; Chan, R.C.; Tsang, D.N. Evaluation of rapid antigen detection kit from the WHO Emergency Use List for detecting SARS-CoV-2. J. Clin. Virol. 2021, 134, 104712. [Google Scholar] [CrossRef]
- Gaur, P.; Malaviya, V.; Gupta, A.; Bhatia, G.; Pachori, R.B.; Sharma, D. COVID-19 disease identification from chest CT images using empirical wavelet transformation and transfer learning. Biomed. Signal Process. Control 2022, 71, 103076. [Google Scholar] [CrossRef]
- Toussie, D.; Voutsinas, N.; Finkelstein, M.; Cedillo, M.A.; Manna, S.; Maron, S.Z.; Jacobi, A.; Chung, M.; Bernheim, A.; Eber, C.; et al. Clinical and chest radiography features determine patient outcomes in young and middle-aged adults with COVID-19. Radiology 2020, 297, E197–E206. [Google Scholar] [CrossRef]
- Osheter, T.; Campisi Pinto, S.; Randieri, C.; Perrotta, A.; Linder, C.; Weisman, Z. Semi-Autonomic AI LF-NMR Sensor for Industrial Prediction of Edible Oil Oxidation Status. Sensors 2023, 23, 2125. [Google Scholar] [CrossRef]
- Murphy, K.; Smits, H.; Knoops, A.J.; Korst, M.B.; Samson, T.; Scholten, E.T.; Schalekamp, S.; Schaefer-Prokop, C.M.; Philipsen, R.H.; Meijers, A.; et al. COVID-19 on chest radiographs: A multireader evaluation of an artificial intelligence system. Radiology 2020, 296, E166–E172. [Google Scholar] [CrossRef]
- Rajpurkar, P.; Irvin, J.; Ball, R.L.; Zhu, K.; Yang, B.; Mehta, H.; Duan, T.; Ding, D.; Bagul, A.; Langlotz, C.P.; et al. Deep learning for chest radiograph diagnosis: A retrospective comparison of the CheXNeXt algorithm to practicing radiologists. PLoS Med. 2018, 15, e1002686. [Google Scholar] [CrossRef]
- Apostolopoulos, I.D.; Mpesiana, T.A. COVID-19: Automatic detection from x-ray images utilizing transfer learning with convolutional neural networks. Phys. Eng. Sci. Med. 2020, 43, 635–640. [Google Scholar] [CrossRef]
- Ardila, D.; Kiraly, A.P.; Bharadwaj, S.; Choi, B.; Reicher, J.J.; Peng, L.; Tse, D.; Etemadi, M.; Ye, W.; Corrado, G.; et al. End-to-end lung cancer screening with three-dimensional deep learning on low-dose chest computed tomography. Nat. Med. 2019, 25, 954–961. [Google Scholar] [CrossRef]
- Mushtaq, J.; Pennella, R.; Lavalle, S.; Colarieti, A.; Steidler, S.; Martinenghi, C.M.; Palumbo, D.; Esposito, A.; Rovere-Querini, P.; Tresoldi, M.; et al. Initial chest radiographs and artificial intelligence (AI) predict clinical outcomes in COVID-19 patients: Analysis of 697 Italian patients. Eur. Radiol. 2021, 31, 1770–1779. [Google Scholar] [CrossRef]
- Russo, S.; Fiani, F.; Napoli, C. Remote Eye Movement Desensitization and Reprocessing Treatment of Long-COVID- and Post-COVID-Related Traumatic Disorders: An Innovative Approach. Brain Sci. 2024, 14, 1212. [Google Scholar] [CrossRef]
- Rahman, T.; Chowdhury, M.E.; Khandakar, A.; Islam, K.R.; Islam, K.F.; Mahbub, Z.B.; Kadir, M.A.; Kashem, S. Transfer learning with deep convolutional neural network (CNN) for pneumonia detection using chest X-ray. Appl. Sci. 2020, 10, 3233. [Google Scholar] [CrossRef]
- De Magistris, G.; Russo, S.; Roma, P.; Starczewski, J.T.; Napoli, C. An Explainable Fake News Detector Based on Named Entity Recognition and Stance Classification Applied to COVID-19. Information 2022, 13, 137. [Google Scholar] [CrossRef]
- Pathan, S.; Siddalingaswamy, P.; Ali, T. Automated Detection of COVID-19 from Chest X-ray scans using an optimized CNN architecture. Appl. Soft Comput. 2021, 104, 107238. [Google Scholar] [CrossRef]
- Rubin, G.D.; Ryerson, C.J.; Haramati, L.B.; Sverzellati, N.; Kanne, J.P.; Raoof, S.; Schluger, N.W.; Volpi, A.; Yim, J.J.; Martin, I.B.; et al. The role of chest imaging in patient management during the COVID-19 pandemic: A multinational consensus statement from the Fleischner Society. Radiology 2020, 296, 172–180. [Google Scholar] [CrossRef]
- Narin, A.; Kaya, C.; Pamuk, Z. Automatic detection of coronavirus disease (covid-19) using x-ray images and deep convolutional neural networks. Pattern Anal. Appl. 2021, 24, 1207–1220. [Google Scholar] [CrossRef]
- Maselli, G.; Bertamino, E.; Capalbo, C.; Mancini, R.; Orsi, G.; Napoli, C.; Napoli, C. Hierarchical convolutional models for automatic pneumonia diagnosis based on X-ray images: New strategies in public health. Ann. Ig. Med. Prev. Comunita 2021, 33, 644–655. [Google Scholar] [CrossRef]
- Li, J.; Zhao, G.; Tao, Y.; Zhai, P.; Chen, H.; He, H.; Cai, T. Multi-task contrastive learning for automatic CT and X-ray diagnosis of COVID-19. Pattern Recognit. 2021, 114, 107848. [Google Scholar] [CrossRef]
- Lee, J.B.; Kim, J.S.; Lee, H.G. COVID19 to Pneumonia: Multi Region Lung Severity Classification Using CNN Transformer Position-Aware Feature Encoding Network. In Proceedings of the International Conference on Medical Image Computing and Computer-Assisted Intervention, Marrakesh, Morocco, 6–10 October 2024; Springer: Cham, Switzerland, 2024; pp. 472–481. [Google Scholar]
- Chakraborty, S.; Paul, S.; Hasan, K. A Transfer Learning-Based Approach with Deep CNN for COVID-19-and Pneumonia-Affected Chest X-ray Image Classification. SN Comput. Sci. 2022, 3, 17. [Google Scholar] [CrossRef]
- Ozturk, T.; Talo, M.; Yildirim, E.A.; Baloglu, U.B.; Yildirim, O.; Acharya, U.R. Automated detection of COVID-19 cases using deep neural networks with X-ray images. Comput. Biol. Med. 2020, 121, 103792. [Google Scholar] [CrossRef]
- Nishio, M.; Kobayashi, D.; Nishioka, E.; Matsuo, H.; Urase, Y.; Onoue, K.; Ishikura, R.; Kitamura, Y.; Sakai, E.; Tomita, M.; et al. Deep learning model for the automatic classification of COVID-19 pneumonia, non-COVID-19 pneumonia, and the healthy: A multi-center retrospective study. Sci. Rep. 2022, 12, 8214. [Google Scholar] [CrossRef]
- Nishio, M.; Noguchi, S.; Matsuo, H.; Murakami, T. Automatic classification between COVID-19 pneumonia, non-COVID-19 pneumonia, and the healthy on chest X-ray image: Combination of data augmentation methods. Sci. Rep. 2020, 10, 17532. [Google Scholar] [CrossRef]
- Goyal, S.; Singh, R. Detection and classification of lung diseases for pneumonia and COVID-19 using machine and deep learning techniques. J. Ambient Intell. Humaniz. Comput. 2023, 14, 3239–3259. [Google Scholar] [CrossRef]
- Hussain, E.; Hasan, M.; Rahman, M.A.; Lee, I.; Tamanna, T.; Parvez, M.Z. CoroDet: A deep learning based classification for COVID-19 detection using chest X-ray images. Chaos Solitons Fractals 2021, 142, 110495. [Google Scholar] [CrossRef]
- An evaluation of lightweight deep learning techniques in medical imaging for high precision COVID-19 diagnostics. Healthc. Anal. 2022, 2, 100096. [CrossRef]
- Nayak, S.R.; Nayak, D.R.; Sinha, U.; Arora, V.; Pachori, R.B. An Efficient Deep Learning Method for Detection of COVID-19 Infection Using Chest X-ray Images. Diagnostics 2023, 13, 131. [Google Scholar] [CrossRef]
- Islam, M.N.; Alam, M.G.R.; Apon, T.S.; Uddin, M.Z.; Allheeib, N.; Menshawi, A.; Hassan, M.M. Interpretable differential diagnosis of non-COVID viral pneumonia, lung opacity and COVID-19 using tuned transfer learning and explainable ai. Healthcare 2023, 11, 410. [Google Scholar] [CrossRef]
- Abbas, A.; Abdelsamea, M.M.; Gaber, M.M. Classification of COVID-19 in chest X-ray images using DeTraC deep convolutional neural network. Appl. Intell. 2021, 51, 854–864. [Google Scholar] [CrossRef]
- Asraf, A.; Islam, Z. COVID19, Pneumonia and Normal Chest X-ray PA Dataset. 2021. Available online: https://data.mendeley.com/datasets/mxc6vb7svm/2 (accessed on 23 February 2025).
- Chowdhury, M.E.H.; Rahman, T.; Khandakar, A.; Mazhar, R.; Kadir, M.A.; Mahbub, Z.B.; Islam, K.R.; Khan, M.S.; Iqbal, A.; Emadi, N.A.; et al. Can AI Help in Screening Viral and COVID-19 Pneumonia? IEEE Access 2020, 8, 132665–132676. [Google Scholar] [CrossRef]
- Cohen, J.P.; Morrison, P.; Dao, L. COVID-19 image data collection. arXiv 2020, arXiv:2003.11597. [Google Scholar]
- Chung, A. GitHub—Agchung/Figure1-COVID-Chestxray-Dataset. 2020. Available online: https://github.com/agchung (accessed on 15 February 2025).
- Radiopaedia.org. Radiopaedia COVID-19 Database. 2020. Available online: https://radiopaedia.org/?lang=gb (accessed on 20 February 2025).
- Italian Society of Medical and Interventional Radiology (SIRM). COVID-19 Database. 2020. Available online: https://www.kaggle.com/datasets/zabir110islam/covid19-sirm-database/data (accessed on 20 February 2025).
- COVID-19 Chest X-Ray Image Repository. 2020. Available online: https://figshare.com/articles/dataset/COVID-19_Chest_X-Ray_Image_Repository/12580328/2 (accessed on 22 February 2025).
- COVID-19 Image Repository. 2020. Available online: https://figshare.com/articles/COVID-19_Image_Repository/12275009/1 (accessed on 12 February 2025).
- Mooney, P.T. Chest X-Ray Images (Pneumonia). 2018. Available online: https://www.kaggle.com/paultimothymooney/chest-xray-pneumonia (accessed on 25 February 2025).
- Center, N.C. NIH Chest X-Rays. 2017. Available online: https://www.kaggle.com/nih-chest-xrays/data (accessed on 25 February 2025).
- Rahman, T.; Khandakar, A.; Qiblawey, Y.; Tahir, A.; Kiranyaz, S.; Abul Kashem, S.B.; Islam, M.T.; Al Maadeed, S.; Zughaier, S.M.; Khan, M.S.; et al. Exploring the effect of image enhancement techniques on COVID-19 detection using chest X-ray images. Comput. Biol. Med. 2021, 132, 104319. [Google Scholar] [CrossRef]
- Tasci, E.; Uluturk, C.; Ugur, A. A voting-based ensemble deep learning method focusing on image augmentation and preprocessing variations for tuberculosis detection. Neural Comput. Appl. 2021, 33, 15541–15555. [Google Scholar] [CrossRef]
- Heckbert, P.S. Graphics Gems; Elsevier: Amsterdam, The Netherlands, 2013; Volume 4. [Google Scholar]
- Srivastava, N.; Hinton, G.; Krizhevsky, A.; Sutskever, I.; Salakhutdinov, R. Dropout: A simple way to prevent neural networks from overfitting. J. Mach. Learn. Res. 2014, 15, 1929–1958. [Google Scholar]
- Goodfellow, I.; Bengio, Y.; Courville, A. Deep Learning; MIT Press: Cambridge, MA, USA, 2016. [Google Scholar]
- Faes, L.; Wagner, S.K.; Fu, D.J.; Liu, X.; Korot, E.; Ledsam, J.R.; Back, T.; Chopra, R.; Pontikos, N.; Kern, C.; et al. Automated deep learning design for medical image classification by health-care professionals with no coding experience: A feasibility study. Lancet Digit. Health 2020, 2, e612–e621. [Google Scholar] [CrossRef]
- Curated COVID-19 X-Ray Dataset. 2020. Available online: https://data.mendeley.com/datasets/2fxz4px6d8/4 (accessed on 26 February 2025).
- Cohen, J.P.; Morrison, P.; Dao, L.; Roth, K.; Duong, T.Q.; Ghassemi, M. COVID-19 Image Data Collection: Prospective Predictions Are the Future. arXiv 2020, arXiv:2006.11988. [Google Scholar] [CrossRef]
- Wang, X.; Peng, Y.; Lu, L.; Lu, Z.; Bagheri, M.; Summers, R.M. ChestX-Ray8: Hospital-Scale Chest X-Ray Database and Benchmarks on Weakly-Supervised Classification and Localization of Common Thorax Diseases. In Proceedings of the 2017 IEEE Conference on Computer Vision and Pattern Recognition (CVPR), Honolulu, HI, USA, 21–26 July 2017; pp. 3462–3471. [Google Scholar]
- Bustos, A.; Pertusa, A.; Salinas, J.M.; de la Iglesia-Vayá, M. PadChest: A large chest x-ray image dataset with multi-label annotated reports. Med. Image Anal. 2020, 66, 101797. [Google Scholar] [CrossRef]
- Kermany, D.S.; Goldbaum, M.; Cai, W.; Valentim, C.C.; Liang, H.; Baxter, S.L.; McKeown, A.; Yang, G.; Wu, X.; Yan, F.; et al. Identifying Medical Diagnoses and Treatable Diseases by Image-Based Deep Learning. Cell 2018, 172, 1122–1131.e9. [Google Scholar] [CrossRef]
- Wang, L.; Lin, Z.Q.; Wong, A. COVID-Net: A Tailored Deep Convolutional Neural Network Design for Detection of COVID-19 Cases from Chest X-Ray Images. Sci. Rep. 2020, 10, 19549. [Google Scholar] [CrossRef]
- Rahman, T. COVID-19 Radiography Database. 2020. Available online: https://www.kaggle.com/datasets/tawsifurrahman/covid19-radiography-database (accessed on 25 February 2025).
- De La Iglesia Vayá, M.; Saborit, J.M.; Montell, J.A.; Pertusa, A.; Bustos, A.; Cazorla, M.; Galant, J.; Barber, X.; Orozco-Beltrán, D.; García-García, F.; et al. BIMCV COVID-19+: A large annotated dataset of RX and CT images from COVID-19 patients. arXiv 2020. [Google Scholar] [CrossRef]
- Kermany, D.; Zhang, K.; Goldbaum, M. Large Dataset of Labeled Optical Coherence Tomography (OCT) and Chest X-Ray Images. 2018. Available online: https://data.mendeley.com/datasets/rscbjbr9sj/3 (accessed on 25 February 2025).


| Metric | Precision | Recall | F1-Score | Accuracy |
|---|---|---|---|---|
| Macro average | 0.9748 | 0.9748 | 0.9747 | – |
| Weighted average | 0.9748 | 0.9748 | 0.9747 | – |
| Overall accuracy | – | – | – | 0.9748 |
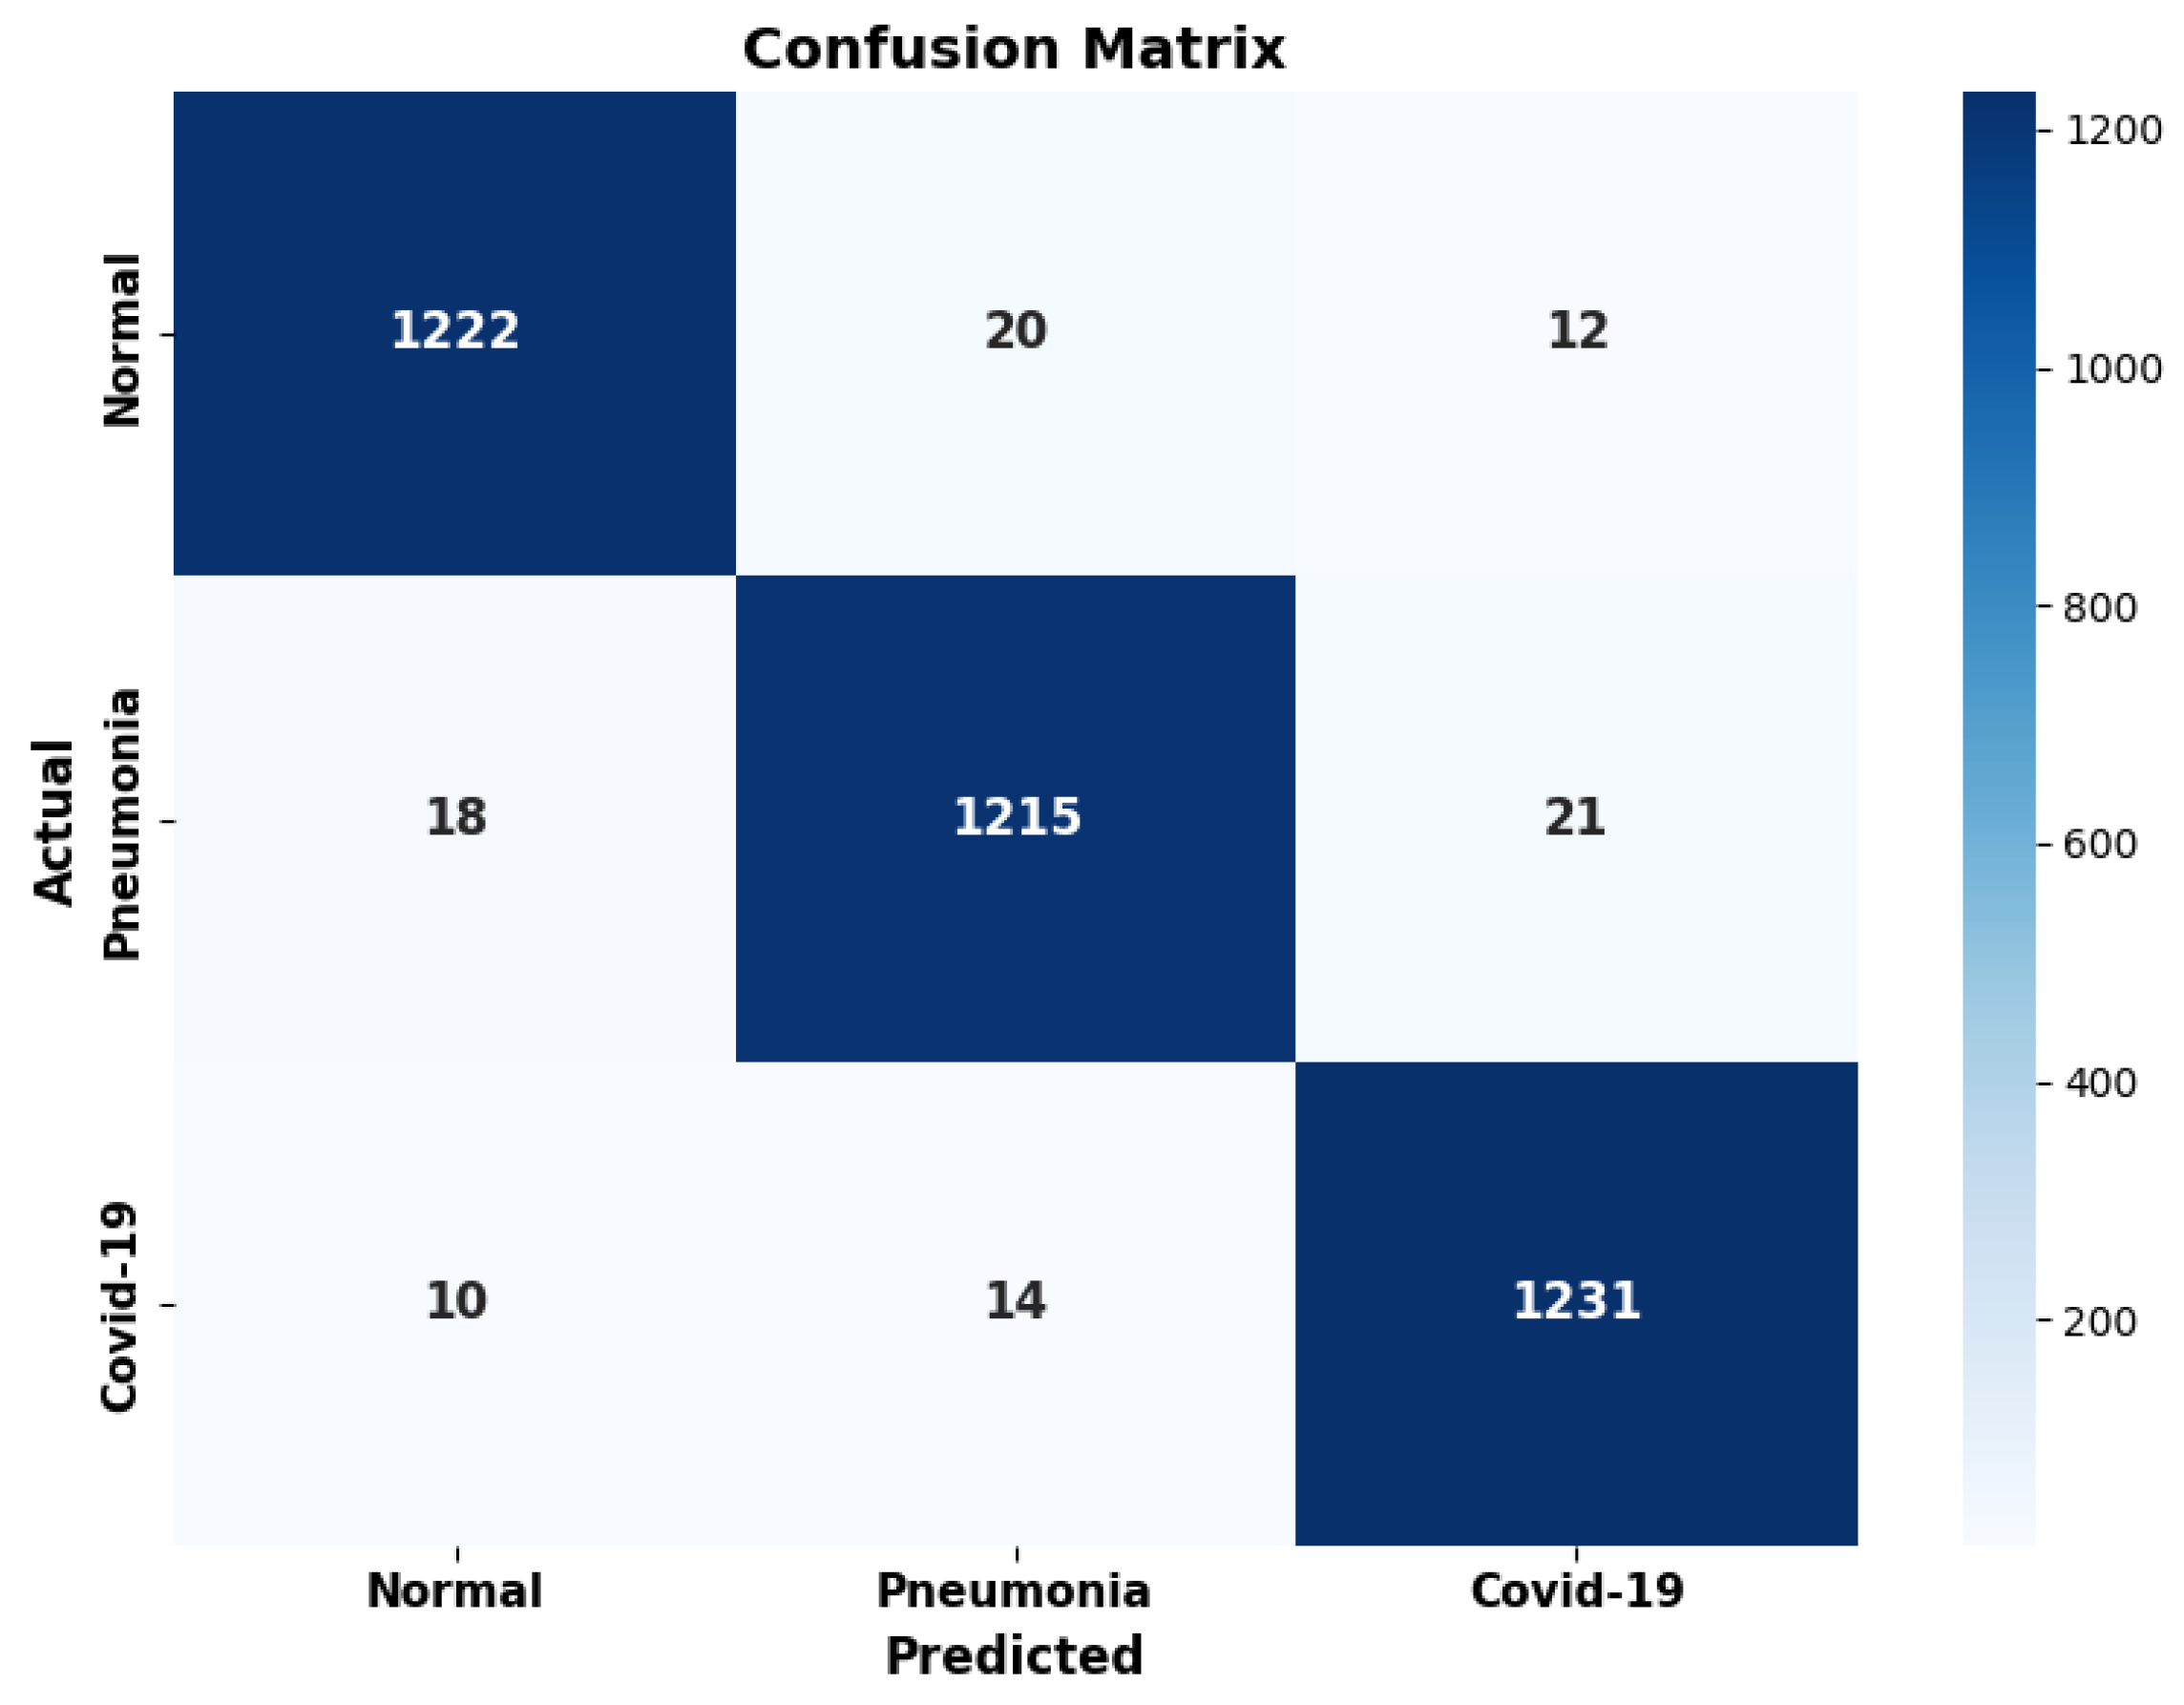
| Class | Precision | Recall | F1-Score | Support |
|---|---|---|---|---|
| Normal | 0.9776 | 0.9745 | 0.9760 | 1254 |
| Pneumonia | 0.9728 | 0.9689 | 0.9708 | 1254 |
| COVID-19 | 0.9739 | 0.9809 | 0.9774 | 1255 |
| Model | Description | N. Samples | Dataset |
|---|---|---|---|
| Our Model | COVID-19 Image Data Collection, COVID–Chest X-Ray Dataset, Radiopaedia, SIRM, Chest X-ray Image Repository, Figshare Chest X-Ray Images (Pneumonia), NIH Chest X-Rays | 15,051 | [32,33,34,35,36,37,38,39,40,41,47] |
| [26] | Combined datasets: COVID–Chest X-Ray, COVID-CT, Figure 1, Actualmed, SARS-CoV-2 CT-scan, KhoongWH, RadiographyDB, Sajid | 7390 | [48,49,50,51] |
| [28] | COVID-CXNet and COVID-Net datasets | 2250 | [37,52] |
| [27] | COVID-19 Radiography Database | 3886 | [32,41,53] |
| [21] | COVID-19 Radiography Database | 3886 | [32,41,53] |
| [22] | COVID-19 Image Data Collection and Chest X-Rays | 1127 | [48,49] |
| [23] | PadChest and BIMCV COVID-19+ | 25,966 | [50,54] |
| [25] | C19RD and CXIP datasets | 8761 | [39,51,55] |
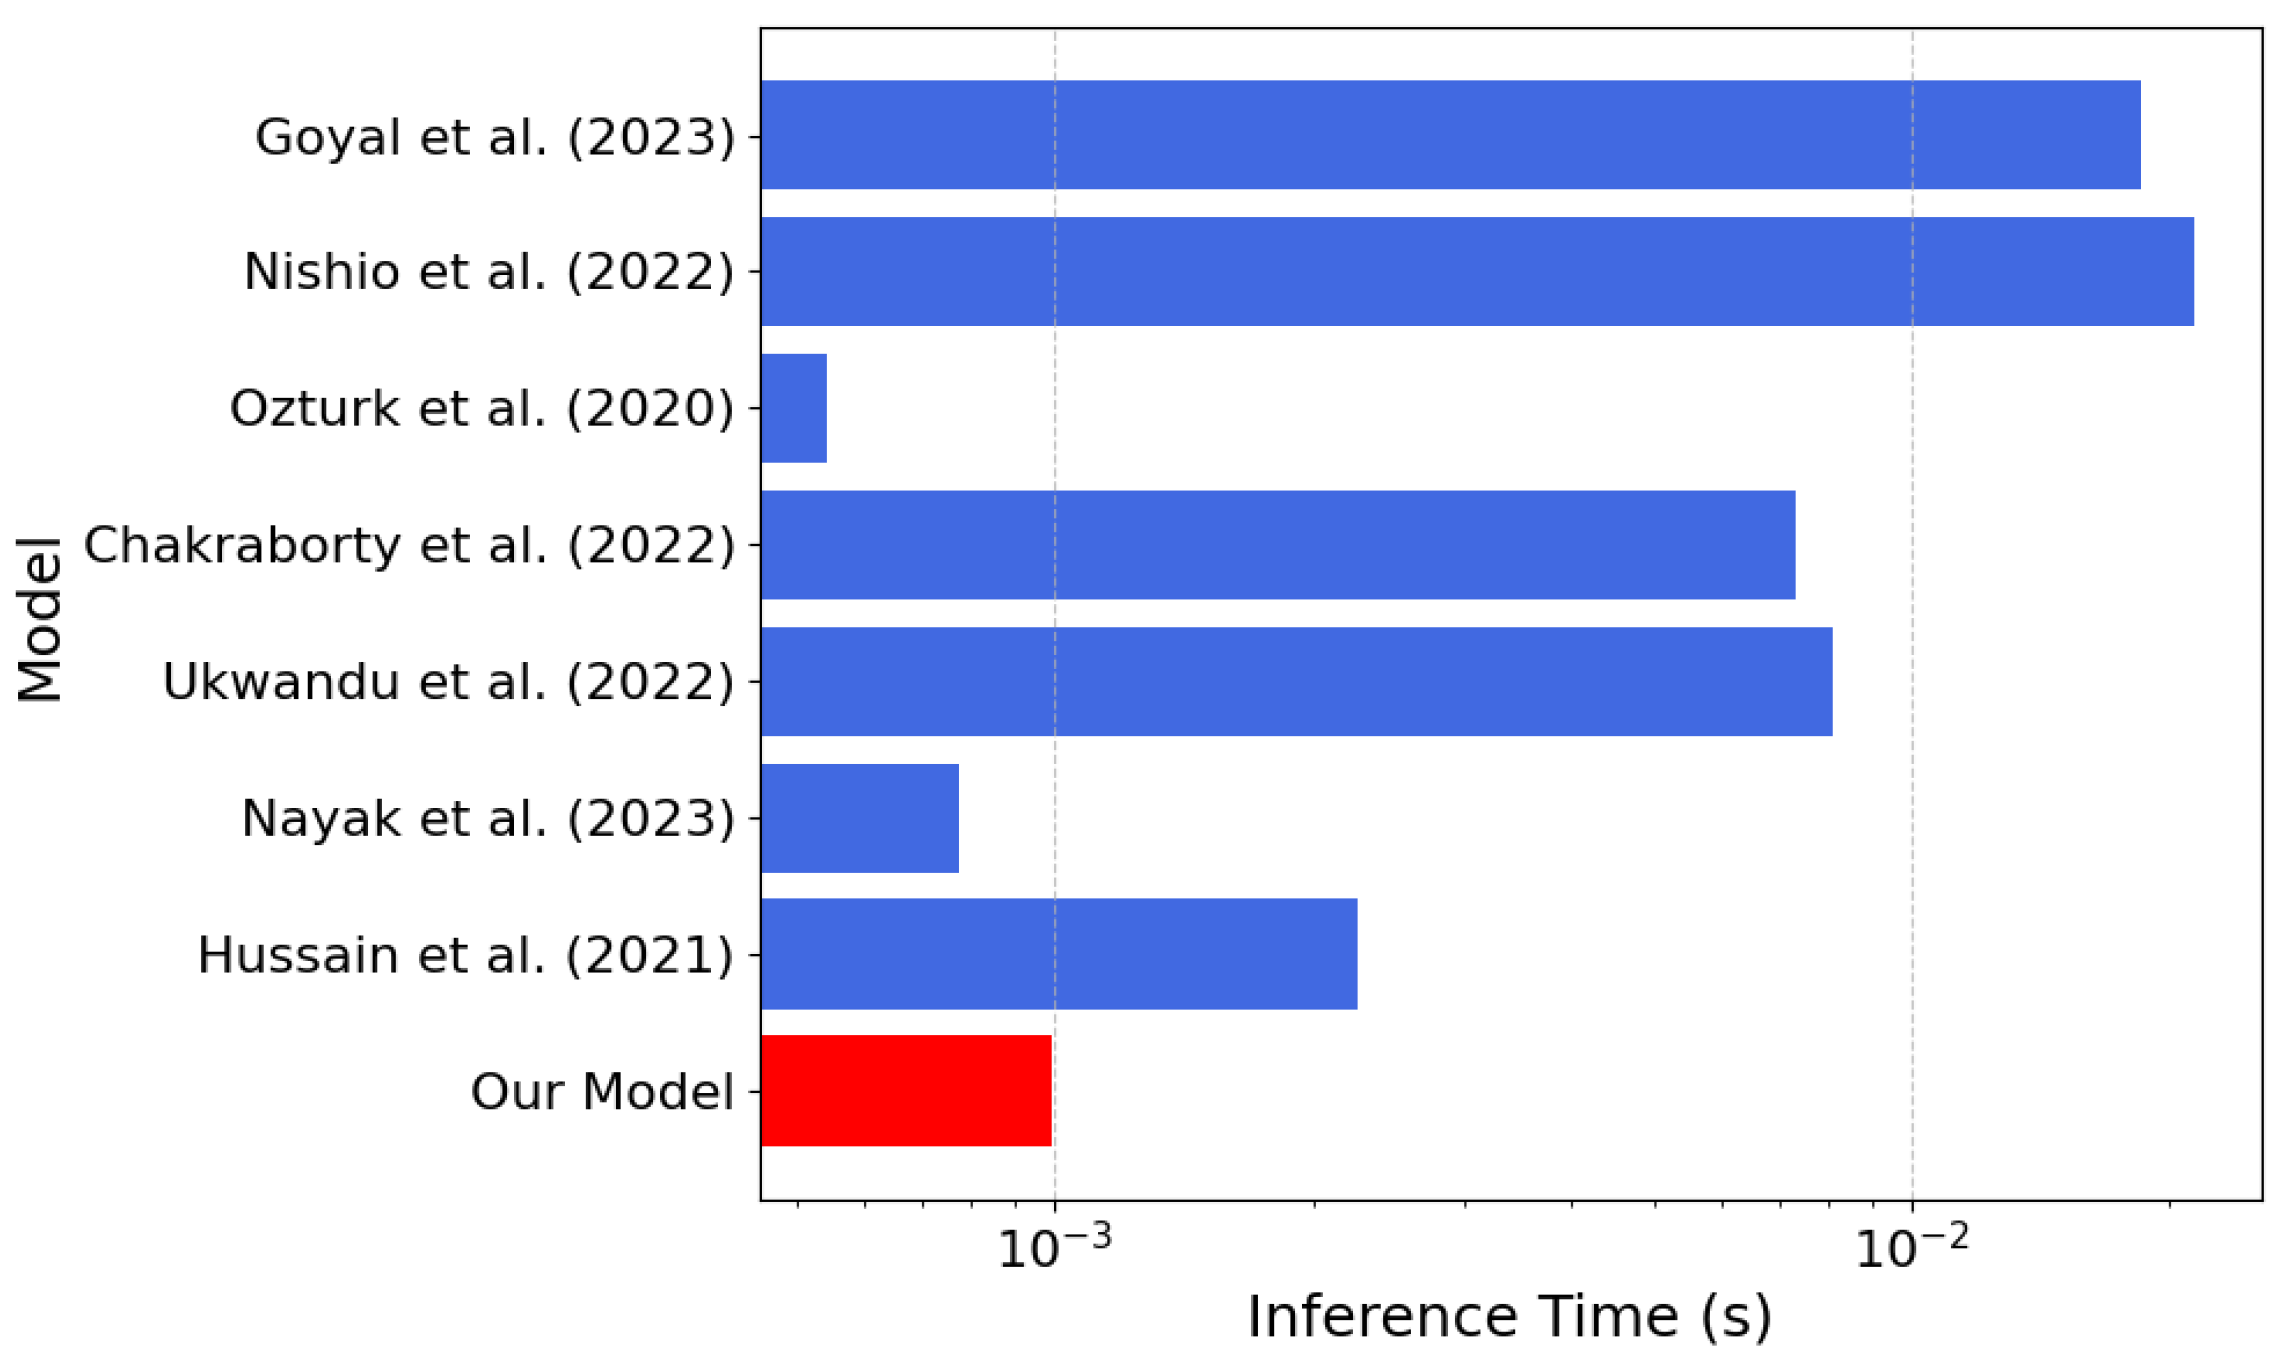
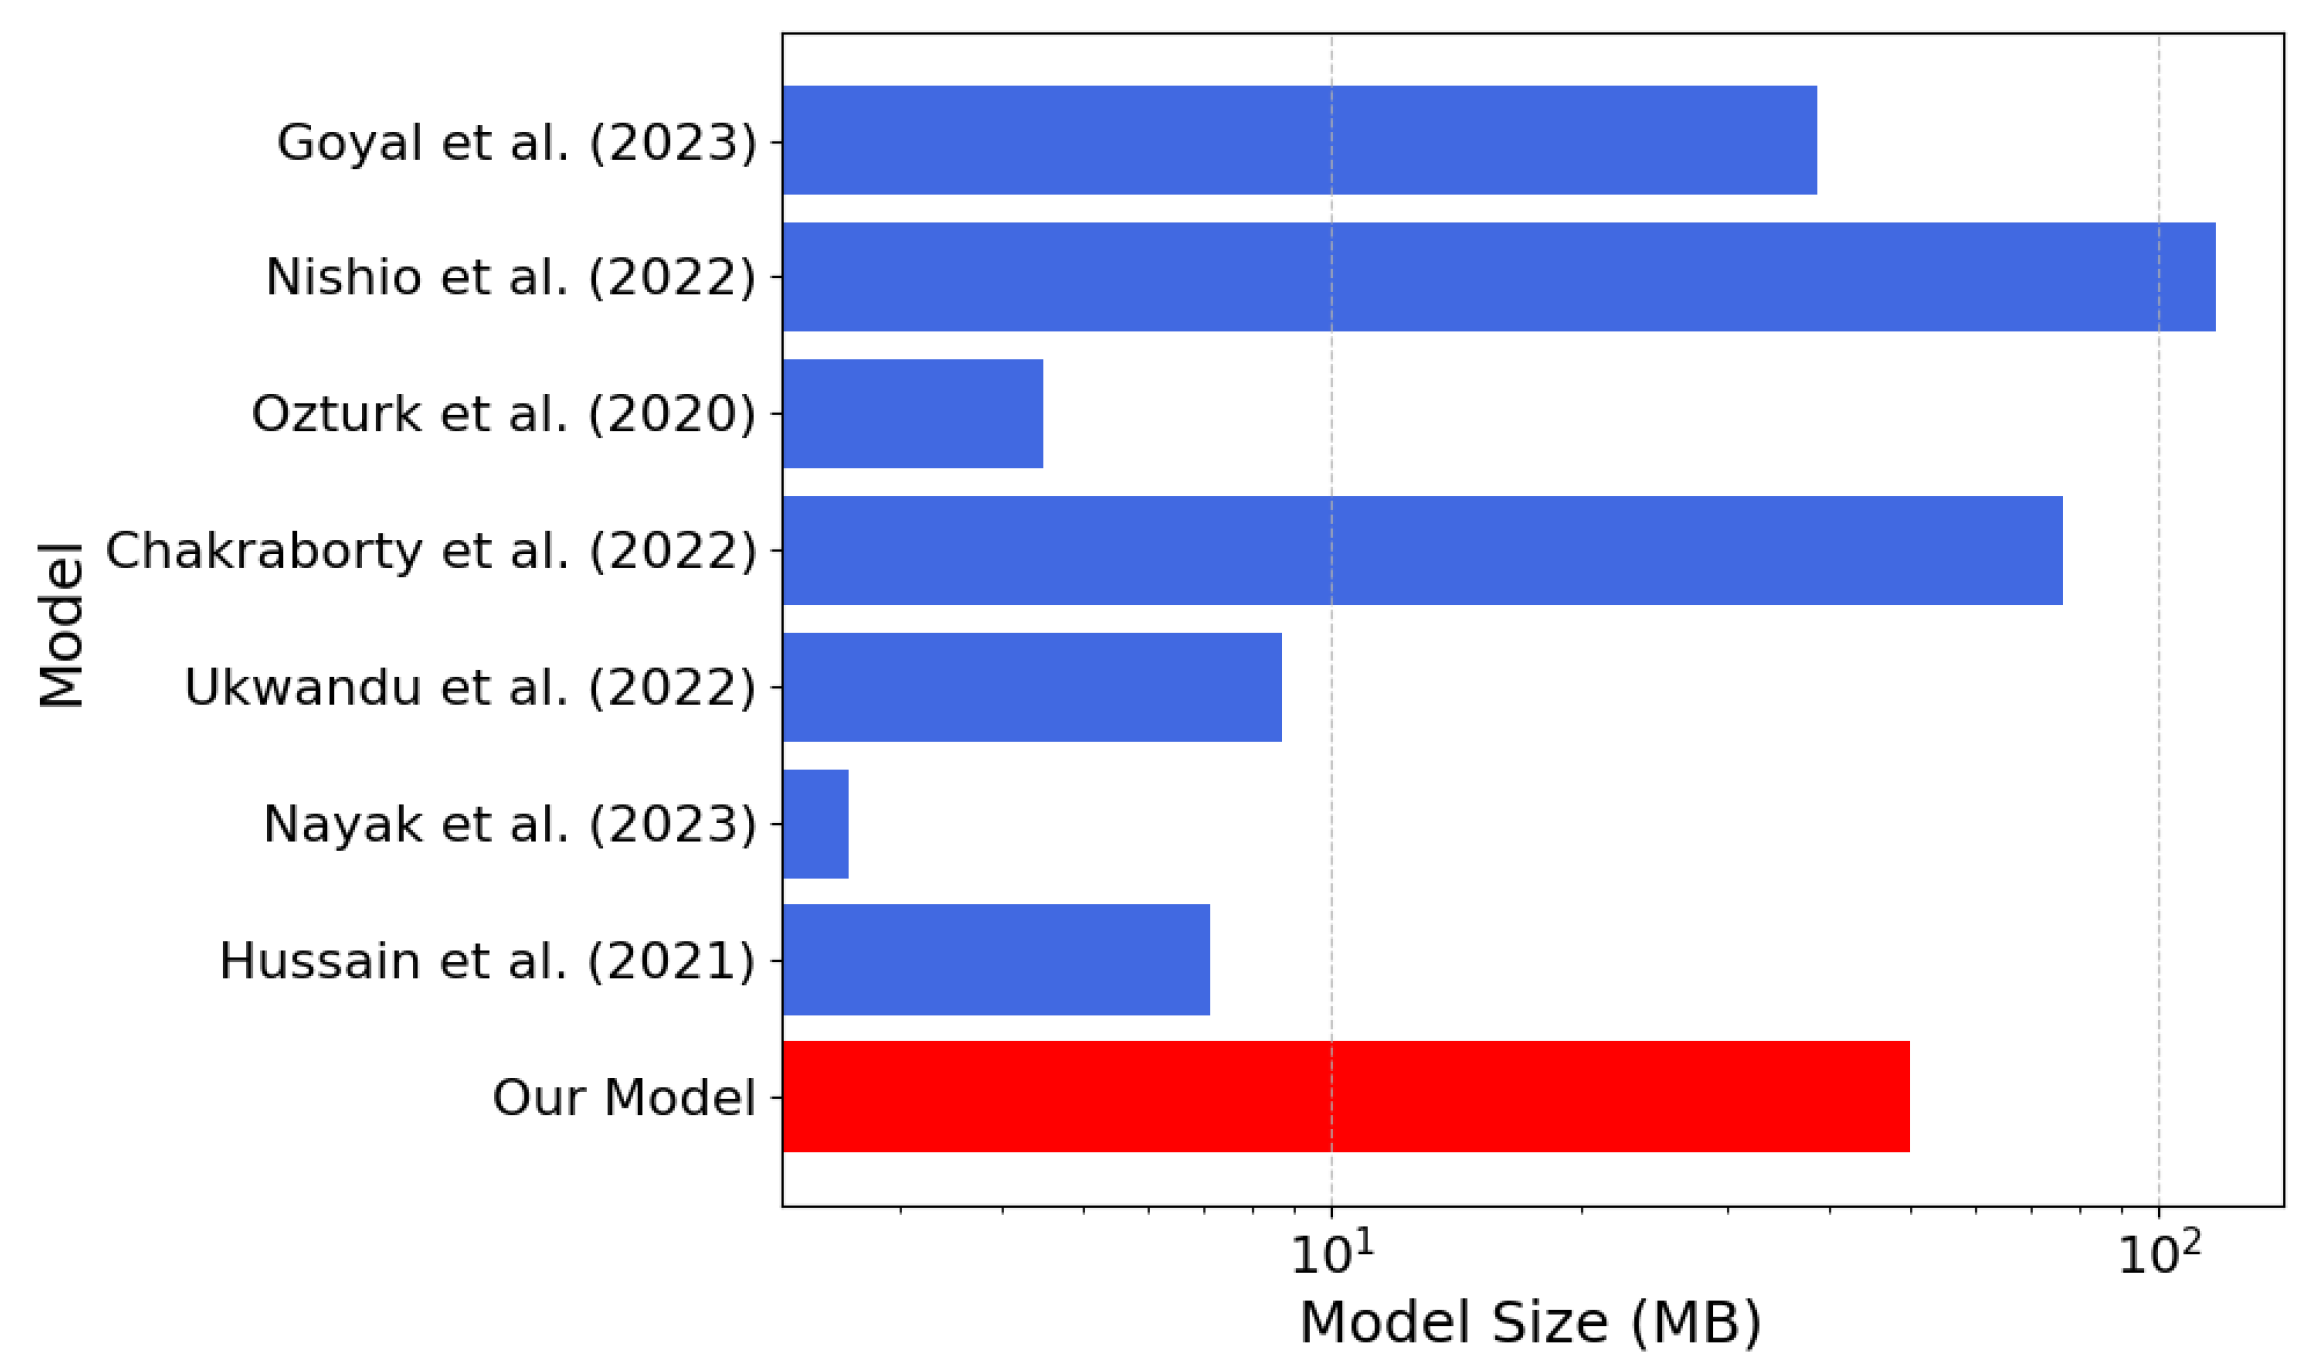
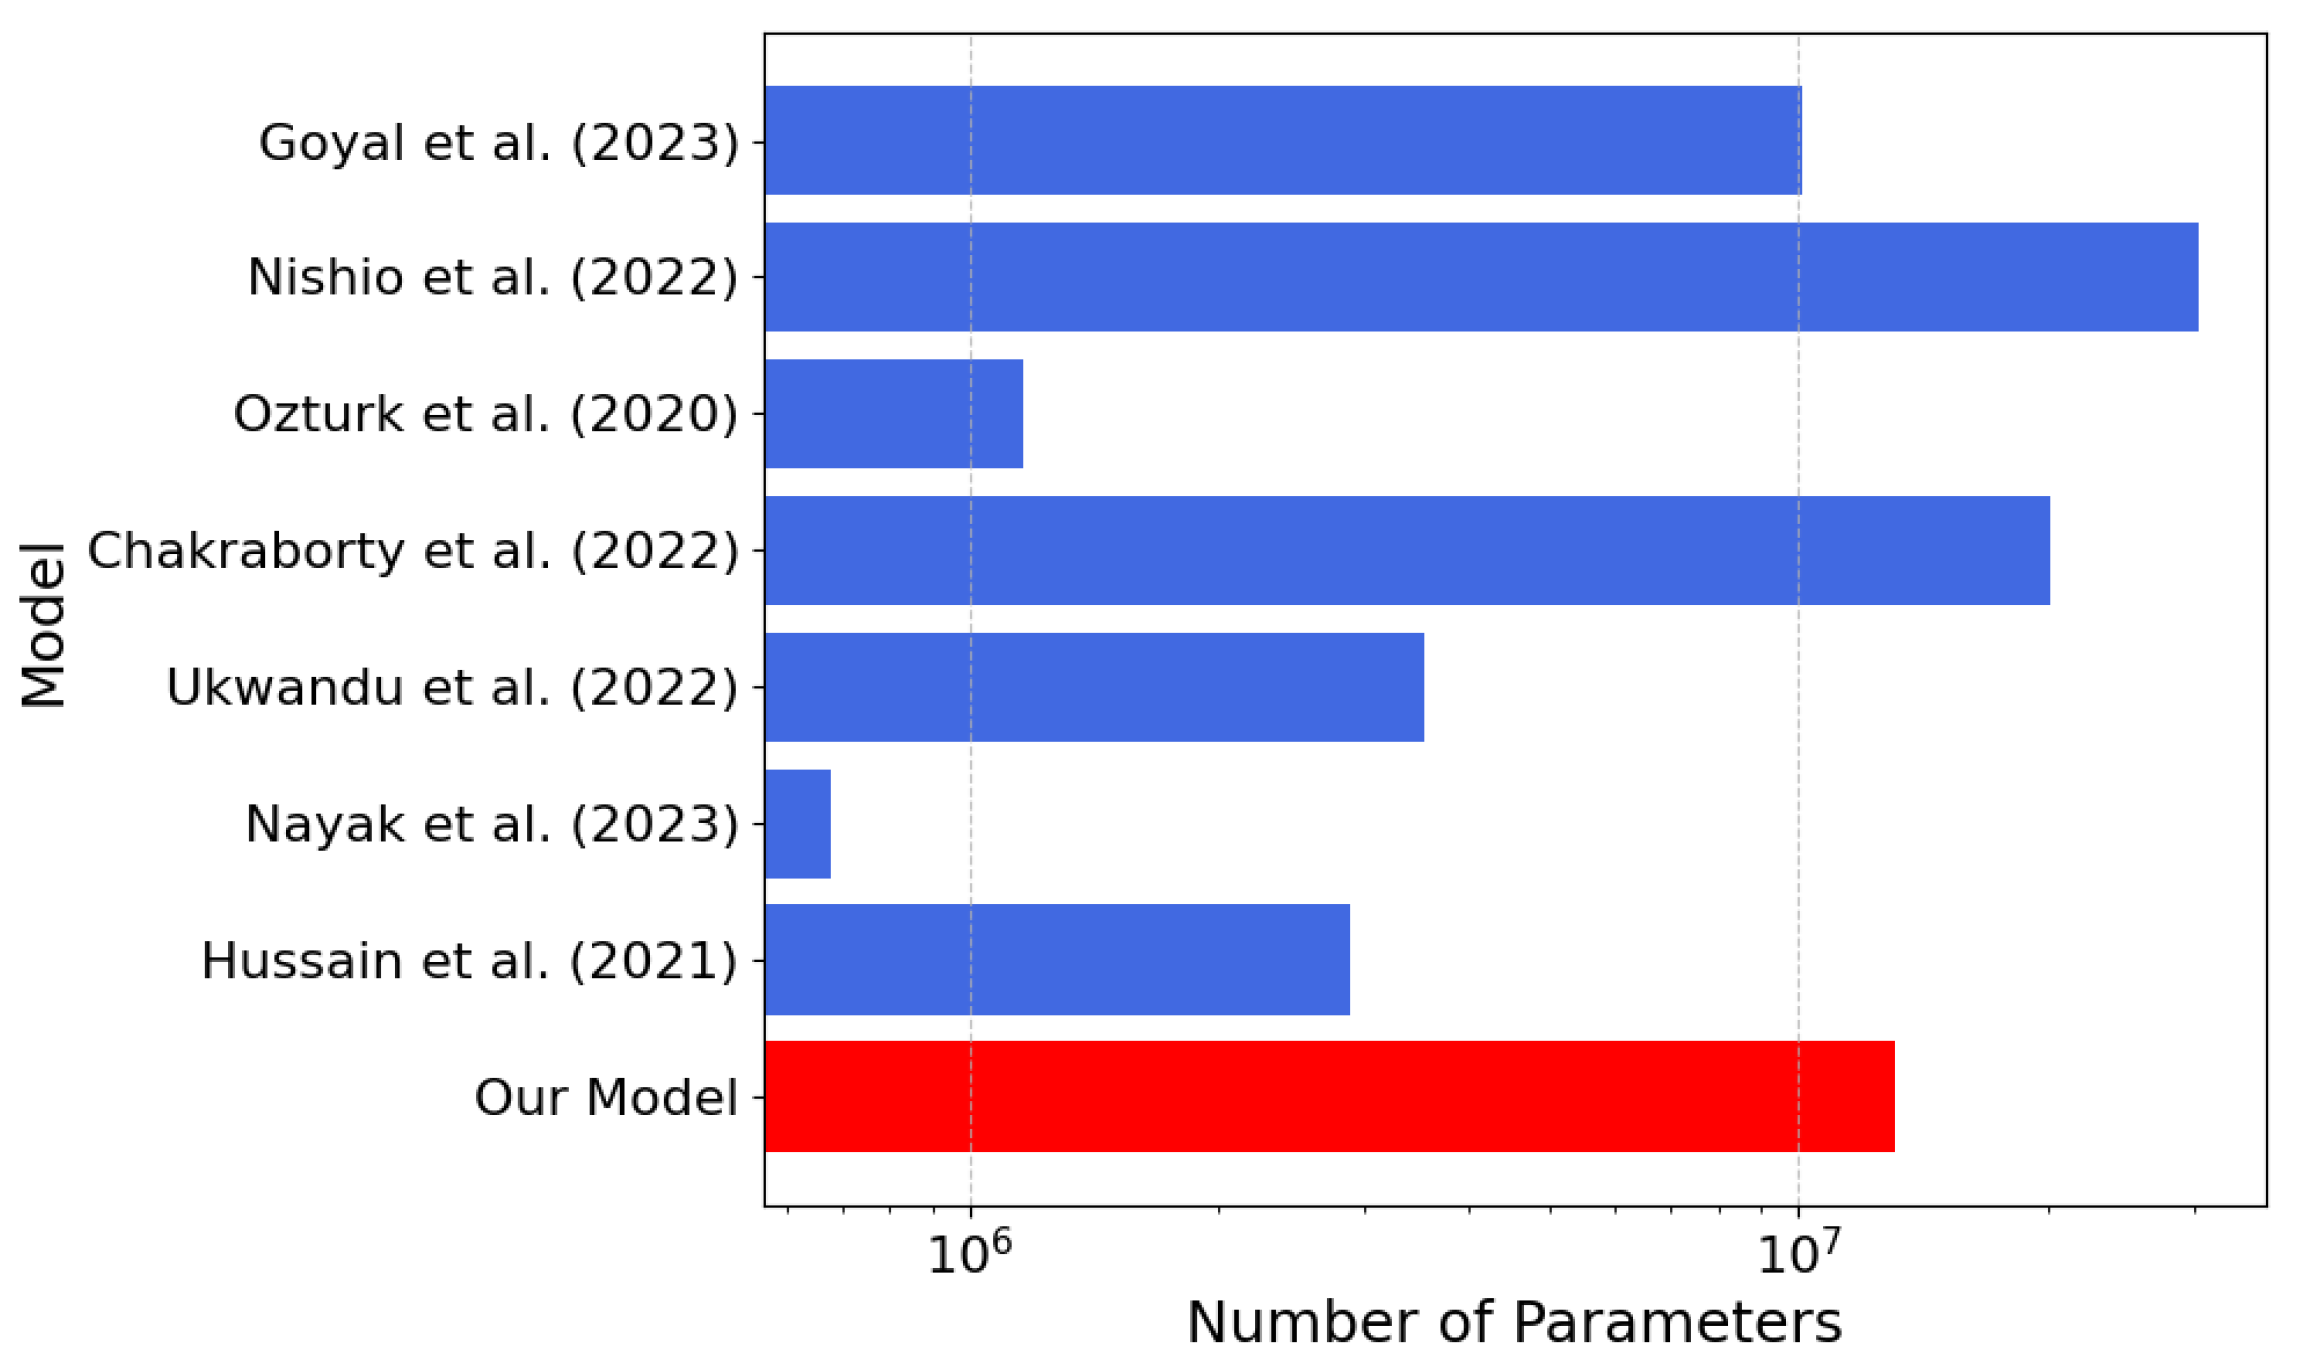
| Model | Architecture | Inference (s) | Size (MB) | N. of Params |
|---|---|---|---|---|
| Our Model | Custom CNN | 50.00 | 13,143,043 | |
| Hussain et al. (2021) [26] | CoroDet - CNN | 7.11 | 2,874,635 | |
| Nayak et al. (2022) [28] | CORONet - CNN | 2.61 | 680,000 | |
| Ukwandu et al. (2022) [27] | MobileNetV2 | 8.72 | 3,538,984 | |
| Chakraborty et al. (2022) [21] | CNN Transfer Learning | 76.77 | 20,122,691 | |
| Ozturk et al. (2020) [22] | DarkCOVIDNet | 4.47 | 1,164,434 | |
| Nishio et al. (2022) [23] | EfficientNet-based | 116.83 | 30,389,784 | |
| Goyal et al. (2023) [25] | RNN with LSTM | 38.73 | 10,152,803 |
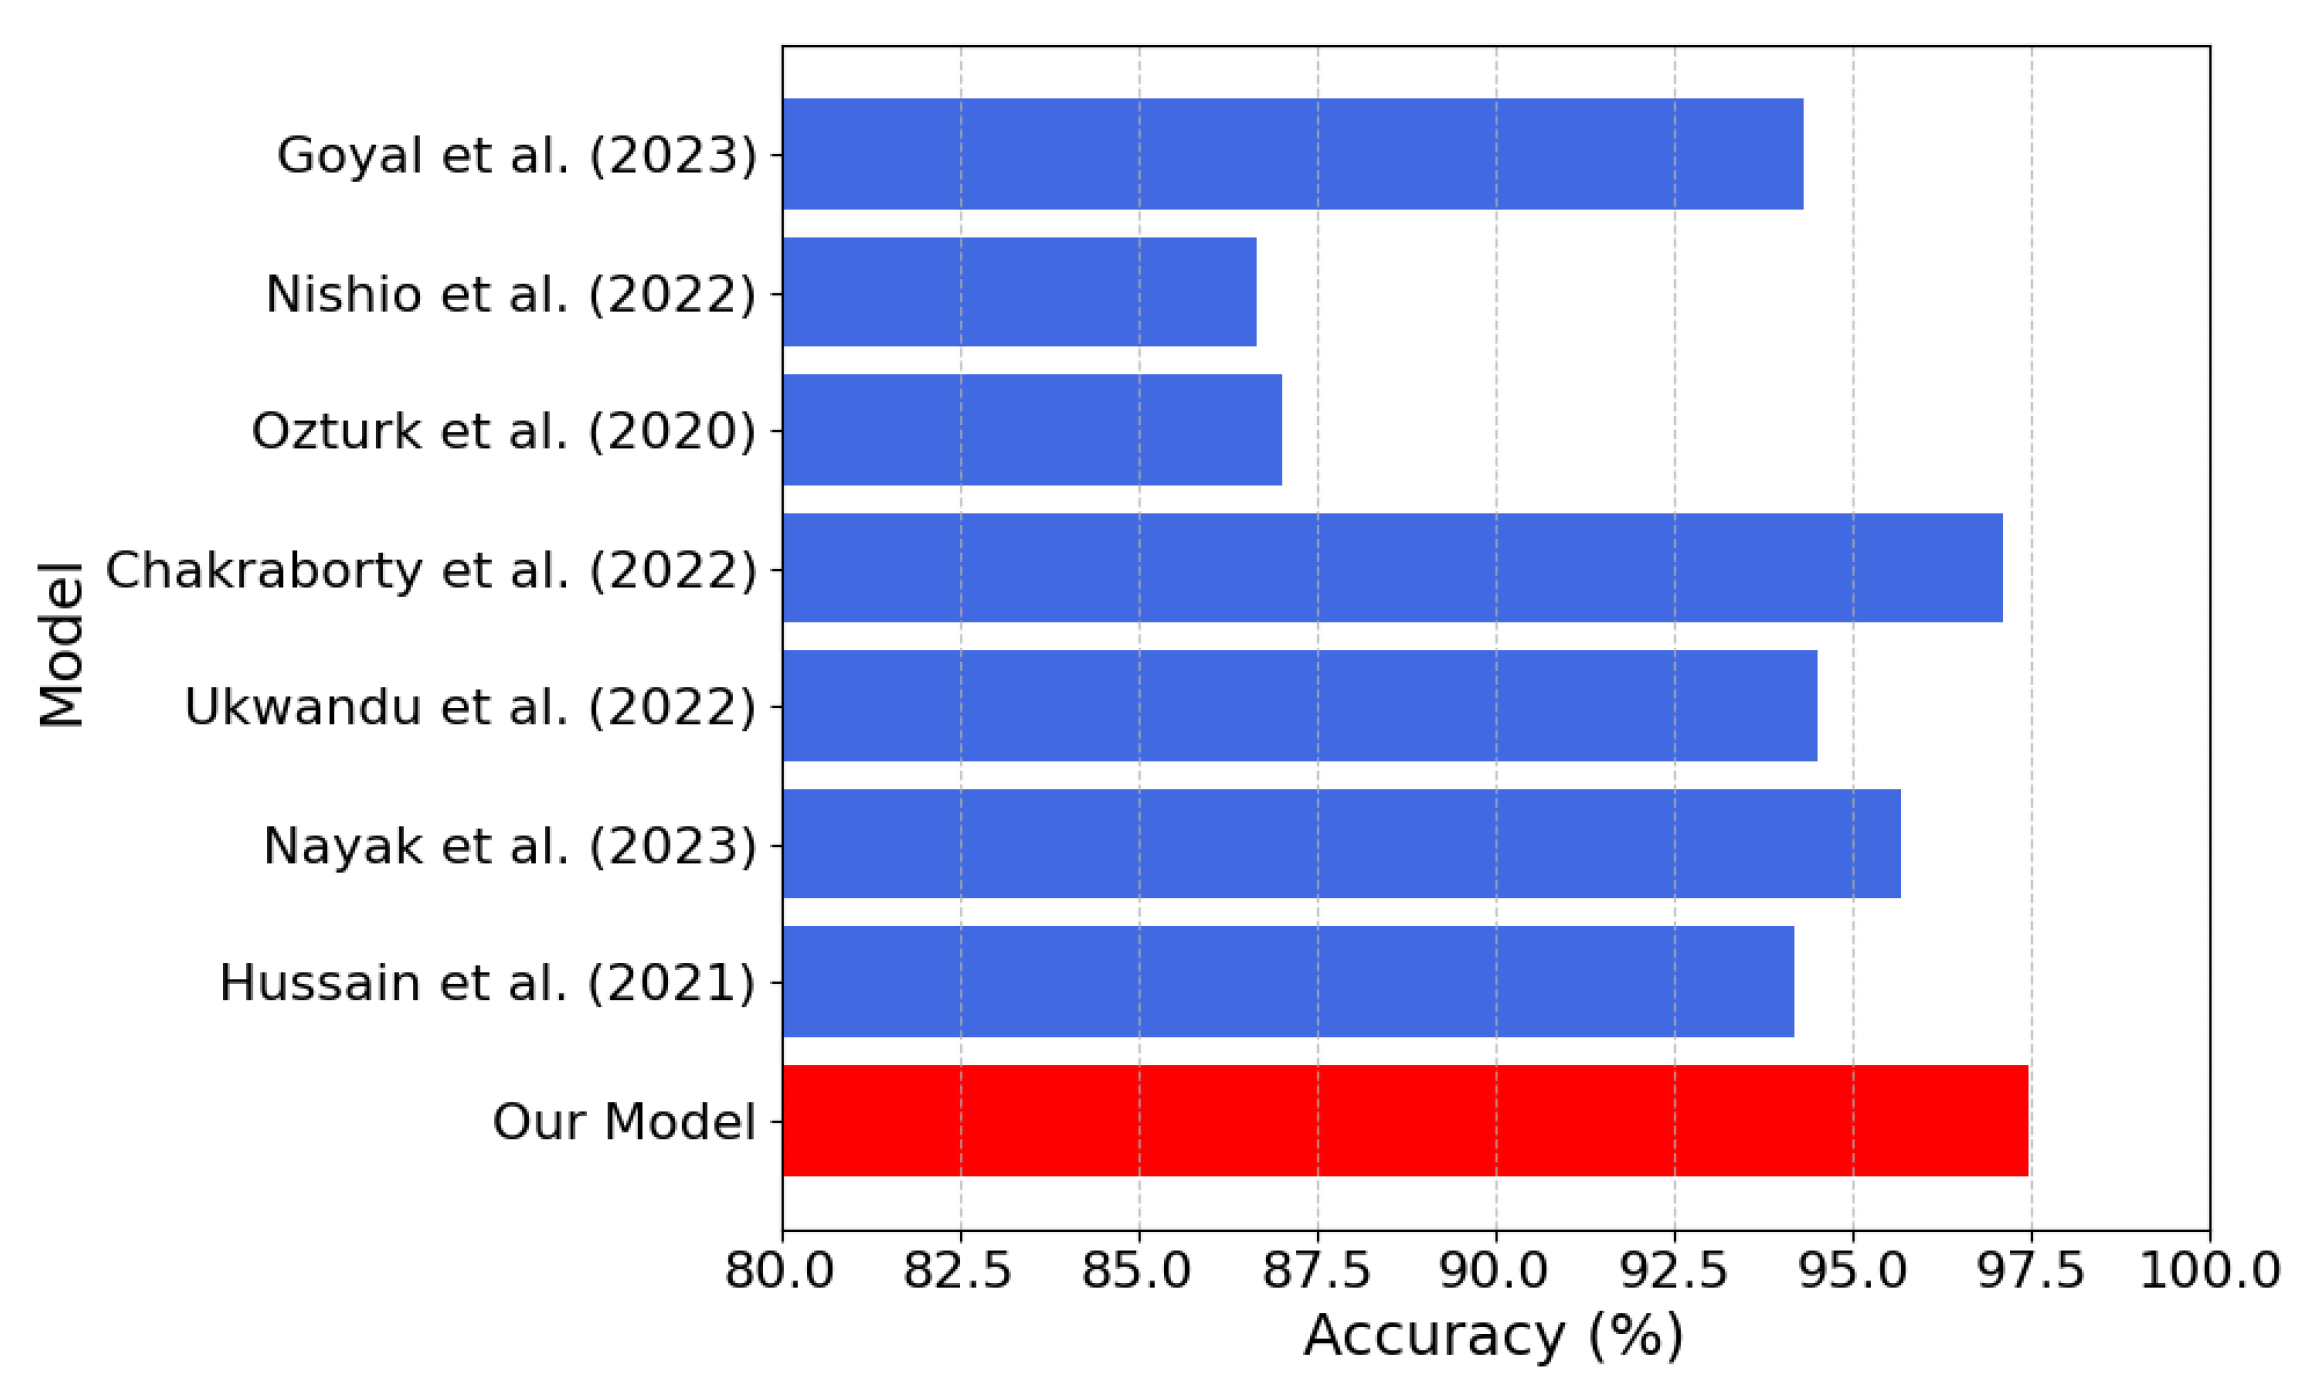
| Model | Precision (%) | Recall (%) | F1-Score (%) | Accuracy (%) |
|---|---|---|---|---|
| Our Model | 97.48 | 97.48 | 97.47 | 97.48 |
| Hussain et al. (2021) [26] | 94.04 | 92.5 | 91.32 | 94.20 |
| Nayak et al. (2023) [28] | 93.51 | 93.50 | 93.50 | 95.67 |
| Ukwandu et al. (2022) [27] | 94.50 | 92.60 | 92.60 | 94.50 |
| Chakraborty et al. (2022) [21] | 97.23 | 97.09 | 97.15 | 97.11 |
| Ozturk et al. (2020) [22] | 89.96 | 85.35 | 87.37 | 87.02 |
| Nishio et al. (2022) [23] | 87.01 | 86.67 | 86.21 | 86.67 |
| Goyal et al. (2023) [25] | 88.89 | 95.41 | 92.03 | 94.31 |
Disclaimer/Publisher’s Note: The statements, opinions and data contained in all publications are solely those of the individual author(s) and contributor(s) and not of MDPI and/or the editor(s). MDPI and/or the editor(s) disclaim responsibility for any injury to people or property resulting from any ideas, methods, instructions or products referred to in the content. |
© 2025 by the authors. Licensee MDPI, Basel, Switzerland. This article is an open access article distributed under the terms and conditions of the Creative Commons Attribution (CC BY) license (https://creativecommons.org/licenses/by/4.0/).
Share and Cite
Randieri, C.; Perrotta, A.; Puglisi, A.; Grazia Bocci, M.; Napoli, C. CNN-Based Framework for Classifying COVID-19, Pneumonia, and Normal Chest X-Rays. Big Data Cogn. Comput. 2025, 9, 186. https://doi.org/10.3390/bdcc9070186
Randieri C, Perrotta A, Puglisi A, Grazia Bocci M, Napoli C. CNN-Based Framework for Classifying COVID-19, Pneumonia, and Normal Chest X-Rays. Big Data and Cognitive Computing. 2025; 9(7):186. https://doi.org/10.3390/bdcc9070186
Chicago/Turabian StyleRandieri, Cristian, Andrea Perrotta, Adriano Puglisi, Maria Grazia Bocci, and Christian Napoli. 2025. "CNN-Based Framework for Classifying COVID-19, Pneumonia, and Normal Chest X-Rays" Big Data and Cognitive Computing 9, no. 7: 186. https://doi.org/10.3390/bdcc9070186
APA StyleRandieri, C., Perrotta, A., Puglisi, A., Grazia Bocci, M., & Napoli, C. (2025). CNN-Based Framework for Classifying COVID-19, Pneumonia, and Normal Chest X-Rays. Big Data and Cognitive Computing, 9(7), 186. https://doi.org/10.3390/bdcc9070186