1. Introduction
With the advent of big data, industries are increasingly turning to data mining techniques to transform large, heterogeneous data into actionable knowledge [
1,
2]. These techniques are essential to extract meaningful patterns from such complex datasets, enabling more informed decision-making across business processes [
3]. Data mining techniques have demonstrated versatility across different sectors, improving efficiency and addressing domain-specific challenges. More specifically, in the manufacturing domain, efforts include the implementation of condition monitoring systems to predict and detect anomalies and machine failures [
4], the development of scheduling techniques for flexible systems [
5], and the use of neural networks for posture recognition [
6]. In the healthcare domain, notable applications include the development of process discovery algorithms for analyzing patient pathways [
7] and the application of anomaly detection algorithms to enhance billing processes [
8]. Other applications span domains such as sports analytics, where association rule mining has been used to uncover performance patterns in basketball games [
9], and digital marketing, where Long Short-Term Memory (LSTM) models help predict user actions by capturing behavior and interests [
10]. Using such techniques, it is possible to design end-to-end pipelines that transform raw data into insights for business experts, leveraging both standard and business-tailored, experimental algorithms. However, in industrial settings, where time is a critical asset, data mining pipeline design and validation efficiency become essential. As a matter of fact, data mining pipelines often incur significant computational costs when executed over long periods [
11], meaning that even minor design flaws can result in substantial financial losses [
12], particularly when handling high-volume data. To mitigate these risks, early error detection and correction are crucial to minimize wasted resources and ensure cost-effective operations. This underscores the need for an easy-to-use, collaborative tool for business experts, allowing them to efficiently prototype and refine data mining pipelines before integrating them into the organization’s production workflow. To address this,
rapid prototyping can be used to allow faster iteration and validation of pipeline designs. Rapid prototyping can be defined as a process that enables the rapid creation of prototypes, which helps industries to validate and test new products quickly [
13]. During the product development process, rapid prototyping allows for the efficient and cost-effective validation of design concepts before committing to full-scale production. Similarly, in the context of data mining, this translates to working with small, representative datasets rather than the full data volume—enabling faster experimentation, easier debugging, and a deeper understanding of the data’s structure and key patterns before scaling to production workloads. Therefore, by rapidly generating prototypes and validating them against representative datasets, industries can identify and address issues early on, saving time and reducing the risk of project failure [
14,
15]. In a data mining project, providing systems supporting this approach enables business experts to confidently explore new solutions while cost-effectively streamlining the decision-making process.
In this paper, we present a novel framework for rapidly prototyping data mining pipelines, namely Rainfall 1.0, hereafter referred to simply as Rainfall. The framework supports the entire lifecycle of a pipeline, from programming to execution and monitoring, through an intuitive web-based interface. Users can visually compose pipelines by dragging and connecting nodes, which represent data mining operations provided by the extendable Rain library. Once configured, pipelines can be executed and monitored in real time via a dynamic dashboard that displays their status and execution logs. Rainfall also offers repository-based pipeline management, enabling users to launch, export, or share their workflows. Additionally, built-in tools for organizing and visualizing datasets in multiple formats support effective data exploration and preparation. The framework was designed and developed as part of collaborative data mining projects with various industries, ensuring that its features effectively address real-world industrial needs. We present and discuss the process of eliciting its requirements, detail its architecture, and showcase its practical application through an industrial case study. Then, we proceed to evaluate the framework’s scalability, usability and applicability and discuss the results, while addressing its limitations and future work. By sharing our findings, we aim to contribute to the understanding of the development process of frameworks for rapidly prototyping data mining pipelines that adhere to guidelines found in the literature while addressing specific business needs. Our findings provide valuable insights into the benefits of custom solutions designed to address common challenges. By collaborating on these challenges, academia and industry can combine their resources to generate new knowledge, leading to impactful publications for the academic community and tangible business improvements for industry professionals [
16].
The remainder of the paper is organized as follows.
Section 2 outlines the process of identifying the requirements that define a framework for rapid prototyping of data mining pipelines.
Section 3 reviews and compares related works in light of these requirements.
Section 4 introduces Rainfall, detailing its architecture and core features.
Section 5 presents the assessment of the framework through a case study, a computational scalability analysis, and a SWOT evaluation.
Section 6 discusses how Rainfall addresses the identified requirements and evaluates its usability and practical applicability. Finally,
Section 7 summarizes the main findings and outlines directions for future development.
2. Materials and Methods
In this section, we explain the employed methodology for identifying the requirements of a framework for rapidly prototyping data mining pipelines. Based on this methodology, we then outline the resulting set of requirements, organized according to their respective sources.
2.1. Methodology
To strike an effective balance between academic insights and real-world needs, we drew on existing research while maintaining close collaboration with industry partners. More specifically, the methodology consisted of analyzing relevant research in both rapid prototyping and data mining to identify key features to incorporate into our framework implementation. We focused on recognizing common practices and functional requirements that could effectively support iterative pipeline design and the application of data mining techniques.
For rapid prototyping, a process focused on quickly developing and refining prototypes, we referred to prior studies exploring its application in knowledge discovery and iterative software design. In particular, we built on the key aspects of rapid prototyping frameworks for knowledge discovery outlined in [
17]. These frameworks emphasize iterative development and testing, allowing users to experiment with prototypes and refine them based on immediate feedback. Such concepts offer a solid foundation for designing frameworks that streamline the iterative process of creating and refining data mining pipelines. By integrating them, our framework not only aligns with theoretical best practices but is also practical for industrial use by supporting fast, reliable, and scenario-based experimentation. This adaptability facilitates efficient testing of different techniques and configurations, reducing the time and effort required to gain actionable insights. Then, for data mining, we referred to the CRISP-DM project [
18], which is widely recognized as a standard for structuring and implementing data mining projects. The CRISP-DM project defines a process model, see
Figure 1, which provides a framework to efficiently carry out data mining projects, independent of both the industry sector and the technology used. In particular, the CRISP-DM process model consists of six phases, common to every data mining project, and describes their expected outcomes. The
Business Understanding phase involves identifying the business objectives to be achieved and translating them into a data mining problem. Following this, the
Data Understanding phase focuses on conducting an initial data exploration to familiarize oneself with the dataset, identify quality issues, and uncover preliminary insights. In the
Data Preparation phase, the final dataset is constructed by selecting the appropriate attributes, cleaning, and transforming the data. The
Modeling phase is centered on selecting and applying the most suitable modeling techniques while calibrating their parameters. Once the model is developed, the
Evaluation phase assesses the model and its development process, considering any overlooked business aspects and deciding on the implementation of the data mining results. Finally, the
Deployment phase presents the acquired knowledge in a usable format for the customer and defines the necessary actions to implement the models effectively.
This theoretical foundation guided our initial development choices. In a subsequent phase, we engaged with our industry partners to validate the findings and enrich them with domain-specific requirements based on their operational needs. This iterative, communication-intensive validation process ensured that the resulting framework would be both theoretically grounded and practically relevant. The entire process took place over a 5-year span involving different industries, with the stakeholders being primarily business experts, chief information officers, and product owners, whose insights were crucial for aligning the project with real-world requirements. In particular, we relied on team coordination tools, such as Microsoft Teams and Slack, for quick interactions between team members. Such tools were useful for addressing minor issues or receiving prompt feedback, although more complex matters were escalated to other settings for deeper analysis. Weekly reviews with stakeholders were scheduled to review progress, explore new ideas, and resolve outstanding issues. Hands-on sessions with end-users provided direct feedback on the framework, helping identify bugs and gather suggestions for improvement. By listening to their feedback, we were able to gain insights into which features would be most beneficial to add to the framework and how to prioritize them. As a result, we were able to evolve the framework in a way that closely aligns with user needs. Workshops with business experts were pivotal for gaining a deeper understanding of industrial operations and challenges. They provided detailed explanations of business processes and datasets, accelerating our learning curve and ensuring our solutions were grounded in domain knowledge.
2.2. Requirements
The outlined methodology led to the identification of a set of requirements, which are detailed below and organized according to their origins.
2.2.1. Rapid Prototyping
A rapid prototyping framework, as outlined in [
17], must be flexible and transparent with respect to data mining methods and data inputs, easy to use without requiring extensive training, and provide mechanisms to evaluate the obtained results. Based on this work, the following key requirements are derived and summarized below. First, a rapid prototyping framework (
i) must offer a wide range of techniques and (
ii) make it easy to incorporate new methods. Then, it (
iii) must handle diverse types of input data, such as time series or text, with minimal user effort. Furthermore, a rapid prototyping framework (
iv) must offer functionalities for evaluating the obtained result, such as calculating the precision of a classification model [
19]. Finally, the framework (
v) must guarantee ease of use so that users do not have to learn a complex formalism. In this context, ease of use can be tied to a black box abstraction of functionality, where users focus on interactions without concern for underlying mechanics. For this reason, many frameworks employ the paradigm of dataflow programming to enable rapid prototyping [
20], which is a programming paradigm based on organising computation as a graph where changes to the inputs are automatically propagated to the outputs. While this abstraction aids simplicity, it can hinder understanding, debugging, or trust in the computations. To address this, we propose extending (
v) to incorporate
transparency, ensuring users can inspect and comprehend the actual code or logic behind the abstraction. This aligns with (
v)’s intent of user empowerment by making not only interaction but also understanding accessible, thus fostering trust and flexibility.
2.2.2. Data Mining
Apart from the preliminary Business Understanding phase, the remaining five phases of the CRISP-DM process model can be directly supported by a data mining framework, providing a basis for deriving its technical requirements. To support the Data Understanding phase, a framework (
vi) must offer tools for retrieving and visualizing data. For the Data Preparation phase, it (
vii) must enable efficient data manipulation. To support the Modeling phase, the framework (
viii) must provide the capability to execute a wide range of data mining algorithms, ensuring users have access to a comprehensive toolkit. Addressing data mining challenges often involves leveraging diverse techniques, each contributing unique strengths to extract insights and tackle complex problems effectively. With regards to this, the aforementioned works [
4,
5,
6,
7,
8,
9,
10] provided valuable insights into the techniques most commonly employed in practical data mining scenarios, helping to identify those with the greatest impact and applicability. For instance,
machine learning focuses on developing models and algorithms for tasks such as prediction, classification, and clustering, enabling users to derive valuable insights from structured data [
21]. Building on this foundation,
deep learning utilizes artificial neural networks to uncover intricate patterns in large, unstructured datasets, excelling in areas like image recognition, natural language processing, and recommendation systems [
22]. Complementing these approaches,
process mining analyzes event logs to provide a process-centric perspective, uncovering inefficiencies, ensuring compliance, and enhancing process performance across industries [
23]. By integrating algorithms from these diverse fields, the framework ensures flexibility and versatility, enabling users to tackle a wide array of data mining challenges and effectively supporting the Modeling phase. Then, for the Evaluation phase, the framework (
ix) must include features for assessing the quality and effectiveness of the mining results. Lastly, to facilitate the Deployment phase, the framework (
x) must offer options to export and make use of the mining outcomes.
2.2.3. Industry-Driven Requirements
In collaboration with industries, we defined two industry-driven requirements to ensure seamless framework integration into their enterprise architectures. First, the framework (xi) must support collaborative features by enabling users to share their work with team members and stakeholders easily. This includes sharing data and mining results, thereby facilitating teamwork and encouraging iterative improvements within the organization. Second, the framework (xii) must have a free and open-source license. This requirement ensures accessibility without licensing fees or proprietary restrictions, empowering users to examine, modify, and contribute to its development. It is important to highlight that these requirements were strongly endorsed by the industries involved in the discussion as crucial elements for ensuring the sustainability of a framework like Rainfall in practice.
2.3. Summing Up
In order to address potential overlaps among the requirements listed above, we consolidated them into a unified set with more intuitive names. This refinement aimed to simplify the framework’s design goals while ensuring that all original requirements were fully accounted for. The resulting set of consolidated requirements, along with their mapping to the original set, is summarized in
Table 1. In the table, the original requirements are grouped by their domain of origin, namely rapid prototyping (RP), data mining (DM), and industry-driven (ID). The merging of certain requirements, such as
Understanding incorporating both (
iii) and (
vi), ensures that addressing the refined requirement simultaneously satisfies all aspects of the original ones. As a consequence, the refined set of requirements, when satisfied, inherently addresses all the original requirements listed above.
3. Related Work
In this section, we present an evaluation of state-of-the-art frameworks for rapidly prototyping data mining pipelines. The tools discussed in this section were selected based on their support for dataflow programming paradigms for the rapid prototyping of data mining pipelines. In particular, we summarize each framework’s features and limitations with respect to the requirements outlined in
Section 2.
RapidMiner (available at
https://altair.com/altair-rapidminer, accessed on 10 May 2025) is a commercial platform widely recognized for its capabilities in data science, machine learning, and predictive analytics. It provides a powerful graphical interface for designing data pipelines using a visual programming paradigm, making it appealing to non-programmers and business analysts. Users can create complex dataflows by dragging and dropping predefined operators, covering tasks such as data preparation, modeling, evaluation, and deployment. One of RapidMiner’s strengths lies in its comprehensive collection of built-in operators, which support a variety of machine learning algorithms, statistical methods, and data transformation tools. It also integrates well with popular data sources and external libraries, and offers automation features for repetitive dataflows. From a technical standpoint, RapidMiner lacks native support for process mining and relies on third-party extensions, whose integration is not straightforward. Moreover, one of RapidMiner’s limitations is its restrictive licensing model. While a free version is available, it comes with substantial limitations in terms of the number of rows and operators that can be used. Access to full functionality requires a paid subscription, creating a significant barrier for experimenting with innovative, business-tailored solutions. In addition, although RapidMiner includes some collaboration tools, its collaborative capabilities are tightly coupled with the enterprise version, and its dataflows are not easily version-controlled or shared in an open environment. In summary, RapidMiner is a solid and robust platform with a wide feature set and strong support for enterprise applications. However, it falls short in terms of openness, accessibility, and ease of extendability. Its proprietary nature and licensing restrictions make it less suitable for experimental and collaborative use cases, especially in research and prototyping settings where flexibility and lightweight experimentation are essential.
Orange 3 (available at
https://orangedatamining.com, accessed on 10 May 2025) is an open-source data mining and machine learning tool that provides a visual programming interface through a widget-based environment. It is particularly appreciated in educational contexts for its intuitive design and ease of use. Users can build dataflows by connecting nodes representing preprocessing steps, learners, and evaluators without the need to write code. This makes it accessible to non-programmers and beginners in data science. Despite its user-friendliness, Orange 3 presents several limitations when evaluated against professional or enterprise-level needs. First, it lacks support for collaborative features, making it difficult for teams to share or co-develop dataflows, as files are stored locally, and there is no built-in mechanism for versioning. Second, it does not offer native support for process mining, which is a core requirement in domains such as business process analysis and operational optimization. Additionally, the tool has limited support for extendability: users cannot easily extend existing widgets or integrate arbitrary external libraries without delving into the internal codebase, which is not straightforward. Finally, Orange 3’s focus remains on educational use and small-scale experimentation. This is reflected in the lack of features for deployment, automation, or integration into larger data ecosystems, which are critical capabilities in production scenarios. As such, while Orange 3 is excellent for learning and teaching basic data mining concepts, it is not well suited for complex, experimental dataflows in collaborative, industrial settings.
Weka [
24] (Waikato Environment for Knowledge Analysis) is a long-standing and widely adopted open-source suite of machine learning tools. It provides a comprehensive collection of algorithms for tasks such as classification, regression, clustering, association rule mining, and data preprocessing. Weka is particularly well suited for educational and academic research contexts thanks to its simplicity, portability (being implemented in Java), and active development over decades. The tool offers both a graphical user interface and a command-line interface, making it accessible to users with varying levels of technical expertise. Through its GUI, users can construct pipelines of preprocessing and modeling steps by chaining together algorithm components, with results displayed through built-in visualization tools. Despite these strengths, Weka presents significant limitations when evaluated against the criteria defined in
Section 2. Its architecture is monolithic and not easily extendable for defining custom dataflows or integrating with external systems. Furthermore, Weka lacks support for visual programming paradigms, which are preferred for their ability to lower the barrier to entry for non-programmers. From a collaboration perspective, Weka does not provide any features for multi-user editing or data flow sharing, making it unsuitable for team-based projects. Additionally, the tool has no built-in support for process mining, which is a key requirement for many industrial use cases. While Weka’s strength lies in its rich repository of machine learning algorithms and proven reliability in academic environments, it falls short in terms of collaboration, extendability, process mining support, and visual dataflow programming. As such, Weka remains a valuable reference point in the field but does not meet the broader needs addressed by the requirements elicited in
Section 2.
DeepBlocks [
25] is a block-based deep learning framework that leverages a visual programming paradigm to simplify the construction of neural networks. It offers a user-friendly interface where models can be built by connecting blocks that represent layers, optimizers, data sources, and other components. This visual approach is particularly appealing for educational purposes and for users with limited programming experience who want to experiment with deep learning concepts. Despite its accessibility and focus on deep learning, DeepBlocks presents several limitations when considered from the broader perspective of data mining and business-oriented pipeline development. Firstly, its functionality is centered on deep learning architectures, with little to no support for classical machine learning techniques such as decision trees or clustering algorithms. This makes it less suitable for applications that require a diverse set of analytical tools. Secondly, DeepBlocks does not support process mining, an essential requirement in many enterprise settings where understanding and improving business processes is critical. It lacks mechanisms for handling event logs or modeling process-related behaviors. Moreover, DeepBlocks is primarily designed for individual use, and it does not provide built-in tools for version control or multi-user project management. This lack of team-oriented features limits its usefulness in organizational contexts where coordinated development is needed. Finally, the extendability of the platform is limited, as users cannot easily integrate custom blocks or external libraries to tailor the tool to specific domain requirements. This restricts its adoption in more complex or specialized use cases that go beyond its default capabilities. In summary, DeepBlocks represents a compelling approach for visualizing and experimenting with deep learning dataflows. However, its narrow scope, limited extendability, and absence of collaborative features make it insufficient for fulfilling the technical and organizational needs addressed in
Section 2.
KNIME (Konstanz Information Miner) (available at
https://www.knime.com/knime-analytics-platform, accessed on 10 May 2025) is an open-source platform for data analytics, reporting, and integration. Like RapidMiner, it adopts a visual dataflow programming approach where users assemble data mining pipelines by connecting modular nodes representing data sources, transformations, and visualizations. It supports a wide range of file formats, databases, and programming languages such as R (version 1.5 or later), Python (versions 3.9 to 3.11), and Java (version 17), and includes an ecosystem of extensions that expand its functionality for tasks such as process mining and deep learning. However, while it is designed to be extendable, incorporating custom nodes or algorithms into KNIME requires substantial technical effort, involving low-level plugin development in Java. Moreover, while offering a versatile and feature-rich platform, it imposes significant limitations in its free version, reserving key functionalities for the commercial edition. This restricts users, particularly in small-scale settings, from fully exploring and prototyping advanced data mining pipelines, ultimately hindering experimentation and innovation. In summary, KNIME shares Rainfall’s visual approach to pipeline design, but its limitations in terms of collaboration, process mining support, and lightweight extendability make it less suitable for the specific requirements addressed by Rainfall. In particular, Rainfall’s open architecture, built-in support for process mining, and real-time collaboration features position it as a more flexible and accessible alternative, especially in research and prototyping contexts.
BlocklyML (available at
https://blocklyml.onrender.com, accessed on 10 May 2025) is an educational framework that allows users to create machine learning dataflows through a visual block-based interface. Built on top of Google’s Blockly library, it aims to simplify the process of designing and executing machine learning models by implementing a visual dataflow programming approach. This makes BlocklyML especially attractive in educational contexts, where the primary goal is to teach the foundations of machine learning to students without requiring prior programming knowledge. However, BlocklyML’s simplicity comes at the cost of limited functionality. Its support for machine learning tasks is restricted to a small set of basic algorithms, typically covering elementary classification or regression models, while lacking support for more advanced techniques. Moreover, the platform does not support process mining. This limitation alone disqualifies it for many enterprise or research use cases that require a broader analytic scope. A further drawback lies in the lack of extendability. Users cannot easily add custom algorithms, define new block types, or integrate external libraries, restricting the adaptability of the platform to domain-specific needs or evolving project requirements. From a collaborative standpoint, BlocklyML does not provide features for multi-user interaction, versioning, or dataflow sharing, which are essential in environments where projects are developed in teams. In conclusion, while BlocklyML serves as a valuable entry point to machine learning education, its constrained algorithmic support, absence of collaboration, and non-extendable architecture limit its applicability to more complex, team-based data mining projects. It thus does not meet the technical and organizational requirements outlined in this work.
In summary, the comparative analysis presented in
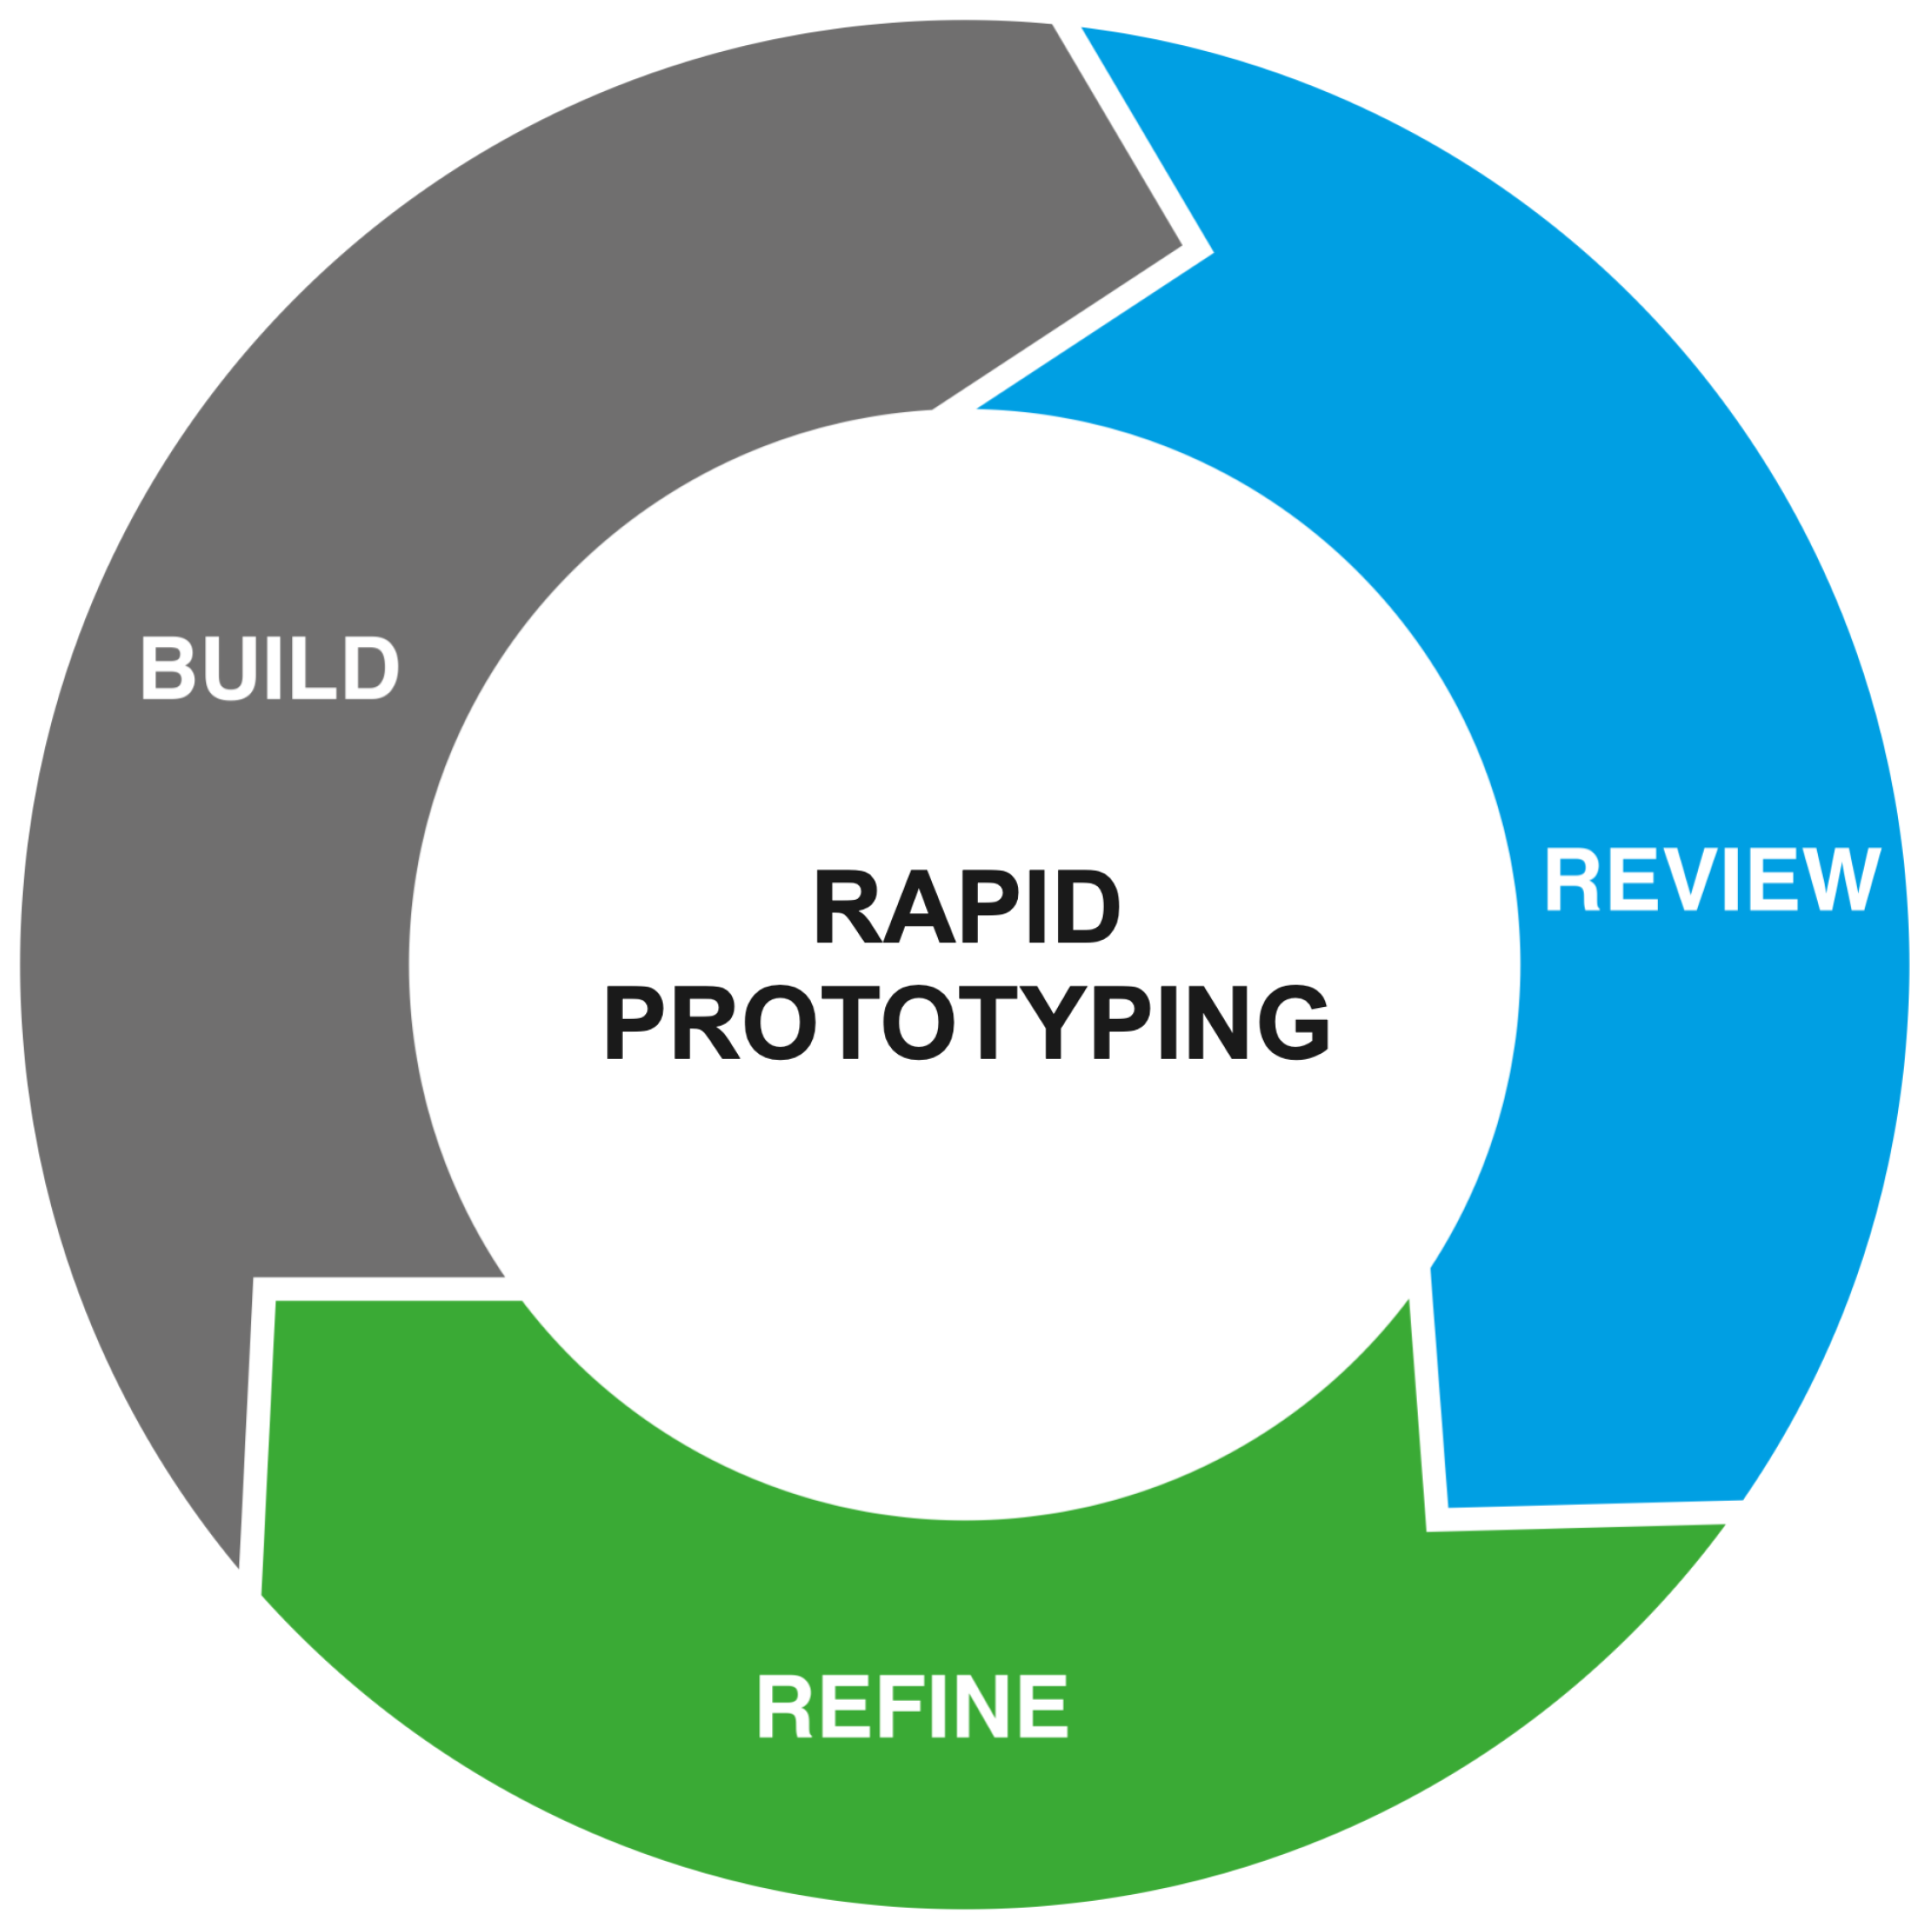
Table 2 reveals that most of the examined tools lack essential features such as native support for process mining, extendability, and collaboration capabilities. Academic and educational tools like Orange 3, BlocklyML, DeepBlocks, and Weka are particularly limited in terms of modeling components, especially for process mining. The narrow scope of tasks they support results in a constrained set of possible operations, which hampers their ability to handle the diverse and dynamic requirements of advanced dataflows. This makes them unsuitable for creating and executing complex data mining pipelines that represent tailored solutions in complex industrial scenarios. In contrast, commercial tools like RapidMiner and KNIME are more robust, offering a wider range of features and stronger support for enterprise-level applications. However, these platforms place limited emphasis on openness, as they are not fully free and open-source solutions. Their licensing models often restrict access to advanced features or impose limitations on deployment and integration, which can hinder experimentation in exploratory and prototyping contexts. Moreover, while both platforms support the development of custom nodes and components, this process is not immediate and requires good expertise in software development and integration. Lastly, their large and mature ecosystems, while powerful, contribute to increased complexity and steepen the learning curve, making them less approachable for new users or teams seeking lightweight and agile prototyping environments. These shortcomings underscore the need for a new framework that combines visual programming with an open, collaborative, and easily extendable architecture, specifically designed to support the rapid prototyping process, shown in
Figure 2, of data mining pipelines in diverse industrial contexts. Rather than replacing enterprise-grade tools, such a framework would serve as a lightweight and accessible environment for quickly designing and validating pipeline solutions, which can later be transferred to more complex platforms for large-scale deployment and production. This approach would lower the entry barrier for experimentation and innovation, making it a promising direction for both research and industrial development.
4. Rainfall
In this section, we introduce Rainfall, a novel framework for rapidly prototyping data mining pipelines, developed to meet the requirements outlined in
Section 2. A deployed version of Rainfall, a screencast video demonstrating the tool, its source code, and container image repositories, are available online at
https://pros.unicam.it/rainfall (accessed on 10 May 2025).
4.1. Architecture Overview
The two main components of the framework, whose architecture can be appreciated in
Figure 3, are the
Rain library and the
web application. The Rain library integrates functions from various data mining libraries and exposes them as configurable nodes, which can be connected to define data mining pipelines in Python. Meanwhile, the web application serves as the access point to the framework, allowing users to interact with Rain through a graphical interface. The web application is fully decoupled from the Rain library and does not rely on a static or local copy. Instead, it dynamically retrieves a descriptive JSON file that summarizes the available nodes and their structure. This file is generated every time the Rain library is updated with new nodes and, during the web application’s startup, it is fetched and used to determine which nodes should be available to users. By relying on this pre-generated file, the web application no longer needs a direct dependency on the Rain library, ensuring that changes such as new nodes or major refactorings will not impact the web application, as long as the structure of the exported JSON remains consistent. The Rain library itself is only downloaded at runtime, just before a pipeline is executed, ensuring that the system always uses the most up-to-date version without tightly coupling it to the web application.
The remaining components in the architecture have the role of enhancing the framework’s scalability by allowing the concurrent execution of multiple pipelines, which is made possible by a pool of asynchronous Celery workers and a RabbitMQ task queue. Celery is a distributed task queue system that enables the asynchronous execution of background jobs, e.g., data mining pipelines, while RabbitMQ is a message broker that manages the delivery and queuing of tasks between different components. Practically speaking, the task queue manages each pipeline execution request by holding it until an available worker is ready to process it. Without these two elements, the queuing and execution of pipelines would entirely rely on the web application backend, preventing it from handling additional user requests during long-running computations. By offloading the execution of pipelines to a pool of Celery workers and using RabbitMQ to manage the task queue, the web application can instead act as an intermediary: it allows users to define and trigger pipeline executions, then immediately returns to an idle state, ready to process new requests. This decoupled architecture ensures that multiple pipeline executions can occur concurrently without overloading the web application backend, thereby improving the system’s scalability. For storing and retrieving pipeline-related metadata, a MongoDB database acts as a shared exchange point between the workers and the web application. When a worker takes charge of a request, it identifies the associated pipeline by its ID and retrieves the metadata required for execution from the database: the Python script of the pipeline and its dependencies. These dependencies always include the Rain library, which is installed alongside any other required library. Execution is then initiated and, to support its monitoring, additional metadata are retrieved from the database: a human-readable pipeline name, the user who launched the pipeline, the creation timestamp, execution logs and status, and the JSON structure used to graphically render the pipeline in the web application. The execution logs, initially set as an empty list, and the status, initially marked as “Pending,” are updated in real time by the worker as the pipeline progresses. A NoSQL database like MongoDB is well suited for this use case, as it efficiently stores semi-structured data such as Python scripts and JSON files, and supports data streams for real-time updates, which is essential for tracking execution logs and status. At the end of the execution, the worker’s file system is cleaned up, making it available to handle another pipeline in the queue.
The web application, database, workers, and task queue can all be run in separate Docker containers. Consequently, a container orchestrator, such as Kubernetes, can be employed to manage container scaling rules, resource allocation, and recovery in case of failure. This is particularly advantageous in multi-user environments, where multiple pipeline executions may be requested concurrently. By scaling the number of Celery workers, the system can efficiently manage increasing workloads while maintaining continuous service availability.
4.2. Rain Library
The Rain library is a stand-alone Python library, which serves as the core component of the framework, for defining data mining pipelines following a declarative approach. It is available for inspection and installation from the PyPI repository under the name
rain-dm (available at
https://pypi.org/project/rain-dm, accessed on 10 May 2025).
The Rain library includes the functionalities of many common libraries used for data mining. Such functionalities are abstracted as nodes, which are a combination of one or more functions that a library implements, and represent the building blocks of a data mining pipeline. The core logic of Rain determines how nodes can be linked to define a Directed Acyclic Graph (DAG), which represents an executable pipeline. Nodes are connected through edges, which indicate how the data flows throughout the whole pipeline, under the following constraints: (i) a node can have multiple outgoing edges, but one and only one incoming edge; (ii) a node output can be connected to a node input only if they have matching types; (iii) loops are not allowed. Before executing a pipeline, the library performs checks on these constraints to ensure its correctness.
The library currently supports two types of nodes: computational nodes and connector nodes. Computational nodes, which perform data processing and mining tasks, run some sort of computation on the input data and deliver the produced output at the end. They support different data mining techniques (i.e., machine learning, deep learning, and process mining) employing both standard and custom algorithms. On the other hand, connector nodes enable data access and they can either be input nodes, to read data from a data source, or output nodes, to dump data into a data sink. Connector nodes are usually found at both ends of a pipeline but can be used at any point. For example, output nodes can be utilized within the pipeline to save intermediate results, enabling users to preserve and analyze data at various stages of the execution. Both node types may include configurable parameters, such as the connection string for an input node connecting to a database or the number of clusters to generate for a computational node performing a machine learning task.
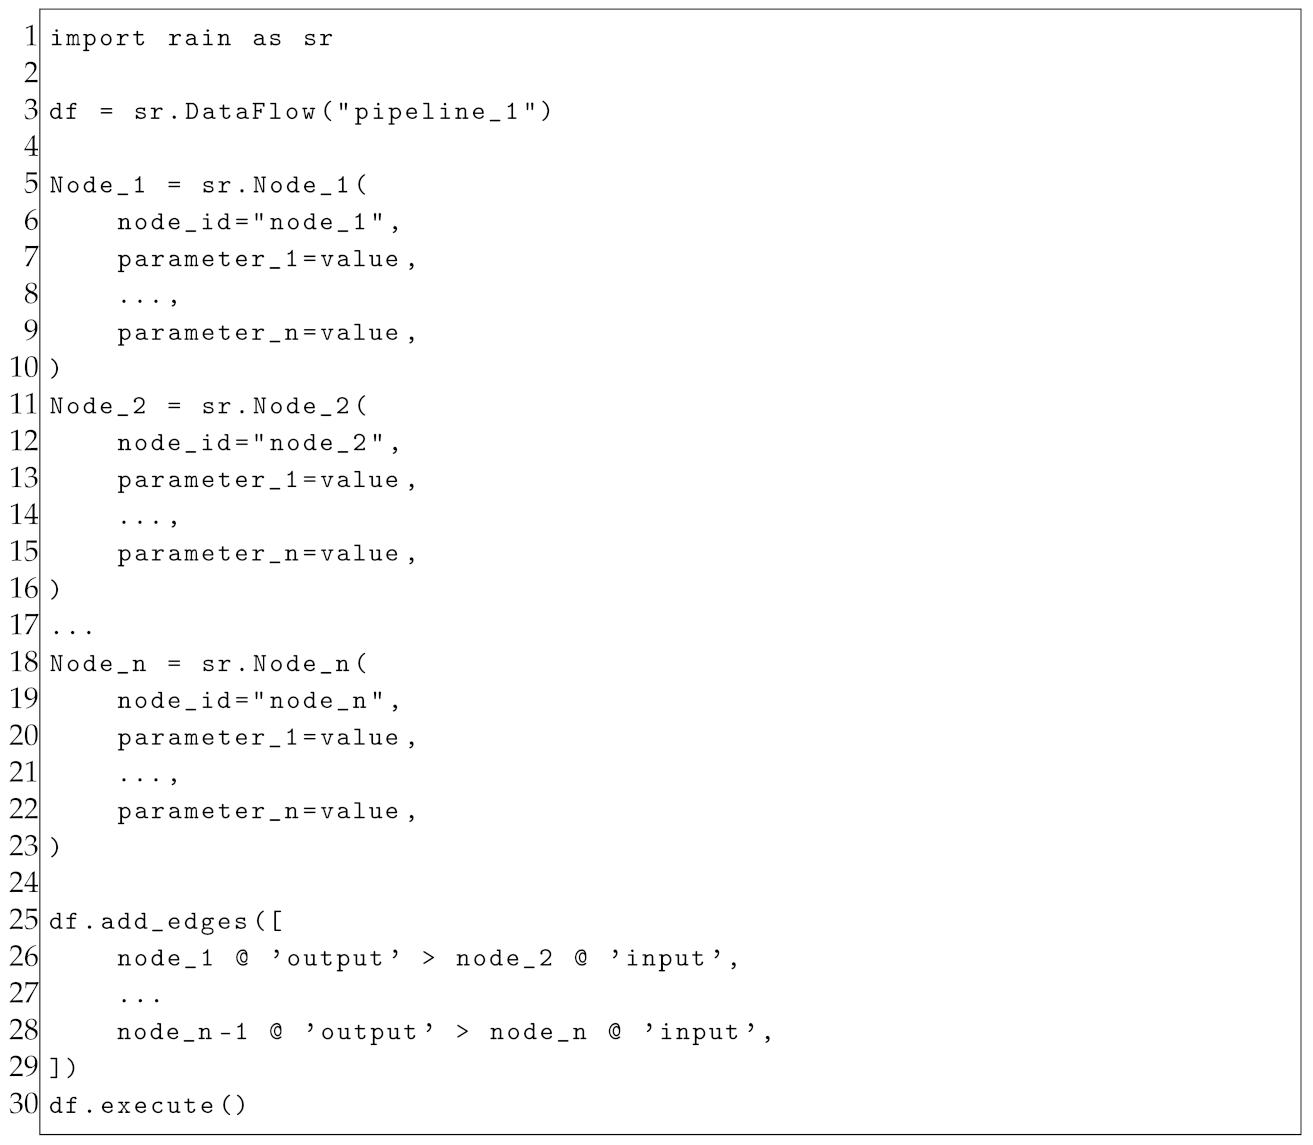
Through a specific textual notation, Rain nodes can be connected by edges to program data mining pipelines in the form of a Python script, which follows the structure presented in Listing 1, where the following occurs:
Line 1 imports the Rain library, which is a prerequisite to define and execute the pipeline;
Line 3 creates the pipeline and gives it a name;
Lines 5–23 create the nodes, which can be configured by different parameters;
Lines 25–29 define how the different nodes are connected using a textual notation;
Line 30 executes the pipeline.
| Listing 1. Python script for the definition and execution of a pipeline with Rain. |
![Bdcc 09 00150 i001]() |
Finally, it is worth noting that the Rain library is capable of analyzing itself by leveraging Python’s reflection capabilities. This self-analysis is used to extract detailed information about the available nodes, such as their identifiers, accepted parameters, exposed inputs and outputs, and other relevant metadata. The results of this analysis are stored in a descriptive JSON file, which is retrieved and parsed by the web application at startup.
4.3. Web Application
The web application offers an intuitive user interface for seamless interaction with Rain. Practically, it facilitates a visual approach to
programming,
executing and monitoring, and
managing data mining pipelines. Its source code can be inspected from the online repository (available at
https://bitbucket.org/proslabteam/rainfall_unicam, accessed on 10 May 2025).
4.3.1. Programming
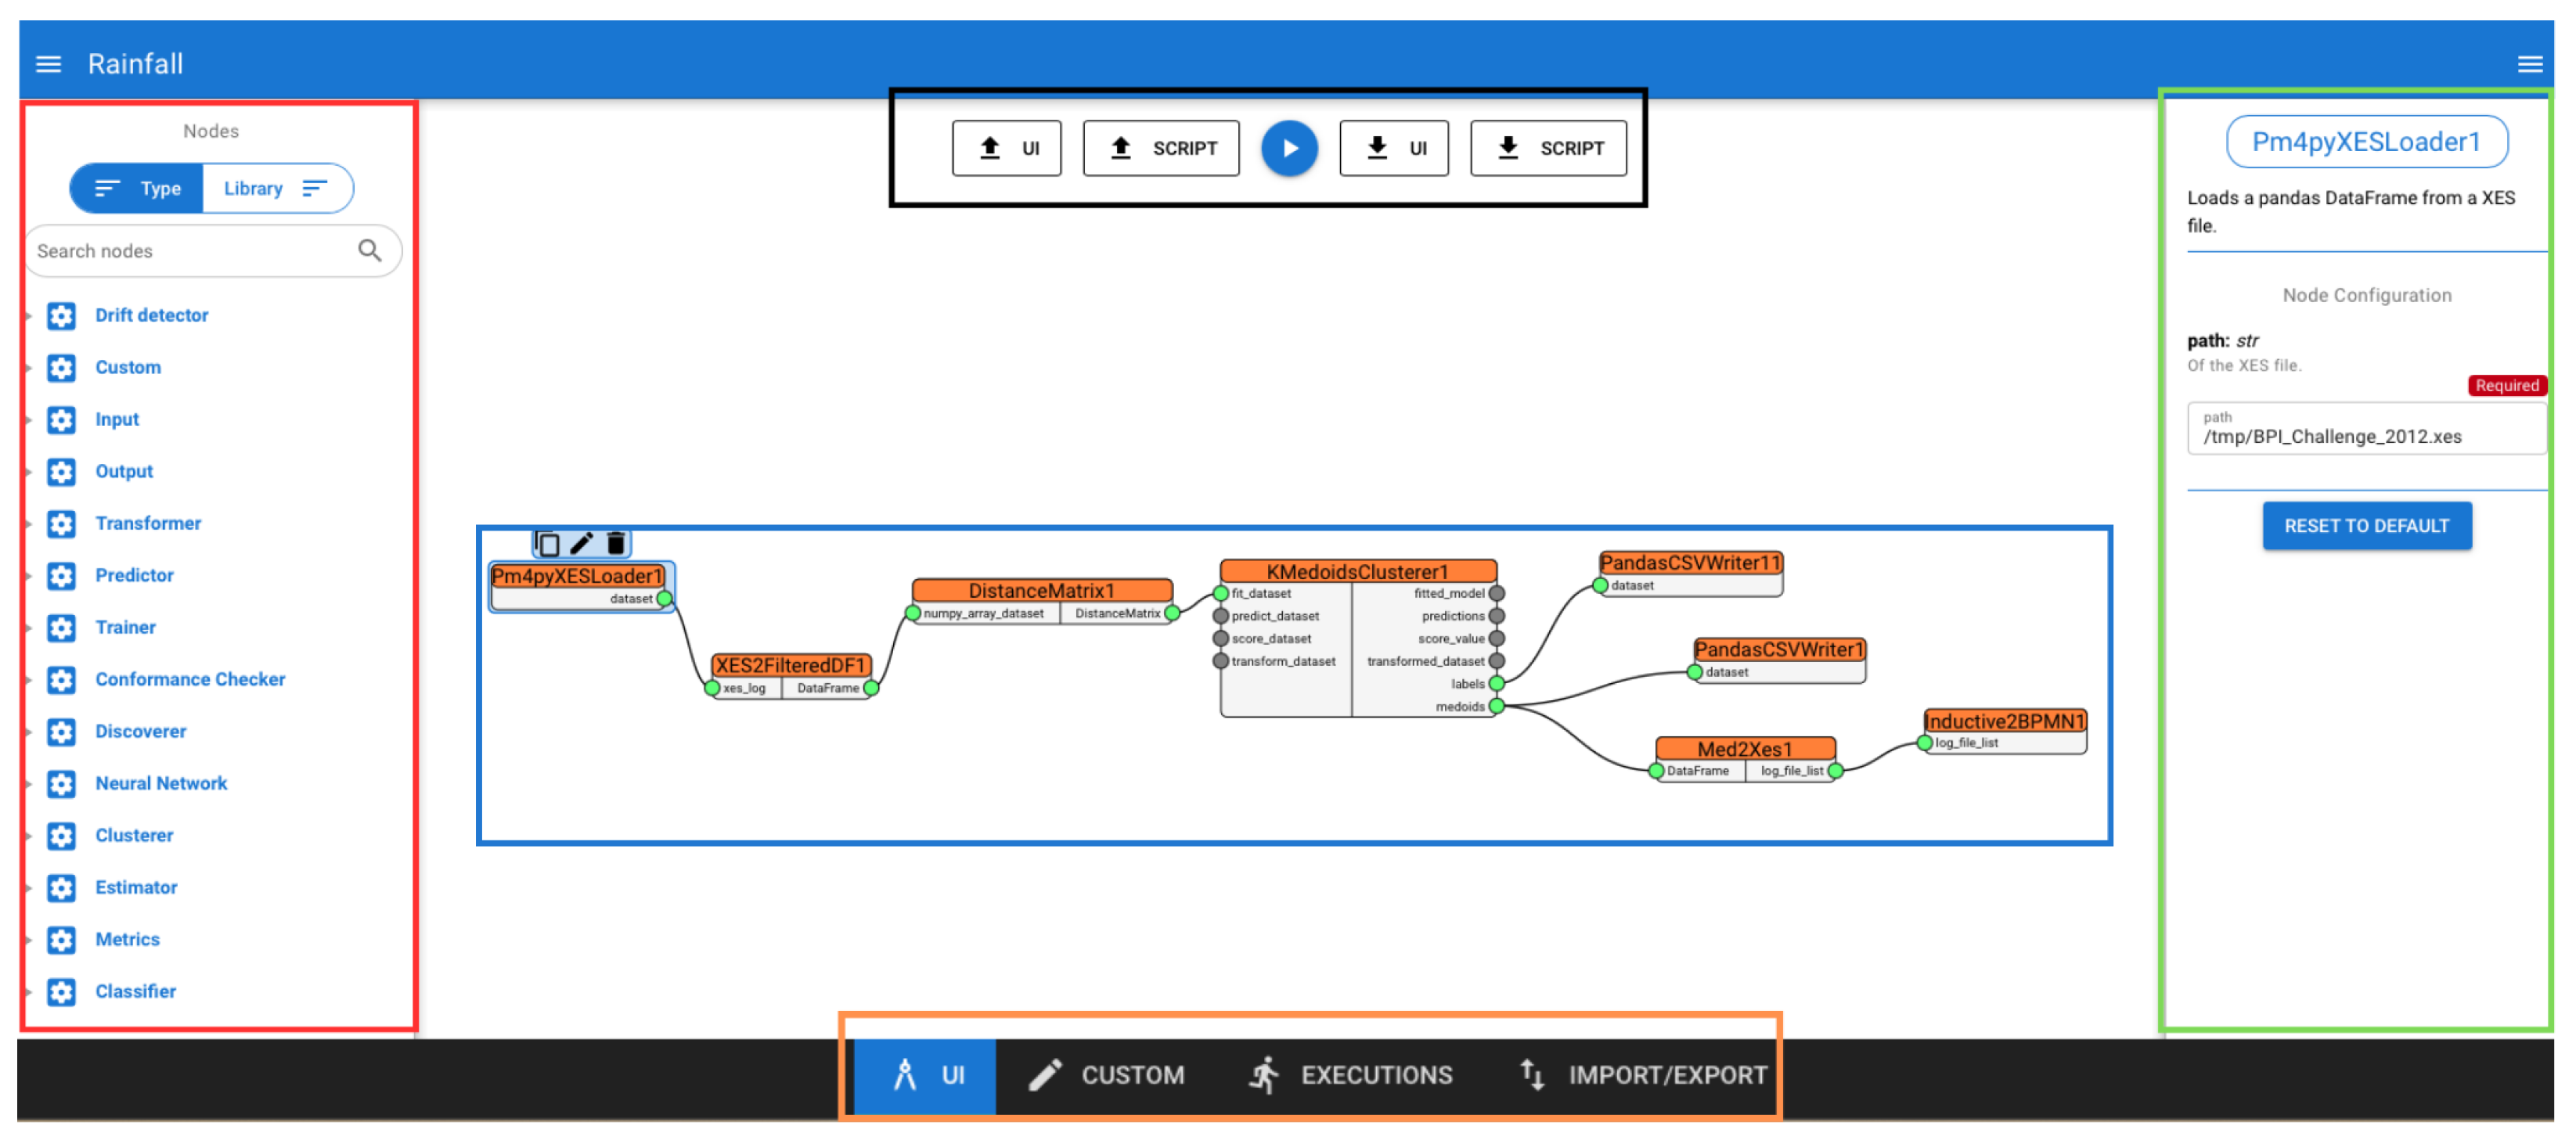
The main canvas, shown in
Figure 4, enables users to select, configure, and connect the nodes to include in a pipeline, as well as queuing its execution, using a graphical approach. The left drawer, red box in
Figure 4, displays the collection of available Rain nodes, which are grouped either by the library they belong to, e.g.,
Pandas, or by their functional role, e.g., Predictor. Nodes in this drawer can be dragged and dropped by users onto the canvas and can be easily duplicated, renamed, and deleted to construct data mining pipelines. When dropped onto the canvas, a node is rendered as a rectangle displaying the name of the node and decorated with named pins on its sides, which are used to connect to other nodes. The pins on the left side are used for receiving data, while the right ones are used for sending data to other nodes. Each pin can be connected to one or more nodes, provided that the two pins have matching data types; otherwise, the connection between the two will not be allowed by the editor. When nodes in the canvas are connected together, a pipeline similar to the one in the blue box in
Figure 4 is displayed on the canvas. By opening the right drawer, the green box in
Figure 4, users can set parameters for the currently focused node. Once the nodes are properly configured, the resulting pipeline can be launched by clicking the play button, the black box in
Figure 4, located at the top of the interface. In the same area, users can also find buttons to download both the Python script and the JSON structure representing the pipeline, as well as to upload these files in order to render a pipeline on the canvas.
Finally, a navigation menu is displayed at the bottom of the interface, the orange box in
Figure 4, allowing users to access other sections of the web application, such as the monitoring panel or the custom node editor. This latter section, shown in
Figure 5, enables the seamless integration of custom nodes, which can be programmed and immediately used alongside the default ones.
The custom node editor supports Python (version 3.9 or later) and provides all the features expected from a full-fledged code editor, including syntax highlighting and autocompletion, while also enabling the definition of utility functions and imports. The code for a custom node must include an entry-point function defined with the def keyword and at least two parameters, which represent the inputs and outputs of the node; any additional parameters are treated as configurable function arguments. Once the code is written and the entry point defined, the custom node can be saved and becomes available in the left-side drawer of the canvas page. Furthermore, the code of any custom node can be modified or deleted at any time.
4.3.2. Execution and Monitoring
Scheduling an execution in the canvas page triggers a display of the detected dependencies for the pipeline, providing users with the opportunity to review, modify, and specify particular library versions if needed. When the user approves the dependencies, the canvas configuration is parsed and translated into a Python script, which will be later executed by one of the workers. Pipelines queued for execution can be monitored by users through the monitoring panel, where they are listed in the left drawer, shown in the red box in
Figure 6. Each item in the list displays the name of the pipeline and its current status, whose value can vary between the following:
Pending: the pipeline execution has been successfully queued but not yet addressed by a worker;
Running: the pipeline is currently under execution;
Success: the pipeline execution terminated successfully;
Error: the pipeline execution did not terminate successfully;
Revoked: the pipeline execution was revoked.
Figure 6.
Rainfall’s monitoring panel. Red box: list of executions; Blue box: pipeline representation; Green box: real-time status and logs.
Figure 6.
Rainfall’s monitoring panel. Red box: list of executions; Blue box: pipeline representation; Green box: real-time status and logs.
By clicking on one of the pipelines, it is possible to appreciate its graphical representation and monitor its logs, shown in the blue box in
Figure 6. Moreover, a loading animation will be rendered on the node that is currently being executed. Once a node execution is over, a tick mark will be displayed on it if the execution was successfully terminated. Otherwise, if an error was encountered during its execution, a warning sign will be displayed instead. It is worth noting that the pipeline status, nodes status, and execution logs are all updated in a real-time fashion and visible in the right drawer, shown in the green box in
Figure 6.
From this drawer, it is also possible to revoke an ongoing pipeline execution, which is a useful feature for saving resources in case there are second thoughts on a queued pipeline. Also, once a pipeline finishes execution, it can either be deleted or reloaded into the canvas. This latter option is particularly helpful when a pipeline fails to complete successfully, allowing the user to make adjustments without starting from scratch.
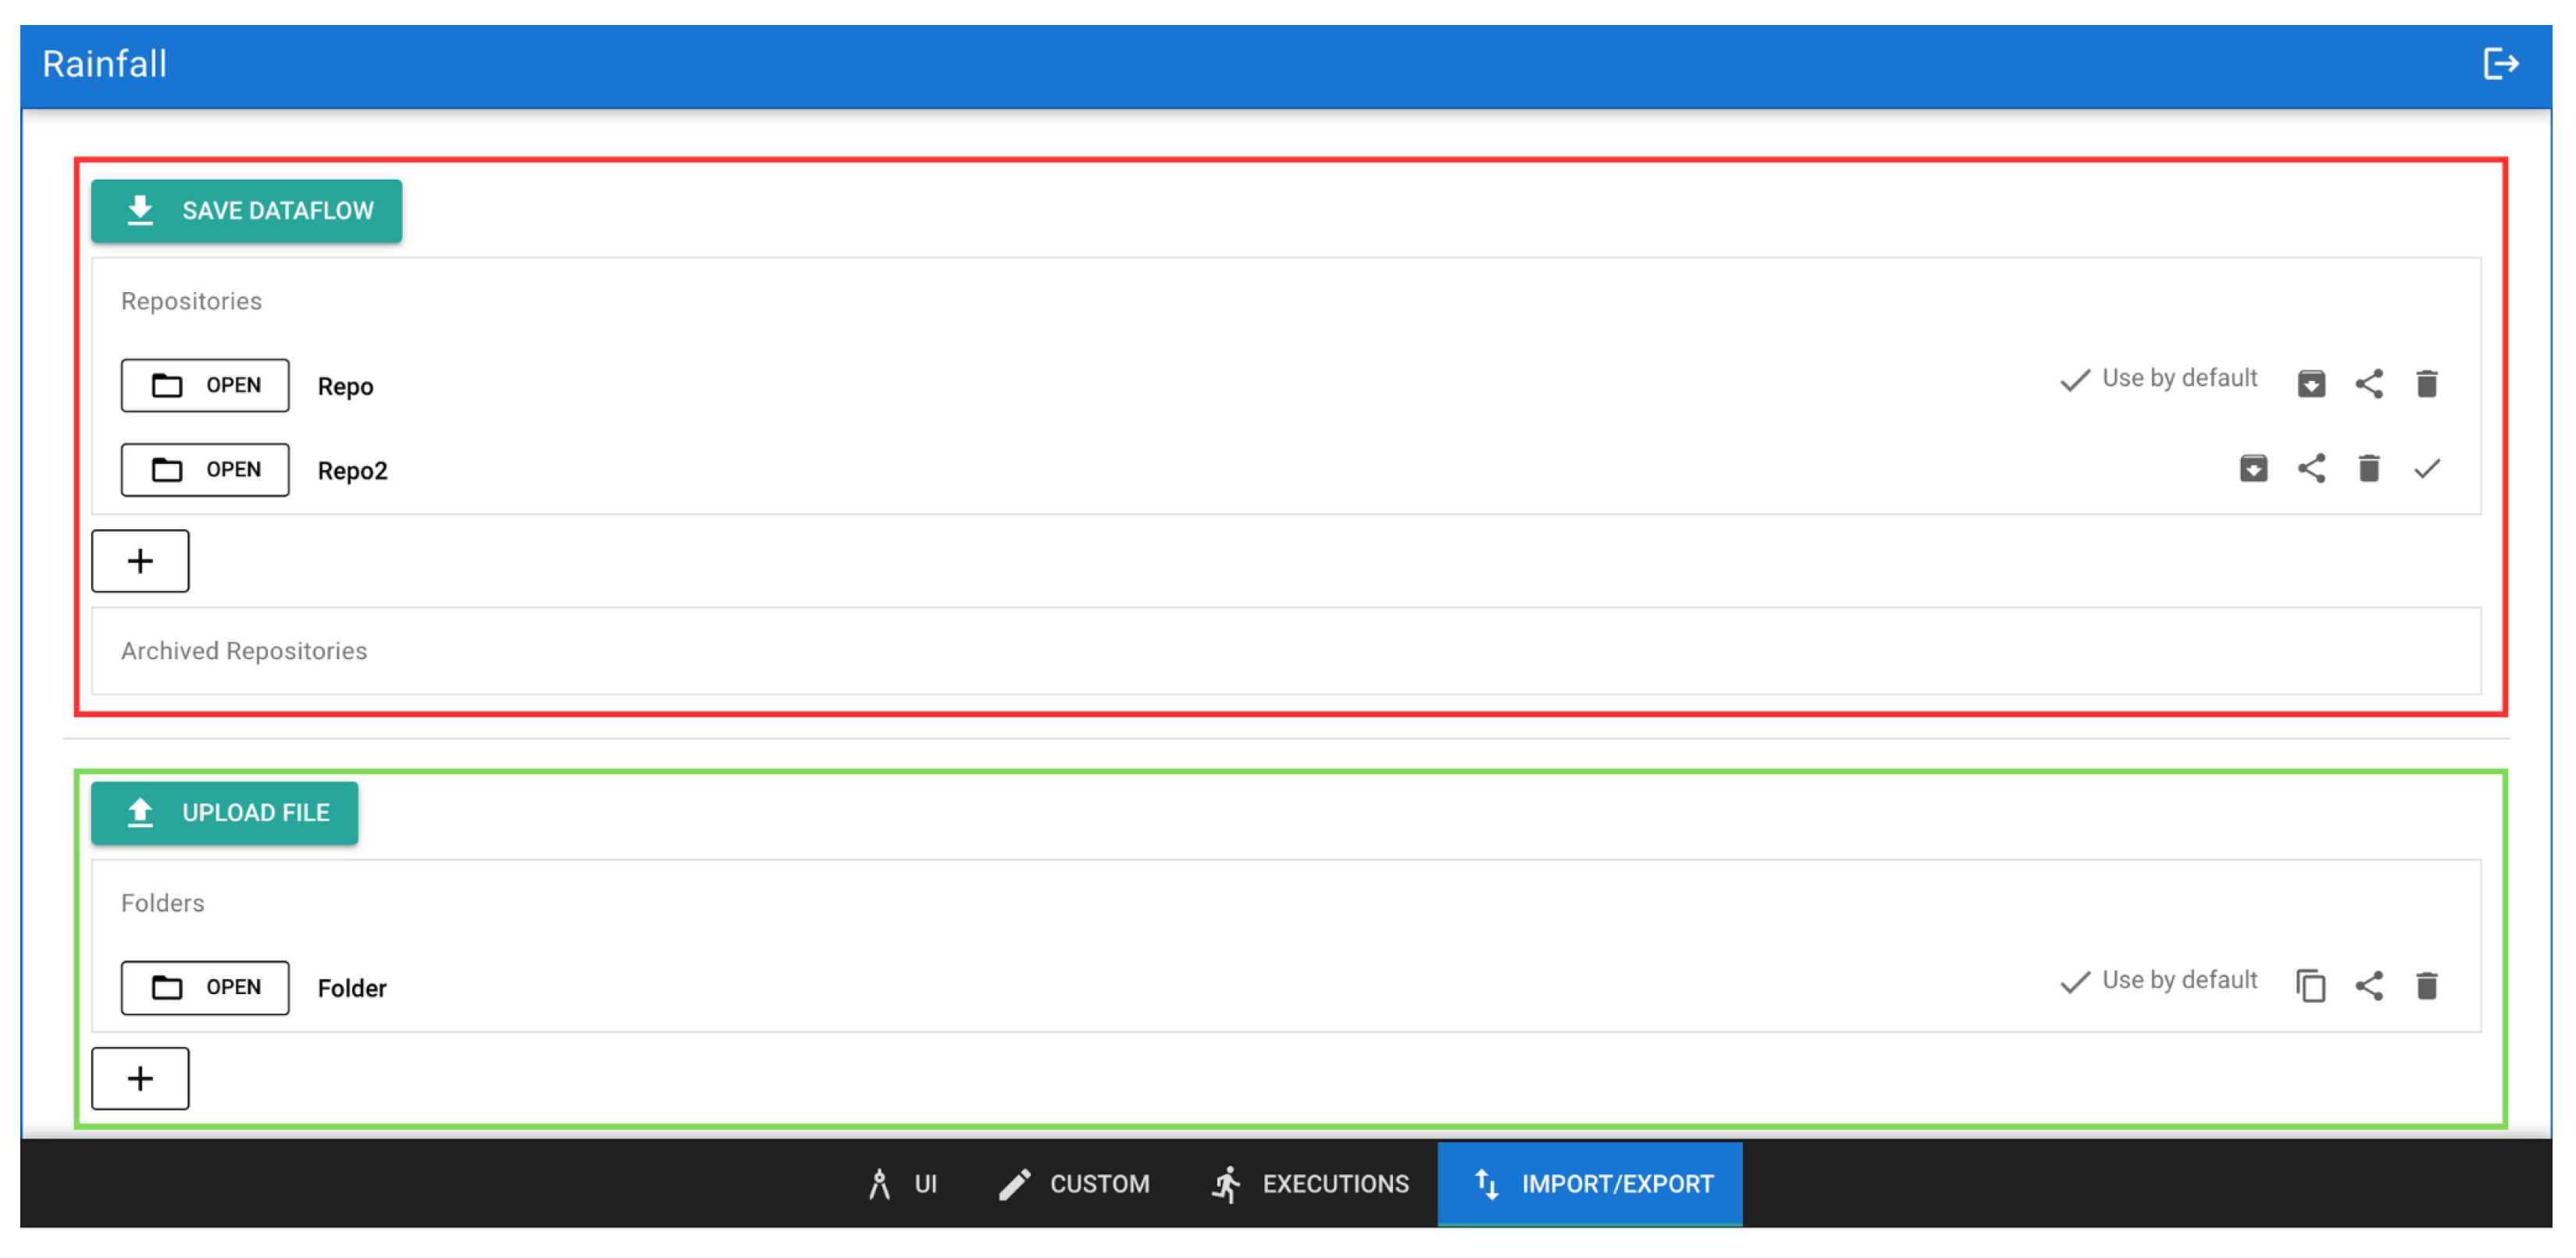
4.3.3. Management
Through the management panel shown in
Figure 7, users can easily access and organize their previously created pipelines by grouping them into repositories, shown in the red box in
Figure 7. Pipelines designed in the canvas can be saved to a repository, from which they can later be downloaded as either Python scripts or JSON files. Alternatively, they can be reloaded into the canvas for further editing or execution. Once a repository is selected, the pipelines contained within it are listed. By clicking on a pipeline, a summary panel appears, offering options to load, download, delete, or share the pipeline with other users. Finally, each repository can be archived to keep the workspace organized and prevent it from becoming cluttered with too many items, ensuring both accessibility and clarity. In addition to pipeline repositories, the management panel organizes files produced by pipelines or uploaded by users, shown in the green box in
Figure 7. These files can be used as input when launching a pipeline, but they can also be downloaded, shared with other users, and visualized to better understand the data. Currently, the web application supports visualization of Comma-Separated Values (CSV) files as tables, but future versions may support additional file formats and visualization types, offering a broader range of options for effective data inspection. Ultimately, the use of the management panel ensures a smooth, organized flow, allowing users to efficiently manage both their pipelines and data throughout the application.
5. Results
In this section, we demonstrate the effectiveness of the proposed solution thanks to the collaboration with the IKEA IT AKTIEBOLAG (INGKA) Group, i.e., a leading multinational home furnishing retailer controlling more than 370 stores worldwide. In particular, we aimed to employ data mining techniques to address real-world inventory management challenges. It is important to note that INGKA is only one of the many industries that contributed to this study, providing valuable insights and helping us refine our approach. The case study showcases Rainfall’s rapid prototyping of a complex pipeline that mixes machine learning and process mining elements following the dataflow programming paradigm. The case study is then complemented by a computational analysis executed on event logs of increasing size. Lastly, we discuss the results of a SWOT analysis jointly conducted with INGKA to demonstrate the impact of the framework.
5.1. Case Study
The case study demonstrates a pipeline designed to extract, cluster, and generate Business Process Model and Notation (BPMN [
26]) models for the most representative elements of each cluster, starting from an event log in eXtensible Event Stream (XES [
27]) format. The pipeline follows the same conceptual strategy we developed for INGKA to address their unique inventory management challenges. However, this case study aims to outline the key steps involved in the solution without disclosing the specific data. In particular, it emphasizes how the framework’s visual approach enables users to easily program complex pipelines, offering advantages over traditional programming methods. In addition to this, it demonstrates how the produced pipeline supports the phases outlined in the CRISP-DM process model, showcasing its alignment with established methodologies for data mining. The pipeline, illustrated in
Figure 8, includes both built-in nodes, marked with red squares, and custom nodes, indicated by blue squares. In the deployed version of the framework, a repository contains the pipeline, allowing it to be inspected and reproduced.
The operational flow of the pipeline is as follows: Node1, a built-in node from the PM4PY library, imports an XES file containing event data and converts it into a Pandas data frame, which is then transmitted to Node2. Node2, a custom node, divides the event log into its variants, unique sequences of activities, and filters them based on predefined criteria, such as exceeding a threshold of involved activities. For each relevant variant, it saves the corresponding trace set as a separate XES file and extracts features to build a data frame. It is worth noting that Node1 and Node2 support Data Understanding and Data Preparation phases, respectively. Node3, also a custom node, processes the data frame received from Node2 to compute a distance matrix using a selected metric (in this case, the Euclidean metric). Then, Node4, a built-in node implemented by the Scikit-learn library, executes k-medoids clustering on the computed distance matrix. Node5 and Node6, both built-in nodes, output the cluster assignments and the medoids i.e, the most representative elements of each cluster into CSV files for later inspection. These two nodes both support the Evaluation phase, as they enable to evaluate the results obtained from Node4. Finally, Node7, a custom node, retrieves the XES files corresponding to the medoids’ identifiers and passes them to Node8, which embeds a process discovery algorithm implemented by the PM4PY library, i.e., the inductive miner.
It is worth noting that Node3 and Node4 combined with Node7 and Node8 support the Modeling phase by employing both machine learning and process mining techniques. To explain in more detail, Node3 is responsible for computing a distance matrix, which is a table that quantifies the pairwise dissimilarities between data points, i.e., process variants, based on a chosen metric. Node4 performs a clustering algorithm, which is a machine learning technique that groups similar data points together based on their pairwise distances, revealing underlying patterns or structures in the data. Node7 acts as a bridge between machine learning and process mining techniques, passing the results produced by the clustering algorithm to Node8. Then, Node8 applies a process discovery algorithm to event logs to automatically generate BPMN models. These models describe the most significant process variants, providing a graphical representation of the underlying sequence and structure of the business process. As such, Node8 also contributes to the Deployment phase, as the resulting models can be used by business experts to derive actionable insights.
The case study highlights the framework’s effectiveness in addressing complex data mining tasks, as the framework offers a diverse pool of standard data mining algorithms that can be employed for a wide range of applications. Moreover, its capability to incorporate custom nodes on-the-fly further enhances its flexibility, making it well suited for rapidly prototyping new algorithms tailored to specific use cases. This feature is especially valuable in dynamic environments where business needs evolve rapidly, allowing users to seamlessly integrate custom solutions for addressing unique industry challenges.
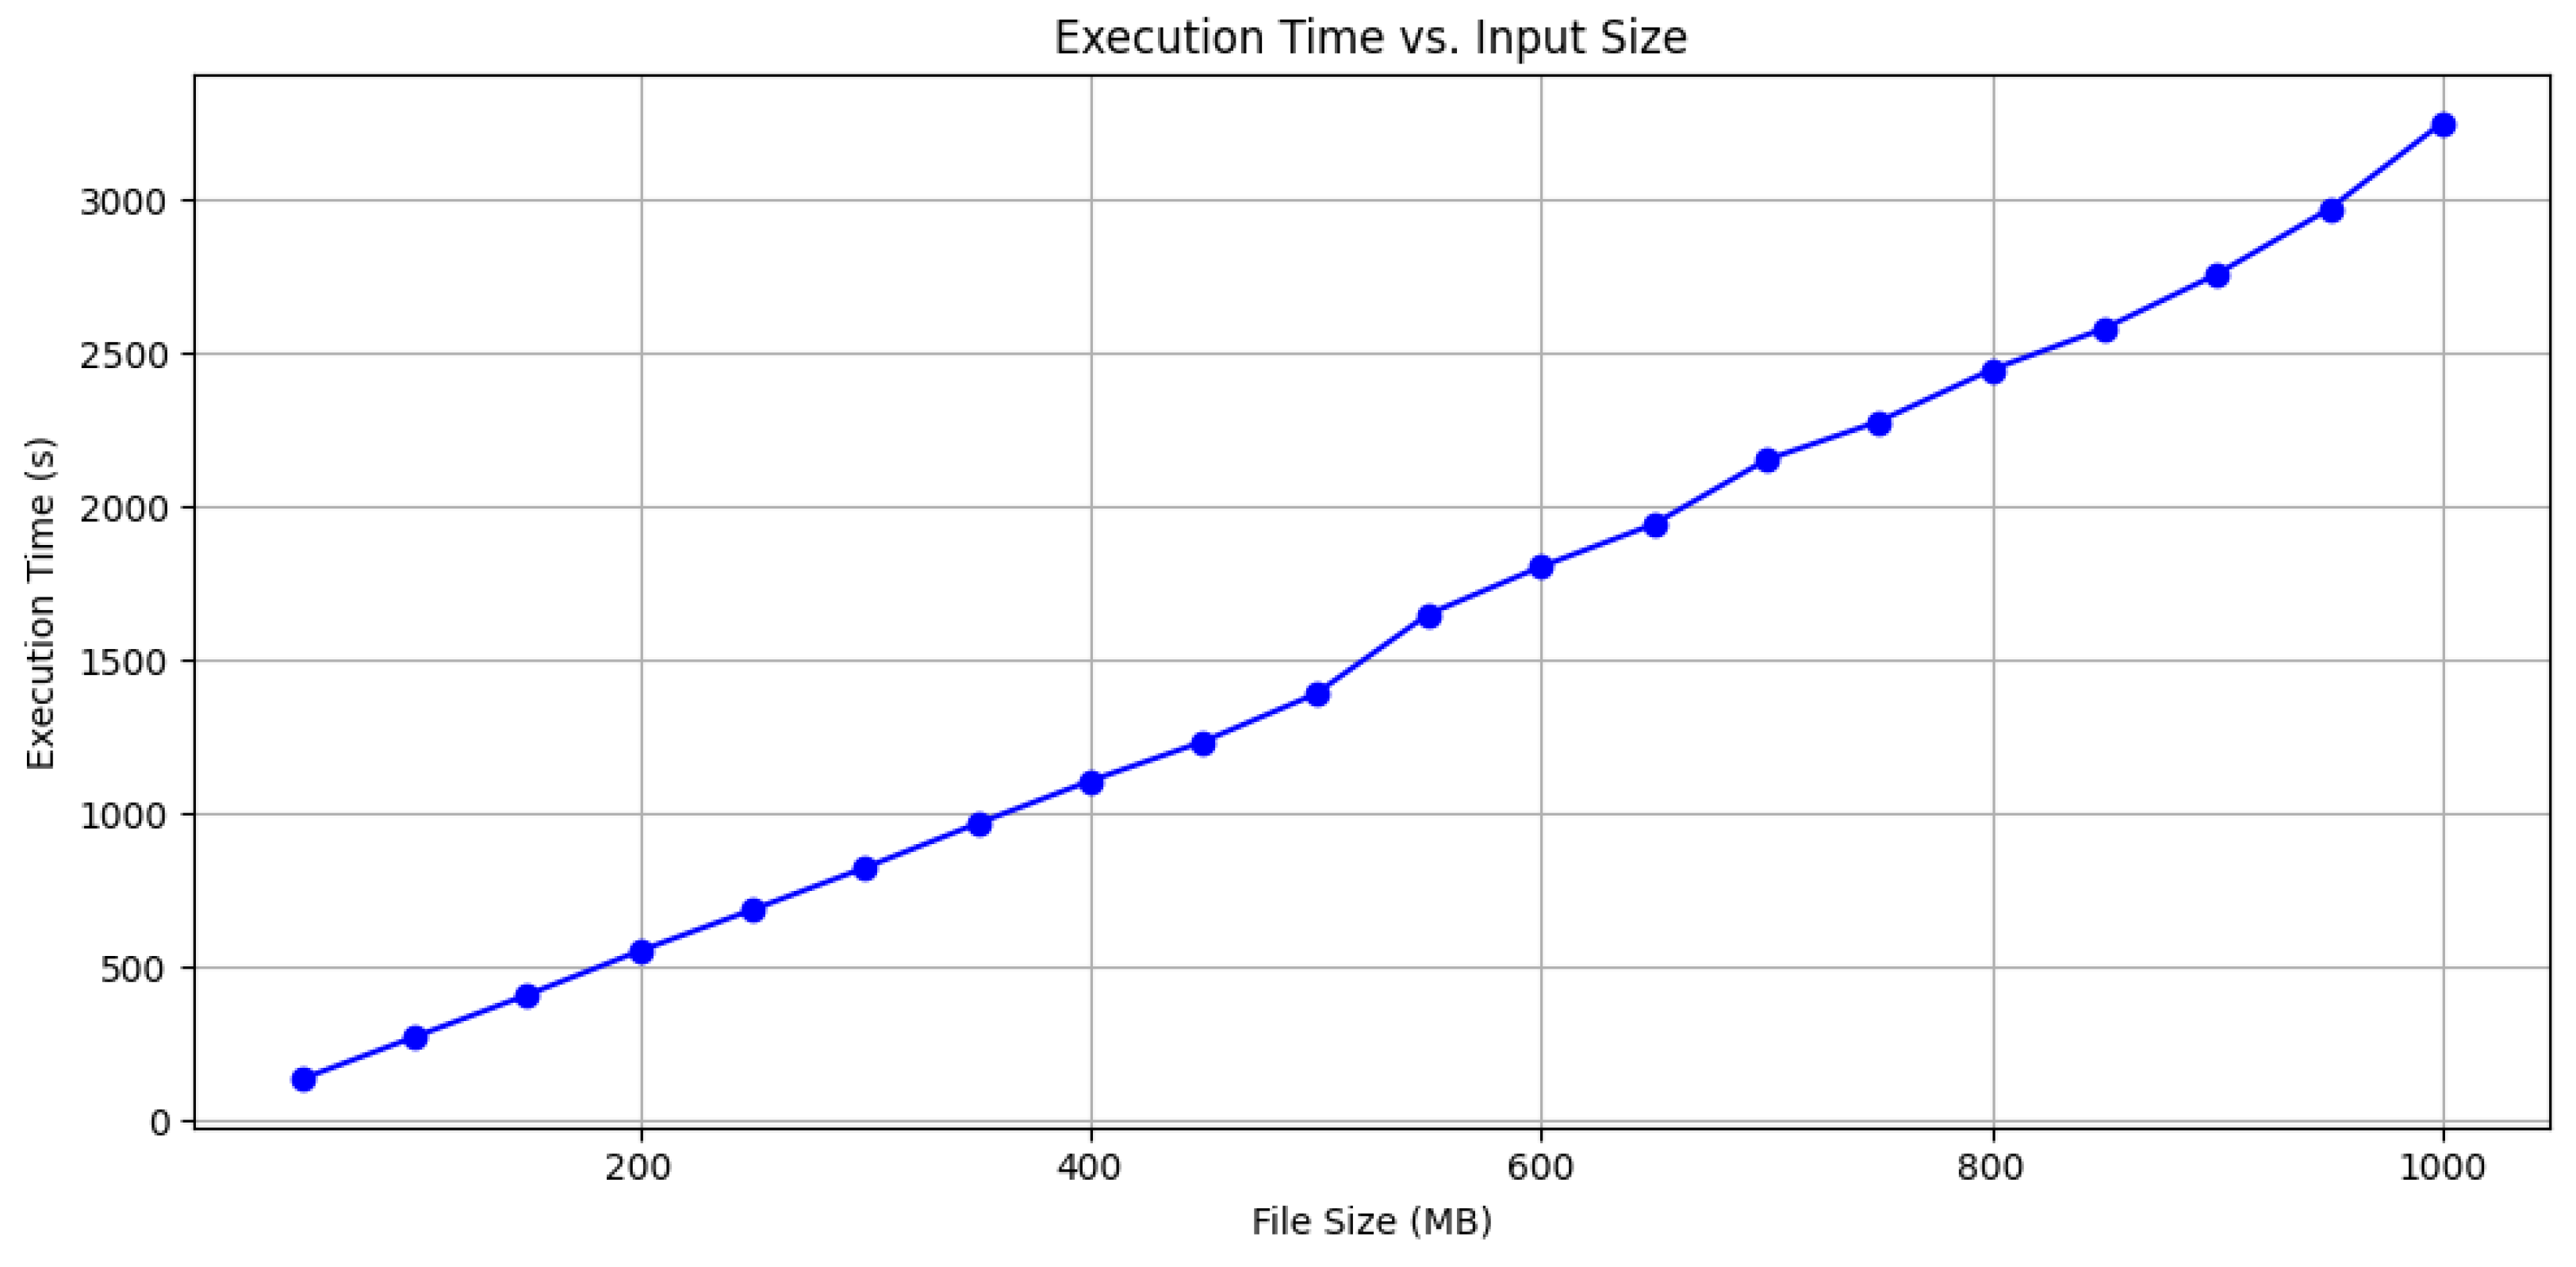
To evaluate the computational scalability of Rainfall, we conducted a performance analysis using the aforementioned pipeline and synthetic XES event logs of increasing size, ranging from approximately 50 MB to 1 GB. For each of these logs, we executed the pipeline presented in the case study and recorded execution times to assess how Rainfall handles increasing workloads. The analysis was conducted on a machine equipped with an Intel(R) Xeon(R) E-2226G CPU @ 3.40 GHz and 32 GB of RAM, and it can be reproduced by downloading the online material (available at
https://bitbucket.org/proslabteam/rainfall_unicam/src/BDCC/BDCC_evaluation, accessed on 10 May 2025). In
Figure 9, we present a chart that illustrates the trends in execution time as the size of the input log grows, showing a near-linear trend and reaching almost 3.250 s (54 min) for the largest log. While one might argue that even the largest file used in this analysis is modest compared to typical big data scenarios, our goal was not to benchmark Rainfall for large-scale data processing. Instead, the analysis aims to offer a practical indication of the tool’s computational scalability under controlled conditions, as Rainfall is designed for prototyping and experimenting with novel data analysis techniques on representative samples of full-scale datasets. This approach enables the validation of prototypes before their integration into production workflows. Even in the context of INGKA, the largest industrial partner involved in our evaluation, files up to 500 MB always proved sufficient for testing new data mining techniques within Rainfall. In this context, running prototypical pipelines on massive datasets during early testing stages would have been inefficient and potentially misleading. Lastly, it is worth noting that scalability heavily depends on the efficiency of the pipeline itself, which in turn relies on the performance of the underlying libraries and any custom code implemented by users through custom nodes. In this regard, the pipeline used for the computational study was specifically chosen to demonstrate how the framework handles an intricate scenario, combining both machine learning and process mining techniques, originally designed for large-scale application in collaboration with INGKA.
5.2. SWOT Analysis
A SWOT analysis [
28] is a strategic tool used to evaluate the internal strengths and weaknesses of an organization or system, as well as the external opportunities and threats it faces. Internally, it helps identify key resources, capabilities, and competitive advantages. Externally, it highlights potential market opportunities and threats by assessing competitors, industry trends, and broader environmental factors. By understanding both internal and external factors, a SWOT analysis aids in formulating strategies tailored to the organization’s context. Together with INGKA, we performed a SWOT analysis to assess the Rainfall framework, offering insights into its strategic positioning and development potential, which are discussed below.
Figure 9.
Case study pipeline execution times with regards to increasing log sizes.
Figure 9.
Case study pipeline execution times with regards to increasing log sizes.
Rainfall exhibits several strengths that make it a compelling option for data mining purposes. Its visual programming interface significantly reduces the amount of code required to design complex data processing pipelines, allowing data analysts to focus on logic rather than syntax. The framework supports transparent data processing by making intermediate results inspectable, a crucial feature for debugging and auditing. Its scalability was demonstrated in the computational study with event logs up to 1 GB, where execution times remained stable. The framework is also easily extendable, enabling technically skilled team members to implement novel data mining algorithms that can be directly integrated into the visual environment. The growing pool of available libraries and the ability to integrate new nodes have significantly expanded the framework’s general applicability across diverse scenarios. These custom components can then be used and tested by non-technical analysts to extract insights, fostering collaboration between developers and domain experts. Furthermore, Rainfall facilitates collaborative work through shared repositories and pipeline reuse, which simplifies versioning and accelerates experimentation cycles. Nonetheless, there are areas for improvement. The current set of nodes, while functional, could be expanded to include more advanced analytics and domain-specific operations. Improving the interface, for instance, by refining error messages or preventing invalid input parameters, could further reduce mistakes during pipeline creation, particularly for less experienced users. Regarding limitations, some users have reported system instability during prolonged sessions or while processing particularly large datasets. Issues such as unexpected crashes, loss of work-in-progress pipelines, or executions that terminated without a clear cause were mentioned in the feedback we received. Improving session recovery and error handling could significantly enhance user confidence during critical analyses. Additionally, while the pipeline semantics are designed to be intuitive, they currently do not support advanced constructs like conditional branching or iterative loops. This limits the ability to define dynamic execution paths, for example, skipping certain nodes based on intermediate results or repeating a computation until a condition is met. Such features are particularly relevant in data mining workflows; for instance, a node that tests data quality might trigger different preprocessing strategies depending on the outcome, or a clustering task might need to be repeated for multiple parameter combinations in a loop before selecting the best result. Enhancing Rainfall’s expressiveness in this regard would broaden its applicability to more complex analytical scenarios. Finally, Rainfall competes with mature commercial platforms like KNIME and RapidMiner that offer a richer set of functionalities. While Rainfall provides easier extendability and openness, particularly for research or enterprise prototyping, we are aware that it may not yet match the breadth of capabilities expected by power users accustomed to industrial tools.
6. Discussion
In this section, we discuss how Rainfall successfully meets all the requirements outlined in
Section 2. Then, we evaluate the framework’s usability through a user study with students and assess its applicability based on existing research studies. Finally, we conclude with a brief reflection on the value and role of industry–academia collaborations in addressing real-world challenges.
6.1. Requirements Assessment
The framework supports the phases identified by the CRISP-DM process model by implementing nodes in the Rain library. To satisfy both the
Understanding and
Integration requirements, Rainfall includes a set of I/O nodes that allow reading from and writing to multiple sources and sinks, such as local file systems, databases, and data warehouses. It can handle structured data (e.g., CSV files and SQL databases), semi-structured logs (e.g., XES), and unstructured data such as time series. To this end, the framework provides built-in nodes for accessing data from diverse platforms, including Google BigQuery, MongoDB, and Google Cloud Storage. It also enables the direct reading and writing of CSV and XES files from the local file system. These features collectively allow Rainfall to be effectively used in big data contexts, where data heterogeneity is the norm. Furthermore, Rainfall offers integrated data visualization capabilities within the web application, helping users to explore and understand the structure and characteristics of the datasets they are working with. This also proves helpful in visualizing the intermediate results of a pipeline, offering insights into the processing stages and helping to refine the mining as it progresses. For the
Preparation requirement, many functions from the
Pandas Python library were integrated into Rain, providing extensive data manipulation capabilities. These features include adding, removing, and renaming columns, dropping non-numeric values, and filtering datasets by selecting specific rows. These operations enable efficient data preprocessing, allowing users to clean and structure their data for mining, even without programming expertise. To satisfy the
Modeling requirement, Rain integrates a variety of data mining algorithms implemented by widely used libraries, including
Scikit-learn for machine learning,
PyTorch for deep learning, and
PM4PY for process mining. The exact versions of the libraries can be specified just before a pipeline’s execution, enabling users to leverage state-of-the-art techniques across various domains. Additionally, we designed and introduced several custom algorithms into the framework to specifically address company partners’ unique use cases, further enhancing the tool’s adaptability to real-world business needs. For the
Evaluation, some nodes were introduced to calculate performance metrics for the models generated, enabling users to assess their quality. For instance, users can calculate the Davies–Bouldin score [
29] to evaluate the performance of a clustering model or perform conformance checking [
30] to measure how well a discovered process model aligns with the event logs it was derived from.
Some specific decisions were made during the framework’s design phase to address the rest of the requirements. First of all, both the web application and the Rain library are made available as free and open-source software licensed under GNU General Public License v3.0, thus satisfying the Openness requirement. Rainfall satisfies the Transparency requirement by allowing users to define data mining pipelines through a visual dataflow programming approach and export them as executable Python scripts. This feature provides the flexibility to design, inspect, and run pipelines in different environments, such as custom setups or embedded devices. One major web application feature is the built-in custom node editor that allows users to integrate arbitrary Python code directly into the visual environment. This feature makes it possible to create new functional nodes on the fly, which can be immediately reused and tested within pipelines, without requiring additional setup. Although a basic level of programming knowledge is necessary to define custom nodes, the framework abstracts away all the complexity related to environment configuration, dependency management, and IDE setup by providing a fully functional development environment out of the box. While current support focuses on Python, the architecture allows for the potential addition of code wrappers to support other languages (e.g., Java), further expanding extendability. In addition to the on-the-fly integration of custom logic, developers with more advanced skills can also permanently extend the system by creating their own custom node libraries. Rainfall’s open-source nature, combined with comprehensive documentation and a modular design based on inheritance, streamlines the process of developing and maintaining custom extensions. This dual-level extendability fosters collaboration within mixed teams, where developers implement new functionality and analysts can immediately experiment with it through the visual interface. These features satisfy the requirement of the Extendability, enabling a growing pool of available nodes and facilitating the rapid prototyping of innovative data mining approaches. Lastly, to satisfy the Collaboration requirement, the framework includes features for saving, reusing, and sharing data and pipelines among users. These functionalities enable multiple team members to collaborate on the same pipeline, exchange insights, and build on each other’s work. This is particularly useful in cloud-based deployments, e.g., Google Cloud, where users are already accustomed to leveraging collaborative tools. By integrating seamlessly with such platforms, the framework promotes smooth teamwork and efficient results sharing, enhancing collaboration in data-driven projects.
6.2. Usability Assessment
One of the main advantages of rapid prototyping frameworks is their ease of use and low learning curve, which makes them accessible even to non-expert users [
17]. Therefore, to evaluate Rainfall’s usability, we conducted an analysis by administering a System Usability Scale (SUS) questionnaire [
31]. SUS is a widely used method that provides a single score reflecting the overall usability of a system, based on responses to 10 standardized items:
I think that I would like to use this system frequently.
I found the system unnecessarily complex.
I thought the system was easy to use.
I think that I would need the support of a technical person to be able to use this system.
I found the various functions in this system were well integrated.
I thought there was too much inconsistency in this system.
I would imagine that most people would learn to use this system very quickly.
I found the system very cumbersome to use.
I felt very confident using the system.
I needed to learn a lot of things before I could get going with this system.
Each item is rated on a 5-point scale, and the final score, ranging from 0 to 100, is computed by adjusting the individual scores of the 10 items and multiplying their sum by 2.5. The evaluation we performed on Rainfall involved a group of 76 students at the University of Camerino. As suggested by other studies [
32,
33], involving students in our experiments is considered rather effective, as they are not biased by prior practical experience that could influence the results. The participants were given a brief introduction to the tool and then allowed to explore and interact with it independently, after which they completed the SUS questionnaire to provide structured feedback on their user experience. This approach allowed us to gather quantitative insights into the perceived usability and ease of use of the tool. The average score obtained is 71.3 (with a standard deviation of 8.05), a minimum score of 50, and a maximum score of 90. A density plot of such scores can be appreciated in
Figure 10. Since the threshold score for a positive assessment is 68, the survey results indicate that Rainfall was perceived as a usable tool by participants. However, there remains room for improvement, especially considering that the framework is in its prototype stage.
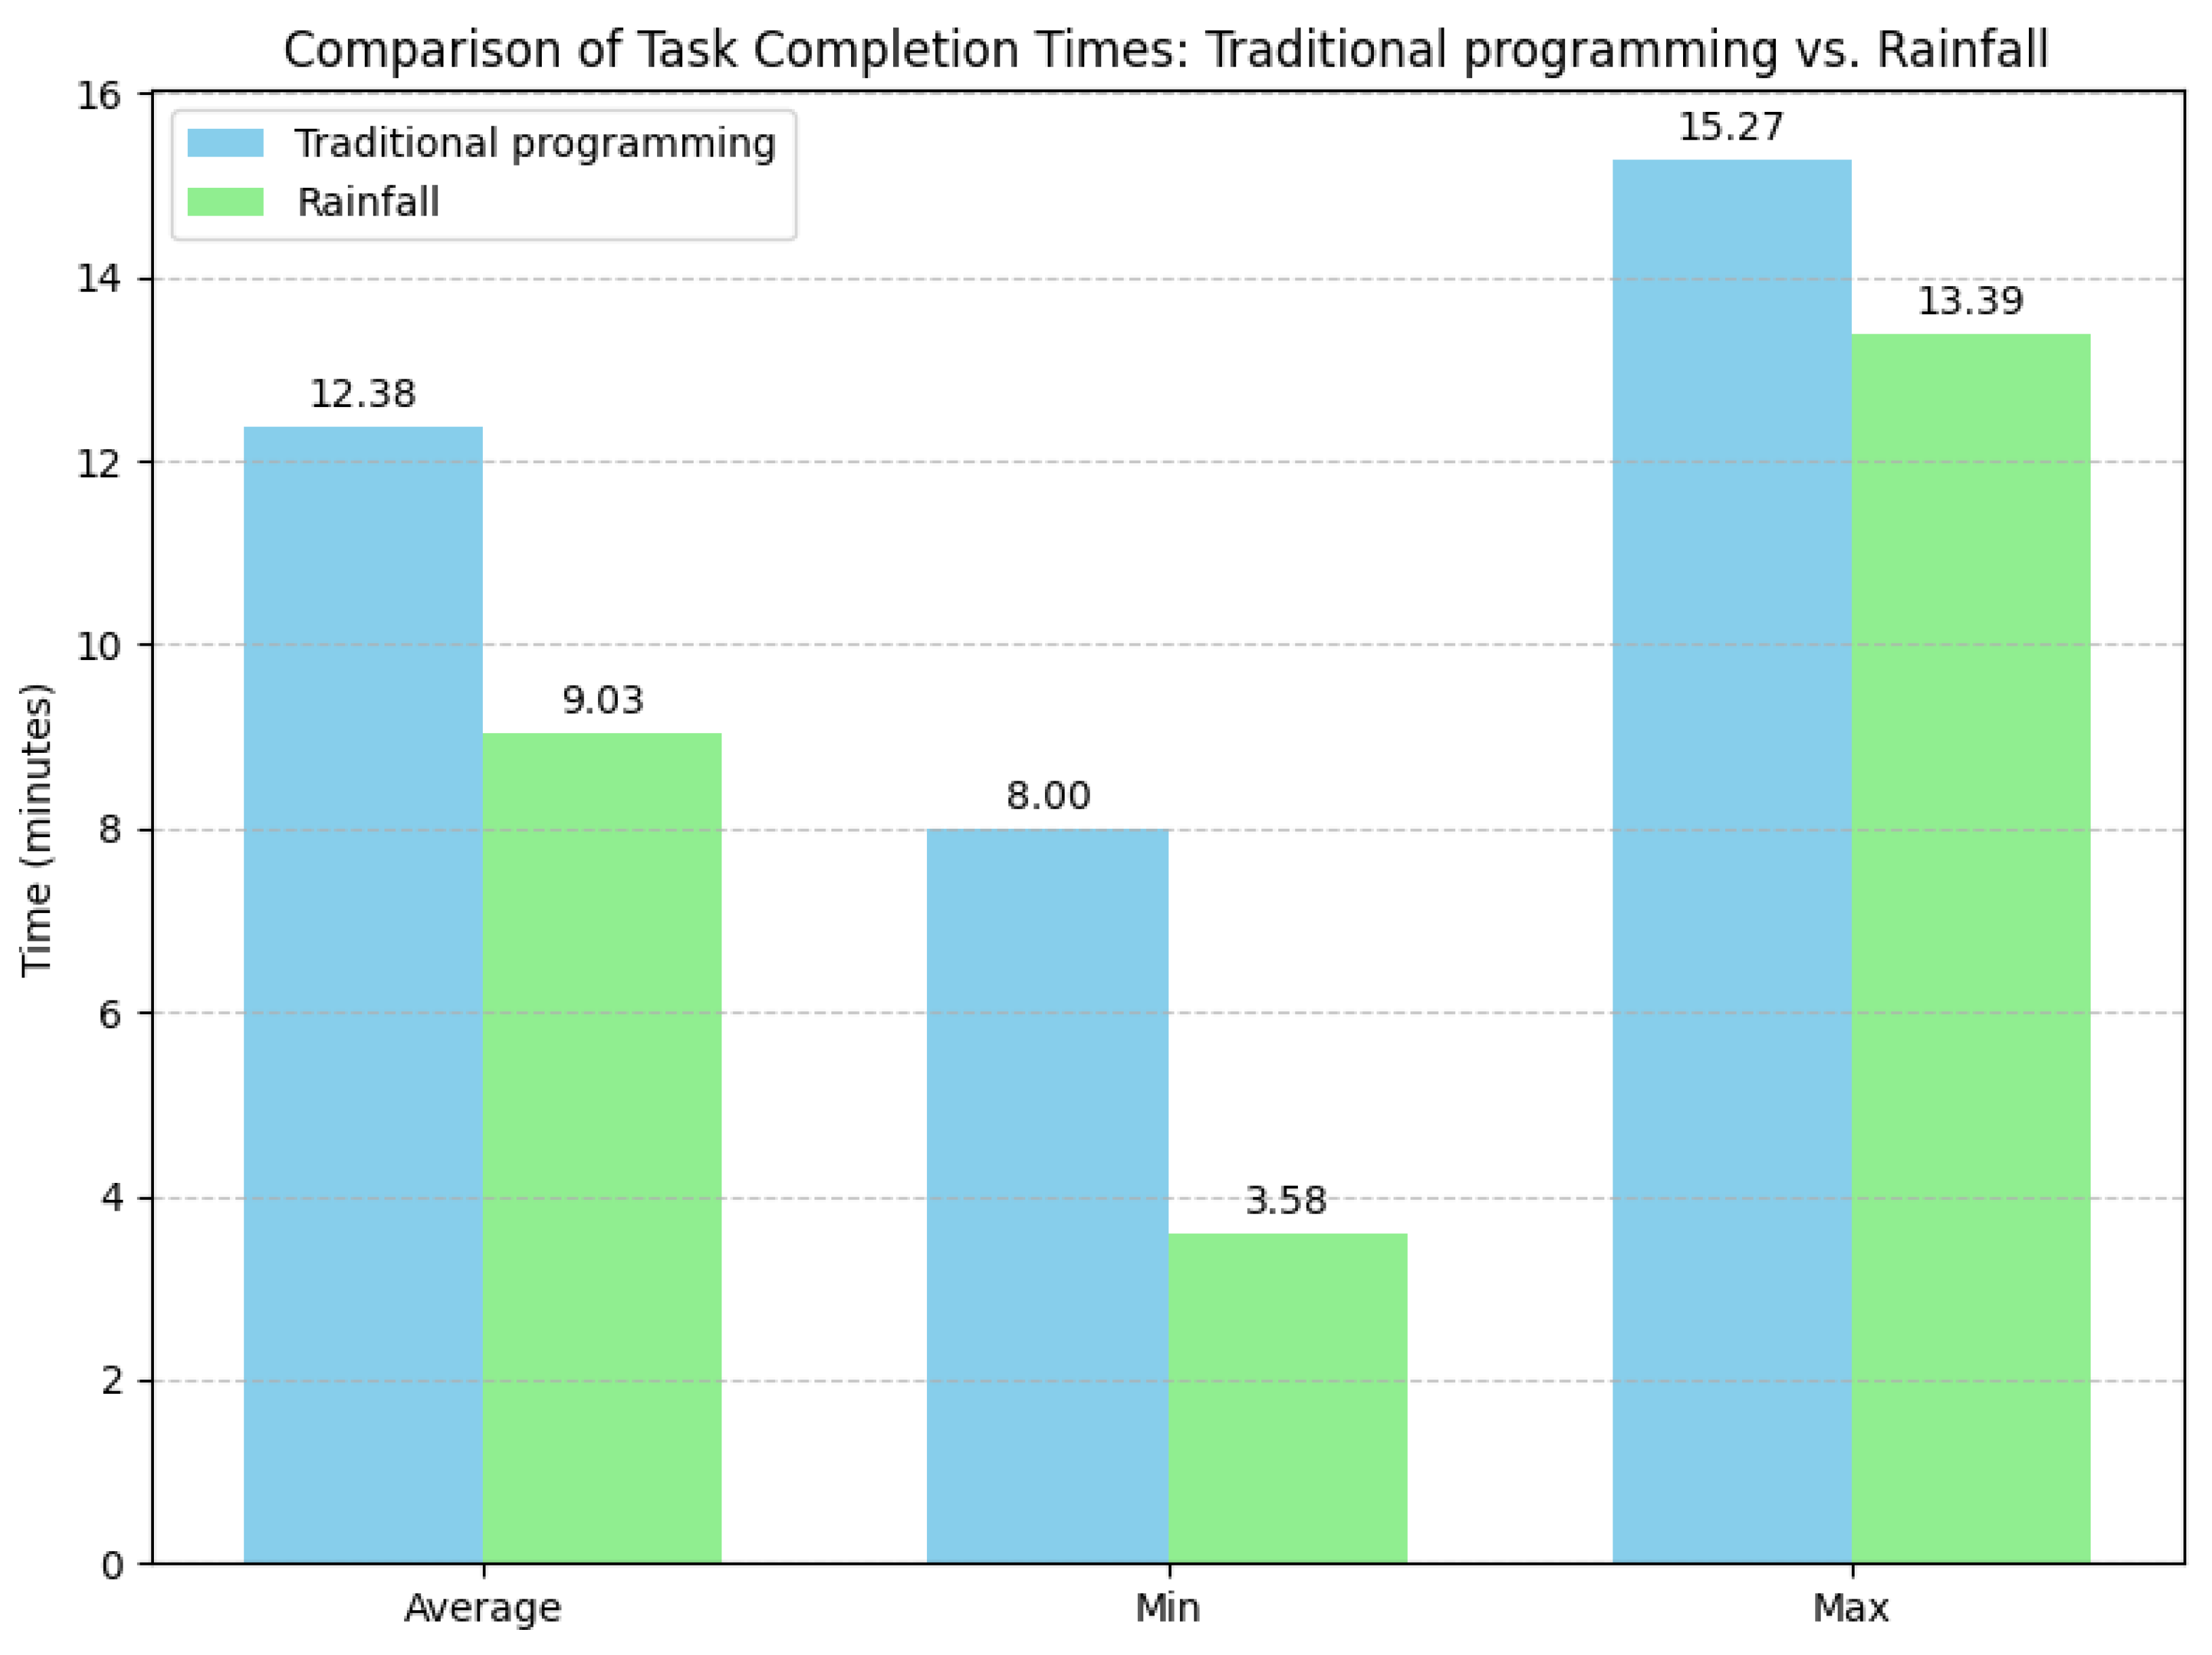
To further evaluate the effectiveness and usability of our tool, we also conducted an experiment focused on implementation time, involving a group of 12 students from the same academic program and with a comparable background. To reduce ordering bias, the group was split in half: six students completed the task first using traditional Python programming and then using the Rainfall framework, while the other six followed the reverse order. The task involved transforming a CSV file by removing all rows containing at least one null value, renaming all column headers to start with an uppercase letter, removing any column but the first one, and saving the result to a new CSV file. For each approach, we recorded the individual time taken by each participant to correctly implement the task. This allowed us to quantitatively compare the efficiency of the two approaches and assess whether each user improved or worsened when using Rainfall. The results, summarized in
Figure 11, show the average, minimum, and maximum completion times for both traditional programming and Rainfall. For traditional programming, the average time was 12.38 min (with a standard deviation of 0.11), a minimum time of 8.00 min, and a maximum of 15.27 min. For Rainfall, the average completion time was 9.03 min (with a standard deviation of 0.12), a minimum of 3.58 min, and a maximum of 13.39 min. Based on this analysis, we can say that participants complete the task 27.06% faster using Rainfall compared to traditional programming.
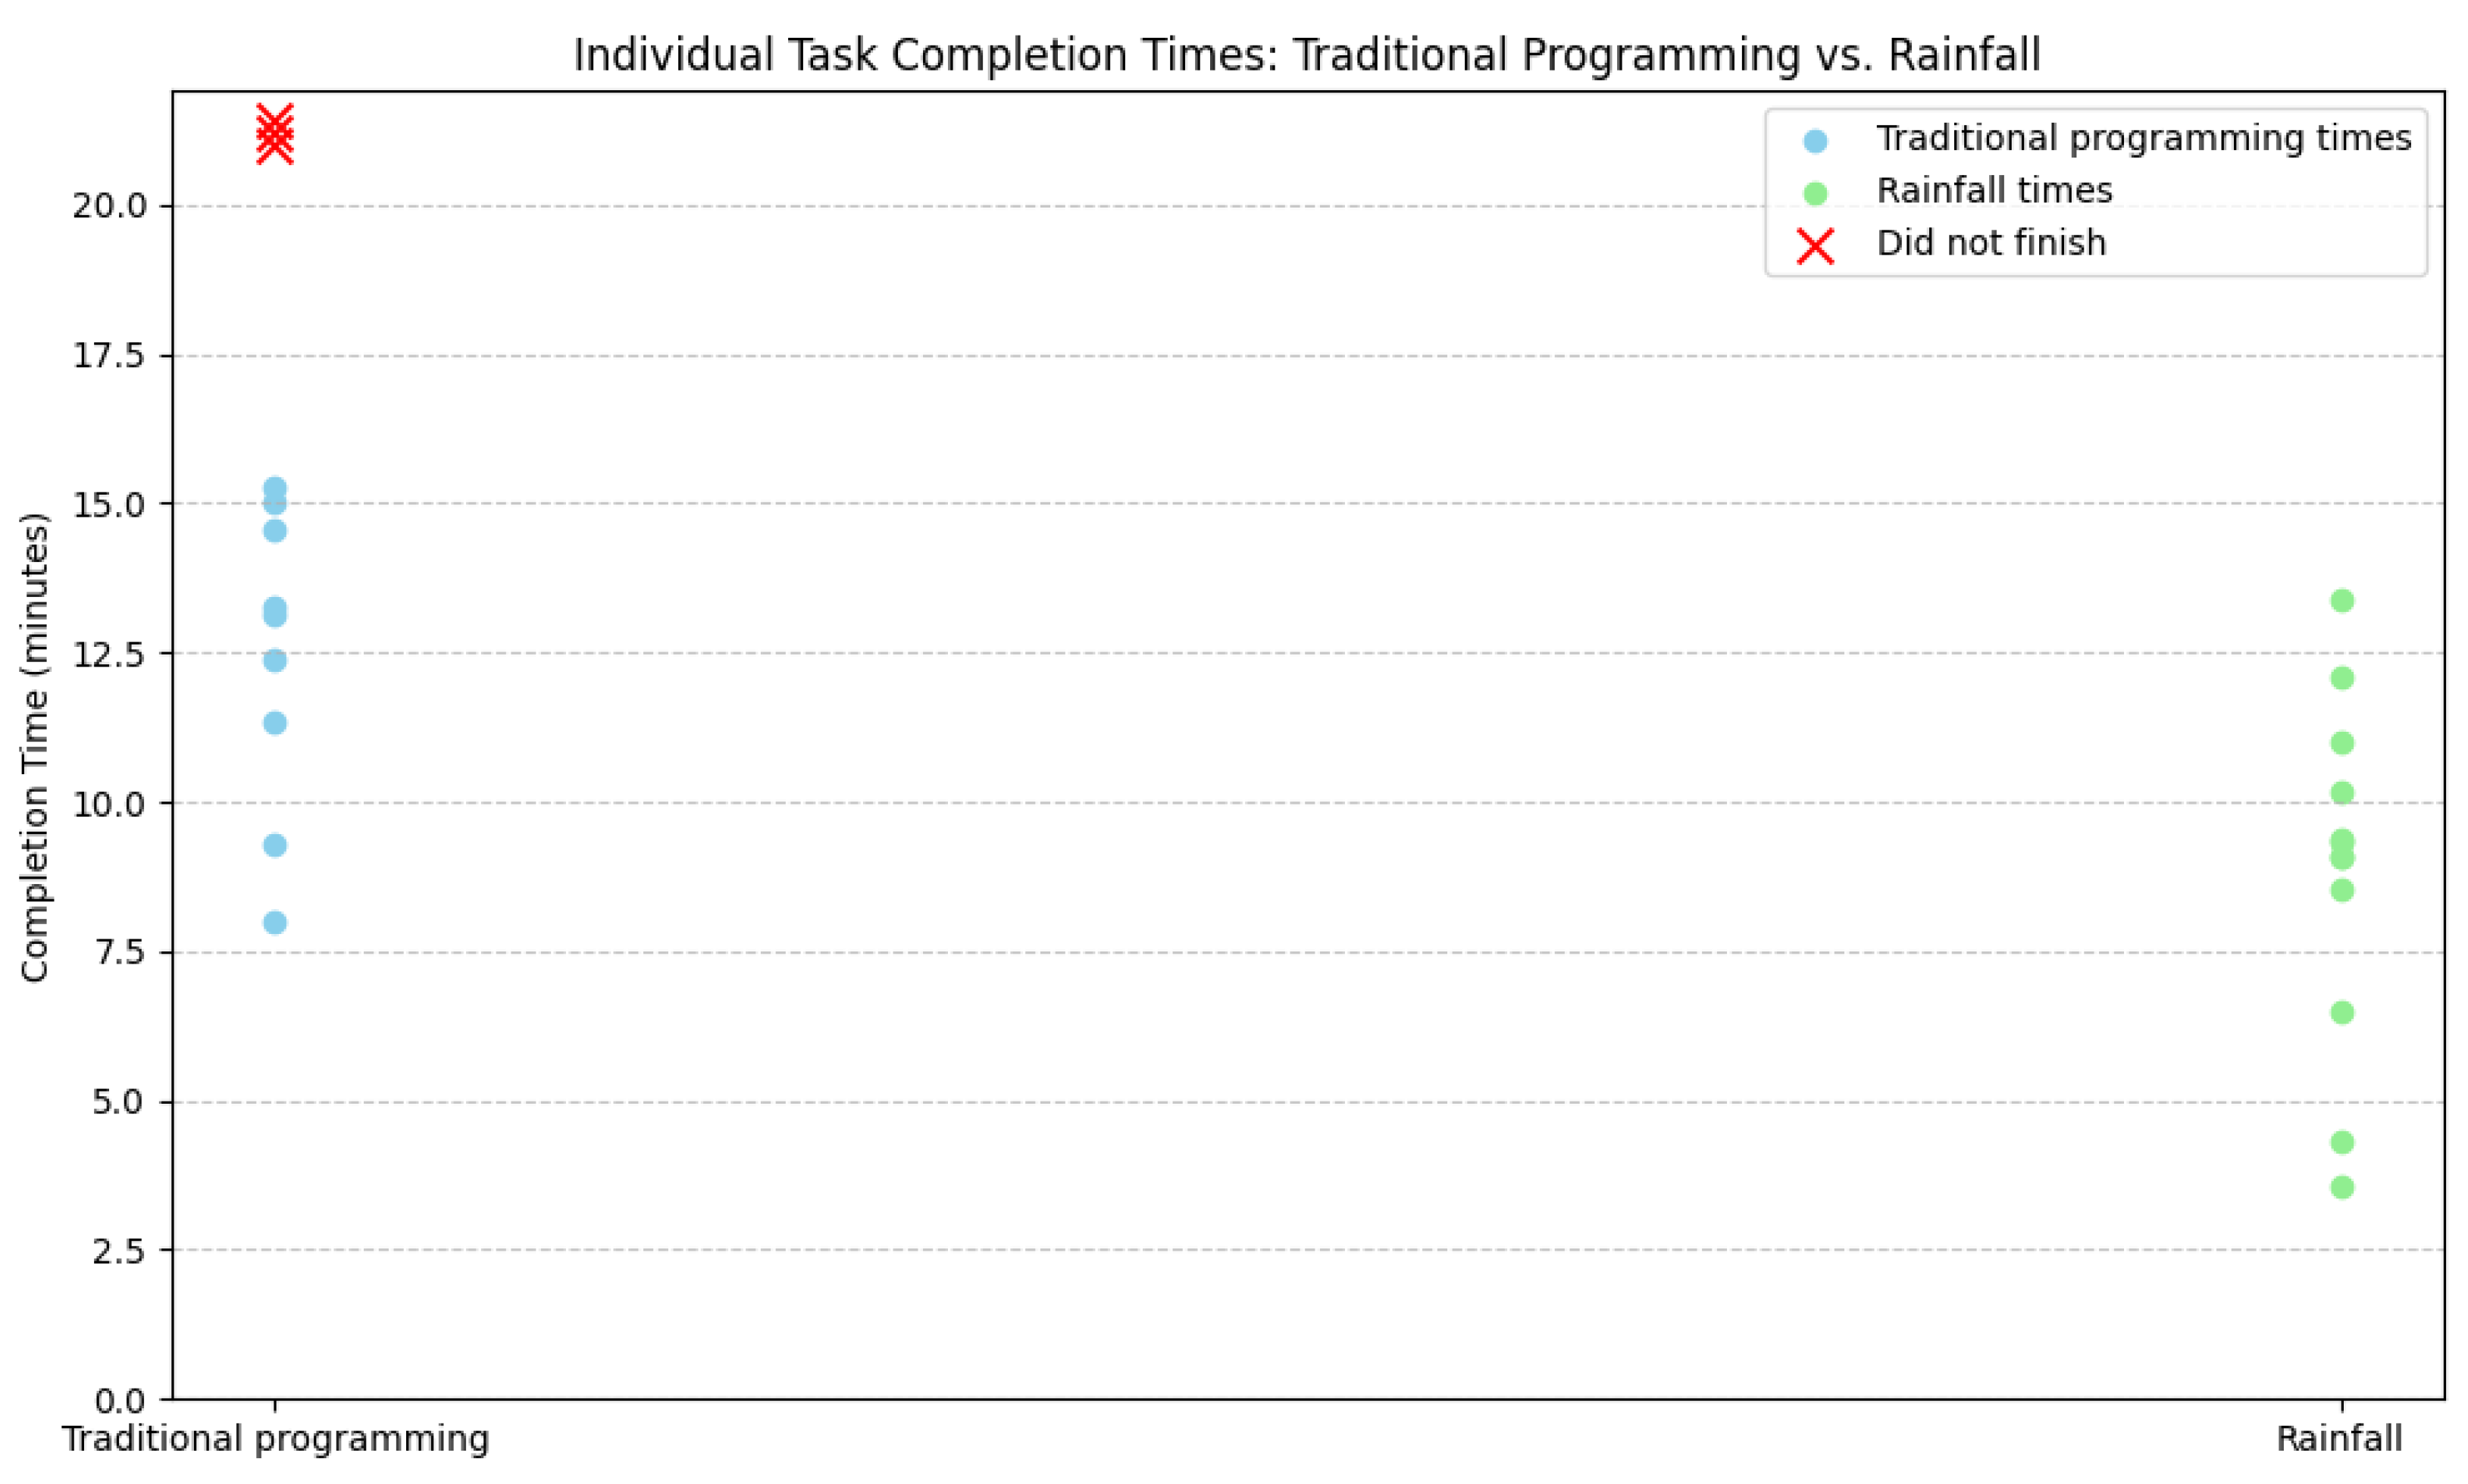
Additionally,
Figure 12 presents the individual completion times (each dot represents a single participant) for the data transformation task using both approaches. As shown, Rainfall generally enabled faster completion times, with most participants finishing under 13 min. Notably, three participants failed to complete the task using traditional programming (these cases are highlighted separately in the plot). In contrast, all 12 participants completed the task using Rainfall, with 2 participants completing it in under 5 min. The fastest participant using Python completed the task in 8 min, whereas the fastest using Rainfall completed it in just 3.58 min, more than twice as fast, reinforcing the system’s potential to streamline data processing activities.
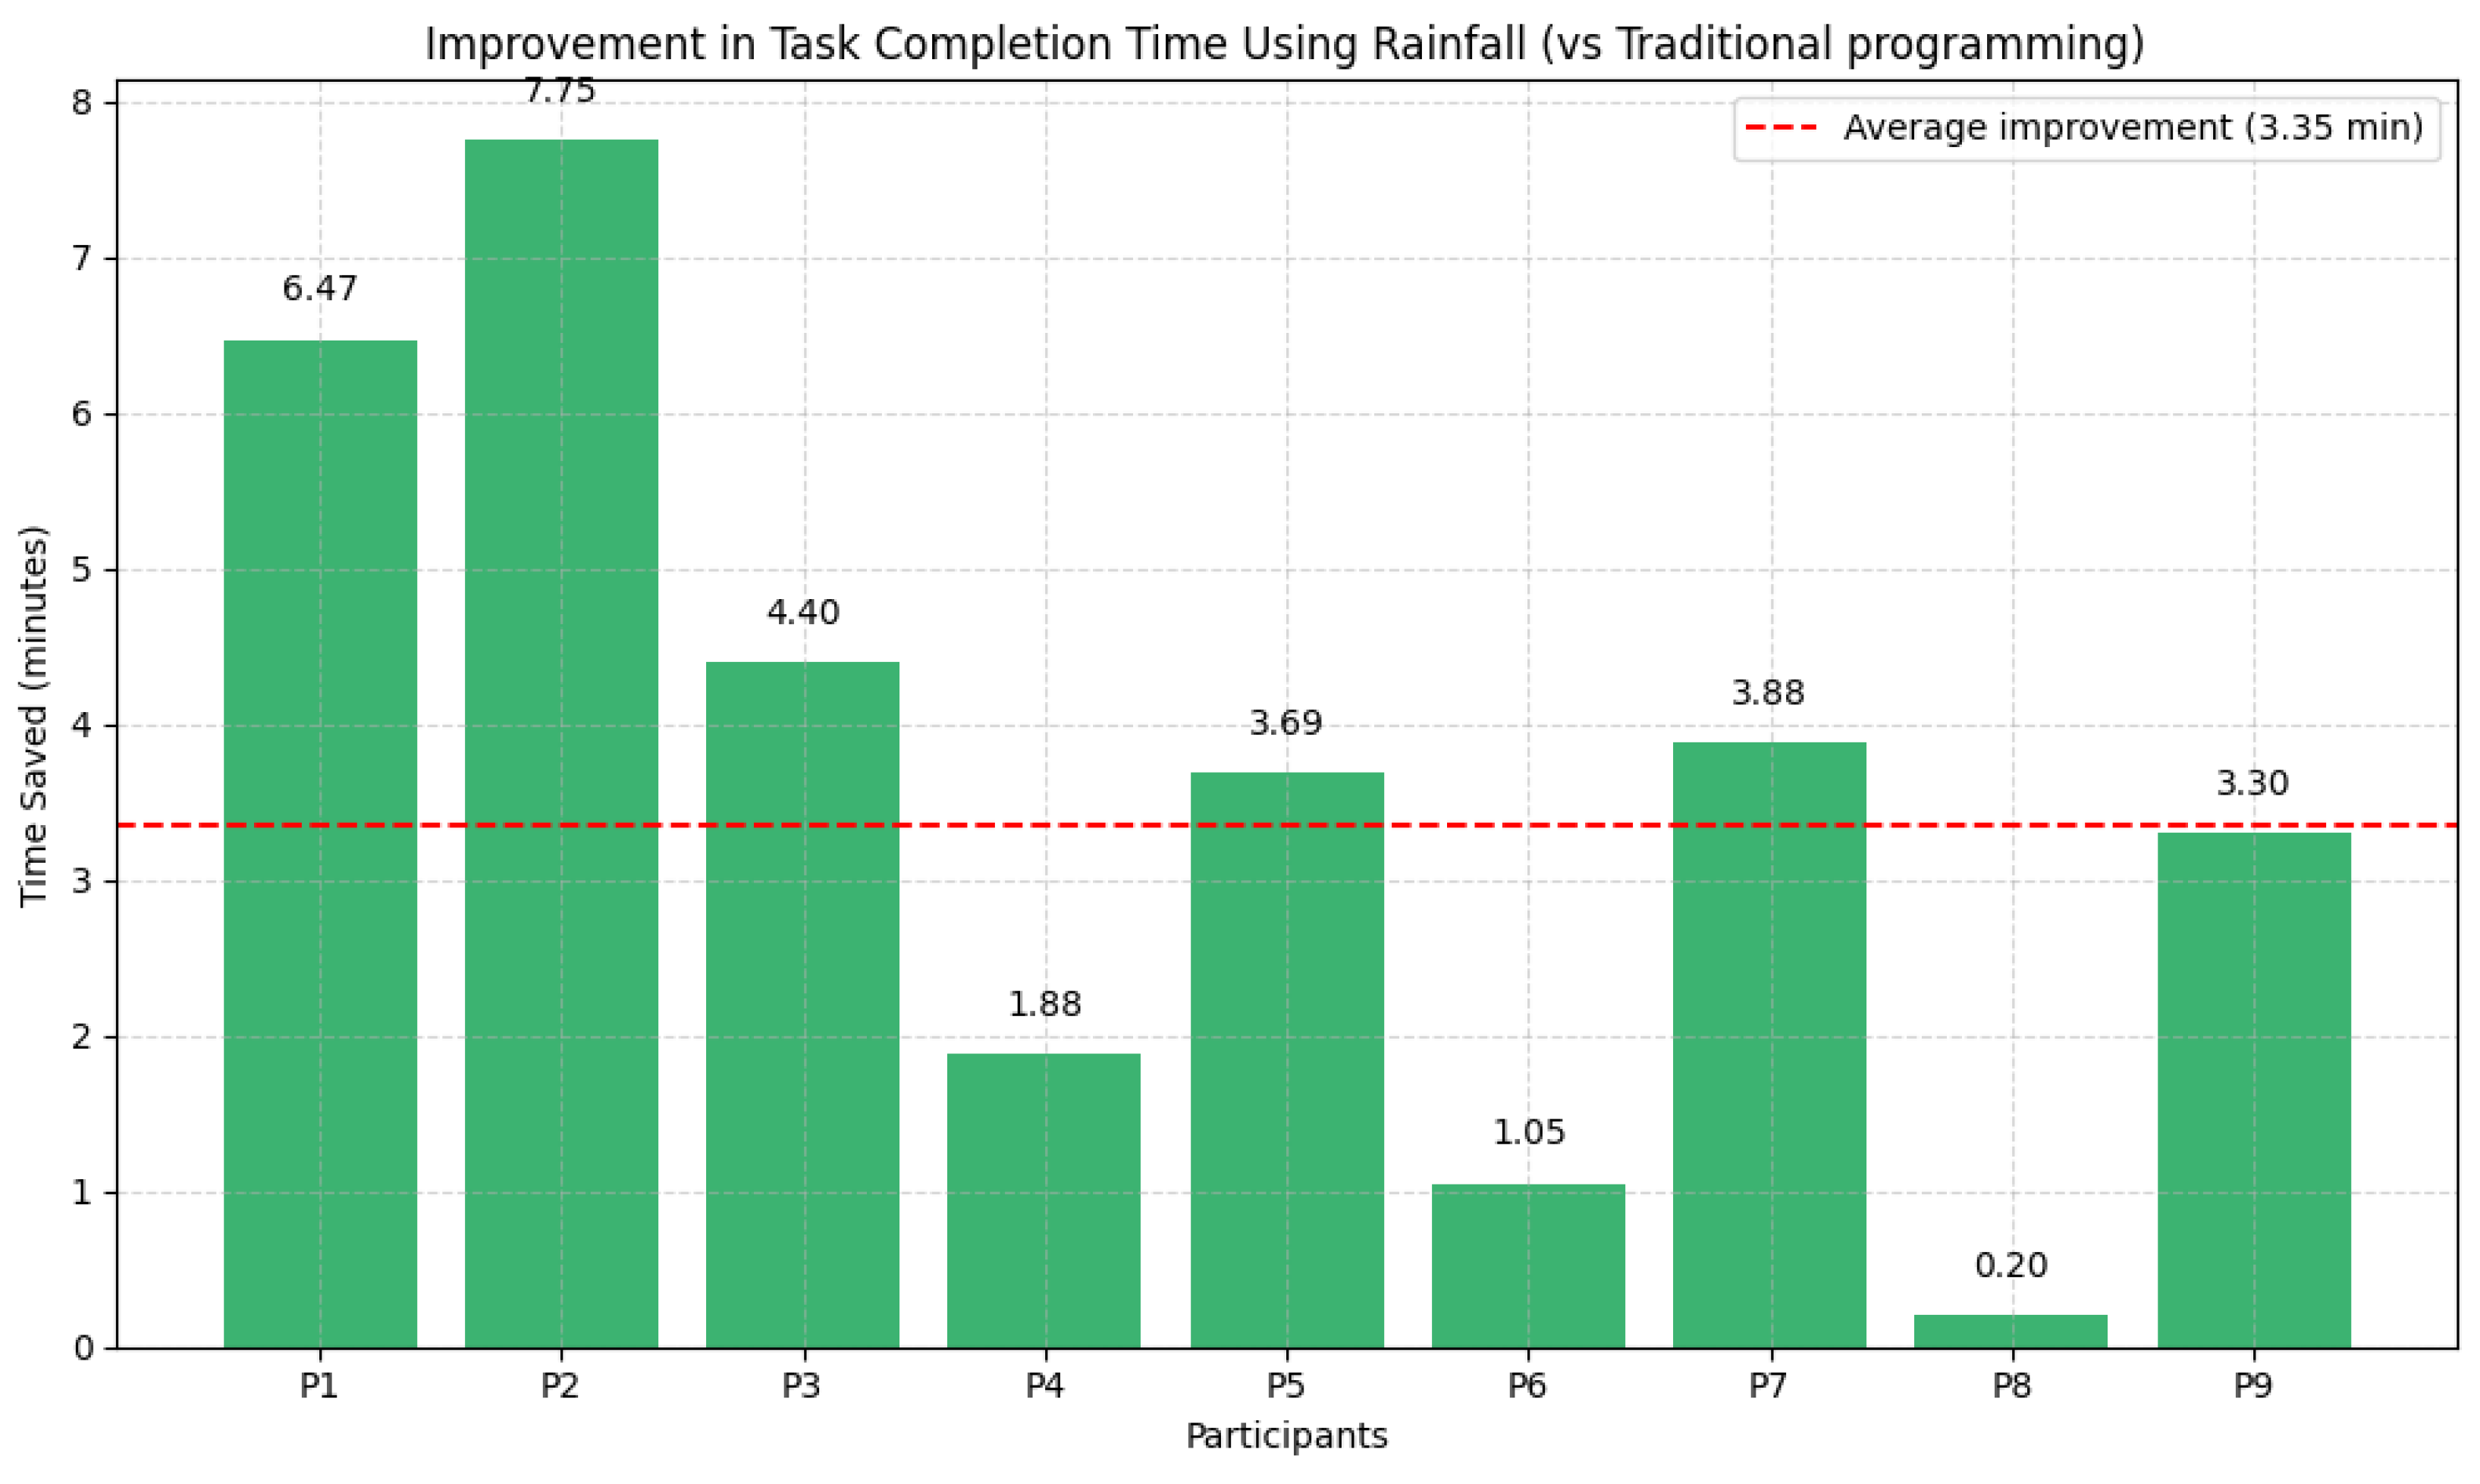
Finally, to gain further insight into the individual efficiency gains enabled by Rainfall, we analyzed the time difference between the Python and Rainfall implementations for each of the nine participants that completed both tasks, shown in
Figure 13. This approach allows us to measure how much faster each user completed the same task using the visual framework. On average, participants improved their completion time by 3.35 min (with a standard deviation of 0.13 min). The smallest improvement was 20 s, while the most significant gain reached 7.75 min, highlighting the substantial impact Rainfall can have on productivity, even for users already familiar with programming.
6.3. Applicability Assessment
The diverse applications of data mining across domains, such as manufacturing [
4,
5,
6], healthcare [
7,
8], digital marketing [
10], and sports analytics [
9], have highlighted recurring patterns in the types of techniques and transformations required. These studies, alongside the CRISP-DM methodology [
18], have informed the design of the Rain library, suggesting the need for a set of reusable nodes that support key areas such as machine learning, deep learning, and process mining. Moreover, they highlight the importance of flexible data manipulation capabilities, which is crucial across all application domains, and the need to support various data formats, including structured data (such as CSV files and SQL databases), semi-structured logs (like XES), and unstructured time series data. By integrating such features, Rainfall becomes suitable for both small research teams and enterprise-level, multi-user environments, enabling its adoption across diverse industry domains that handle big data and its inherent variety. As a matter of fact, the case study presented in this paper is just one example of the pipelines we developed for INGKA, alongside others tailored to address distinct business challenges. Notably, Rainfall was used to analyze event logs from inventory-related processes across more than 450 stores, generating a global average of 450,000 events per day. To support such a large-scale context, the framework was deployed within INGKA’s cloud infrastructure, enabling organization-wide access. This was made possible by Rainfall’s modular architecture, in which each component runs in an independent container. As a result, resource allocation is dynamically managed by container orchestrators, allowing for both horizontal scalability (via multiple workers) and vertical scalability (by adjusting computational resources per worker). Furthermore, the framework has been successfully adopted in several other real-world scenarios, including collaborations with Sigma S.p.A., Schnell S.p.a., Clabo SpA, Pieralisi Maip SpA, and Simonelli Group. Finally, all previously discussed works illustrate potential validation scenarios, highlighting the framework’s versatility across a wide range of industrial and research applications:
Condition monitoring in manufacturing, where Rainfall pipelines can be used to preprocess time series data from industrial sensors, detect anomalies, and predict machine failures, and RUL [
4];
Postures monitoring, where Rainfall’s architecture supports complex, multi-modal industrial condition-monitoring pipelines with high data throughput and distributed execution demands for real-time posture recognition and ergonomic risk assessment in a live manufacturing environment [
6];
LSTM models to predict user behavior in digital advertising [
10], where Rainfall’s support for
PyTorch models allows seamless integration of temporal deep learning components into a pipeline.
Anomaly detection in healthcare billing systems leveraging Rainfall’s capabilities to isolate suspicious patterns in billing data [
8];
Patient pathway analysis in healthcare, where process discovery algorithms can be prototyped using Rainfall’s XES support and visual modeling interface to enable fast experimentation on clinical event logs [
7];
Scheduling optimization in manufacturing, where innovative scheduling algorithms can be explored by chaining multiple nodes for simulation, optimization, and performance evaluation within a unified pipeline [
5];
Performance pattern discovery in sports analytics, where Rainfall’s ability to process and segment time series or event-driven data supports the analysis of quarter-specific trends in basketball games [
9].
Summing up, the framework was iteratively designed and developed in collaboration with several industry partners. Its successful adoption in their real-world scenarios demonstrates its broad applicability across diverse contexts, from small-scale to enterprise-level deployments. Among the tools discussed in
Section 3, none natively support all the functionalities required to replicate the pipeline presented in our case study, particularly the process discovery nodes for process mining tasks. While RapidMiner and KNIME offer extensibility through user-developed plugins that provide the needed features, these processes often demand deeper integration efforts and advanced programming skills, which can slow down experimentation. In contrast, Rainfall was designed to enable on-the-fly integration of business-specific nodes, making it more suitable for rapid prototyping in real-world settings.
6.4. Industry–Academia Collaborations
In the following, we conclude with a brief discussion on the value of industry–academia collaborations, showcasing their role in fostering innovation and addressing real-world challenges. Designing and developing Rainfall allowed us to create a tool specifically tailored to unique industrial needs while leveraging insights from the existing literature on data mining and rapid prototyping. This collaborative and iterative process involved close cooperation with industries, enabling joint decision-making on critical aspects. Additionally, the active participation of industries was invaluable in validating the findings from the literature, deepening our understanding of the requirements for a framework of this nature. However, when multiple parties are involved in a project, the careful management of several factors becomes essential, including defining common goals, addressing unexpected challenges, and collaborating with individuals from diverse backgrounds. Establishing structured and effective team communication was a cornerstone in achieving the desired results. This approach facilitated faster feedback cycles, clearer goal definitions, and the development of a framework that effectively met industrial needs. Moreover, continuous communication and interaction fostered a sense of harmony and trust between the teams, further enhancing collaboration and contributing significantly to the project’s overall success.
7. Conclusions
In this paper, we presented Rainfall, a novel framework for rapidly prototyping data mining pipelines. It was designed and developed through collaborative data mining projects with various industries. This ensures that the framework addresses real-world industrial needs effectively. The framework’s key aspects are requirements from the literature on rapid prototyping and data mining processes. They guided the study as well as the suggestions coming from industries. Following this, we provide a comprehensive overview of Rainfall, focusing on its architecture and key features, i.e., the programming, execution, monitoring, and management of data mining pipelines. To assess its effectiveness, we evaluated how the framework meets the defined requirements through a structured assessment, demonstrated its practical application with a case study, and conducted a SWOT analysis to uncover its strengths, weaknesses, opportunities, and threats. Additionally, we compared Rainfall with existing tools, emphasizing its unique capabilities and advantages over other frameworks.
Future improvements will be made from a technical perspective, focusing on implementation aspects to address the limitations identified in the SWOT analysis, with particular emphasis on enhancing the web application’s capabilities. One of the main priorities will be the implementation of more advanced data visualization tools to offer users a more integrated and comprehensive experience. We also plan to improve the user interface to reduce configuration errors during pipeline design and prevent related execution issues. Finally, we intend to expand the node library to support a wider range of data mining techniques, thereby improving the framework’s versatility and practical adoption.


