Article

Improving Early Detection of Dementia: Extra Trees-Based Classification Model Using Inter-Relation-Based Features and K-Means Synthetic Minority Oversampling Technique

by
Yanawut Chaiyo
1,
Worasak Rueangsirarak
1,
Georgi Hristov
2 and
Punnarumol Temdee
1,*
1
Computer and Communication Engineering for Capacity Building Research Center, School of Applied Digital Technology, Mae Fah Luang University, Chiang Rai 57100, Thailand
2
Telecommunications Department, University of Ruse, 7017 Ruse, Bulgaria
*
Author to whom correspondence should be addressed.
Big Data Cogn. Comput. 2025, 9(6), 148; https://doi.org/10.3390/bdcc9060148
Submission received: 25 March 2025 / Revised: 10 May 2025 / Accepted: 22 May 2025 / Published: 30 May 2025

Abstract

The early detection of dementia, a condition affecting both individuals and society, is essential for its effective management. However, reliance on advanced laboratory tests and specialized expertise limits accessibility, hindering timely diagnosis. To address this challenge, this study proposes a novel approach in which readily available biochemical and physiological features from electronic health records are employed to develop a machine learning-based binary classification model, improving accessibility and early detection. A dataset of 14,763 records from Phachanukroh Hospital, Chiang Rai, Thailand, was used for model construction. The use of a hybrid data enrichment framework involving feature augmentation and data balancing was proposed in order to increase the dimensionality of the data. Medical domain knowledge was used to generate inter-relation-based features (IRFs), which improve data diversity and promote explainability by making the features more informative. For data balancing, the K-Means Synthetic Minority Oversampling Technique (K-Means SMOTE) was applied to generate synthetic samples in under-represented regions of the feature space, addressing class imbalance. Extra Trees (ET) was used for model construction due to its noise resilience and ability to manage multicollinearity. The performance of the proposed method was compared with that of Support Vector Machine, K-Nearest Neighbors, Artificial Neural Networks, Random Forest, and Gradient Boosting. The results reveal that the ET model significantly outperformed other models on the combined dataset with four IRFs and K-Means SMOTE across key metrics, including accuracy (96.47%), precision (94.79%), recall (97.86%), F1 score (96.30%), and area under the receiver operating characteristic curve (99.51%).

1. Introduction

Dementia has become a critical global issue, exacerbated by the aging population, leaving patients increasingly dependent and facing death [1]. At present, 55 million people live with dementia, a number projected to rise to 152.8 million by 2050 [2,3]. The economic burden of dementia care exceeded USD 1 trillion in 2018 and is set to double by 2030, potentially surpassing USD 2 trillion as the global population ages and dementia cases rise [4,5]. In Thailand, the aging population is driving a steady increase in the number of dementia patients, with numbers expected to grow by 10% annually [6,7]. Dementia significantly impairs daily activities, causing memory loss, confusion, and communication challenges, and often leads to complete dependency. Age is the primary risk factor, with most cases occurring in those over 65, while lifestyle choices, cardiovascular health, and education also play contributing roles. Beyond its impact on individuals, dementia has profound societal and economic consequences, with no cure and a slow progression. The increasing demand for care will strain healthcare systems, elevate costs, and drive changes in societal structures, highlighting the urgent need for policies addressing elderly care and dementia management.
The diagnosis of dementia involves a comprehensive assessment of symptoms and brain function. The detection of cognitive decline allows for proactive preparation and potential behavior modifications to mitigate the onset of dementia, as well as the ability to identify suitable treatment options. Normally, the diagnosis of dementia depends on physical examinations such as brain function tests and radiology, which require an advanced laboratory [2,3]. Traditionally, a detailed medical history, family history, and neurological examination are used to assess cognitive functions such as memory, thinking, and language. Standardized tests such as the Mini-Mental State Examination (MMSE) or Montreal Cognitive Assessment (MoCA) are generally used to measure cognitive abilities. Computed Tomography (CT) scans and Magnetic Resonance Imaging (MRI) are well-known methods for providing visual images of the brain to identify abnormalities such as brain atrophy or tumors. In addition, Positron Emission Tomography (PET) scans offer a more detailed view of brain function by tracking blood flow and metabolism. Blood tests and biochemical analyses help to rule out other potential causes of dementia symptoms, including hormonal imbalances and infections. Generally, diagnosing dementia is costly. It is necessary to have an advanced laboratory and medical professionals to ensure diagnostic accuracy, which is difficult to access for the public, especially in rural areas.
While traditional methods rely heavily on clinical evaluations and medical imaging, recent advancements in machine learning (ML) have introduced new possibilities for the more accurate and efficient diagnosis of dementia. ML algorithms can analyze large datasets of medical images and psychological test results to aid in dementia diagnosis. They extract relevant features from brain images, such as the degree of brain tissue loss or the enlargement of brain ventricles, and can analyze the results of psychological tests to identify patterns associated with dementia [8]. Through tracking health data and cognitive function over time, ML can predict the onset of dementia. Recently, deep learning networks have been trained to analyze MRI or PET images and identify subtle changes associated with dementia, such as brain atrophy or abnormal protein deposits. As mentioned before, the widespread adoption of ML has shown promising results in using various types of data for dementia prediction. The challenge in using ML-based models relates to the availability of high-quality and diverse datasets for training, as insufficient high-quality data can hinder model performance. A popular approach to solving this problem is feature augmentation, which is widely used to address the low dimensionality of datasets [8,9,10,11,12,13]. By capturing complex relationships that linear models might miss, feature augmentation can improve model performance. This method has been used in many previous works [13,14] to modify existing features in a dataset to improve ML models.
Ultimately, this study intends to promote more accessible healthcare delivery using ML techniques for an aging society. The early detection of dementia is critical because it enables timely clinical interventions, supports patient and caregiver planning, and may slow disease progression. Improving the reliability and transparency of detection methods can also contribute to reducing misdiagnosis, particularly in primary care, where diagnostic expertise or resources may be limited. This study is motivated by the growing potential of ML, combined with a hybrid data enrichment framework, to enhance early dementia detection by addressing key challenges in accuracy, accessibility, and interpretability. While traditional approaches rely heavily on clinical evaluations and medical imaging, this study emphasizes the use of clinical data derived from electronic health records (EHRs) to improve the early detection of dementia, aiming to promote broader accessibility to the general population. More specifically, this study aims to propose a classification method that effectively classifies patients into those with and without dementia. Raw data from hospitals are often of low quality and low dimensionality, necessitating effective hybrid data enrichment methods to improve model performance. In this study, new features, named inter-relation-based features (IRFs), were constructed through a feature augmentation process and integrated into the original dataset. Based on medical domain knowledge, IRFs represent relationships between features within the same group to provide more informative features and promote explainability. To tackle the data imbalance, K-Means SMOTE was used to synthetically increase the number of minority class instances (i.e., patients with dementia). K-Means SMOTE preserves the data distribution, reduces bias from oversampling in noisy regions, and enhances model performance on imbalanced datasets. Extra Trees (ET) was selected as an effective classifier due to its ability to handle multicollinearity and its potential to work with complex, noisy, or high-dimensional data. The proposed model was compared with existing ML methods, including Support Vector Machine (SVM), K-Nearest Neighbors (KNN), Artificial Neural Networks (ANNs), Random Forest (RF), and Gradient Boosting (GB). The models were evaluated using the confusion matrix, accuracy, precision, recall, F1 score, and area under the receiver operating characteristic (AUC-ROC) curve.

2. Literature Review

The following section presents a review of the relevant literature for this study.

2.1. Features Used for Dementia Classification Models

ML-based classification or prediction models are constructed using different types of patient data, such as medical records, health history, behavioral patterns, and biological data. Studies have shown that datasets commonly used in ML models can be divided into three categories: unstructured data such as images, structured data such as records from a database, and hybrid data, which are a combination of unstructured and structured data. In the unstructured data category, several complex models have been implemented to process and analyze visual data [15]. For example, recent advancements in deep learning have shown significant promise in neuroimaging-based dementia detection, particularly for Alzheimer’s disease (AD). Deep learning models have consistently outperformed traditional machine learning approaches in analyzing MRI scans for early diagnosis [16]. Studies utilizing the Alzheimer’s Disease Neuroimaging Initiative (ADNI) dataset [16,17] have demonstrated that Convolutional Neural Networks (CNNs) and transfer learning architectures—such as InceptionV3 and ResNet—can achieve high classification accuracy, ranging from 91.8% to 95.2%. Notably, Dense Convolutional Networks (DenseNet) have recently outperformed other CNN variants, reaching an accuracy of 96.1% in early AD classification tasks [18].
When using structured data, the ML model operates on data that are organized in a tabular format, such as databases or spreadsheets. Commonly used data are EHRs with different types of medical, personal, and behavioral data. For example, the authors of [19] present a classification model to classify subjects with and without mild cognitive impairment using itemized scores on three widely used standard neuropsychological tests, including the Alzheimer’s Disease Assessment Scale-Cognitive Subscale (ADAS-Cog) and MMSE. They studied four different ML models: SVM, RF, GB, and AdaBoost. In [20], the adaptive synthetic sampling technique was deployed to improve the performance of an SVM-based model, and a novel feature extraction technique was proposed, namely, Feature Extraction Battery, for classifying dementia. The authors of [21] employed a GB-based model for the multiclass classification of heart failure, aortic stenosis, and dementia using EHR data from a hospital.
For hybrid data, the authors of [5] proposed a classification model for dementia based on MRI and clinical data. They incorporated univariate feature selection as a preprocessing step to filter features from MRI data. The authors of [22,23] examined the latest advancements in ML for AD detection and classification, concentrating on neuroimaging studies and some related clinical data. The techniques explored included SVM, RF, CNNs, and K-means. It can be seen that research on medical applications often involves using various types of data, such as neuroimaging, protein sequences, speech data, electroencephalogram (EEG) data, and magnetoencephalography signals, as well as additional data such as medical history and genetic data. However, working with such large datasets is not always practical in medical settings.
In this study, structured data—specifically biochemical and physiological features derived from EHRs—were primarily utilized to develop ML-based classification models to promote the early detection of dementia in a way that is accessible and convenient for the general public. This work is motivated by the limitations of neuroimaging and brain function assessments, which typically require advanced medical facilities and specialized expertise that may not be readily available in rural or resource-limited settings.

2.2. Feature Engineering for Disease Prediction

Feature engineering is a crucial step in the ML pipeline, especially for disease prediction or classification tasks. Effective feature engineering can significantly enhance the predictive power of models in disease prediction. A crucial part of feature engineering is feature extraction, which involves transforming raw data into a format that is more suitable for modeling. Several feature extraction methods have been proposed to increase the diagnostic accuracy of disease prediction or classification models [23]. The authors of [24] proposed a time–frequency representation and feature extraction-based model to distinguish between EEG segments of control subjects and AD patients. Hanai et al. [25] presented a dementia classification model based on the speech analysis of casual conversation during a clinical interview and used speech feature extraction to reduce the dimensionality of the speech dataset for an SVM model. While feature extraction can significantly improve ML performance, it also presents challenges that can negatively impact the results. Reducing data dimensionality can cause information loss, degrading model performance. Some feature extraction methods are computationally expensive, especially with large datasets, and may capture noise, leading to overfitting. To ensure reliable performance, it is essential to carefully select extraction methods and conduct thorough validation and testing.
Feature augmentation is another method within feature engineering. Usually, improving the generalization or performance of a model involves enhancing a dataset by adding new features derived from the existing ones. Augmented features can be used to capture complicated relationships and patterns that might not be apparent from the original features. Moreover, feature augmentation can make models more robust to data unpredictability and noise, hence producing more accurate predictions. Recently, health dataset features were found to be useful for generating new data through mathematical combinations. Through providing more informative features, augmented datasets can lead to better model accuracy and precision. Many researchers have employed feature augmentation techniques to improve the performance of disease prediction and classification models. For example, the authors of [26] presented an extensive review of data augmentation methods applicable to computer vision domains. The study results showed that data augmentation methods based on explicit transformation operations provide accurate and reliable performance improvements. The authors of [27] presented a transfer learning technique to detect and classify the severity of dementia using MRI scan images.
While extracted features can highlight relevant patterns, augmentation can introduce variability, helping models learn from a broader spectrum of data. Many models use both techniques for disease prediction or classification. For example, the authors of [27] proposed a structured approach that includes preprocessing, dimensionality reduction using principal component analysis (PCA), dataset augmentation with a neural network, and training and evaluation on a dementia dataset using CNN-based classification. In [28], data augmentation techniques and a CNN were used for the early detection of AD. The results indicate that combining PCA and CNNs for AD detection is a powerful approach. PCA reduces dimensionality and improves efficiency, while CNNs excel at extracting discriminative features from images.
In this study, feature augmentation is selected to play a central role in enhancing the informativeness and interpretability of the input space. New inter-feature constructs are generated by leveraging established medical knowledge and clinically validated relational equations to produce more meaningful and explainable features. This domain-driven augmentation contributes to improved model performance and promotes the transparency and trustworthiness of clinical decision support systems.

2.3. Data Balancing for ML Model Construction

Data balancing methods are used to address class imbalance in datasets—especially in classification problems where one class is noticeably under-represented relative to others. The dominant class may influence the model, resulting in low performance for the minority class, despite achieving great accuracy. Three main categories define data balancing techniques: oversampling, undersampling, or hybrid techniques. The Synthetic Minority Oversampling Technique (SMOTE) has become well known among the methods of data balancing in the domain of ML. SMOTE essentially balances the dataset and prevents the model from overfitting by synthetically generating minority class instances from the original data. Many studies on the diagnosis and classification of dementia and AD have highlighted the general importance of the SMOTE method. For example, in [29], image-enhancing techniques are used in conjunction with SMOTE and deep learning to improve the accuracy of early AD detection.
K-Means SMOTE is an enhanced version of SMOTE that leverages clustering to generate more meaningful synthetic samples, making it more effective in certain scenarios. It combines K-means clustering with SMOTE to improve classification performance. In addition, it differs from the original SMOTE by considering the overall data distribution using clustering, whereas SMOTE operates locally on minority class instances without considering the global structure. By focusing on areas of the feature space where the minority class is sparse, K-Means SMOTE tends to reduce the risk of generating noisy samples. K-Means SMOTE is an effective technique for addressing class imbalance in various prediction tasks, highlighting its versatility and effectiveness in enhancing prediction performance across diverse domains, especially for medical datasets [30,31]. In addition, adaptive synthetic sampling (ADASYN) has also been widely used for data synthesis. This method adaptively generates more synthetic data for minority class samples that are harder to learn; that is, those surrounded by many majority class samples. Although it can adapt to difficult samples by focusing on harder-to-learn instances, ADASYN may overemphasize borderline or noisy samples, leading to overfitting and reduced generalizability in real-world clinical applications, especially when class boundaries are fuzzy or error-prone [32]. However, K-Means SMOTE stands out among oversampling techniques for disease prediction by combining clustering with synthetic sampling, enabling more informed data generation. Unlike SMOTE and ADASYN, it avoids noisy regions and reinforces representative areas, enhancing class separability and reducing overlap with the majority class. This makes it particularly well suited for imbalanced clinical datasets with subtle decision boundaries, which justifies its selection for this study.

2.4. Machine Learning Classification for Dementia Prediction

Research studies on ML methods for dementia prediction and diagnosis highlight three main groups: traditional classifiers, ensemble learning, and deep learning. Traditional models such as Naive Bayes, decision trees, and SVM are effective for smaller datasets or less complex features. Ensemble methods, such as RF, ET, and GB, combine multiple models to improve performance, robustness, and generalization. Deep learning models excel at analyzing high-dimensional data, such as medical images and genomic sequences, automatically learning relevant features without extensive manual engineering. However, ensemble-based methods are often preferred over deep learning in medical applications due to challenges in obtaining sufficient high-quality data, which can be both difficult and time-consuming.
Ensemble learning, which combines multiple models to improve prediction accuracy, has become a powerful tool in the diagnosis and prognosis of various diseases, including dementia. For example, the authors of [33] utilized handwriting analysis for diagnosing neurodegenerative disorders such as AD and Parkinson’s disease. The authors of another study [34] developed an ensemble model using Light Gradient Boosting, Categorical Boosting, and Adaptive Boosting for AD detection. Similarly, Shen et al. (2022) [35] proposed an ensemble deep learning approach for disease prediction through metagenomics. The authors of [18] compared traditional and ensemble classifiers for the multiclass classification of heart failure, aortic stenosis, and dementia, while Goel et al. (2023) [36] applied ensemble methods to the Open Access Series of Imaging Studies dataset for dementia prediction. All these studies have demonstrated that ensemble methods consistently outperform traditional models.
Recent studies have explored the use of ET and decision tree ensembles for improving predictions in various domains, especially disease prediction [37,38]. ET enhances randomness by also randomly selecting the split threshold instead of calculating the best split point. This dual randomization—incorporating both feature and threshold selection—increases diversity among the trees, resulting in reduced variance and improved generalization, especially in high-dimensional datasets [39]. This is particularly beneficial when dealing with noisy or complex data. Compared to other ensemble methods such as RF, ET further decreases variance by using random thresholds, making it more effective for small datasets, where feature engineering is critical [40]. While GB’s sequential error correction risks overfitting on small datasets and requires extensive hyperparameter tuning, ET’s randomized splits and ensemble averaging provide more stable performance with minimal tuning [39,40]. Additionally, ET’s bagging approach naturally mitigates class imbalance, whereas GB may amplify bias when synthetic oversampling introduces noise [41,42]. Deep learning models, while powerful, often require large-scale data and extensive hyperparameter tuning, making them less practical for low-dimensional clinical datasets [43].
Within the realm of healthcare data, which frequently contain heterogeneous patterns, missing values, and irrelevant features, this added randomness of ET helps prevent the model from overfitting to misleading correlations [44]. Therefore, ET often outperforms traditional ensemble learning methods in biomedical applications, including disease classification, phenotyping, and risk prediction [45,46]. Its capacity to model complex, nonlinear interactions among features makes it particularly suitable for tasks such as dementia classification, the application in this study.

2.5. Proposed Work

This study proposes a novel ML-based binary classification model using readily available biochemical and physiological features from electronic health records to improve accessibility and early detection. As the use of sufficiently high-quality data is key to the success of ML-based models, this study proposes a hybrid data enrichment framework, feature augmentation, and data balancing to improve the overall classification performance of ML-based models. The conceptual diagram of the proposed hybrid enrichment framework is shown in Figure 1.
Figure 1 shows that the hybrid data enrichment framework increases the dimensionality of the original dataset for both the number of features and the number of examples. For feature augmentation, each IRF was constructed from features within the same group. In this study, five groups of features were used to derive relationships: (1) blood pressure, (2) lipid levels, (3) blood sugar levels, (4) renal and chemical substances, and (5) blood cell count. The creation of new features based on existing mathematical relationships, which are derived from medical domain knowledge, is expected to increase the diversity of the data and promote explainability without introducing new biases into the newly generated, more informative features. By creating interaction terms, relationships that might not be evident in the original features are expected to be captured. For data balancing, K-Means SMOTE was selected to increase instances of the minority class, which is the dementia class. Incorporating these augmented and newly synthesized data into the original dataset is expected to improve the overall performance of the ML model. Furthermore, this study aims to determine which combination of datasets is able to enhance the performance of ML-based classification models.

3. Research Methodology

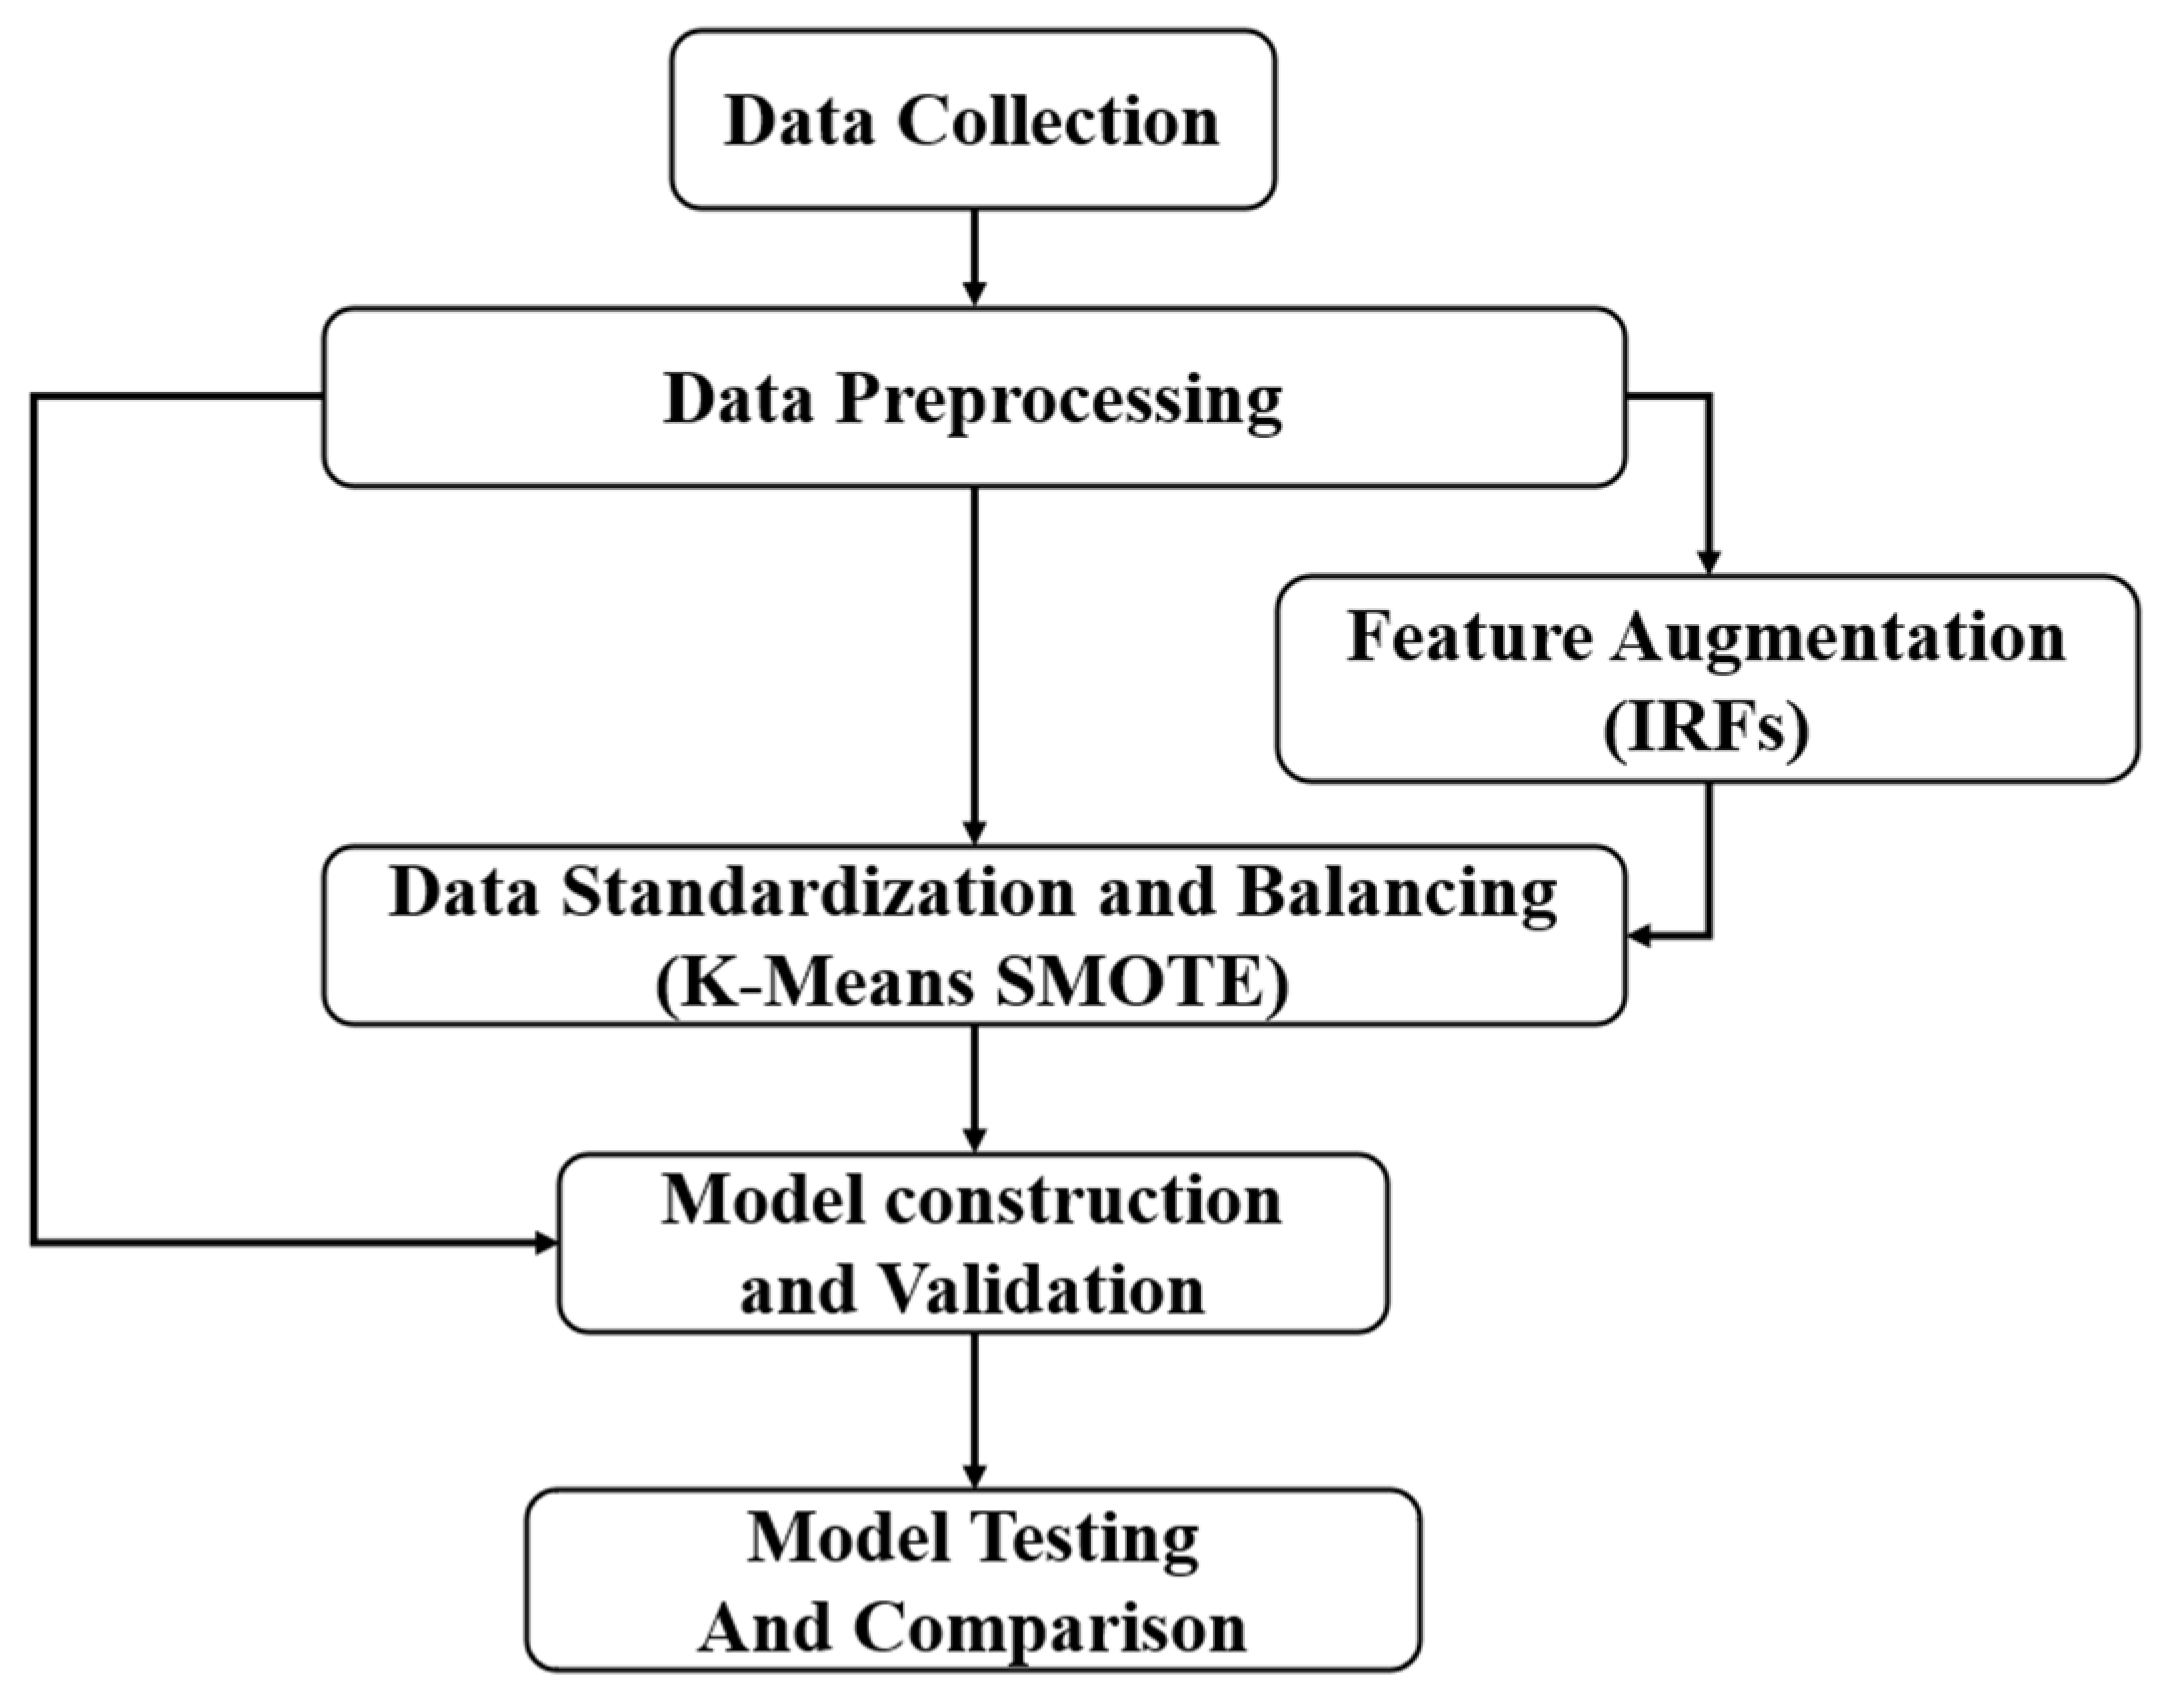
The research methodology of this study is shown in Figure 2. The details of each process are discussed in this section.

3.1. Data Collection

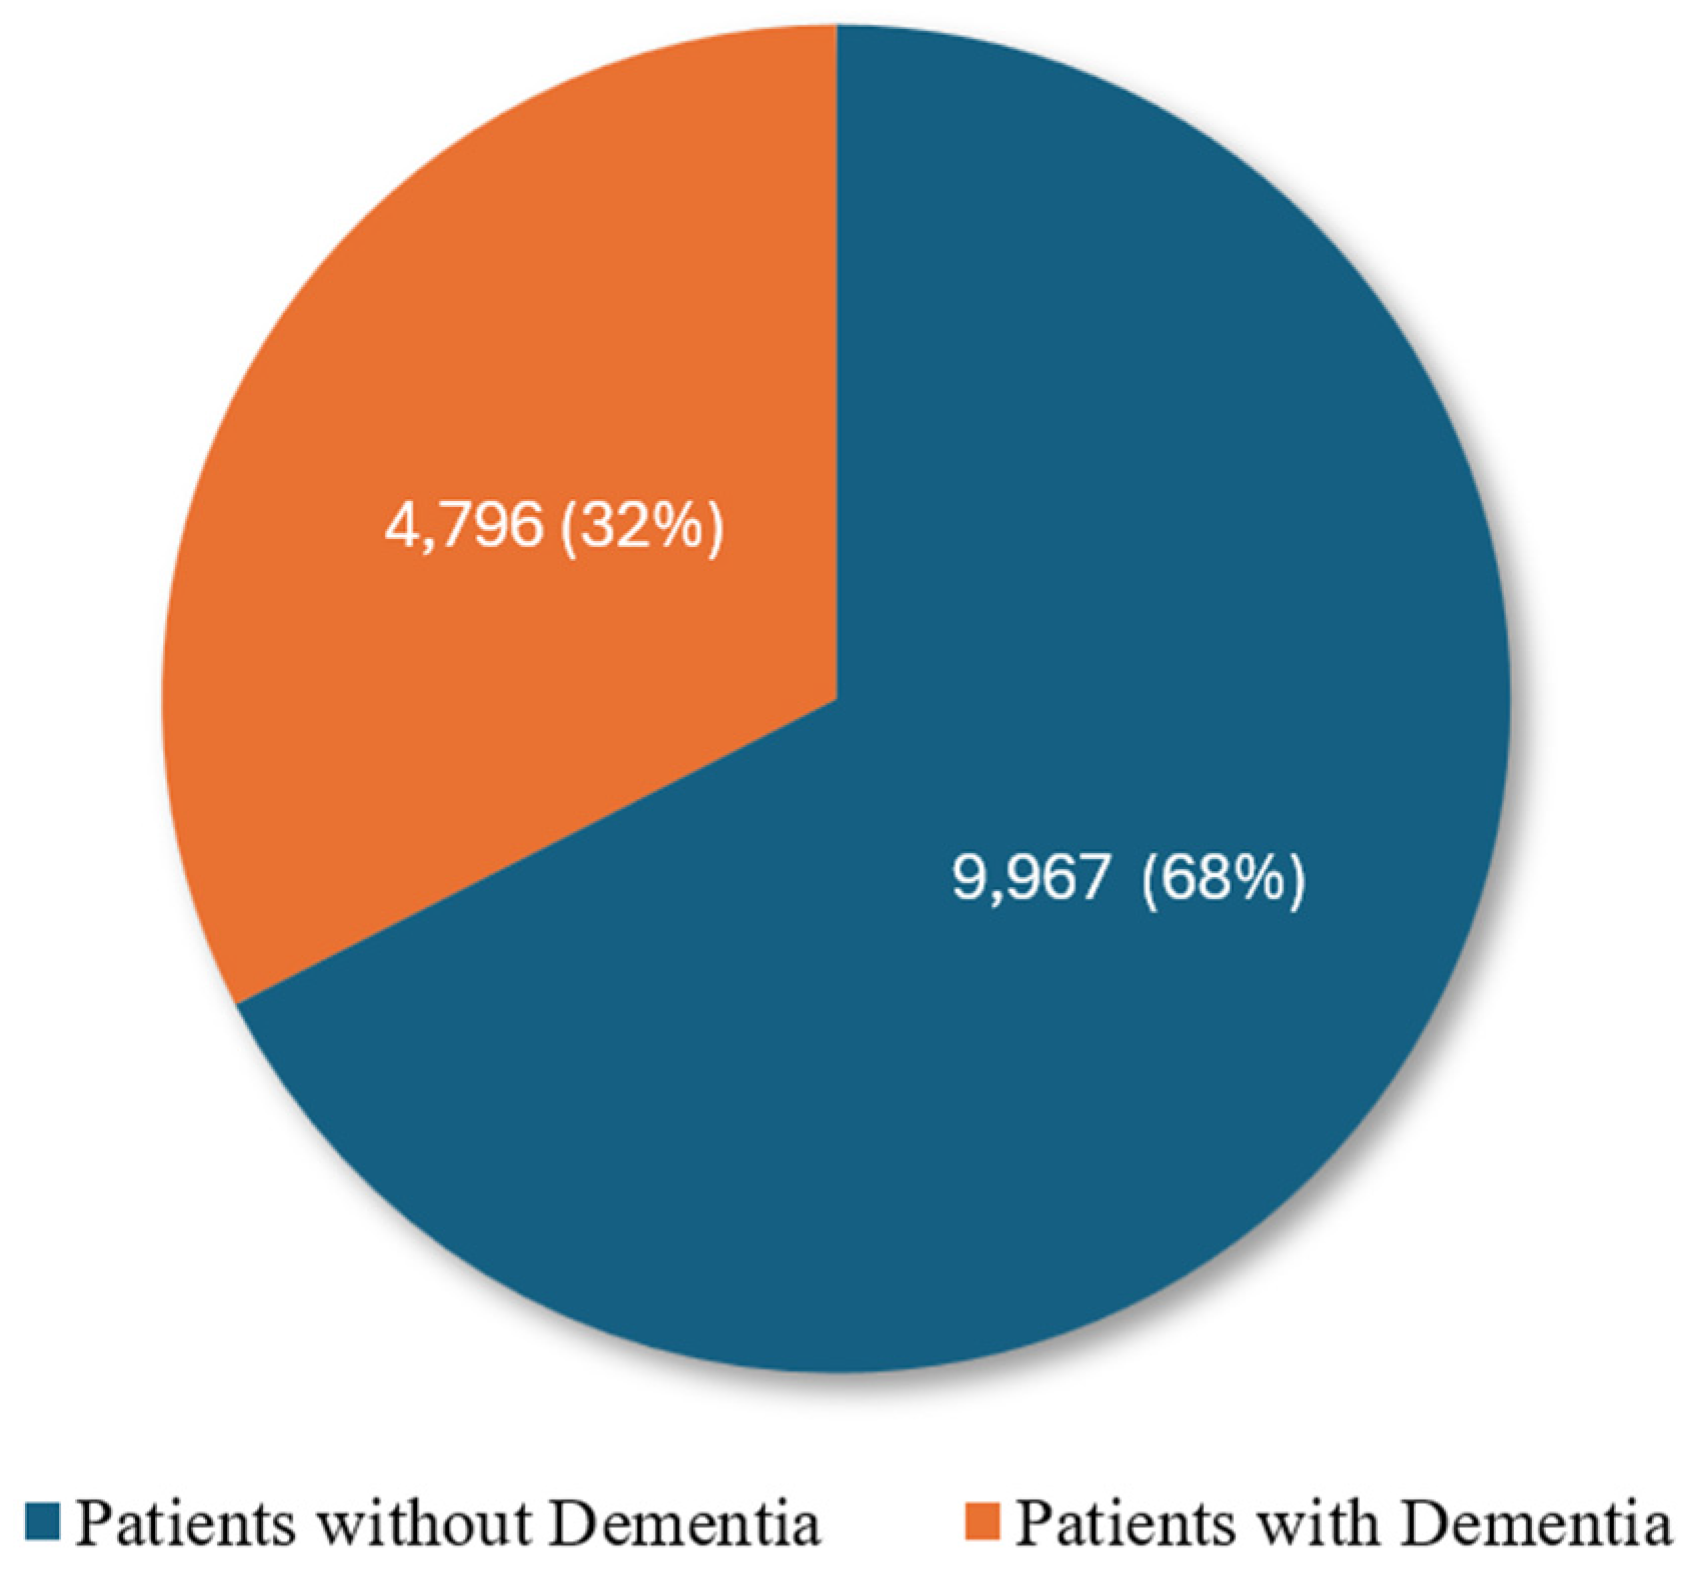
The data used in this study are EHRs from Chiang Rai Phachanukroh Hospital, Chiang Rai Province, Thailand; they comprise 14,763 records including 4796 records of patients with dementia and 9967 records of patients without dementia (heart failure and heart valve disorders), and originally included 22 features. The data proportions are shown in Figure 3.
The feature datasets are divided into two categories: personal features, such as age, height, weight, etc., and 6 groups of clinical features, as shown in Table 1.

3.2. Data Preprocessing

Data preprocessing is a crucial step in preparing data for ML. In this study, data preprocessing consisted of two main steps: data cleaning and imputation. Due to human error, some features in this dataset were left unnamed and could not be used. More specifically, features such as education level and service date were considered irrelevant to the models’ predictions. For data cleaning, any feature with over 90% missing data was excluded, as it lacked sufficient information to be useful. For categorical features, one-hot encoding was employed, which involves transforming each category into a separate binary feature. In this study, the “gender” column was encoded as two binary features: one for “male” (represented as 1) and another for “female” (represented as 0).
To address missing values, the K-NN imputation method was employed to maintain relationships within the data when conducting data imputation correctly [47]. The K-NN imputation method [48] is a technique used to handle missing data in a dataset by estimating the missing values based on the values of similar (neighboring) data points. The core idea is to find the most similar data points (nearest neighbors) to the data points with missing values and use them to predict the missing values. The K-NN imputation method specifies the parameter k, which denotes the nearest neighbors used as references for imputing missing values. In this study, the value of k was set to 2 to perform imputation based on actual surrounding data points while minimizing reliance on averaged values that may obscure individual variability. When a missing value is encountered, the algorithm calculates the distance between the incomplete row and all other rows with complete data using Euclidean distance metrics. The two nearest neighbors are then selected as the basis for imputation. In this study, the missing attribute is numerical, and the imputed value is computed as the average of the corresponding values from the two selected neighbors. This imputed value is then substituted into the original row in place of the missing entry, ensuring consistency with the most similar existing data points.

3.3. Feature Augmentation

Feature augmentation was applied to increase the number of features in the original clinical dataset. New features were constructed by using equations based on medical domain knowledge to represent relationships between features within the same group. Therefore, these new augmented features are named inter-relation-based features, or IRFs. The primary objective of IRFs is to enhance the explainability and trustworthiness of the proposed model by ensuring that the newly constructed features are based on clinically meaningful and interpretable relationships. The experiments involved randomly augmenting the data using 4 and 8 features sequentially to determine the most effective set for classification. The details of the new features used to construct IRFs are presented in Table 2.
The equations related to the features in Table 2 are described in the text below.
ABP [49] is calculated using Equation (1).
B P = S B P + D B P 2
The HDL/LDL Ratio [49,50,51], which is a crucial indicator of cardiovascular disease risk, is computed by dividing total cholesterol by HDL cholesterol. The necessary data for this calculation are obtained from the “lipid levels” group, and the formula is given by Equation (2).
C h o l e s t e r o l H D L   R a t i o = C h o l e s t e r o l H D L
The NLR [49,51,52] is the ratio of neutrophils to lymphocytes (white blood cells). This ratio is calculated using data from the “blood cells” group and the formula is represented by Equation (3).
N L R = N e u t r o p h i l ÷ 100 × W B C L y m p h o c y t e ÷ 100 × W B C
MDRD [49,50] is employed to estimate the glomerular filtration rate (eGFR), a measure of kidney function, especially in patients with chronic kidney disease. The data required for this calculation are from the minerals and chemical substances group, and the formula is given by Equation (4).
M D R D = 175 × C r e a t i n i n e ( 1.154 ) × A g e ( 0.203 )
NC [51,52] is calculated using the percentage of neutrophils in a complete blood count and the total white blood cell count. The data for this calculation are obtained from the “blood cells” group, and the formula is given by Equation (5).
N e u t r o p h i l   C o u n t = N e u t r o p h i l 100 × W B C
The TG/HDL Ratio [49] is another risk factor for cardiovascular disease and metabolic disorders. It is calculated using data from the “lipid levels” group, and the formula is given by Equation (6).
T r i g l y c e r i d e H D L   R a t i o = T r i g l y c e r i d e H D L
CKD-EPI [49] is an updated formula for eGFR. The data required for this calculation are from the “minerals and chemical substances” group, and separate formulas are provided for males and females, represented by Equations (7) and (8) for females and males, respectively.
e G F R = 141 × m i n c r e a t i n i n e 0.7 , 1 0.329 × m a x c r e a t i n i n e 0.7 , 1 1.209 × 0.993 a g e × 1.018 × 1.159 i f   B l a c k
e G F R = 141 × m i n c r e a t i n i n e 0.9 , 1 0.411 × m a x c r e a t i n i n e 0.9 , 1 1.209 × 0.993 a g e × 1.018 × 1.159 i f   B l a c k
The HDL/LDL Ratio is used to assess vascular health and cardiovascular risk. It is calculated by dividing HDL cholesterol by low-density lipoprotein (LDL) cholesterol. The data for this calculation are from the lipid group, and the formula is given by Equation (9).
H D L L D L   R a t i o = H D L L D L
Figure 4 shows the different combined datasets used to investigate the proposed model in this study, including original data, original data + 4 IRFs, and original data + 8 IRFs.
To complement the conceptual diagram of the feature combination set, examples from the dataset with a combination of original features and IRFs are shown in Table 3.
After the feature augmentation process, data standardization was conducted, and imbalanced data were handled for the next process.

3.4. Data Standardization and Balancing

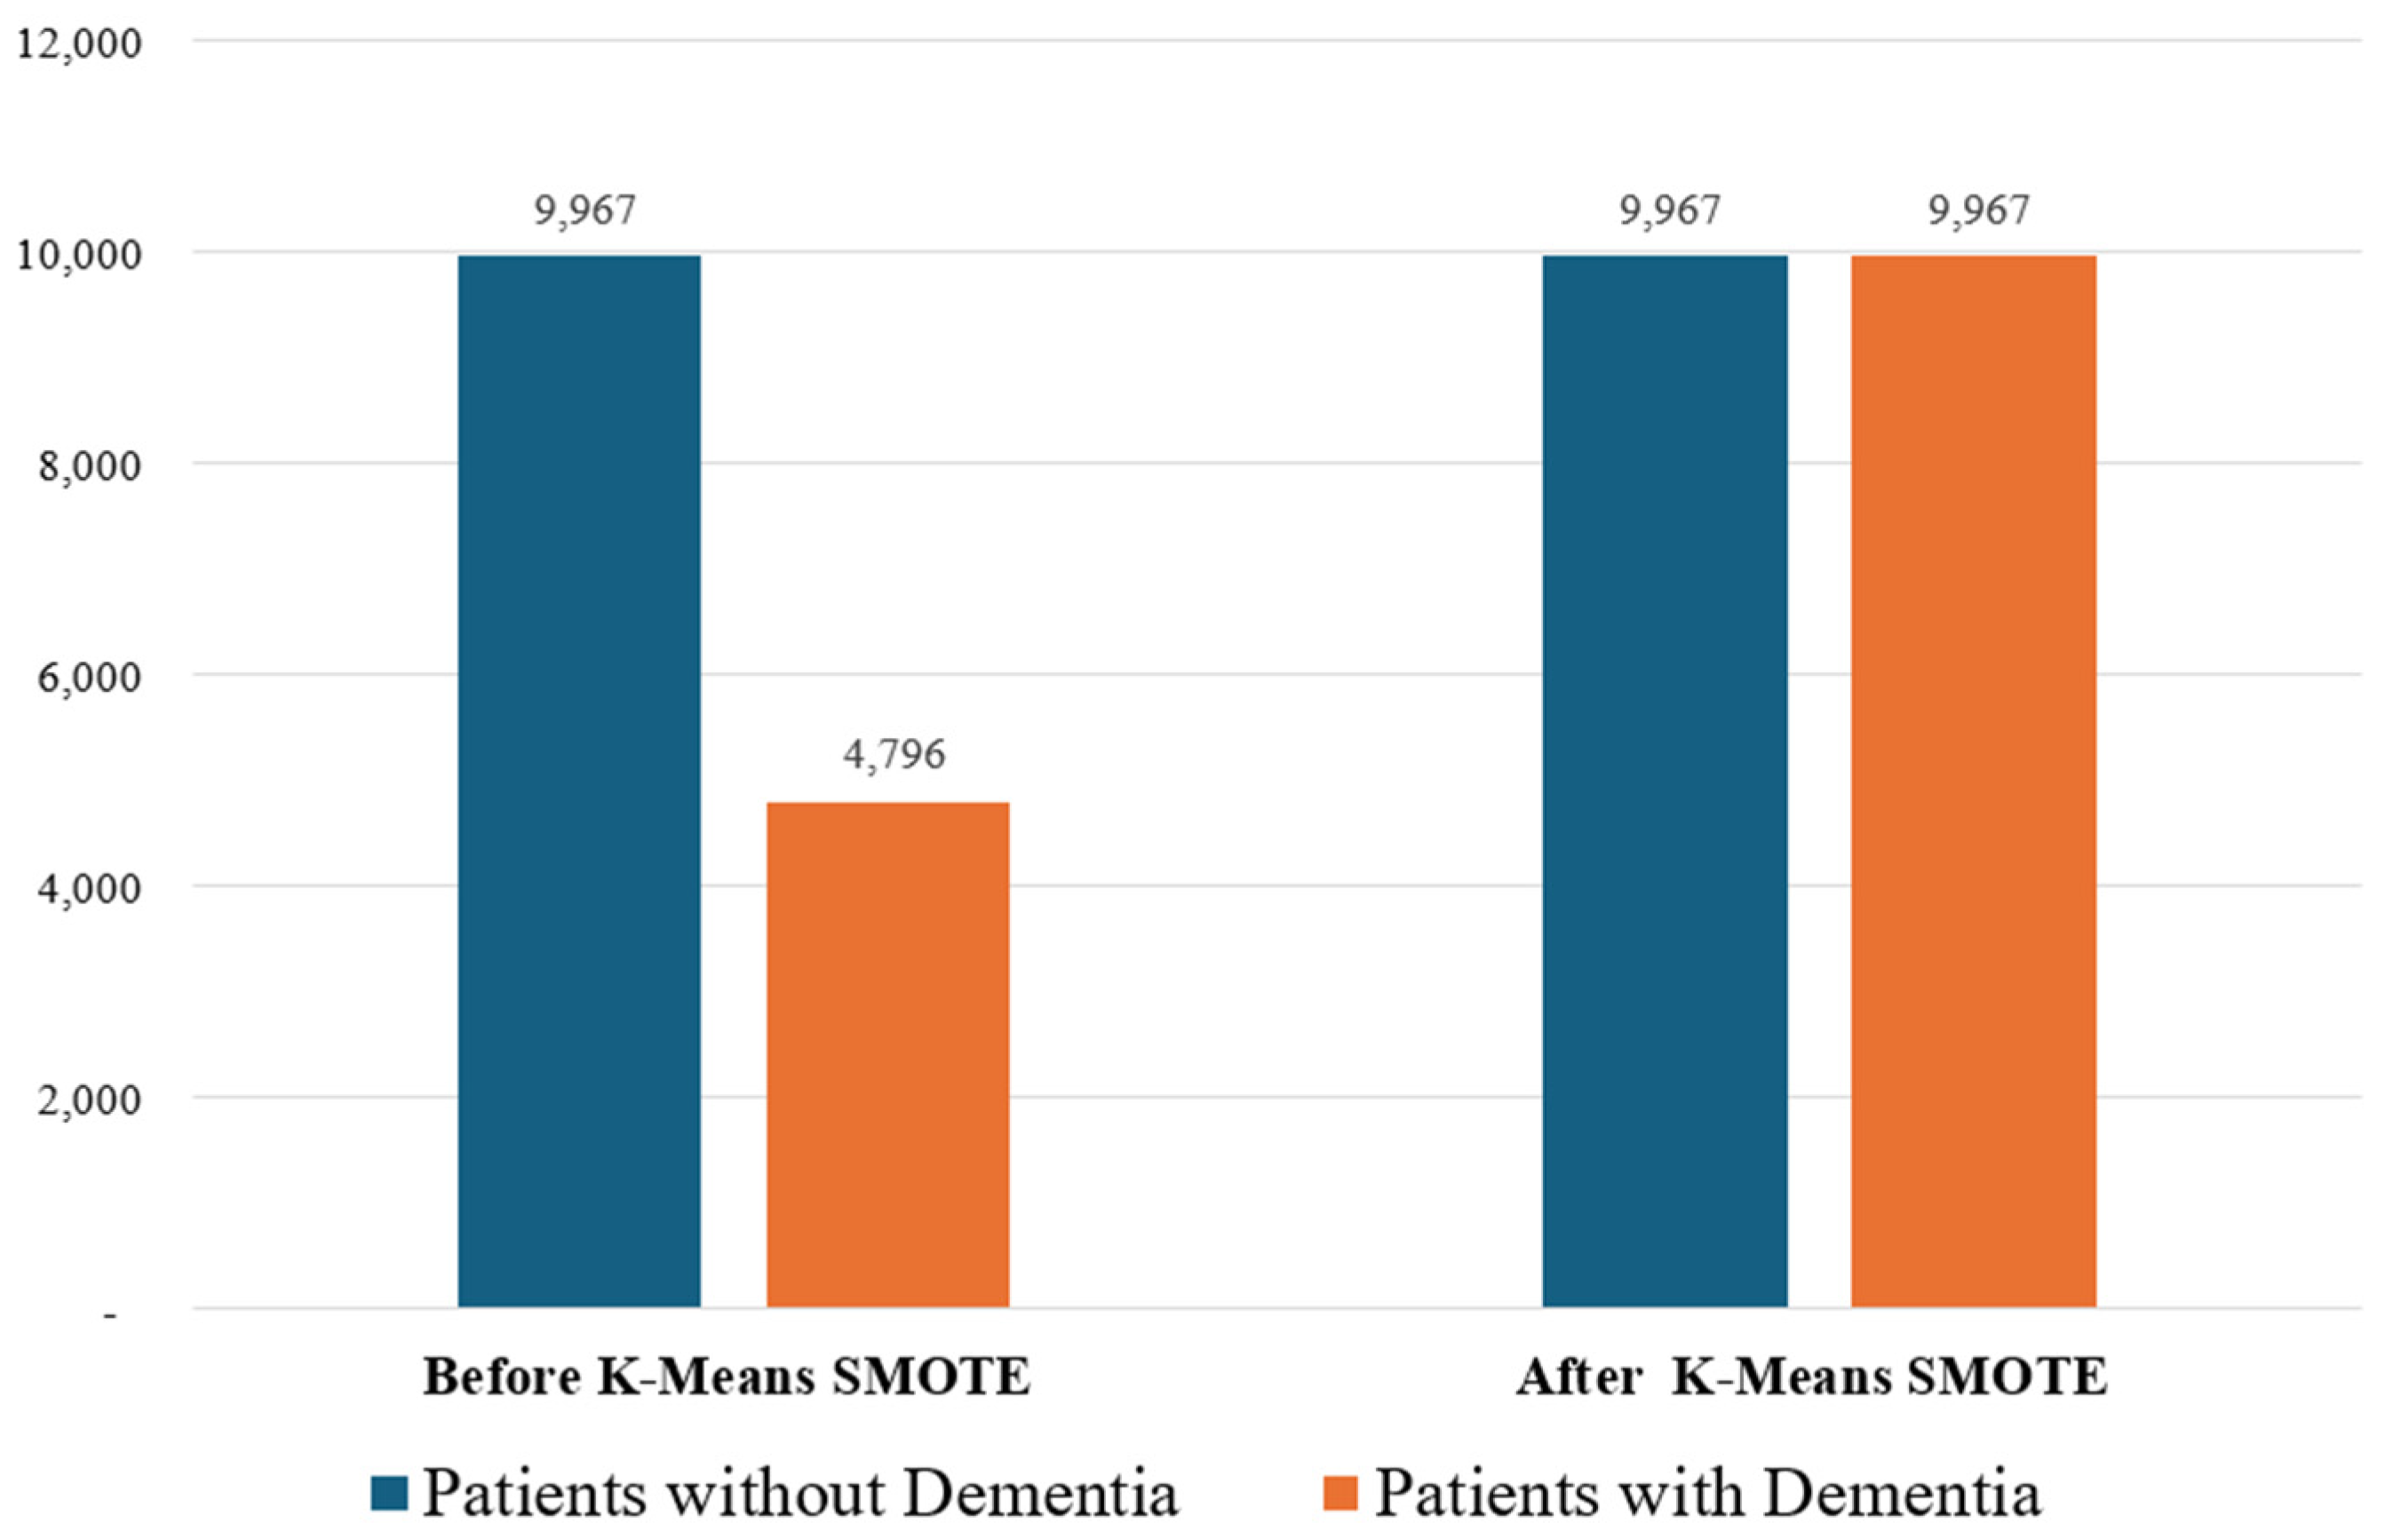
Features with different scales (e.g., SBP vs. WBC) can bias ML models. Without standardization, features with larger numerical ranges may dominate the learning process. In this study, data standardization was used to enhance the distribution of the data, ensuring a mean of zero and a standard deviation of one, thereby achieving a normal distribution of the data. K-Means SMOTE was selected over traditional SMOTE and ADASYN due to its ability to generate synthetic samples in more representative and safer feature space regions, reducing the noise risk and enhancing model generalization, particularly in imbalanced clinical datasets. In this study, patients with dementia constitute the minority group. After applying K-Means SMOTE, the number of minority instances increased, as shown in Figure 5.
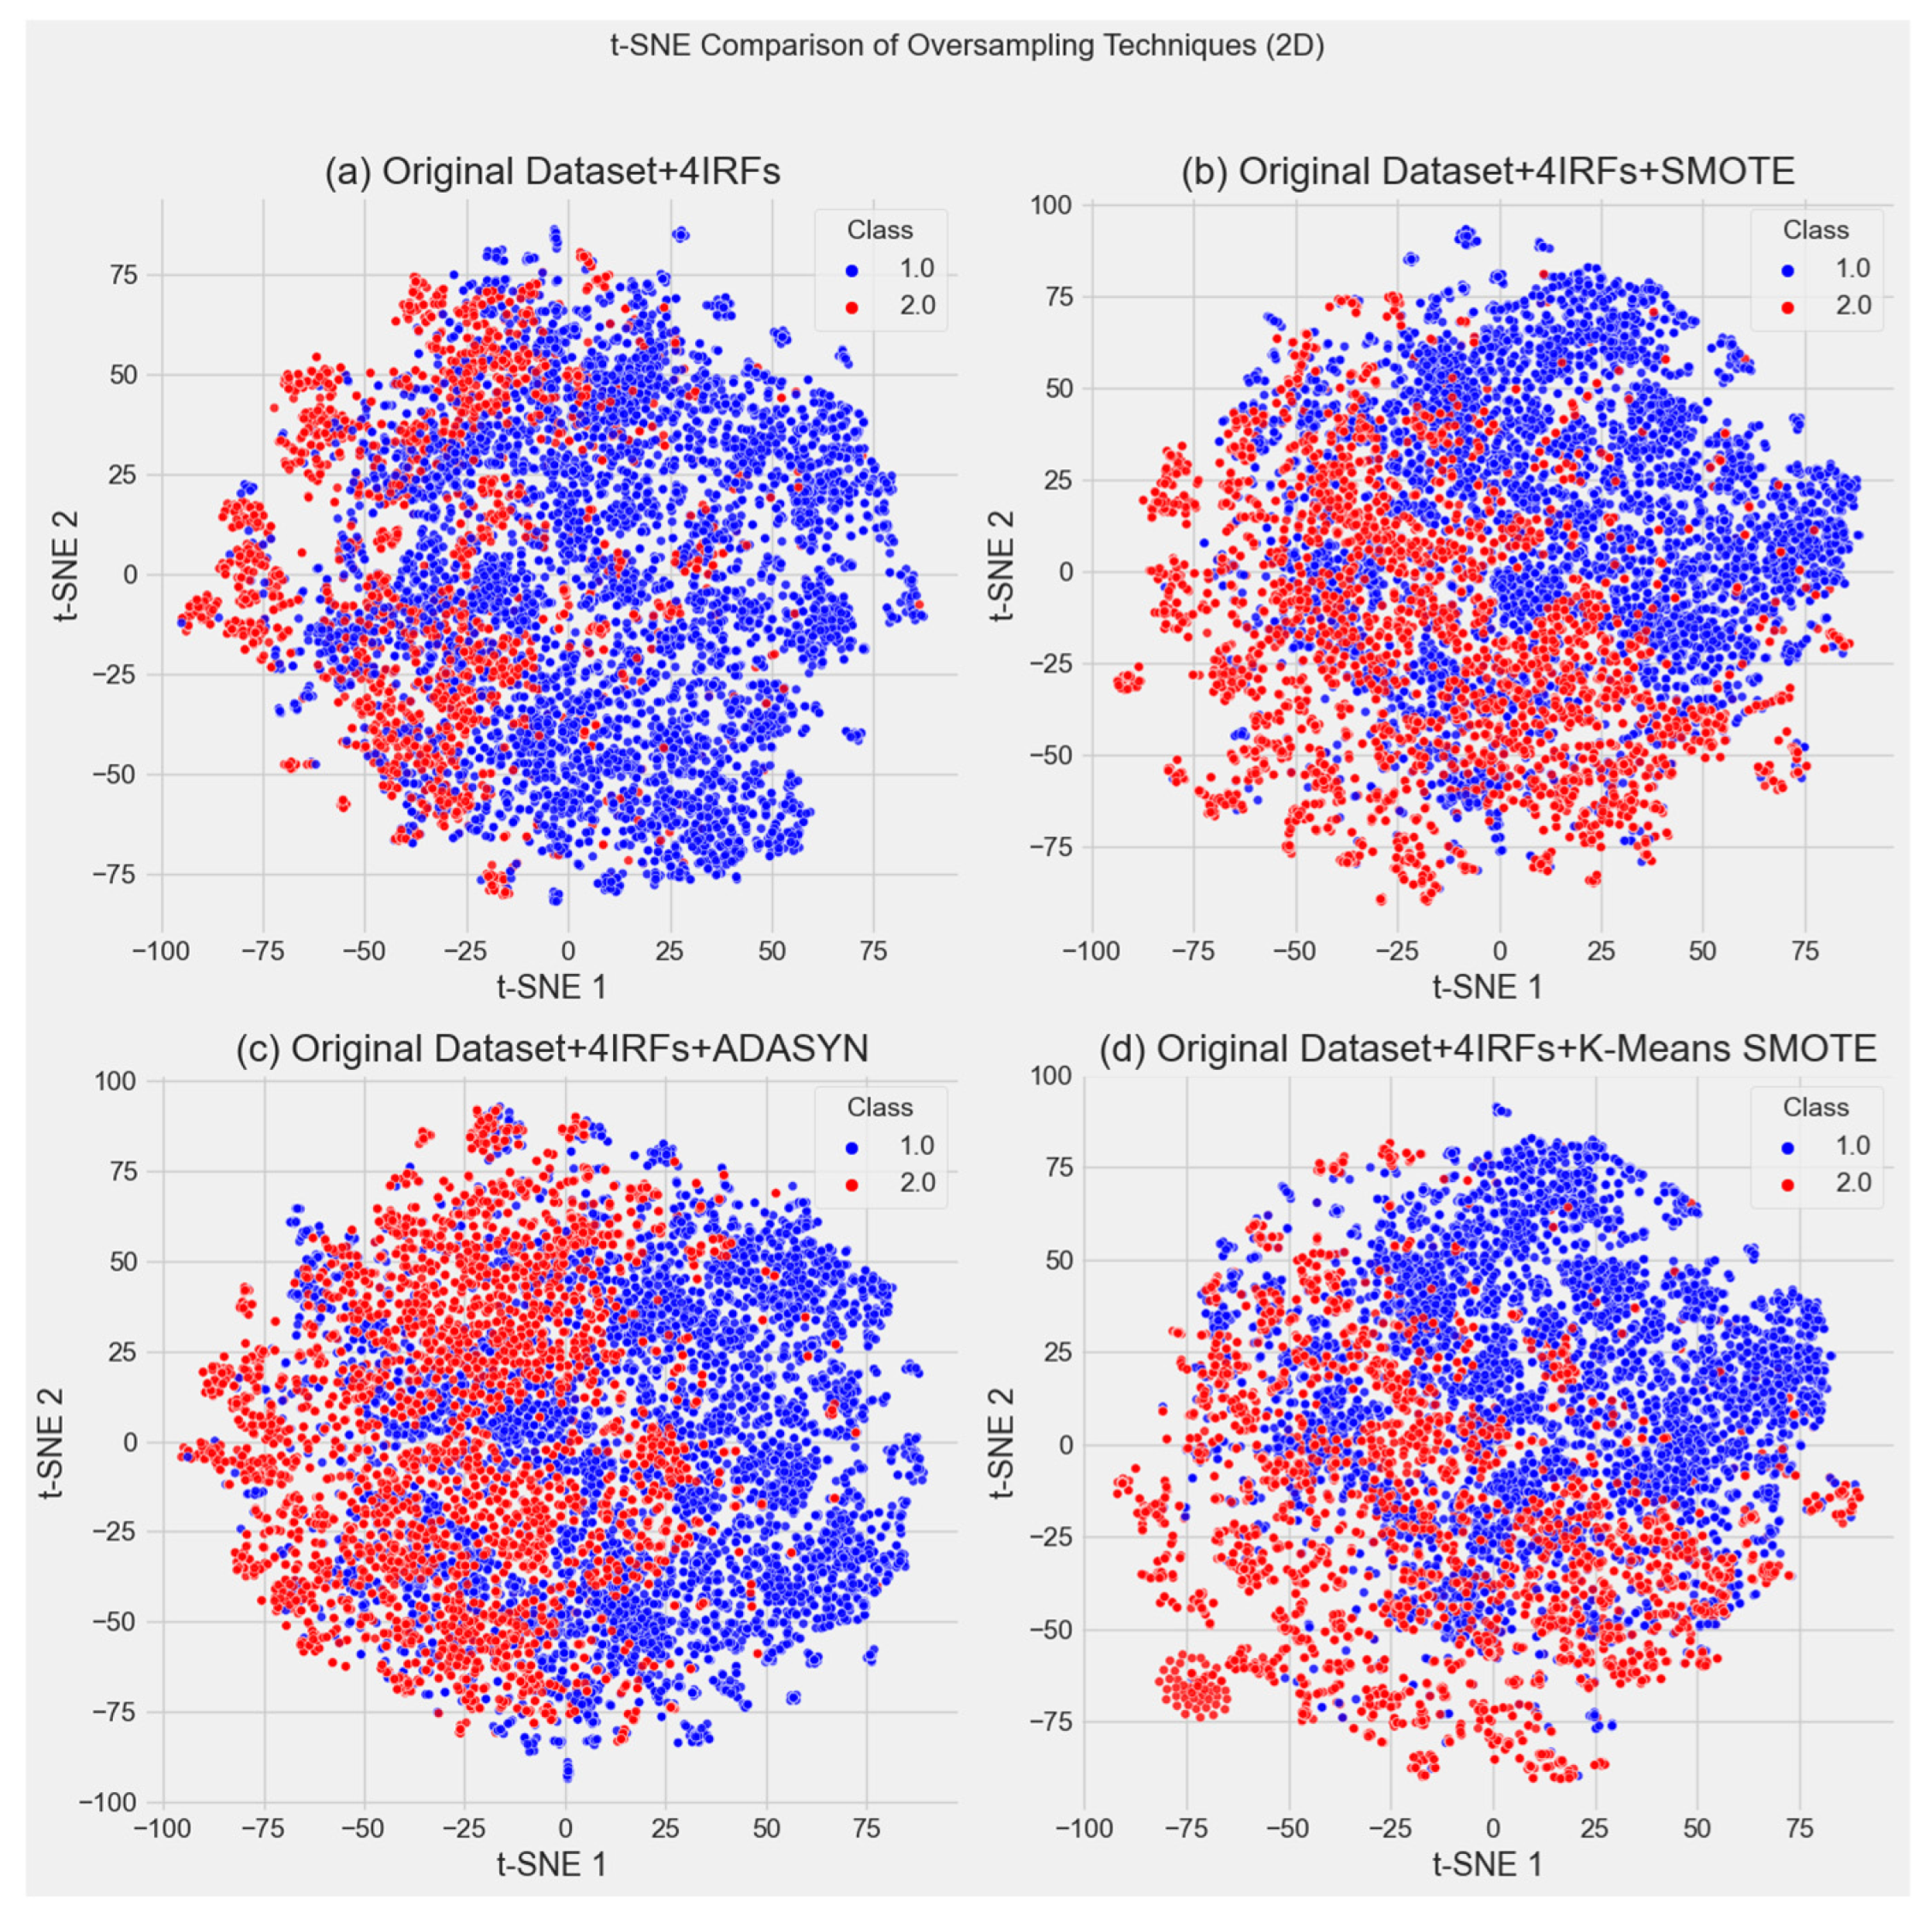
To verify structural differences in synthetic data, t-SNE was used to visualize datasets after applying IRFs with SMOTE, K-Means SMOTE, and ADASYN, as shown in Figure 6.
Figure 6a shows the imbalanced 4-IRF dataset, with minority class samples (red) sparsely distributed, limiting effective boundary learning. In Figure 6b, SMOTE improves the balance by spreading minority samples but introduces an overlap with the majority class, risking reduced precision. Figure 6c shows that ADASYN creates irregular minority distributions near class boundaries, increasing overlap and noise. In contrast, Figure 6d illustrates that K-Means SMOTE produces a more structured and clustered distribution, enhancing minority representation while preserving class separability. Among the four scenarios, K-Means SMOTE appears to be the most effective augmentation strategy for this study. It improves the class balance while preserving the local structure and minimizing the overlap between classes. Unlike SMOTE and ADASYN, which either oversmooth or overconcentrate synthetic data, K-Means SMOTE achieves a principled balance between coverage and clarity. Therefore, K-Means SMOTE stands out as the most reliable oversampling method based on visual and structural evidence from the t-SNE analysis. To justify the chosen oversampling method, statistical test results confirming that K-Means SMOTE preserves data distribution, improves performance consistency, and enhances generalization are presented in the Results section.

3.5. Model Construction and Validation

The combined data were split, with 30% for testing and 70% for training. Ten-fold cross-validation was the validation approach. The ET model was compared with five other models: SVM, KNN, ANN, RF, and GB. Mostly applied in classification and regression tasks, SVM is a supervised machine learning method that maximizes the margin between several classes by building a hyperplane in a high-dimensional space. With the largest possible margin [53,54], SVM seeks the optimal hyperplane that best divides the data into discrete classes. KNN is a non-parametric, slow learning method used for classification and regression problems. This method predicts the class or value of a given data point based on the majority class or average value of its KNN in the feature space [55,56]. Inspired by human brain neural architecture, an ANN is a computational model comprising layered, interconnected nodes that learn from the input data to forecast results.
From the ensemble learning group, RF is an ensemble learning algorithm that creates a collection of decision trees and combines their individual outputs to produce a final prediction. This method improves classification and regression performance by averaging the results of multiple trees, thus reducing overfitting and increasing robustness [57]. GB uses gradient descent optimization to minimize the loss function at each iteration [58]. It is an ensemble learning method that b uilds a strong predictive model by combining multiple weak models, typically decision trees. The algorithm constructs trees sequentially, each correcting the errors of its predecessor. ET, the proposed model, introduces additional randomness in the construction of decision trees. By randomly selecting splits at each node, ET improves computational efficiency while also reducing overfitting [59].
To ensure optimal model performance and enable fair comparisons of the classifiers, hyperparameter tuning was conducted using grid search in combination with 10-fold cross-validation. This approach enables a systematic evaluation of predefined parameter combinations and facilitates the selection of configurations that yield the best average performance. Grid search was selected for its interpretability and exhaustive search strategy, while 10-fold cross-validation was utilized to provide robust and generalizable performance estimates—particularly critical in clinical datasets, which often exhibit moderate sample sizes and class imbalances.

3.6. Model Comparison

All necessary measurements were determined to evaluate model performance, including true positive (TP), true negative (TN), false positive (FP), and false negative (FN) rates. TP is the number of correct predictions where the actual outcome is positive. TN is the number of correct predictions where the actual outcome is negative. FP is the number of incorrect predictions where the actual outcome is negative but the model predicts positive. FN is the number of incorrect predictions where the actual outcome is positive but the model predicts negative. Finally, the classification performance of all models was compared in terms of the accuracy, ROC curve, area under the ROC curve, precision, recall, and F1 score. These metrics are discussed in detail below.
Accuracy is one of the metrics used to evaluate the performance of a model or prediction. It indicates the proportion of total predictions that are correct to the total number of predictions. It is defined in Equation (10).
Accuracy = T P + T N T P + T N + F P + F N
Precision is the ratio of correctly classified instances to all instances classified by the model (including both T P and F P ). It emphasizes achieving the highest accuracy in the instances predicted as positive ( T P ) while minimizing the instances incorrectly predicted as positive ( F P ), as shown in Equation (11).
Precision = T P T P + F P
Recall (also known as sensitivity or T P rate) is the ratio of correctly classified instances to all instances that truly exist. Recall expresses the number of positive instances that were correctly predicted relative to all instances that are actually positive (including those predicted incorrectly— F N ) . It is calculated as the ratio of T P to the sum of T P and F N , as shown in Equation (12).
Recall = T P T P + F N
The F1 score is a metric used to evaluate the performance of classification models, particularly in scenarios involving imbalanced datasets where class distributions are uneven. It provides a comprehensive measure of model performance by considering both precision and recall, as shown in Equation (13).
F 1   Score = 2 × P r e c i s i o n × R e c a l l P r e c i s i o n + R e c a l l
An ROC curve is a graph used to assess the performance of a classification model by measuring its ability to distinguish between positive and negative classes at different threshold values. The following information is available: (1) true positive rate (sensitivity, recall): the ratio of correctly identified positive examples ( T P ) to the total actual positive examples ( T P + F N ); (2) false positive rate: the ratio of correctly identified negative examples ( T N ) to the total actual negative examples ( T N   + F P ), as shown in Equation (14).
True   positive   rate = T P T P + F N
For general binary classification, the AUC represents the ability of a classifier to distinguish between two classes. Its value ranges from 0 to 1. In the case of 100% wrong predictions, the AUC is 0, and in the case of perfectly correct predictions, the AUC is 1.

4. Results

This section presents the results of five key analyses: (1) an evaluation of the synthetic dataset’s effectiveness to confirm K-Means SMOTE as the optimal oversampling method, (2) an assessment of the ET model’s performance with various IRF combinations, (3) an analysis of the confusion matrix to examine classification accuracy across classes, (4) an ablation study to determine the contribution of each model component, and (5) a sensitivity analysis to evaluate the influence of individual features on model predictions.

4.1. Evaluation of Synthetic Data

A series of evaluations were conducted. Firstly, the Kolmogorov–Smirnov (K–S) test was applied to compare the univariate distributions of the synthetic data against those of the original dataset, aiming to assess whether the oversampling methods preserved the statistical properties of the original data. Secondly, the Friedman test was employed on the cross-validation results to determine whether the differences in model performance among various oversampling techniques were statistically significant. Finally, the performance of each model was evaluated on an unseen testing dataset to validate its generalization ability.

4.1.1. Data Distribution Similarity

Table 4 summarizes the K–S test results for the different oversampling methods. The D-statistic measures the maximum difference in univariate distribution between the synthetic and original data. D-values greater than 0.05 indicate a significant distributional shift.
The K–S test results show that all oversampling methods introduce some distributional shifts, though to varying degrees. The dataset obtained with SMOTE demonstrates the closest alignment with the original dataset, affecting four features but with a relatively low maximum D-value of 0.1595, indicating minimal distributional deviation. K-Means SMOTE shows a higher maximum D-value (0.4692) for height, suggesting more pronounced alterations in specific features, yet it affects only three variables overall. This may reflect a targeted modification near decision boundaries rather than a broad data distortion. ADASYN, while also affecting three features, presents a moderate D-value (0.2474) and alters features such as platelet and sodium, which may reflect less controlled synthetic sampling. Overall, SMOTE is best at preserving the original data structure, while K-Means SMOTE introduces more focused changes that could benefit model learning, and ADASYN causes more scattered and potentially noisier shifts.

4.1.2. Model Performance Consistency

For this evaluation, all combined data (original data and four IRFs) processed with the three different oversampling methods (SMOTE, K-Means SMOTE, and ADASYN) were used to construct six different ML models: SVM, KNN, ANN, RF, ET, and GB. The data were split, with 70% for training and 30% for testing, and 10-fold cross-validation was conducted. A summary of the Friedman test’s average ranks across performance metrics for all ML models using different oversampling techniques is shown in Table 5. Lower average ranks indicate better performance, and all differences are statistically significant (p < 0.001).
In Table 5, the Friedman test results show that the SMOTE-augmented dataset is the most compatible with the ET model, achieving the lowest average rank (1.00) across all metrics. ADASYN (1.04) and K-Means SMOTE (1.07) also yielded strong performance. K-Means SMOTE achieves the highest F1 score (1.20), suggesting enhanced sensitivity to the minority class. These findings indicate that SMOTE offers the best overall consistency. At the same time, K-Means SMOTE may provide performance gains in recall and F1 score, making it a valuable alternative when sensitivity to minority class predictions is prioritized.

4.1.3. Generalization Capability

The remaining 30% of unseen data created with the three oversampling methods were used to test all six ML models. The performance metrics of the best model on unseen testing data with the different oversampling techniques are shown in Table 6.
On the unseen testing dataset, the ET model achieved its best generalization performance when trained with K-Means SMOTE, reaching the highest accuracy (95.26%) and F1 score (94.47%) among all datasets. While SMOTE and ADASYN also improved predictive outcomes, K-Means SMOTE’s cluster-driven oversampling likely enhanced class boundary learning, resulting in superior performance on unseen data. This confirms its effectiveness as the most suitable oversampling method for optimizing ET in real-world applications.

4.1.4. Optimal Oversampling Method

Considering the results of the K–S test, Friedman rankings, and performance on unseen testing data, K-Means SMOTE emerges as the optimal oversampling method for this study. While SMOTE demonstrated the closest distributional similarity to the original data (lowest D-values in the K–S test) and achieved the best average ranking in cross-validation (Friedman test), K-Means SMOTE provided the highest generalization performance on unseen data, with the best accuracy (95.26%) and F1 score (94.47%). The results confirm that the clustering-based targeted approach creates more informative synthetic samples close to decision boundaries, enhancing class representation without adding too much noise. K-Means SMOTE provides the most efficient trade-off between improving model discriminability and maintaining distributional integrity, making it the best option for this study. The K-Means SMOTE method was therefore selected for further investigation into the effects of IRFs, aiming to achieve optimal model performance.

4.2. Evaluation of Effective Classification Model

Following the identification of K-Means SMOTE as the most effective oversampling method in this study, an additional investigation was conducted to determine the optimal combination of model and dataset. Specifically, this analysis aimed to evaluate which input feature set—comprising either four or eight IRFs—yields the best performance across various machine learning models.

4.2.1. Descriptive Summary of 10-Fold Cross-Validation Results

Table 7, Table 8 and Table 9 show a descriptive representation of the 10-fold cross-validation of all ML models using the original dataset, the original with four IRFs and K-Means SMOTE, and the original with eight IRFs and K-Means SMOTE, respectively.
The comparison of model performance based on the results in the three tables reveals that incorporating additional IRFs (Imbalance Ratio Handling) with K-Means SMOTE generally improves classification metrics, with the four-IRF (Table 8) and eight-IRF datasets (Table 9) both outperforming the original dataset (Table 7). Tree-based models (GB, RF, ET) performed well initially but saw marginal gains in the F1 score and AUC (e.g., F1 of RF improved from 0.94 to 0.96). However, the most notable improvements were in weaker models, such as SVM (F1 rose from 0.40 to 0.75) and ANN (F1 increased from 0.53 to 0.75 with eight IRFs), suggesting that IRFs enhance the robustness of less stable algorithms. While four and eight IRFs yielded similar results for most models, eight IRFs provided slight advantages for KNN (F1: 0.91 vs. 0.90) and ANN (F1: 0.75 vs. 0.64), indicating that higher IRF counts may further stabilize performance, particularly for non-tree models. For ensemble learning models, four IRFs are sufficient, as these models achieve near-peak performance without unnecessary feature expansion.

4.2.2. Model Performance Based on Accuracy

The testing results on unseen data in terms of accuracy are shown in Table 10.
Table 10 displays the classification performance of each model in terms of accuracy. The results show that the combined dataset (applying K-Means SMOTE and adding IRFs) raises the accuracy of all models compared to the original dataset. The employment of K-Means SMOTE alone leads to a clear boost in accuracy across all models, proving the value of extra pertinent features. Most models continue to show minor increases as more features (four IRFs and eight IRFs) are added. GB, ET, and RF benefit the most and achieve their best accuracy at eight IRFs. Being ensemble-based models, ET and RF show the highest accuracy gains, implying that they make the best use of the recently acquired characteristics to improve classification. Conversely, SVM, KNN, and ANN experience only modest gains after K-Means SMOTE is applied, suggesting that these models might not completely use the extra information after a given point. K-Means SMOTE and IRFs generally improve accuracy, with ensemble models benefitting the most; other models see declining returns as more features are included.

4.2.3. Model Performance Based on Precision

The testing results on unseen data in terms of precision are shown in Table 11.
Table 11 displays the classification performance of each model in terms of precision. The effect of the combined dataset on precision depends on the model; some gain from the extra characteristics, while others see minor declines or swings. As more features are introduced, KNN and ANN exhibit a continuous rise in accuracy, implying that these models can efficiently use the additional information to raise classification performance. With K-Means SMOTE and four IRFs, ET also shows an initial increase in precision; then, with K-Means SMOTE and eight IRFs, ET shows a slight decline, suggesting that adding too many features may generate noise rather than improve precision. Conversely, SVM, GB, and RF show modest decreases in precision following the inclusion of K-Means SMOTE and extra IRFs, implying that, for these models, the added features may somewhat raise the number of false positives, hence generating a minor drop in precision.

4.2.4. Model Performance Based on Recall

The testing results on unseen data in terms of recall are shown in Table 12.
Table 12 displays the classification performance of each model in terms of recall. The effects of the combined dataset on recall vary among the different models; some see a drop, while others remain relatively steady. After the inclusion of K-Means SMOTE, SVM, GB, ET, RF, and KNN all exhibit a drop in recall; a further decrease in recall as IRFs are added indicates that these models may suffer from overfitting or noise generated by the extra features, hence producing false negatives. Originally having high recall, ET and RF show the biggest decreases when K-Means SMOTE is applied and IRFs are added. This result suggests that feature expansion somewhat reduces their capacity to correctly identify positive events. In particular, KNN shows a consistent decline, probably because of its sensitivity to feature dimensionality. Conversely, the ANN’s performance remains relatively constant and shows just slight variations, implying that neural networks might be more resistant to feature expansion in terms of recall. For most models, the combined dataset reduces recall overall; this suggests that even if extra features increase other measures, such as accuracy or precision, they can also add complexity that makes it more difficult for models to adequately identify positive samples.

4.2.5. Model Performance Based on F1 Score

The testing results on unseen data in terms of F1 score are shown in Table 13.
Table 13 displays the classification performance of each model in terms of F1 score. The combined dataset affects the F1 score differently depending on the model; most only cause modest changes or slight reductions. After the addition of IRFs and the application of K-Means SMOTE, SVM, GB, ET, RF, and KNN all show a drop in F1 score, indicating that the trade-off between precision and recall is somewhat skewed, most likely due to a loss in recall. KNN and RF show the greatest declines, which implies that these models may struggle with additional features due to either overfitting or more false negatives. ET maintains a quite constant F1 score, implying that its performance remains strong after feature expansion. GB exhibits a minor decline but somewhat recovers with the combined dataset using K-Means SMOTE and eight IRFs. With just minor variations, the performance of the ANN remains almost constant, which shows that neural networks can better manage the extra features than other models. Although some models adapt better than others, the overall combined dataset somewhat reduces the F1 score. This implies that, although feature development can improve accuracy and precision, it does not always improve the balance between precision and recall, which is absolutely essential for a high F1 score.

4.2.6. Model Performance Based on Average AUC-ROC

The testing results on unseen data in terms of accuracy are shown in Table 14.
Table 14 displays the classification performance of each model in terms of AUC-ROC. With most models demonstrating an improvement over the original dataset, the AUC-ROC values suggest that, generally, adding IRFs and applying K-Means SMOTE to the original dataset improves the models’ capacity to differentiate between classes. Adding K-Means SMOTE causes SVM, GB, ET, RF, and ANN to show a notable rise in AUC-ROC, showing improved separability between classes. Being ensemble-based models, ET and RF have the best AUC-ROC values; they peak at around 99.5%, implying that these models make good use of the extra features to increase discrimination. With the original dataset with K-Means SMOTE and eight IRFs, however, modest variations or oscillations are noted, especially in ET and RF, which suggests that adding too many characteristics generates noise rather than helpful information. Although KNN improves with K-Means SMOTE, its performance may be sensitive to high-dimensional data since it shows a slight decrease after four IRFs. Conversely, the ANN’s performance is always high, proving its capacity to efficiently use the additional features. Though adding too many features may cause declining returns for some models, overall, K-Means SMOTE and IRFs improve the AUC-ROC by increasing the discriminating power of most models.

4.2.7. ROC Curve Comparison

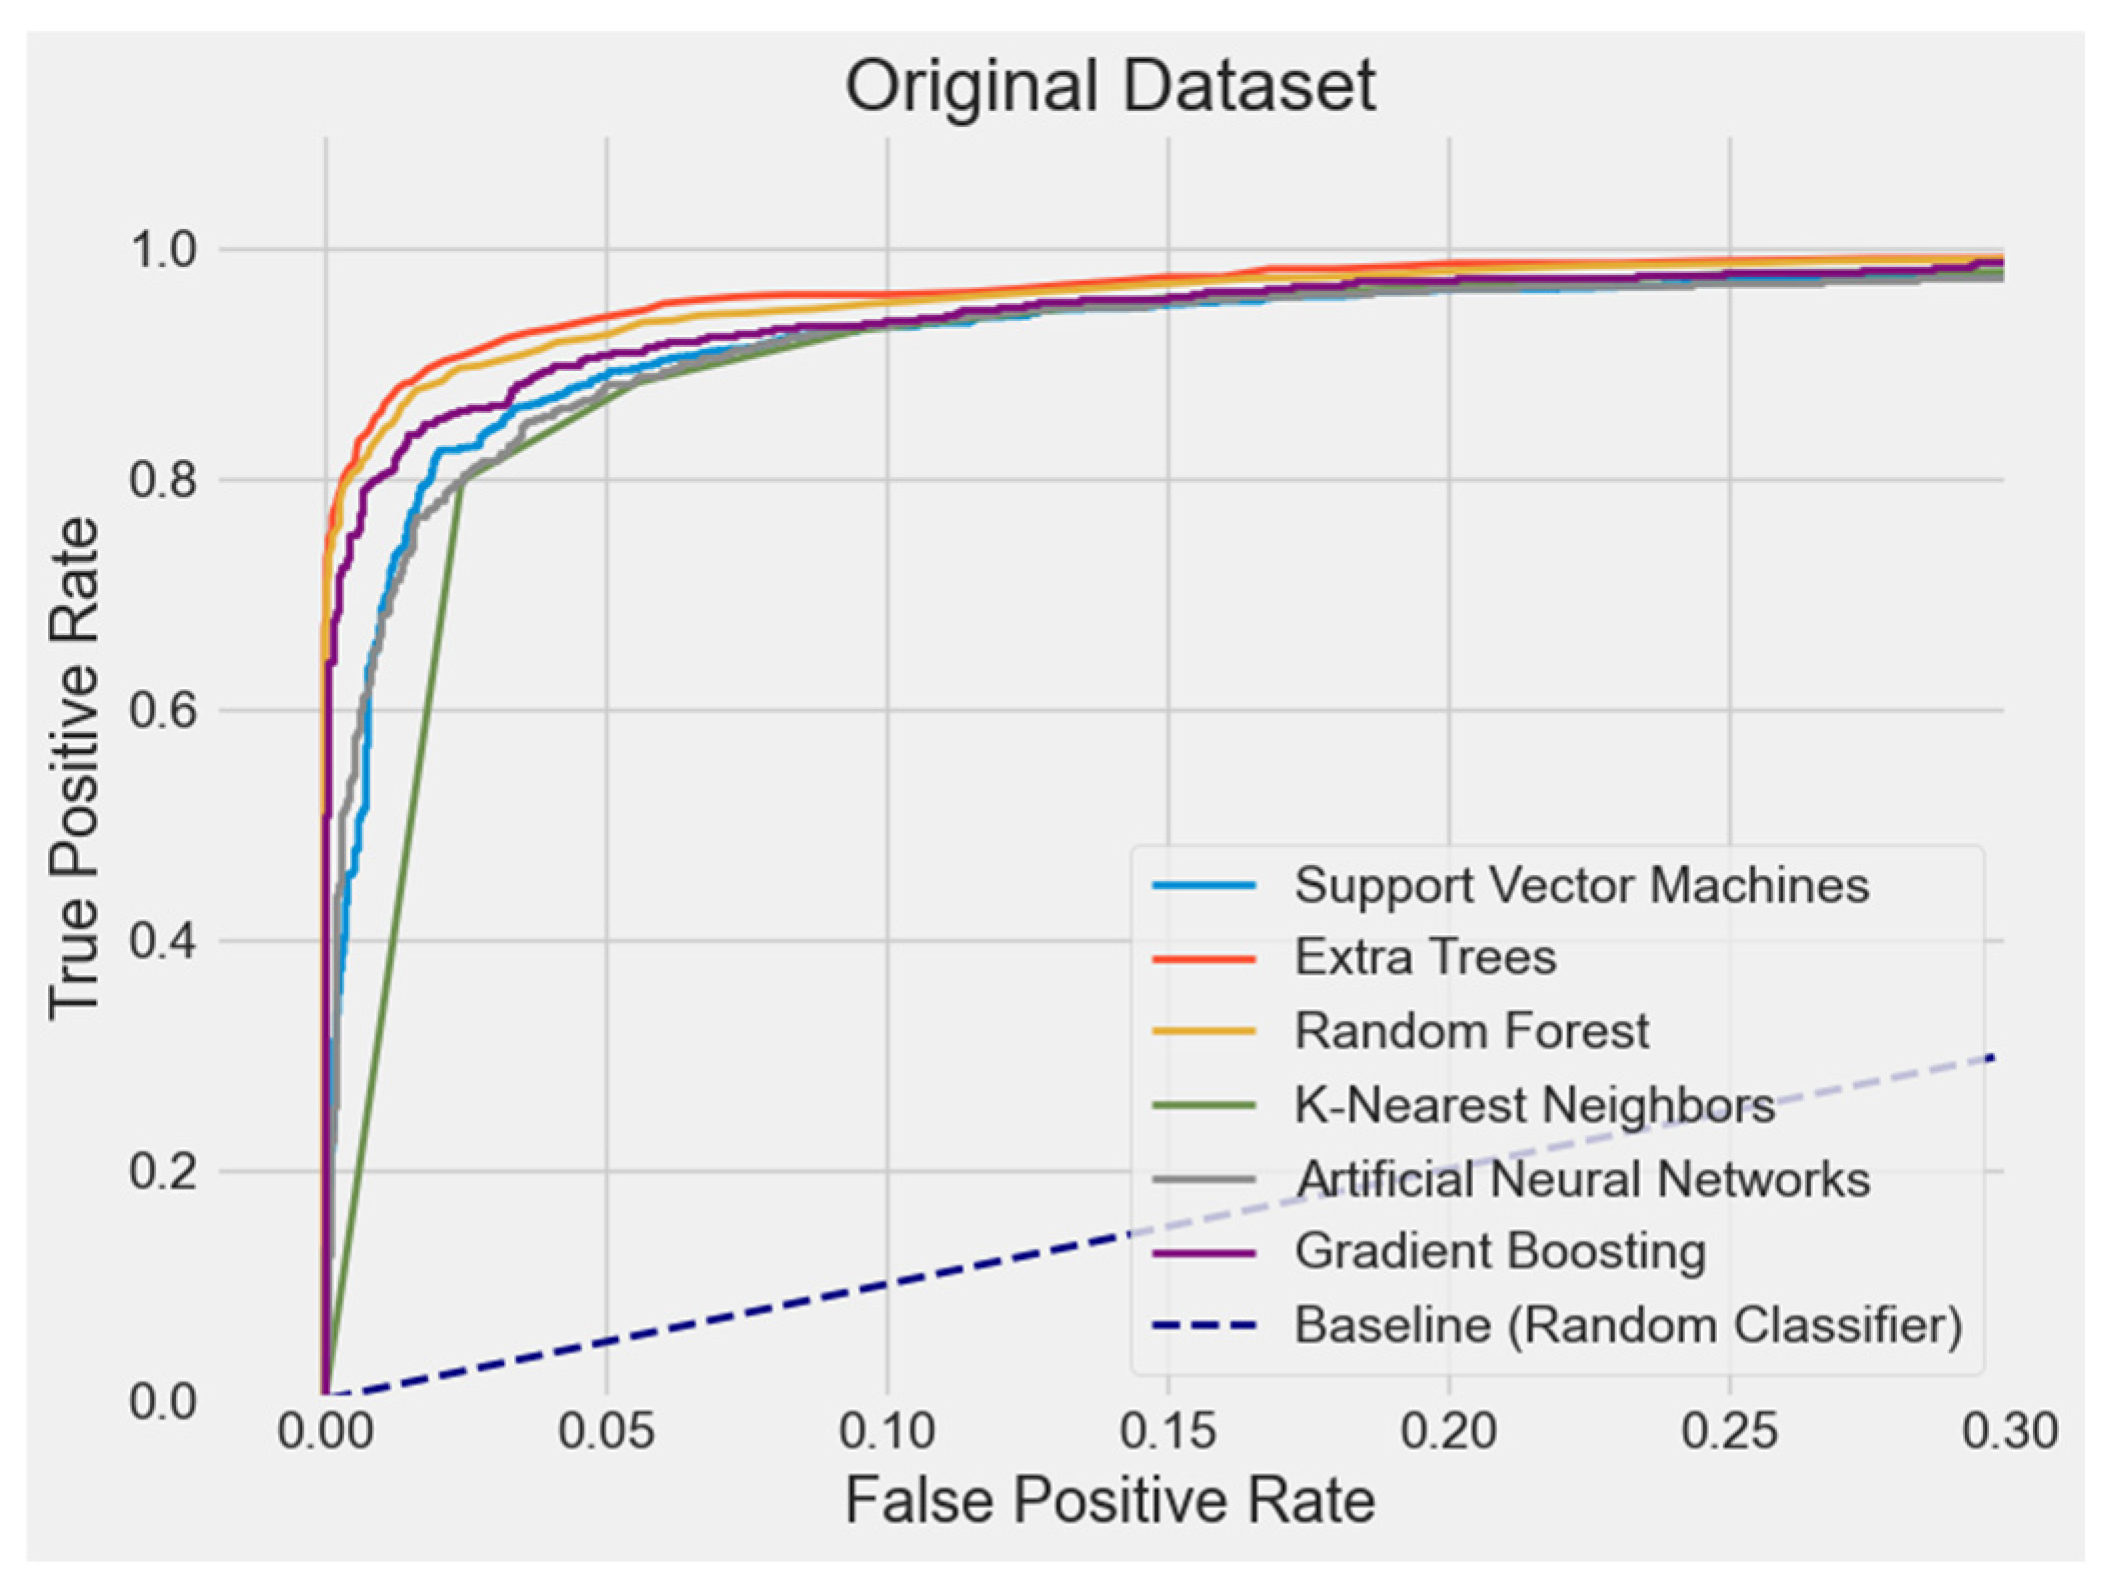
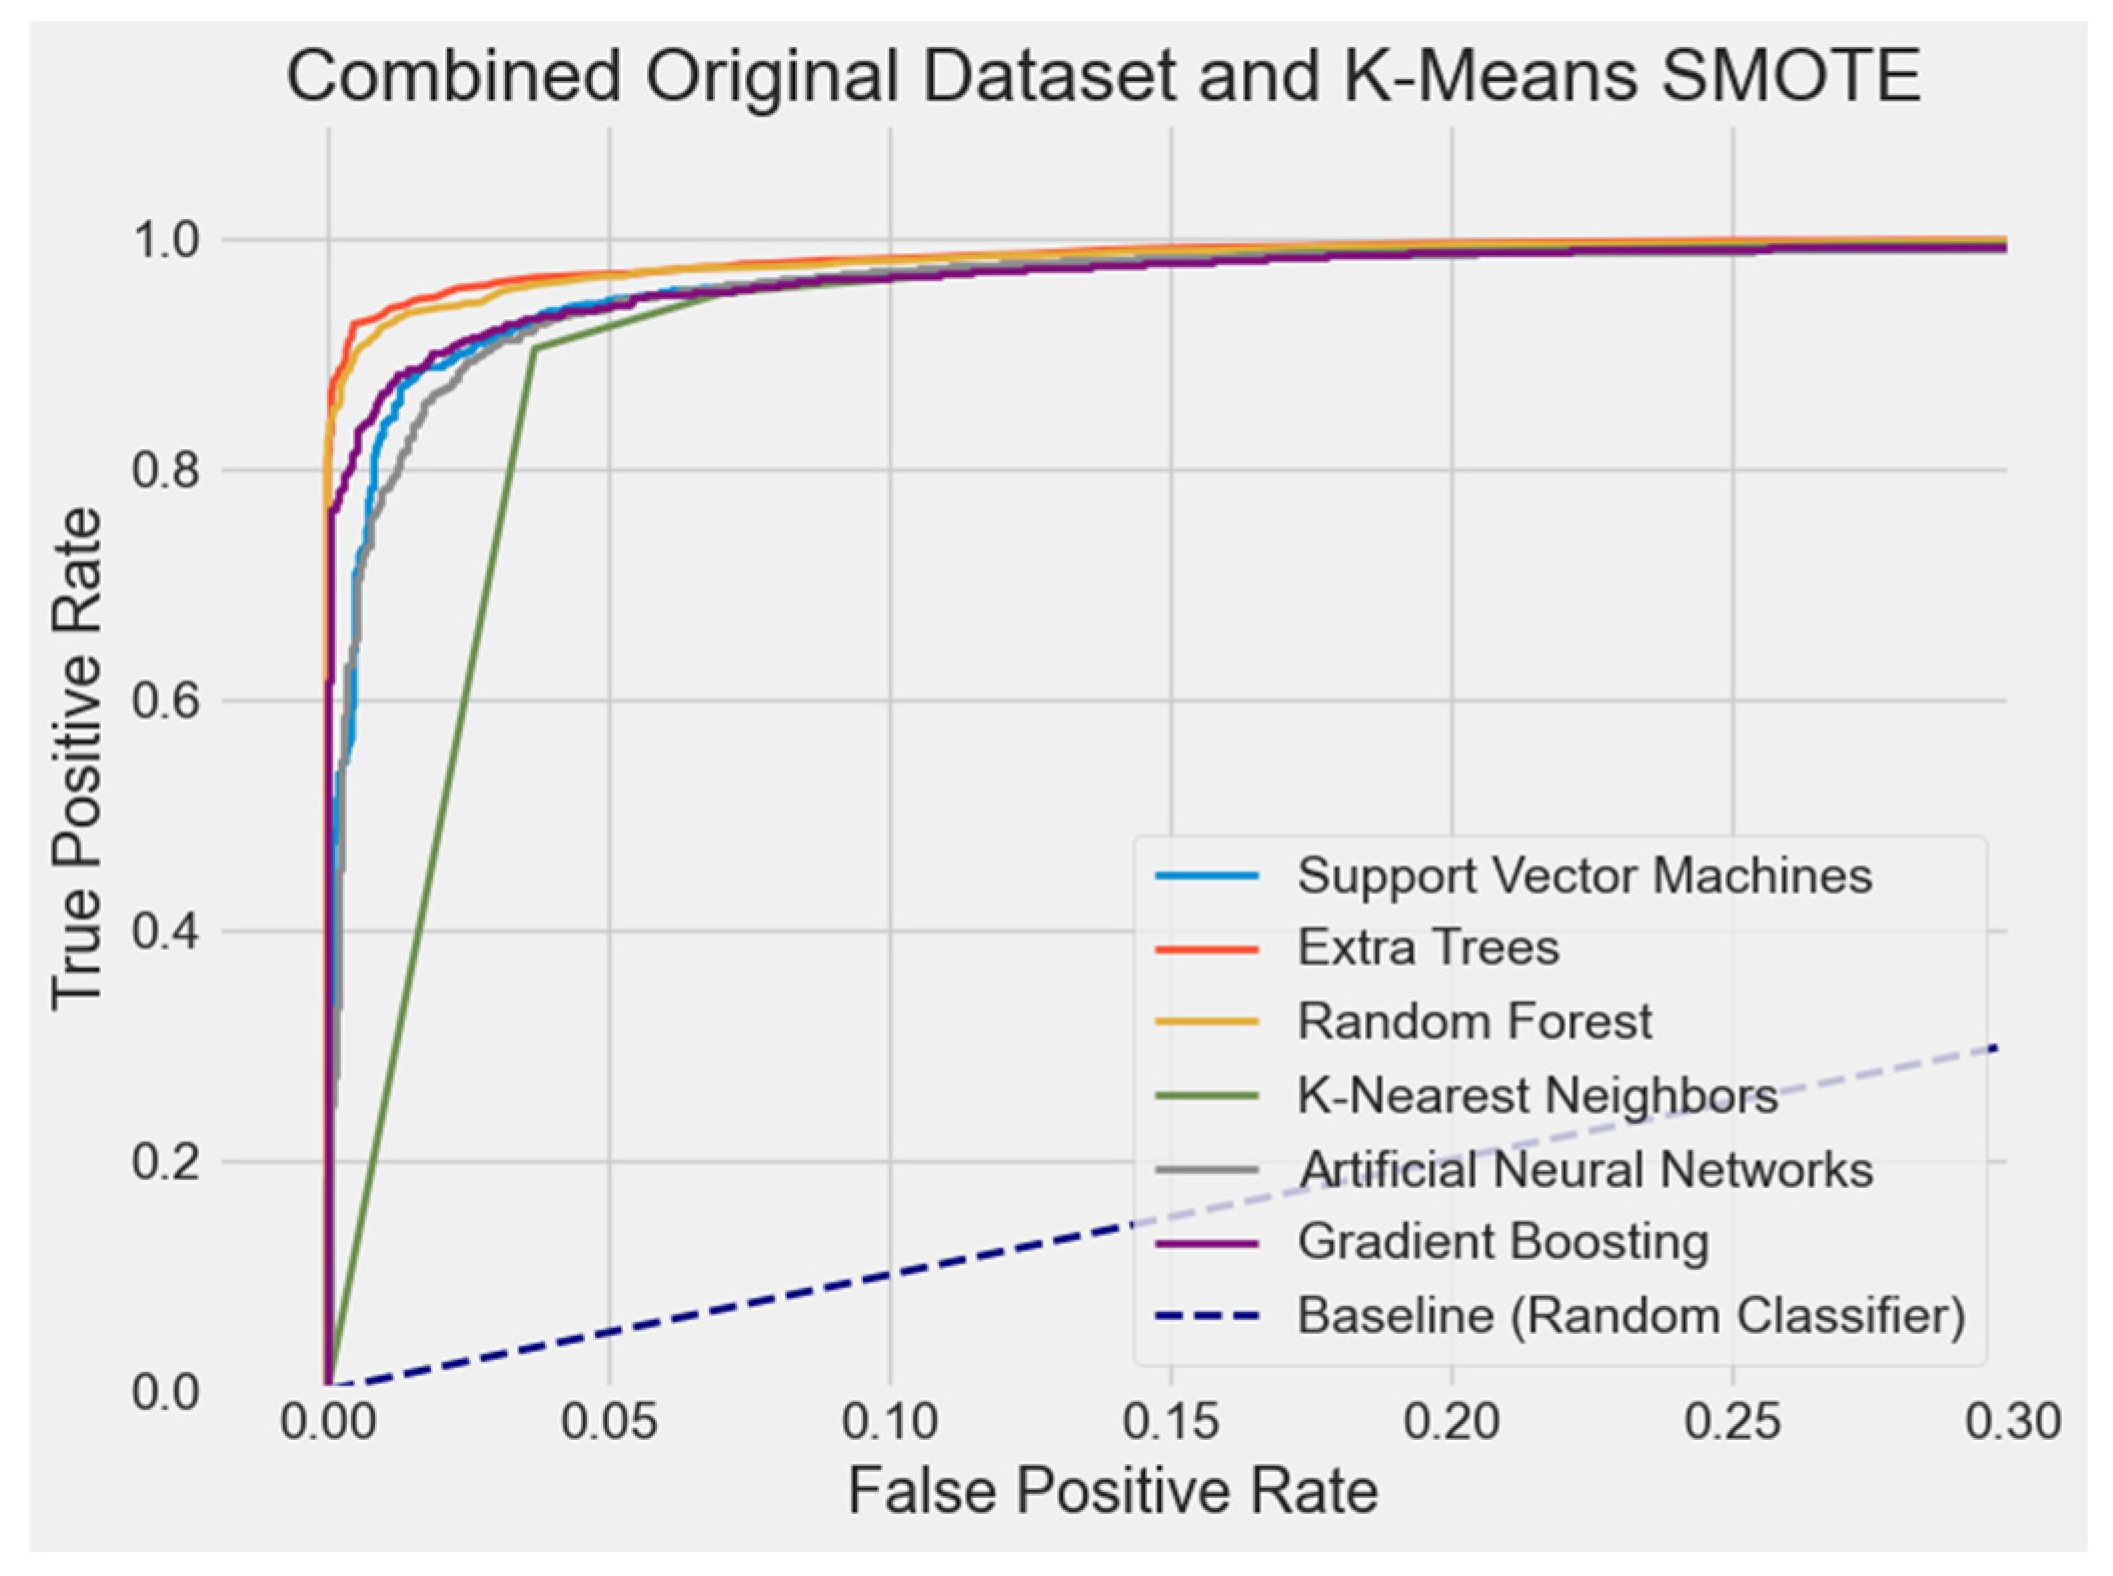
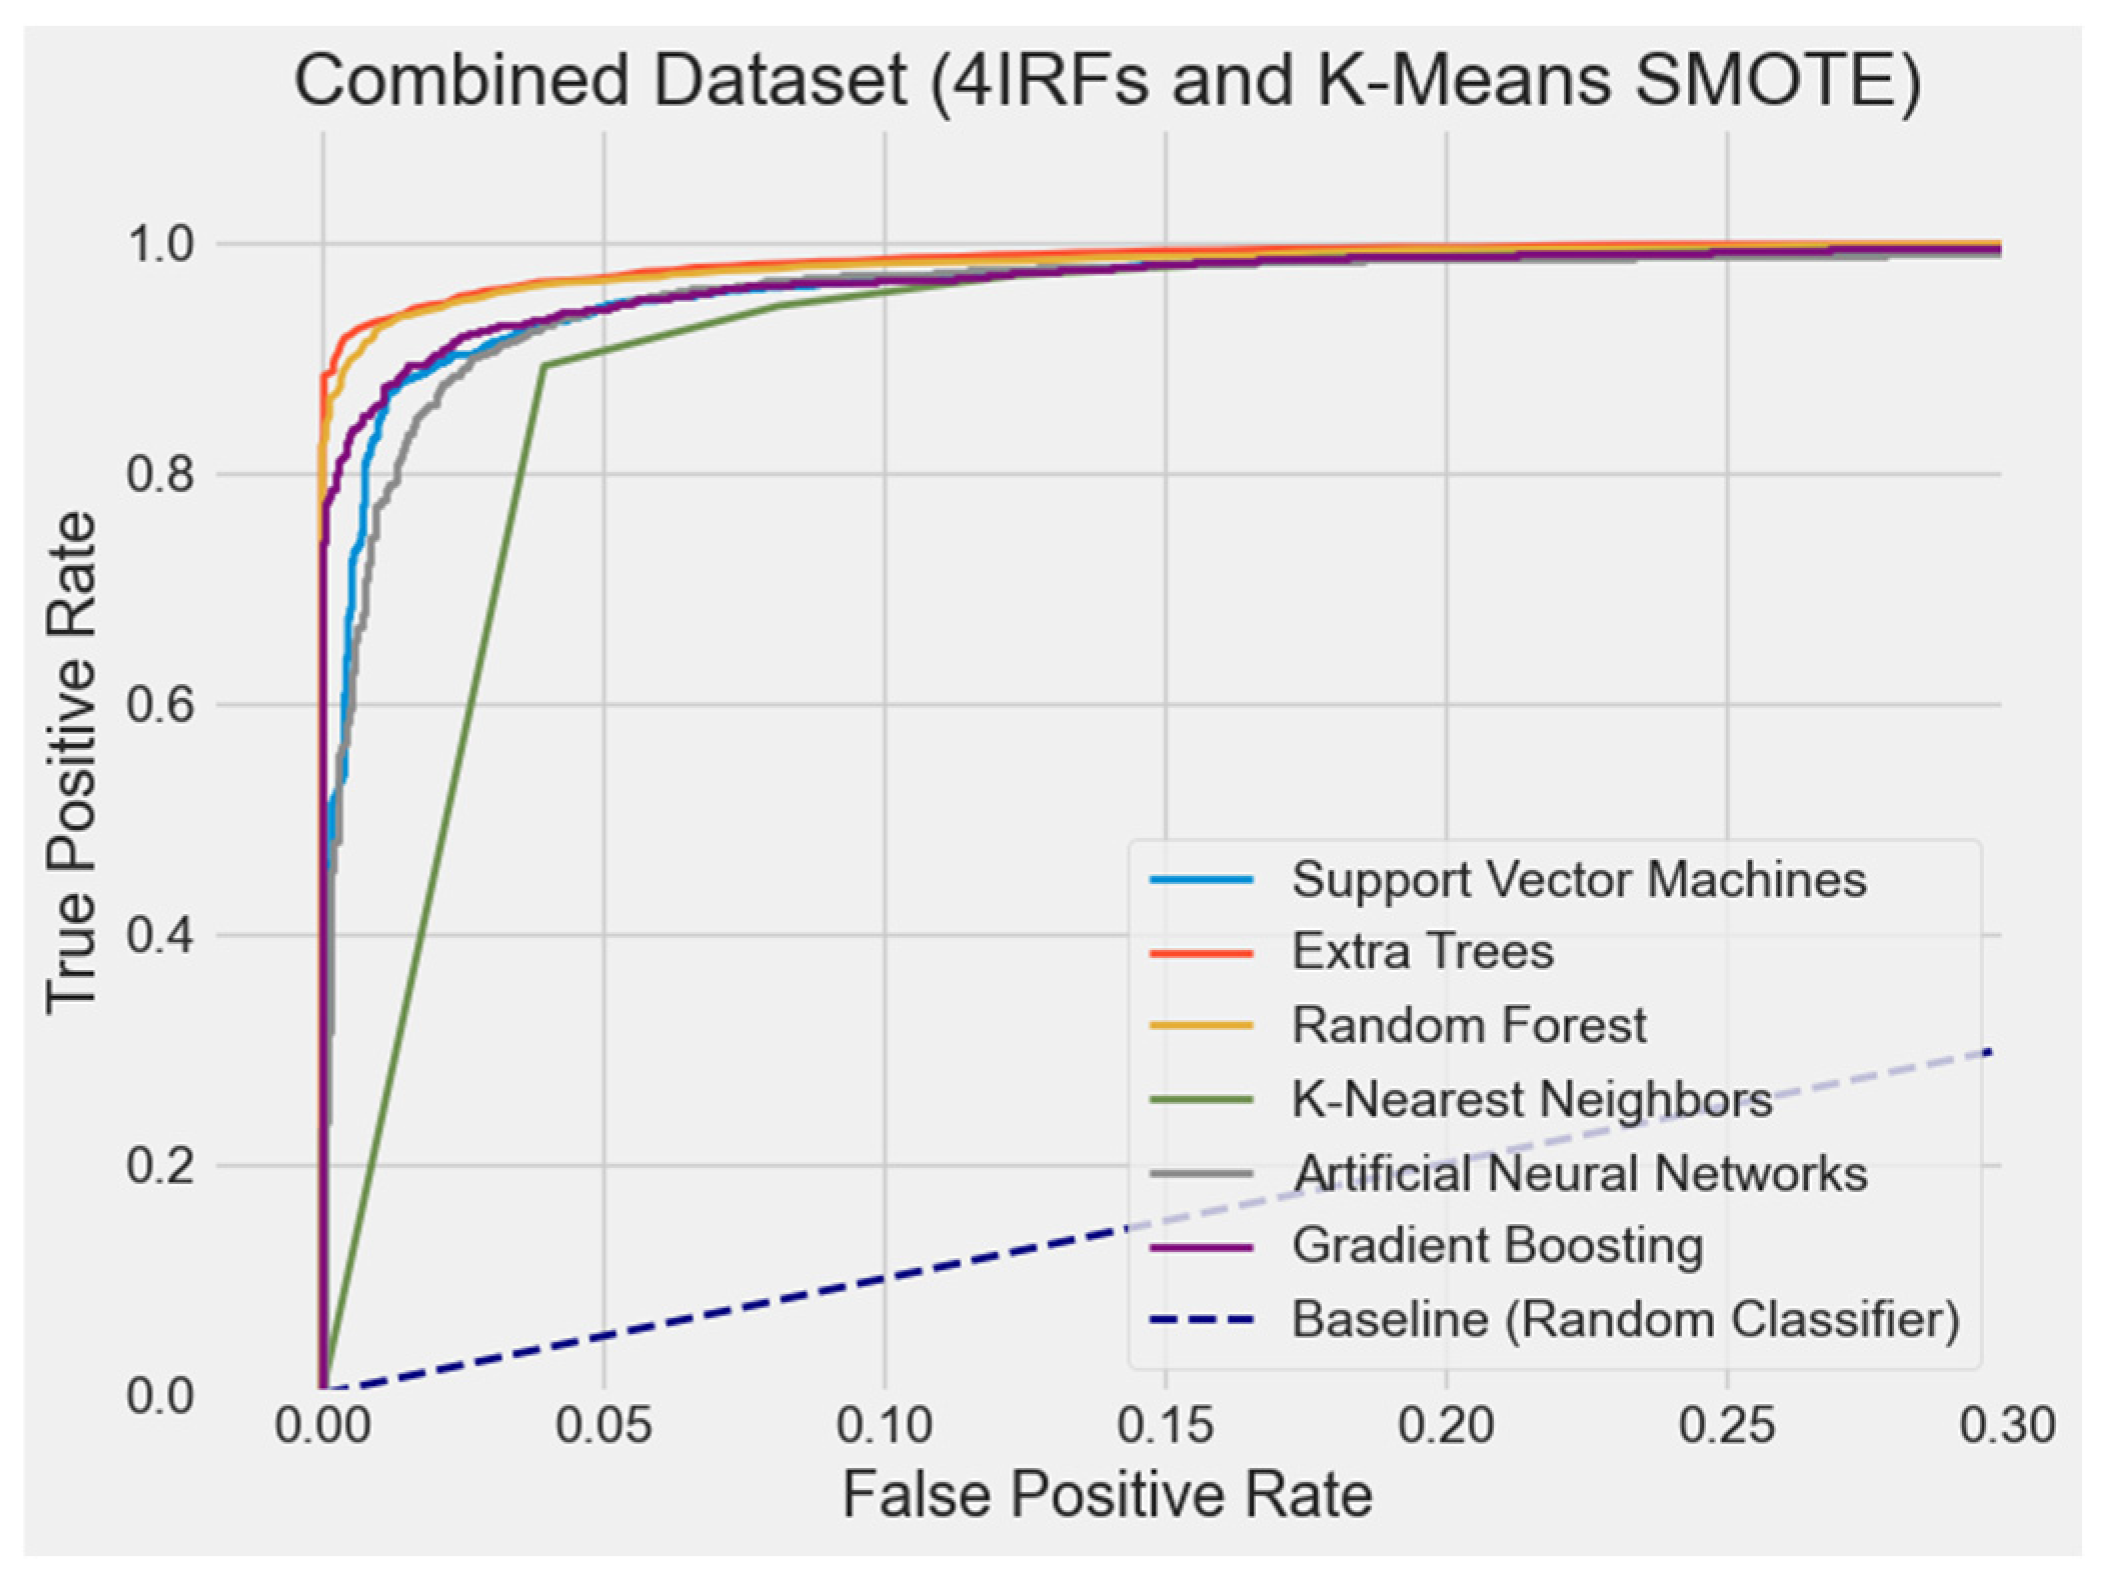
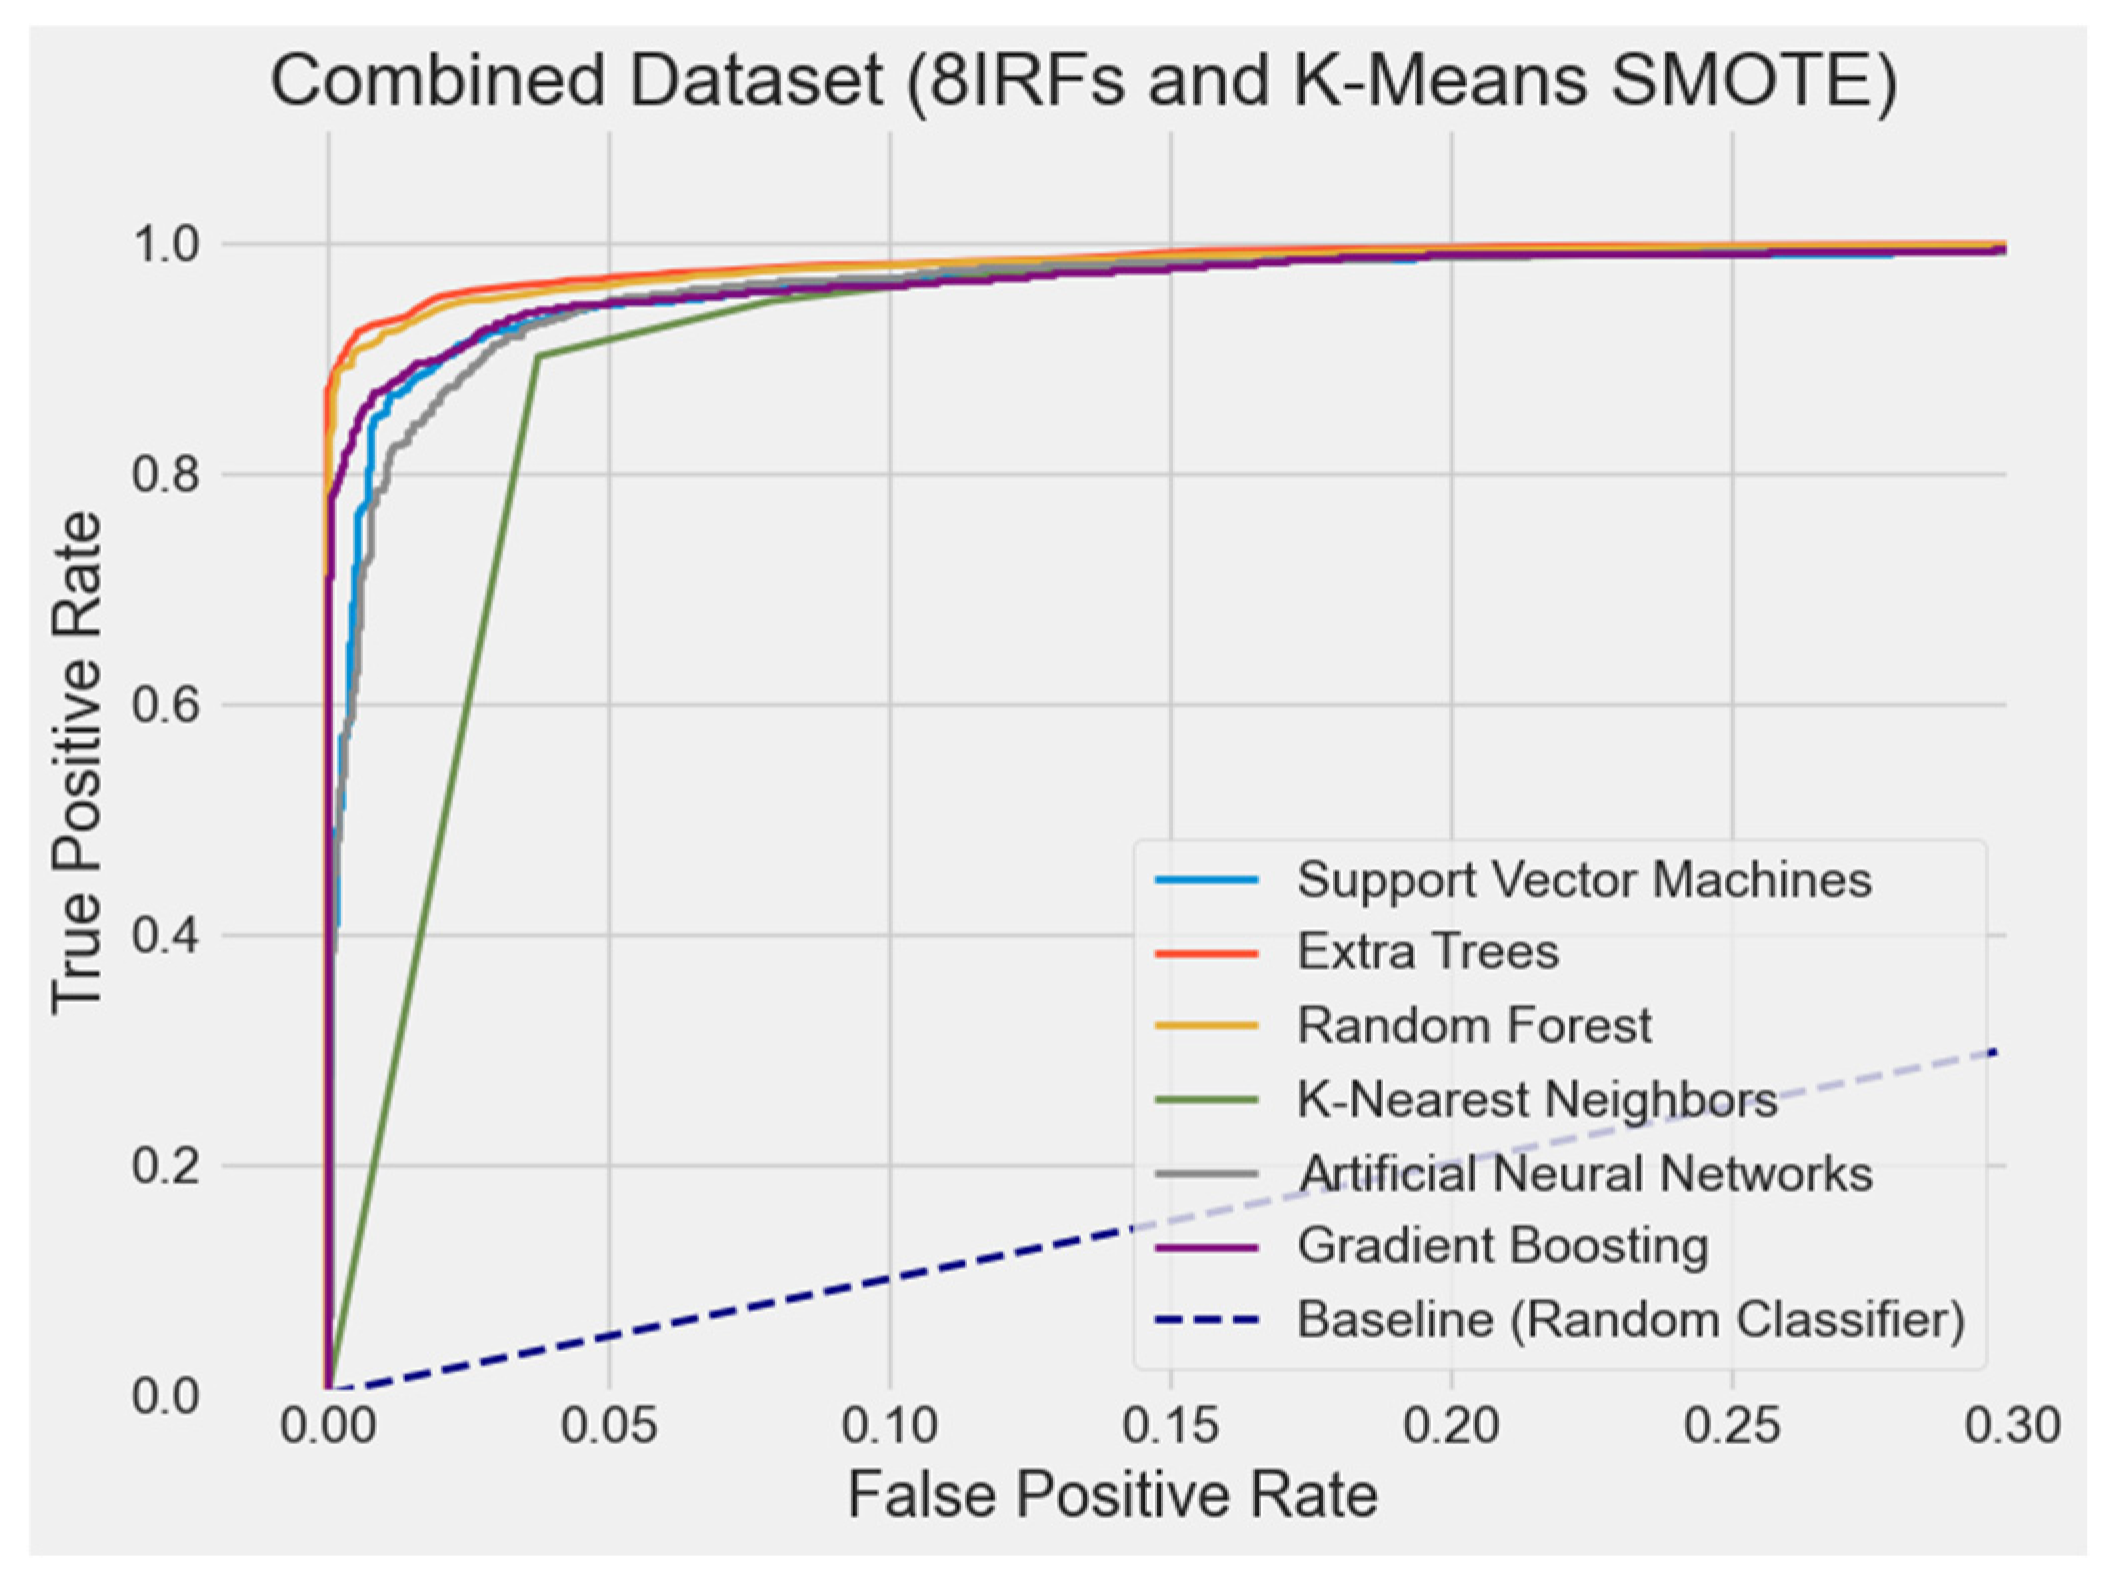
Figure 7, Figure 8, Figure 9 and Figure 10 show the ROC curves of all models applied to the four different datasets: the original dataset, the dataset with K-Means SMOTE, the dataset with four IRFs and K-Means SMOTE, and the dataset with eight IRFs and K-Means SMOTE. The dotted diagonal line represents the baseline performance of a random classifier. Models with curves closer to the top-left corner indicate better discrimination ability.
The ROC curve analysis for the original dataset and those augmented with four and eight IRFs combined with K-Means SMOTE demonstrates a clear performance improvement from oversampling and feature augmentation. Ensemble models, particularly ET, consistently show superior sensitivity and specificity compared to those performances from the original dataset and the original dataset applying K-Means SMOTE, as shown in Figure 7 and Figure 8, respectively. Figure 9 demonstrates that ET and RF achieve the highest performance among the evaluated models. The dataset with four IRFs and K-Means SMOTE provides more balanced improvement, significantly boosting the performance of non-ensemble models such as SVM and ANN. This evidence indicates strong sensitivity and specificity, from four IRFs. The result highlights the effectiveness of combining minimal yet informative IRFs with K-Means SMOTE. Simultaneously, Figure 10 reveals more performance enhancement when the number of IRFs expands to eight. Ensemble model ROC curves—especially ET, GB, and RF—get steeper and show higher true positive rates. The results emphasize that the dataset with eight IRFs and K-Means SMOTE provides a richer, domain-informed feature collection that improves model discrimination. Although the eight IRFs configuration offers slightly higher performance, the marginal gain suggests diminishing returns, indicating that four IRFs provide an optimal trade-off between model complexity and effectiveness. Combining four IRFs with K-Means SMOTE yields the most effective enhancement in class separability and generalization performance.

4.3. Confusion Matrix

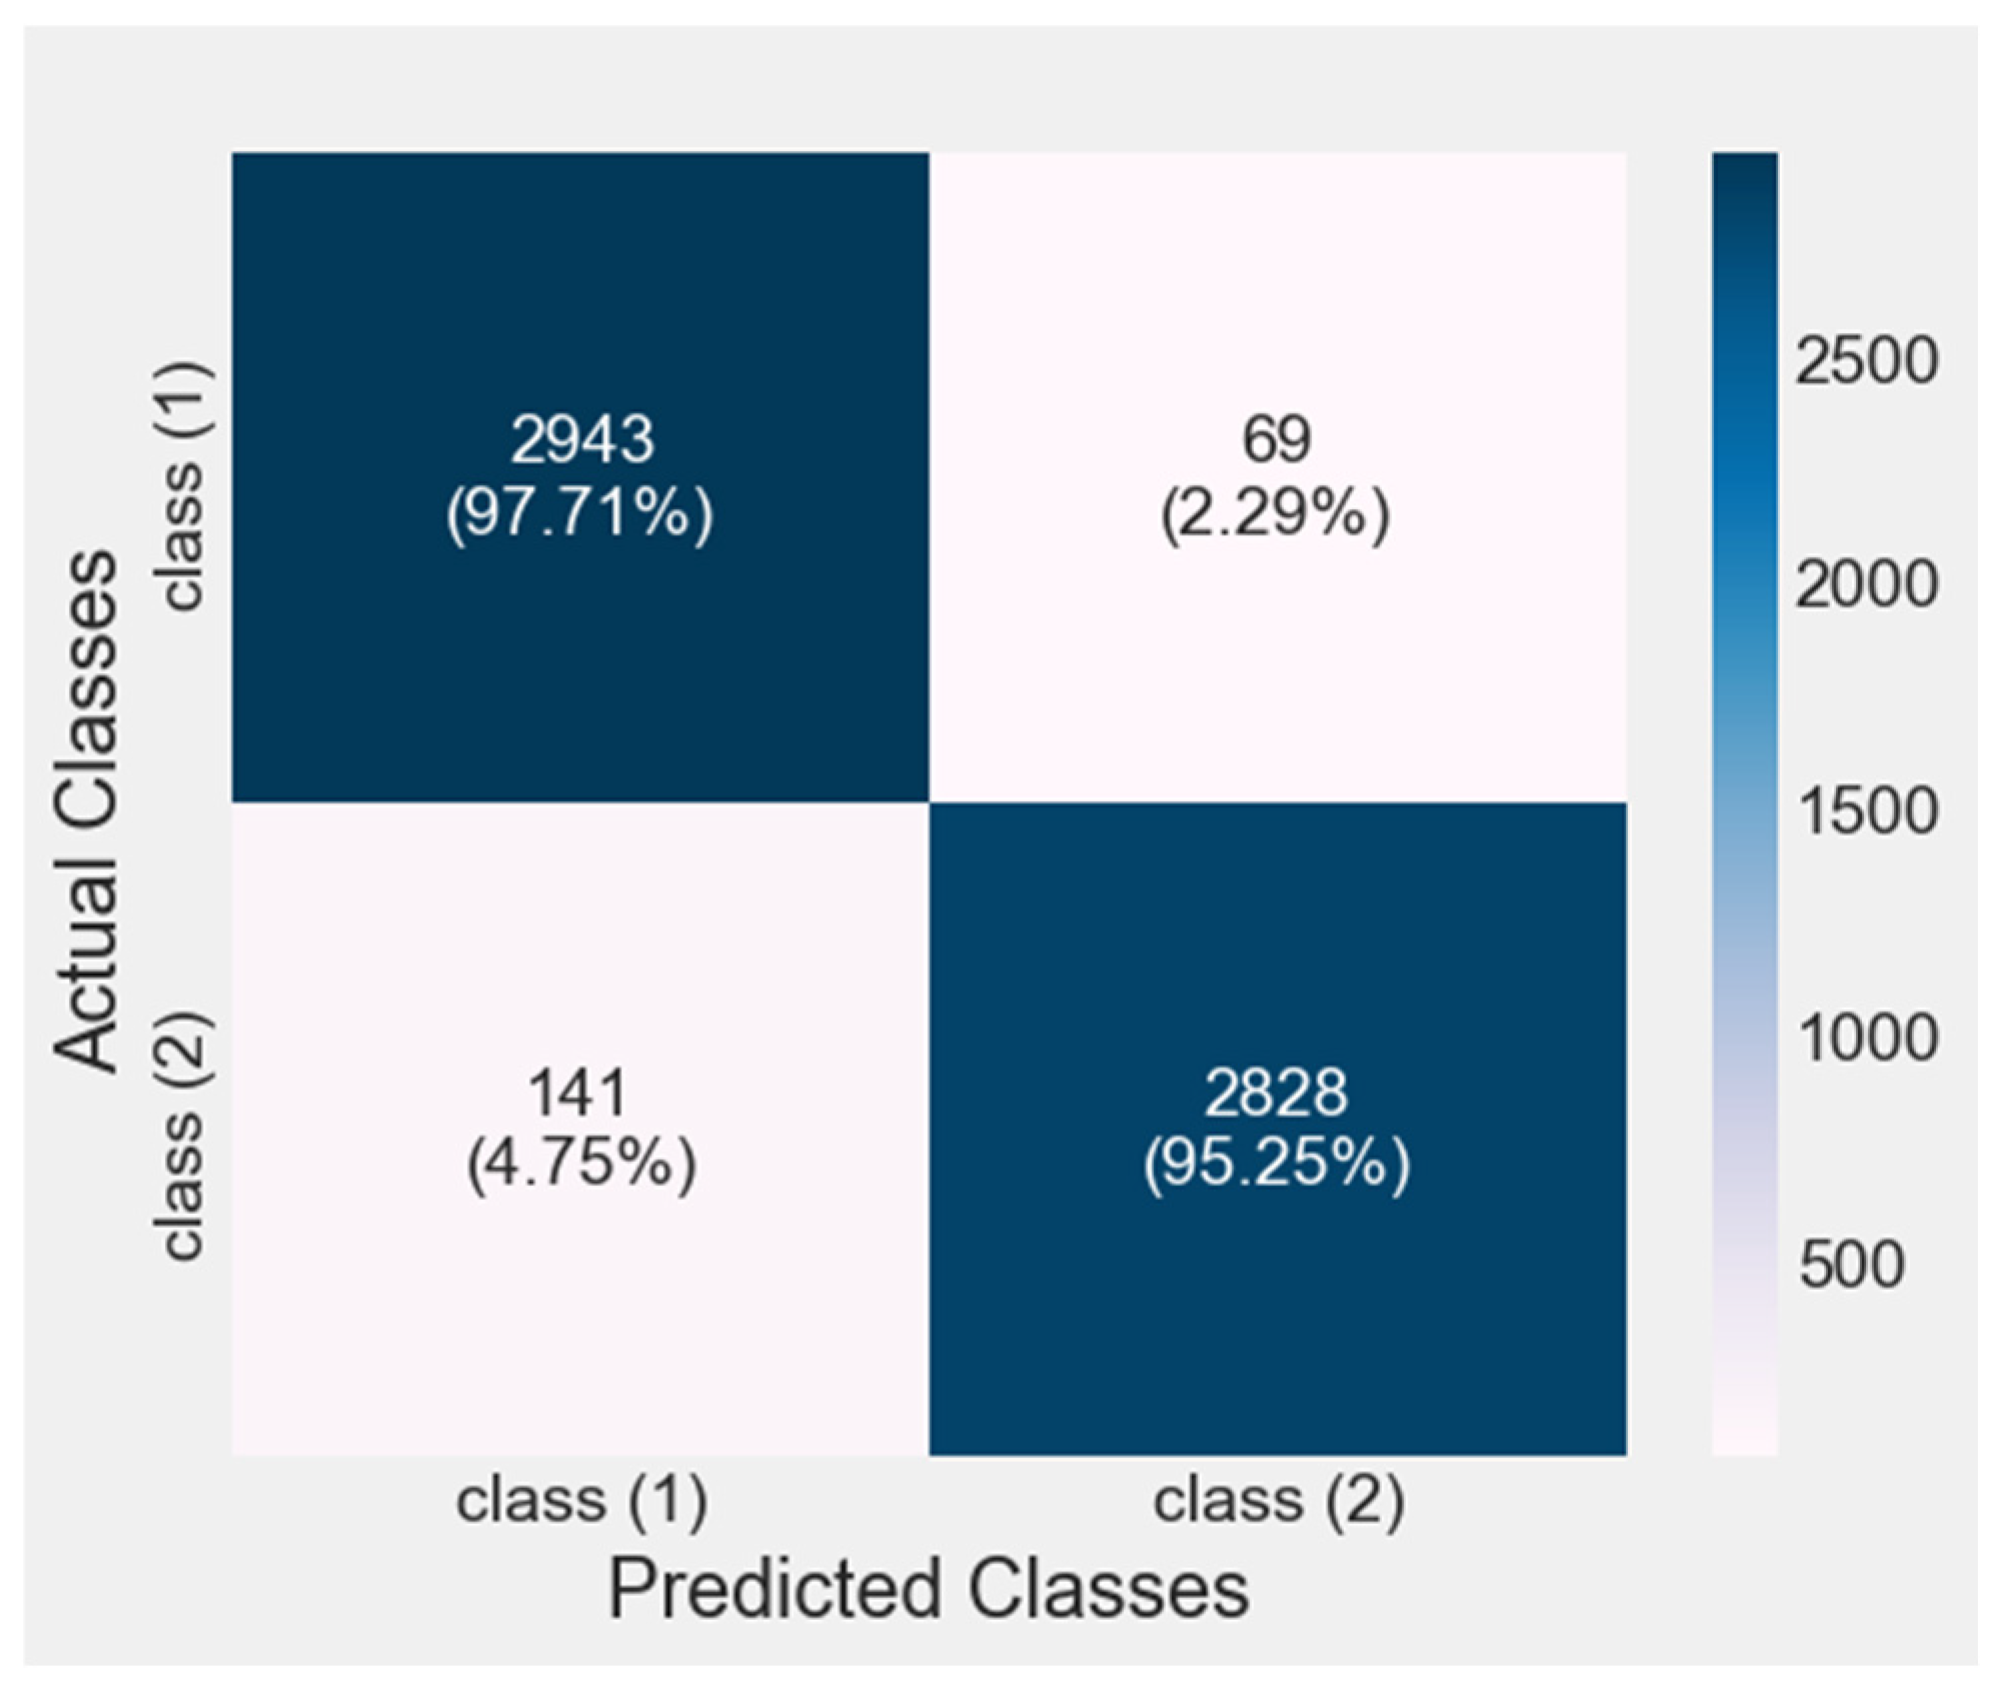
Since the ET model with four IRFs and K-Means SMOTE was the best model in this study, its confusion matrix is shown in Figure 11.
Figure 11 shows that the ET model with four IRFs and K-Means SMOTE accurately classified 97.91% of class 1 and 95.15% of class 2, demonstrating strong sensitivity and specificity. The low false positive and false negative rates confirm the model’s effectiveness in handling class imbalance while maintaining high discriminative power, supporting its reliability for real-world applications.

4.4. Ablation Study

An ablation study was conducted to assess the contributions of inter-relation-based features (IRFs), K-Means SMOTE, and the ET model, and the results are shown in Table 15.
The ablation study confirms that the full model—combining IRFs, K-Means SMOTE, and ET—achieves the best performance (accuracy: 96.47%; AUC: 99.51%). Removing IRFs led to only a slight drop, indicating a modest but supportive role, while excluding K-Means SMOTE caused a more notable decline in accuracy and AUC, highlighting its critical contribution to generalization. Even without both IRFs and SMOTE, the model maintained a high F1 score but showed reduced discriminability. Replacing ET with RF (the second-best model) slightly decreased all metrics, reaffirming ET as the most robust classifier in this setting. This ablation confirms that while each component contributes to overall performance, K-Means SMOTE and the ET classifier are the most influential, and the addition of IRFs provides incremental improvement. The full configuration—with IRFs, K-Means SMOTE, and Extra Trees—is validated as the optimal choice for this study.

4.5. Sensitivity Analysis

In this study, mean absolute feature importance scores, derived from impurity reduction in the ET model, were used as a form of global sensitivity analysis to quantify the average influence of each feature in the dataset. In parallel, SHapley Additive exPlanations (SHAP) values were applied to provide both global and local interpretability, enabling the assessment of each feature’s impact on individual predictions and supporting the evaluation of feature relevance, consistency, and model stability.

4.5.1. Mean Absolute Feature Importance Scores

Mean absolute feature importance scores represent a global measure of feature influence on tree-based models, indicating how frequently and effectively a feature contributes to decision splits. Figure 12 shows the mean absolute feature importance scores of the proposed ET model.
Figure 12 shows that while neutrophil, lymphocyte, and WBC are the most influential features, the four IRFs (ABP, NLR, Cholesterol–HDL Ratio, and Triglyceride–HDL Ratio) are also of moderate importance—particularly the Cholesterol–HDL Ratio (0.0458). These findings suggest that the IRFs provide meaningful supplementary value, enhancing the model’s predictive capacity alongside key raw biomarkers.

4.5.2. Mean SHAP Value

At the same time, SHAP values were used for local and global sensitivity analyses in this study. SHAP provides a model-agnostic, consistent, and interpretable sensitivity analysis based on game theory.
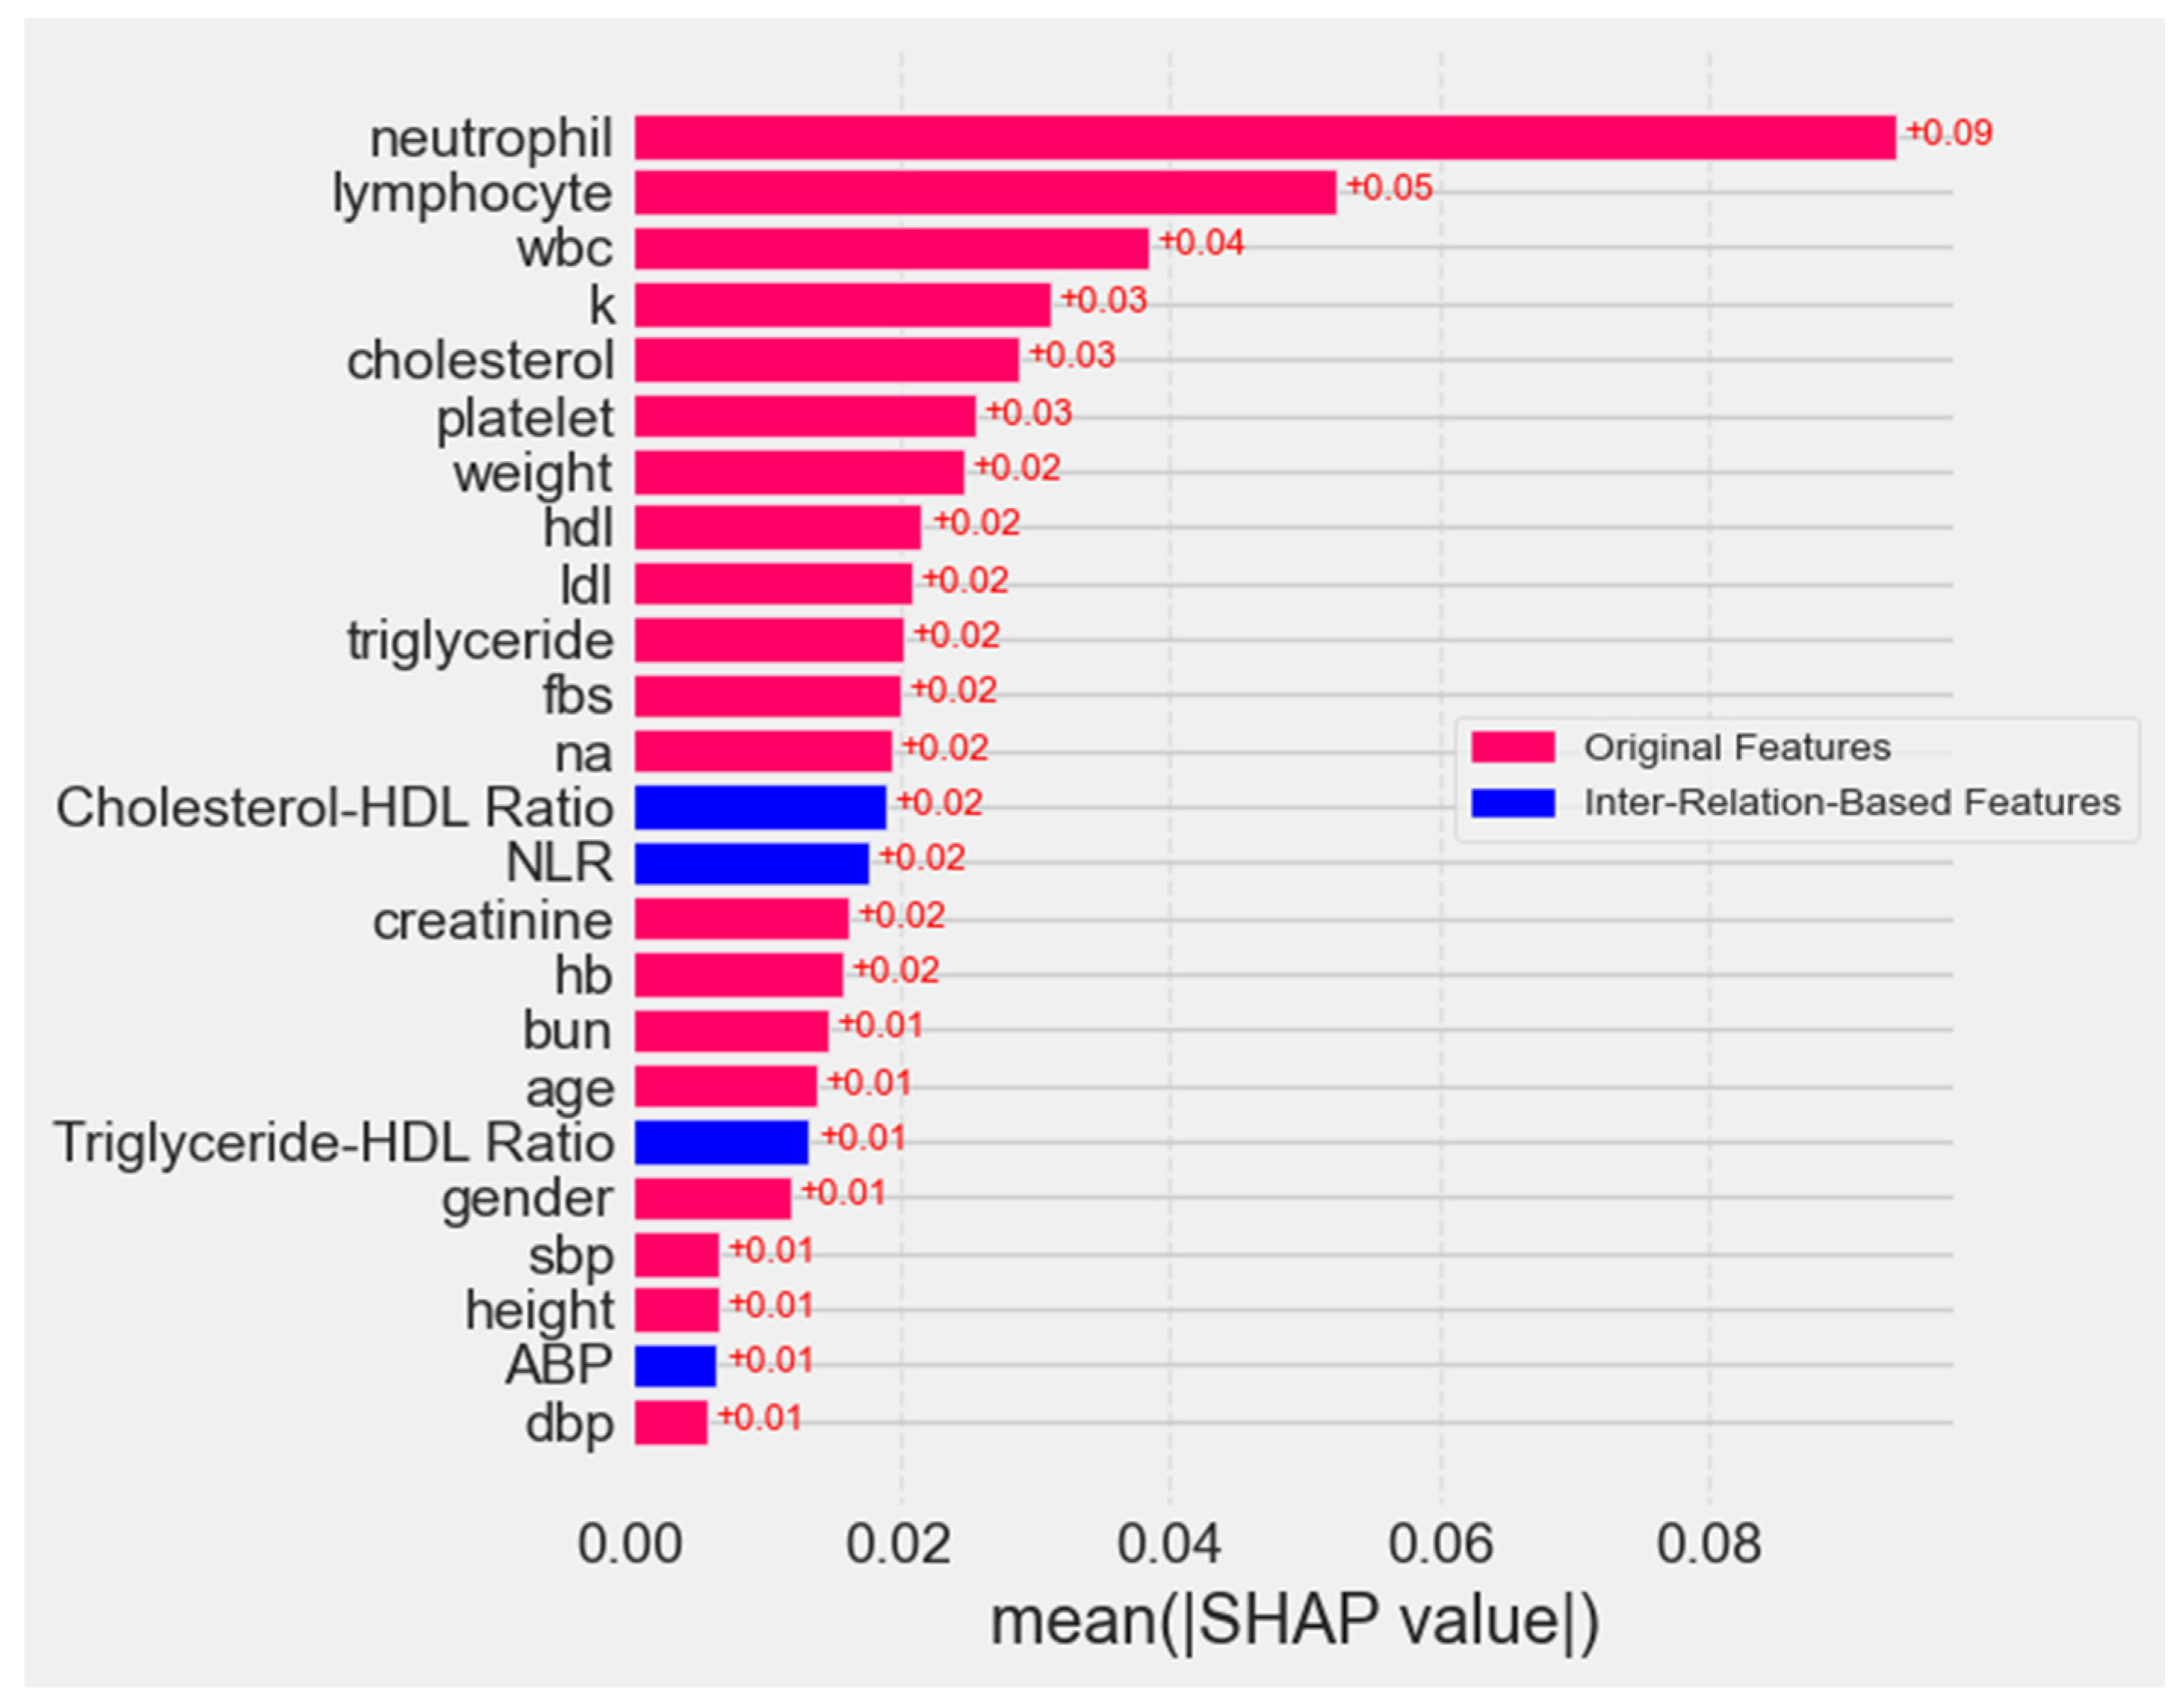
Figure 13 shows that while raw biomarkers such as neutrophil and lymphocyte predominantly influence predictive power, the four IRFs (NLR, Cholesterol–HDL Ratio, Triglyceride–HDL Ratio, and ABP) also contribute meaningfully to the model’s sensitivity, with SHAP values ranging from +0.01 to +0.02. Despite their modest individual impact, these features enhance clinical interpretability and align with established evidence in dementia prediction, supporting their complementary role in a model that balances performance with clinical relevance.
In terms of model sensitivity, the analyses in Figure 12 and Figure 13 confirm that while raw biomarkers such as neutrophil and lymphocyte exert the strongest influence on predictions, the four IRFs (ABP, NLR, Cholesterol–HDL Ratio, and Triglyceride–HDL Ratio) also contribute to the model’s sensitivity, albeit to a lesser extent. Their moderate SHAP values and importance scores indicate that small variations in these features can still influence model output, underscoring their role as meaningful supplementary predictors. This highlights the model’s ability to integrate both raw and composite features.

5. Discussion

A discussion of the results is presented in this section.

5.1. K-Means SMOTE Effect

K-Means SMOTE affects all models differently, depending on their sensitivity to synthetic data and their capacity to extend from interpolated samples. As they are robust to noise and can efficiently detect trends even in the presence of created minority class samples, ensemble models such as ET and RF benefit the most. Although GB also improves, it is somewhat sensitive to noisy synthetic data, which causes a modest variance in accuracy. Based on margin optimization, SVM presents mixed effects as synthetic samples may introduce overlapping class borders, somewhat compromising accuracy and recall. KNN suffers the most as it depends on distance-based categorization, and synthetic data can skew neighborhood ties, thereby producing either more false positives or more false negatives. Although usually flexible, the ANN does not demonstrate significant increases, most likely due to inadequate hyperparameter tuning to properly use the newly produced data. Through resolving the class imbalance, K-Means SMOTE increases the recall and AUC-ROC for most models, but its efficacy depends on how well a model can handle synthetic data without overfitting or losing precision. In conclusion, K-Means SMOTE is the most suitable oversampling method in this study, offering the best trade-off between distributional integrity and model discriminability. It achieved the highest generalization performance with the ET model.

5.2. IRF Effect

The ability of all models to manage higher dimensionality and discover pertinent patterns from newly acquired information determines how IRFs affect them. Feature augmentation helps ensemble models such as RF and ET the most since they can efficiently use extra features while remaining stable and avoiding overfitting. Though it is more sensitive to feature noise, which could lead to variations in precision, GB also shows modest increases. As SVM depends on determining the optimal hyperplane in a fixed-dimensional space, extra features may add complexity without enhancing class separability. Therefore, SVM may not significantly benefit from feature augmentation. KNN’s performance suffers greatly with augmented features since it is highly sensitive to dimensionality, and a larger feature space might dilute strong distance correlations, thus affecting performance. Although it can manage high-dimensional data, the ANN demonstrates no appreciable improvement, most likely because more advanced tuning is needed to derive relevant patterns from the augmented features. Overall, feature augmentation using IRFs improves the performance of tree-based ensemble models but offers limited benefit to distance-based or margin-based models. Sensitivity analysis indicates that the four IRFs have moderate importance, serving as complementary features that support predictions alongside key biomarkers.

5.3. IRF and K-Means SMOTE Effect

The combined effect of K-Means SMOTE and IRFs depends on a model’s capacity to manage synthetic data and higher dimensionality. Tree-based ensemble models such as RF and ET gain the most as they are adapted to learn from both synthetic minority samples and extra features, hence producing greater accuracy, recall, and AUC-ROC. Though it is somewhat subject to noise from synthetic data and feature augmentation, GB also demonstrates benefits and causes minor variations in recall and precision. SVM produces mixed results as extra features may not always improve hyperplane separation, and K-Means SMOTE can introduce class boundary overlaps. KNN suffers the most as both synthetic data and high-dimensional feature spaces distort distance relationships, hence lowering its performance. Although usually adaptable, the ANN does not demonstrate significant gains, most likely because thorough hyperparameter tweaking is necessary to fully use synthetic data and new characteristics. While distance-based and margin-based models struggle to efficiently use the additional data, K-Means SMOTE combined with augmented features improves ensemble models the most. In addition, the ablation study confirmed that K-Means SMOTE and the ET classifier are the most impactful, with IRFs offering incremental gains. The full configuration is validated as the optimal setup in this study.

5.4. The Findings

The ET model with the combined dataset, K-Means SMOTE, and four IRFs proved to be the best option based on the assessment criteria; namely, accuracy, precision, recall, F1 score, and AUC-ROC. Maintaining a well-balanced trade-off between precision and recall, ET routinely performed well across all measures, with the best accuracy (96.47%), strong precision (94.79%), and solid recall (97.86%), as reflected by its high F1 score (96.30%). Its AUC-ROC (99.51%) was also the greatest, suggesting exceptional classification capability. Although certain models—such as RF and GB—also showed good performance, ET’s stability and robustness across all measures made it the best one. In comparison, the four IRFs with K-Means SMOTE enhance model performance more effectively, while the eight-IRF setup shows minor declines, suggesting that added complexity may introduce noise. In this work, ET with K-Means SMOTE and four IRFs is thus the most efficient model–data combination since it strikes the optimal balance between predictive power and generalization.
Among the ensemble models, the ET model outperforms RF and GB because of its unique approach to randomness and feature selection. ET uses a different splitting technique than RF and GB. It chooses split points entirely at random, while RF determines the optimal split depending on impurity reduction, and GB creates trees consecutively to reduce errors. This additional randomization in ET helps prevent overfitting to synthetic data introduced by K-Means SMOTE, which RF could find difficult given its more deterministic character. Furthermore, IRFs offer more information for classification, and ET is ideal for effectively using high-dimensional data since it does not rely on boosting like GB, which may be sensitive to noise in augmented features. While RF and GB show great performance, they are more prone to overfit or be sensitive to synthetic data and augmented features, but ET remains robust, achieving the maximum accuracy, recall, and AUC-ROC, making it the best model for this dataset combination.
Due to their natural model characteristics and vulnerability to synthetic data and feature expansion, SVM, ANN, and KNN do not benefit appreciably from the combined dataset. SVM depends on an ideal hyperplane for classification; however, the inclusion of K-Means SMOTE’s synthetic samples and more features can alter the margin and cause a minor precision–recall trade-off. KNN suffers the most as it is particularly sensitive to high-dimensional spaces, and adding IRFs increases feature dimensionality, thus weakening distance-based classification by adding irrelevant or duplicate information. K-Means SMOTE also creates new samples via interpolation, which might distort KNN’s closest-neighbor computations and result in performance variations. Although usually robust to complicated feature interactions, the ANN does not demonstrate notable benefits as it depends on considerable hyperparameter adjustment to effectively learn from synthetic and augmented data, which may not be sufficiently optimal in this case. These individual learners fail to identify meaningful patterns from synthetic and augmented data and thus have restricted performance gains, in contrast to ensemble-based models such as ET and RF, which efficiently handle noise and use feature diversity. Specifically, the ET model proved to be the best option based on its overall performance.
The results show that ET with K-Means SMOTE and four IRFs performs the best across all assessment measures, surpassing other models due to its capacity to properly handle synthetic data and high-dimensional feature spaces. It can be seen that the tree-based models (ET, RF, GB) benefit the most. Distance-based (KNN) and margin-based models (SVM) exhibit mixed results. KNN suffers the most from feature space growth. In addition, the ANN is stable but, without additional tuning, it does not exhibit appreciable improvements. Unfortunately, the effects of hyperparameter tweaking on the ANN, GB, and SVM were not thoroughly investigated in this study; hence, their capacity to adapt to synthetic data and feature augmentation may have suffered. Furthermore, feature selection methods may be necessary for these models; thus, certain expanded features could not have improved model performance.
The use of medical domain knowledge to develop new features (IRFs) ensures that the data inputs match acknowledged clinical reasoning, significantly improving the explainability and trustworthiness of disease prediction models. Healthcare professionals may better understand predictions from models including medically meaningful features—such as risk scores, biomarker ratios, and symptom-based indices—because they relate to well-known physiological and pathological concepts. This transparency allows healthcare professionals to validate model decisions, hence improving their trust in predictions produced by machine learning. Moreover, domain-specific feature engineering decreases the “black-box” characteristics of ML, thus facilitating the identification of the reason a patient is classified as high- or low-risk. In healthcare, trustworthy artificial intelligence means that its judgments are reasonable to both healthcare providers and patients, interpretable in line with medical best practices, and aligned with medical best practices. Expert knowledge enhances model credibility, boosting clinical adoption and patient trust in AI-driven diagnosis and treatment.

5.5. Suggestions and Future Studies

The proposed model is ideal for disease prediction tasks with imbalanced, feature-rich data, offering strong generalization without overfitting. Synthetic augmentation and ensemble methods boost accuracy and trust, supporting early diagnosis, risk assessment, and personalized medicine. Future work should concentrate on adjusting hyperparameters for deep learning models to better employ synthetic data and applying feature selection techniques to ensure that only the most relevant enhanced features are used. Furthermore, improving model performance and generalization will require investigating sophisticated synthetic data generation methods beyond K-Means SMOTE, such as generative adversarial networks or adaptive resampling strategies.
Moreover, while this study centers on binary classification to differentiate dementia from non-dementia cases, the proposed approach is readily extensible to multiclass classification involving various dementia subtypes, particularly in settings where datasets remain imbalanced and contain interrelated clinical features. Designed in a disease-agnostic manner, the IRFs offer adaptability not only across different dementia variants but also for other medical conditions with similar data characteristics. Building on these strengths, future work may also explore the application of this approach in longitudinal studies to predict transitions across dementia severity levels and to support the early detection of other medical conditions.

6. Conclusions

This study proposed an ET model and a data enrichment method for dementia classification to improve the early detection of dementia. The proposed data enrichment method is a hybrid approach that combines feature augmentation and data balancing to increase the dimensionality of data, provide more informative features, and ensure a sufficient number of samples from the minority class. For feature augmentation, inter-relation-based features (IRFs) based on medical domain knowledge were proposed to promote the explainability and trustworthiness of the model. K-Means SMOTE was proposed as a way to handle imbalanced data by creating new data based on the original dataset’s actual clusters. Consequently, the original dataset is transformed into a higher-dimensional space suitable for model construction. In this study, 14,763 EHR records and an initial set of 22 features from a hospital in Chiang Rai, Thailand, were utilized. The ET model was developed for classification due to its ability to assess feature importance and handle multicollinearity. The model performance was compared with that of other traditional and ensemble learning methods. The experimental results demonstrate that the combination of four IRFs and K-Means SMOTE significantly enhanced the performance of the ET model across various metrics, including accuracy, precision, recall, F1 score, and AUC-ROC.

Author Contributions

Conceptualization, Y.C., W.R., G.H. and P.T.; methodology, Y.C. and P.T.; software, Y.C.; validation, Y.C. and W.R.; formal analysis, Y.C, W.R. and P.T.; resources, W.R.; data curation, Y.C. and W.R.; writing—original draft preparation, Y.C.; writing—review and editing, G.H. and P.T.; supervision, P.T.; project administration, P.T.; funding acquisition, G.H. and P.T. All authors have read and agreed to the published version of the manuscript.

Funding

This study is supported in part by the Program Management Unit for Human Resources & Institutional Development, Research and Innovation (PMU-B): Contract No. B04G640071; and in part by the European Union-NextGenerationEU, through the National Recovery and Resilience Plan of the Republic of Bulgaria, project № BG-RRP-2.013-0001.

Institutional Review Board Statement

The study was conducted in accordance with the Declaration of Helsinki and relevant institutional and international ethical guidelines, and received the certificate of exemption from the Mae Fah Luang University Ethics Committee on Human Research (protocol number: EC21226-13 on 22 November 2021) and certificate of approval from Chiangrai Prachanukroh Hospital (protocol code EC CRH 112/64 In on 21 February 2022).

Informed Consent Statement

Informed consent was obtained from all subjects involved in the study.

Data Availability Statement

The datasets presented in this article are not readily available because the data are part of an on-going study.

Acknowledgments

The authors would like to express their gratitude to Chiangrai Prachanukroh Hospital, Chiang Rai, Thailand, for providing the data and valuable assistance.

Conflicts of Interest

The authors declare no conflicts of interest.

References

  1. Castellazzi, G.; Cuzzoni, M.G.; Cotta Ramusino, M.; Martinelli, D.; Denaro, F.; Ricciardi, A.; Vitali, P.; Anzalone, N.; Bernini, S.; Palesi, F.; et al. A machine learning approach for the differential diagnosis of Alzheimer and vascular dementia fed by MRI selected features. Front. Neuroinform. 2020, 14, 25. [Google Scholar] [CrossRef] [PubMed]
  2. Gustavsson, A.; Norton, N.; Fast, T.; Frölich, L.; Georges, J.; Holzapfel, D.; Kirabali, T.; Krolak-Salmon, P.; Rossini, P.M.; Ferretti, M.T.; et al. Global estimates on the number of persons across the Alzheimer’s disease continuum. Alzheimer’s Dement. 2023, 19, 658–670. [Google Scholar] [CrossRef] [PubMed]
  3. Nichols, E.; Steinmetz, J.D.; Vollset, S.E.; Fukutaki, K.; Chalek, J.; Abd-Allah, F.; Abdoli, A.; Abualhasan, A.; Abu-Gharbieh, E.; Akram, T.T.; et al. Estimation of the global prevalence of dementia in 2019 and forecasted prevalence in 2050: An analysis for the Global Burden of Disease Study 2019. Lancet Public Health 2022, 7, e105–e125. [Google Scholar] [CrossRef] [PubMed]
  4. World Health Organization. Risk Reduction of Cognitive Decline and Dementia: WHO Guidelines; World Health Organization: Rome, Italy, 2019. [Google Scholar]
  5. Lastuka, A.; Bliss, E.; Breshock, M.R.; Iannucci, V.C.; Sogge, W.; Taylor, K.V.; Pedroza, P.; Dieleman, J.L. Societal costs of dementia: 204 countries, 2000–2019. J. Alzheimer’s Dis. 2024, 101, 277–292. [Google Scholar] [CrossRef]
  6. Muangpaisan, W. Dementia: Prevention, Assessment and Care; Parbpim: Bangkok, Thailand, 2013. [Google Scholar]
  7. Thongwachira, C.; Jaignam, N.; Thophon, S. A model of dementia prevention in older adults at Taling Chan District Bangkok Metropolis. KKU Res. J. 2019, 19, 96–108. [Google Scholar]
  8. Gómez, C.; Vaquerizo-Villar, F.; Poza, J.; Ruiz, S.J.; Tola-Arribas, M.A.; Cano, M.; Hornero, R. Bispectral analysis of spontaneous EEG activity from patients with moderate dementia due to Alzheimer’s disease. In Proceedings of the 2017 39th Annual International Conference of the IEEE Engineering in Medicine and Biology Society (EMBC), Jeju, Republic of Korea, 11–15 July 2017; IEEE: New York, NY, USA, 2017; pp. 422–425. [Google Scholar]
  9. Jeong, J.; Chae, J.H.; Kim, S.Y.; Han, S.H. Nonlinear dynamic analysis of the EEG in patients with Alzheimer’s disease and vascular dementia. J. Clin. Neurophysiol. 2001, 18, 58–67. [Google Scholar] [CrossRef]
  10. Nancy, A.; Balamurugan, M.; Vijaykumar, S. A brain EEG classification system for the mild cognitive impairment analysis. In Proceedings of the 2017 4th International Conference on Advanced Computing and Communication Systems (ICACCS), Coimbatore, India, 6–7 January 2017; IEEE: New York, NY, USA, 2017; pp. 1–6. [Google Scholar]
  11. Trambaiolli, L.R.; Spolaôr, N.; Lorena, A.C.; Anghinah, R.; Sato, J.R. Feature selection before EEG classification supports the diagnosis of Alzheimer’s disease. Clin. Neurophysiol. 2017, 128, 2058–2067. [Google Scholar] [CrossRef]
  12. Rodrigues, P.M.; Bispo, B.C.; Freitas, D.R.; Teixeira, J.P.; Carreres, A. Evaluation of EEG spectral features in Alzheimer disease discrimination. In Proceedings of the 21st European Signal Processing Conference (EUSIPCO 2013), Marrakech, Morocco, 9–13 September 2013; IEEE: New York, NY, USA, 2013; pp. 1–5. [Google Scholar]
  13. Pritchard, W.S.; Duke, D.W.; Coburn, K.L.; Moore, N.C.; Tucker, K.A.; Jann, M.W.; Hostetler, R.M. EEG-based, neural-net predictive classification of Alzheimer’s disease versus control subjects is augmented by non-linear EEG measures. Electroencephalogr. Clin. Neurophysiol. 1994, 91, 118–130. [Google Scholar] [CrossRef]
  14. Shorten, C.; Khoshgoftaar, T.M. A survey on image data augmentation for deep learning. J. Big Data 2019, 6, 1–48. [Google Scholar] [CrossRef]
  15. Ullah, H.T.; Onik, Z.; Islam, R.; Nandi, D. Alzheimer’s disease and dementia detection from 3D brain MRI data using deep convolutional neural networks. In Proceedings of the 3rd International Conference for Convergence in Technology (I2CT 2018), Pune, India, 6–8 April 2018; IEEE: New York, NY, USA, 2018; pp. 1–3. [Google Scholar]
  16. Bansal, D.; Khanna, K.; Chhikara, R.; Dua, R.K.; Malhotra, R. Comparative analysis of artificial neural networks and deep neural networks for detection of dementia. Int. J. Soc. Ecol. Sustain. Dev. 2022, 13, 1–18. [Google Scholar] [CrossRef]
  17. Narmatha, C.; Hayam, A.; Qasem, A.H. An analysis of deep learning techniques in neuroimaging. J. Comput. Sci. Intell. Technol. 2021, 2, 7–13. [Google Scholar]
  18. Vardhini, K.V.; Vishnumolakala, L.D.; Palanki, S.U.A.; Yarramsetty, M.; Raja, G. Alzheimer’s Research and Early Diagnosis Through Improved Deep Learning Models. In Proceedings of the 2024 5th International Conference on Electronics and Sustainable Communication Systems (ICESC), Coimbatore, India, 7–9 August 2024; IEEE: New York, NY, USA, 2024; pp. 1577–1583. [Google Scholar]
  19. Almubark, I.; Alsegehy, S.; Jiang, X.; Chang, L.C. Early detection of mild cognitive impairment using neuropsychological data and machine learning techniques. In Proceedings of the 2020 IEEE Conference on Big Data and Analytics (ICBDA), Kota Kinabalu, Malaysia, 17–19 November 2020; IEEE: New York, NY, USA, 2020; pp. 32–37. [Google Scholar]
  20. Javeed, A.; Dallora, A.L.; Berglund, J.S.; Idrisoglu, A.; Ali, L.; Rauf, H.T.; Anderberg, P. Early prediction of dementia using feature extraction battery (FEB) and optimized support vector machine (SVM) for classification. Biomedicines 2023, 11, 439. [Google Scholar] [CrossRef] [PubMed]
  21. Yongcharoenchaiyasit, K.; Arwatchananukul, S.; Temdee, P.; Prasad, R. Gradient boosting-based model for elderly heart failure, aortic stenosis, and dementia classification. IEEE Access 2023, 11, 48677–48696. [Google Scholar] [CrossRef]
  22. Mirzaei, G.; Adeli, H. Machine learning techniques for diagnosis of Alzheimer’s disease, mild cognitive disorder, and other types of dementia. Biomed. Signal Process. Control. 2022, 72, 103293. [Google Scholar] [CrossRef]
  23. Mohammed, B.A.; Senan, E.M.; Rassem, T.H.; Makbol, N.M.; Alanazi, A.A.; Al-Mekhlafi, Z.G.; Almurayziq, T.S.; Ghaleb, F.A. Multi-method analysis of medical records and MRI images for early diagnosis of dementia and Alzheimer’s disease based on deep learning and hybrid methods. Electronics 2021, 10, 2860. [Google Scholar] [CrossRef]
  24. Cura, O.K.; Yilmaz, G.C.; Ture, H.S.; Akan, A. Deep time-frequency feature extraction for Alzheimer’s dementia EEG classification. In Proceedings of the 2022 Medical Technologies Congress (TIPTEKNO), Antalya, Turkey, 31 October–2 November 2022; IEEE: New York, NY, USA, 2022; pp. 1–4. [Google Scholar]
  25. Hanai, S.; Kato, S.; Sakuma, T.; Ohdake, R.; Masuda, M.; Watanabe, H. A dementia classification based on speech analysis of casual talk during a clinical interview. In Proceedings of the 2022 IEEE 4th Global Conference on Life Sciences and Technologies (LifeTech), Osaka, Japan, 7–9 March 2022; IEEE: New York, NY, USA, 2022; pp. 38–40. [Google Scholar]
  26. Mumuni, A.; Mumuni, F. Data augmentation: A comprehensive survey of modern approaches. Array 2022, 16, 100258. [Google Scholar] [CrossRef]
  27. Jha, A.; John, E.; Banerjee, T. Multi-class classification of dementia from MRI images using transfer learning. In Proceedings of the 2022 IEEE 13th Annual Ubiquitous Computing, Electronics & Mobile Communication Conference (UEMCON), New York, NY, USA, 26–29 October 2022; IEEE: New York, NY, USA, 2022; pp. 597–602. [Google Scholar]
  28. Reddy, T.S.; Saikiran, V.; Samhitha, S.; Moin, S.; Kumar, T.P.; Charan, V.S. Early detection of Alzheimer’s disease using data augmentation and CNN. In Proceedings of the 2023 4th IEEE Global Conference for Advancement in Technology (GCAT), Bangalore, India, 6–8 October 2023; IEEE: New York, NY, USA, 2023; pp. 1–6. [Google Scholar]
  29. Samanta, S.; Mazumder, I.; Roy, C. Deep learning-based early detection of Alzheimer’s disease using image enhancement filters. In Proceedings of the 2023 Third International Conference on Advances in Electrical, Computing, Communication and Sustainable Technologies (ICAECT), Bhilai, India, 5–6 January 2023; IEEE: New York, NY, USA; pp. 1–5. [Google Scholar]
  30. Liu, Q.S.; Xue, Y.; Li, G.; Qiu, D.; Zhang, W.; Guo, Z.; Li, Z. Application of KM-SMOTE for rockburst intelligent prediction. Tunn. Undergr. Space Technol. 2023, 138, 105180. [Google Scholar] [CrossRef]
  31. Hairani, H.; Saputro, K.E.; Fadli, S. K-means-SMOTE untuk menangani ketidakseimbangan kelas dalam klasifikasi penyakit diabetes dengan C4.5, SVM, dan naive Bayes. J. Teknol. Dan Sist. Komput. 2020, 8, 89–93. [Google Scholar] [CrossRef]
  32. He, H.; Bai, Y.; Garcia, E.A.; Li, S. ADASYN: Adaptive synthetic sampling approach for imbalanced learning. In Proceedings of the 2008 IEEE International Joint Conference on Neural Networks (IEEE World Congress on Computational Intelligence), Hong Kong, 1–8 June 2008; IEEE: New York, NY, USA, 2008; pp. 1322–1328. [Google Scholar]
  33. Ranjan, N.; Kumar, D.U.; Dongare, V.; Chavan, K.; Kuwar, Y. Diagnosis of Parkinson disease using handwriting analysis. Int. J. Comput. Appl. 2022, 184, 13–16. [Google Scholar] [CrossRef]
  34. Öcal, H. A novel approach to detection of Alzheimer’s disease from handwriting: Triple ensemble learning model. Gazi Univ. J. Sci. Part C Des. Technol. 2024, 12, 214–223. [Google Scholar] [CrossRef]
  35. Shen, Y.; Zhu, J.; Deng, Z.; Lu, W.; Wang, H. EnsDeepDP: An ensemble deep learning approach for disease prediction through metagenomics. IEEE/ACM Trans. Comput. Biol. Bioinform. 2022, 20, 986–998. [Google Scholar] [CrossRef]
  36. Goel, A.; Lal, M.; Javadekar, A.N. Comparative analysis of the machine and deep learning classifier for dementia prediction. In Proceedings of the 2023 Advanced Computing and Communication Technologies for High Performance Applications (ACCTHPA), Ernakulam, India, 20–21 January 2023; IEEE: New York, NY, USA, 2023; pp. 1–8. [Google Scholar]
  37. Rahman, M.A.; Shafique, R.; Ullah, S.; Choi, G.S. Cardiovascular Disease Prediction System Using Extra Trees Classifier. Res. Sq. 2019, 11, 51. [Google Scholar]
  38. Aashima; Bhargav, S.; Kaushik, S.; Dutt, V. A Combination of Decision Trees with Machine Learning Ensembles for Blood Glucose Level Predictions; Springer: Berlin/Heidelberg, Germany, 2021. [Google Scholar]
  39. Hanczár, G.; Stippinger, M.; Hanák, D.; Kurbucz, M.T.; Törteli, O.M.; Chripkó, Á.; Somogyvári, Z. Feature space reduction method for ultrahigh-dimensional, multiclass data: Random forest-based multiround screening (RFMS). arXiv 2023, arXiv:2305.15793. [Google Scholar] [CrossRef]
  40. Zhou, Z.-H.; Feng, J. Deep forest: Towards an alternative to deep neural networks. In Proceedings of the IJCAI’17: 26th International Joint Conference on Artificial Intelligence, Melbourne, Australia, 19–25 August 2017. [Google Scholar]
  41. Fernández, A.; García, S.; Galar, M.; Prati, R.C.; Krawczyk, B.; Herrera, F. Learning from Imbalanced Data Streams; Springer: Cham, Switzerland, 2018; Volume 10. [Google Scholar]
  42. Kim, K. Noise avoidance SMOTE in ensemble learning for imbalanced data. IEEE Access 2021, 9, 143250–143265. [Google Scholar] [CrossRef]
  43. Wen, J.; Thibeau-Sutre, E.; Diaz-Melo, M.; Samper-González, J.; Routier, A.; Bottani, S.; Dormont, D.; Durrleman, S.; Burgos, N.; Alzheimer’s Disease Neuroimaging Initiative; et al. Convolutional neural networks for classification of Alzheimer’s disease: Overview and reproducible evaluation. Med. Image Anal. 2020, 63, 101694. [Google Scholar]
  44. Fernández-Delgado, M.; Cernadas, E.; Barro, S.; Amorim, D. Do we need hundreds of classifiers to solve real world classification problems? J. Mach. Learn. Res. 2014, 15, 3133–3181. [Google Scholar]
  45. Kourou, K.; Exarchos, T.P.; Exarchos, K.P.; Karamouzis, M.V.; Fotiadis, D.I. Machine learning applications in cancer prognosis and prediction. Comput. Struct. Biotechnol. J. 2015, 13, 8–17. [Google Scholar] [CrossRef]
  46. Wang, X.; Yu, H.; Zhang, Y.; Yu, Y. An ensemble learning framework for early detection of Alzheimer’s disease using multiple biomarkers. Comput. Biol. Med. 2021, 133, 104399. [Google Scholar]
  47. Beebe-Wang, N.; Okeson, A.; Althoff, T.; Lee, S.I. Efficient and explainable risk assessments for imminent dementia in an aging cohort study. IEEE J. Biomed. Health Inform. 2021, 25, 2409–2420. [Google Scholar] [CrossRef]
  48. Pujianto, U.; Wibawa, A.P.; Akbar, M.I. K-nearest neighbor (K-NN) based missing data imputation. In Proceedings of the 2019 5th International Conference on Science in Information Technology (ICSITech), Yogyakarta, Indonesia, 10–11 October 2019; IEEE: New York, NY, USA, 2019; pp. 83–88. [Google Scholar]
  49. Jameson, J.L.; Fauci, A.S.; Kasper, D.L.; Hauser, S.L.; Longo, D.L.; Loscalzo, J. Harrison’s Principles of Internal Medicine, 21st ed.; McGraw Hill: New York, NY, USA, 2022. [Google Scholar]
  50. Skerrett, P.J. Lipid Disorders: Diagnosis and Treatment; Harvard Health Publications: Boston, MA, USA, 2014. [Google Scholar]
  51. Bishop, M.L. Clinical Chemistry: Principles, Techniques, and Correlations, Enhanced Edition: Principles, Techniques, and Correlations; Jones & Bartlett Learning: Burlington, MA, USA, 2023. [Google Scholar]
  52. Guyton, A.C.; Hall, J.E. Guyton and Hall Textbook of Medical Physiology, 13th ed.; Elsevier: Amsterdam, The Netherlands, 2021. [Google Scholar]
  53. Noble, W.S. What is a support vector machine? Nat. Biotechnol. 2006, 24, 1565–1567. [Google Scholar] [CrossRef]
  54. Almasoud, M.; Ward, T.E. Detection of chronic kidney disease using machine learning algorithms with least number of predictors. Int. J. Soft Comput. Its Appl. 2019, 10, 14–23. [Google Scholar] [CrossRef]
  55. Justin, B.N.; Turek, M.; Hakim, A.M. Heart disease as a risk factor for dementia. Clin. Epidemiol. 2013, 5, 135–145. [Google Scholar] [CrossRef] [PubMed]
  56. Kramer, O. Dimensionality Reduction with Unsupervised Nearest Neghbors; Springer: Berlin/Heidelberg, Germany, 2013. [Google Scholar]
  57. Zhang, Z. Generalized Linear Models: Modern Methods and Applications; Springer: Berlin/Heidelberg, Germany, 2016. [Google Scholar]
  58. Kunapuli, G. Ensemble Methods for Machine Learning; Simon and Schuster: New York, NY, USA, 2023. [Google Scholar]
  59. Zhang, Y.; Chen, X. Explainable recommendation: A survey and new perspectives. Found. Trends® Inf. Retr. 2020, 14, 1–101. [Google Scholar] [CrossRef]
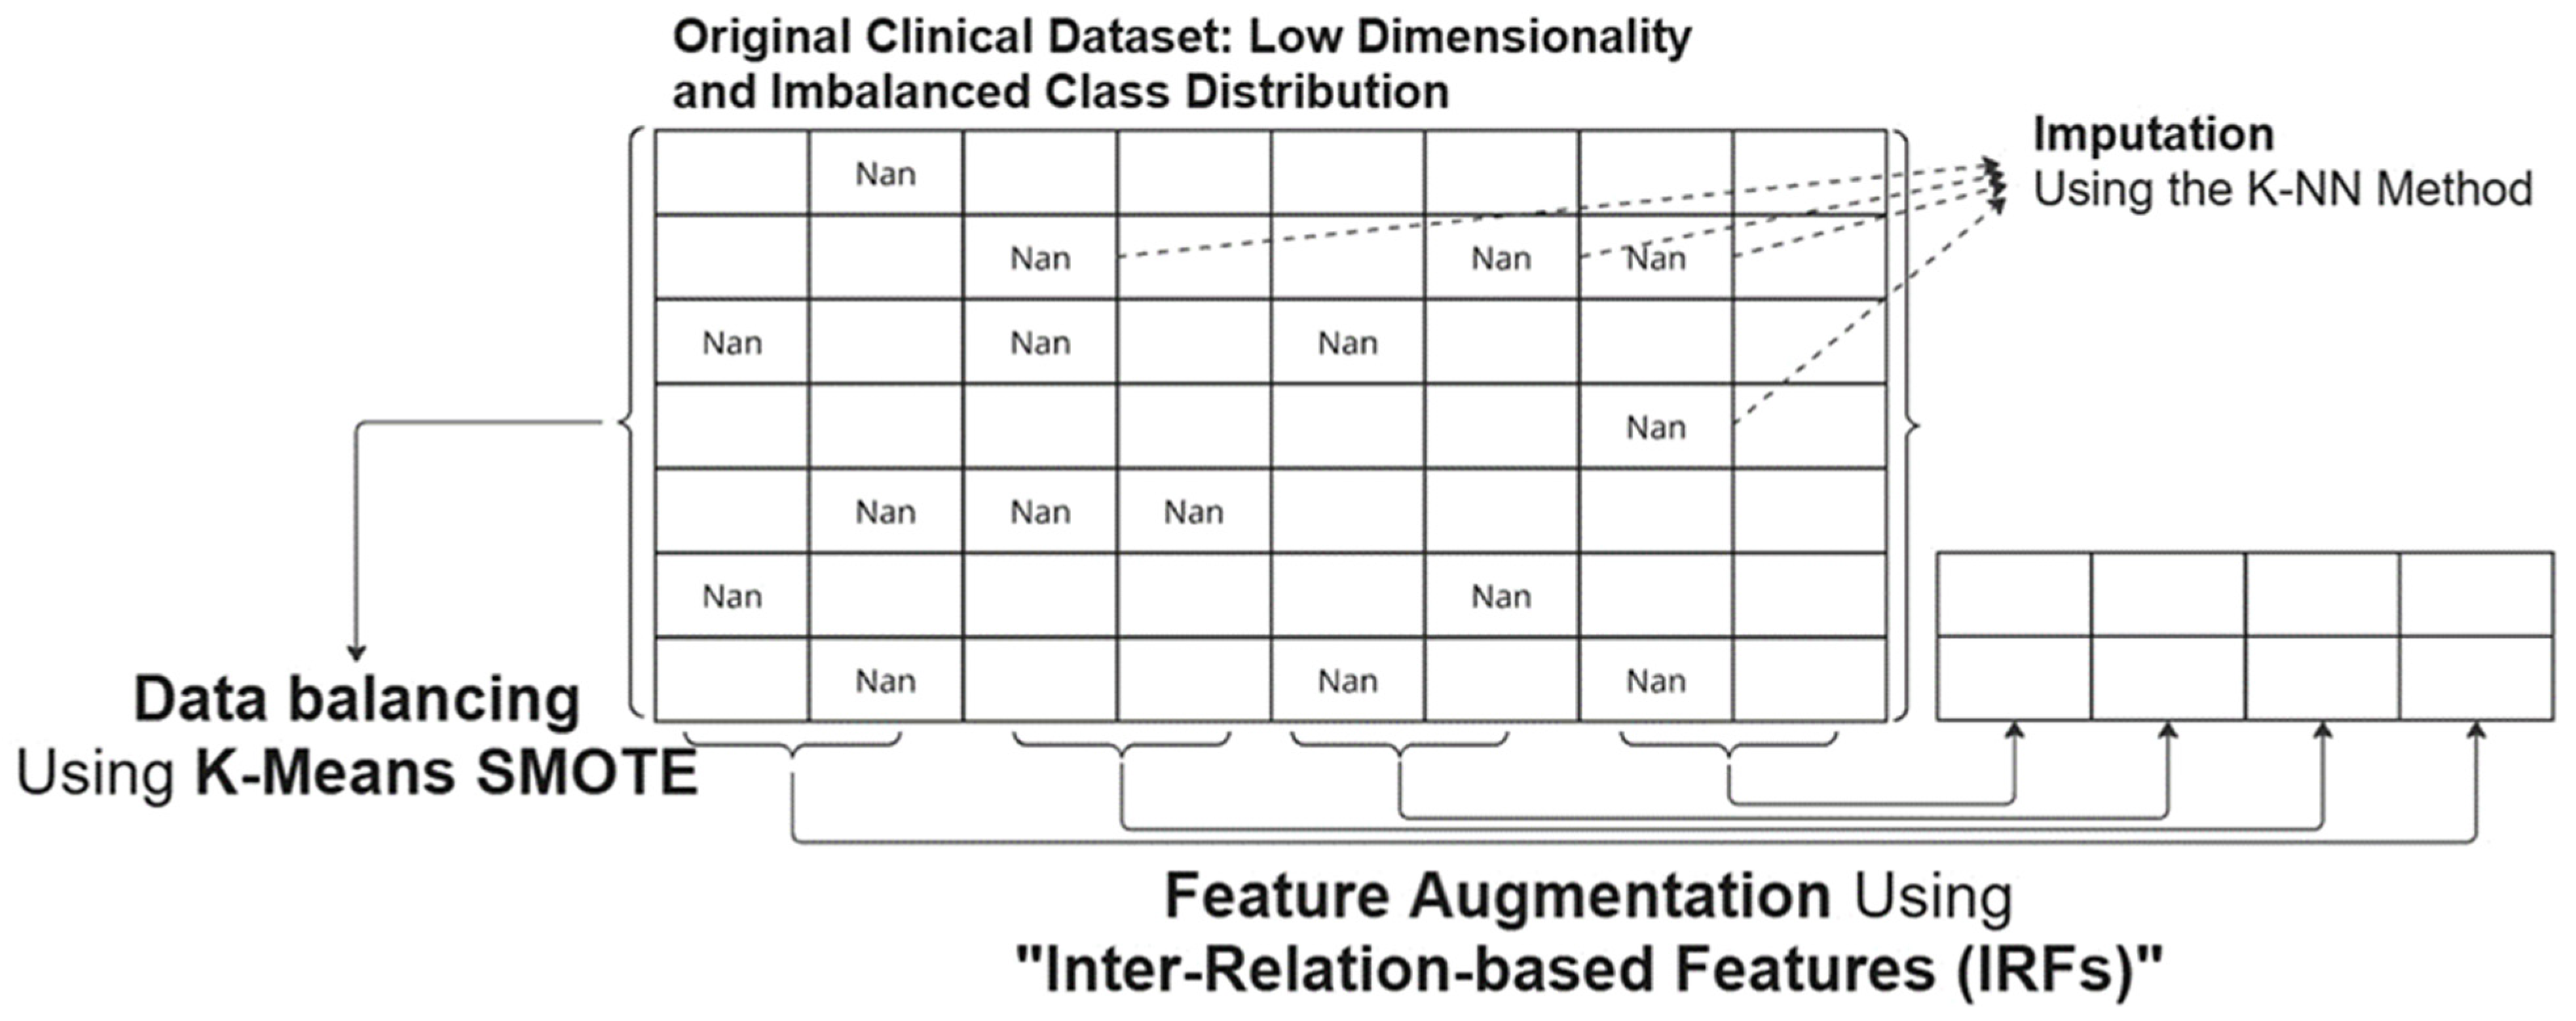
Figure 1. Conceptual diagram of hybrid data enrichment framework, using inter-relation-based features for feature augmentation and K-Means SMOTE for data balancing.
Bdcc 09 00148 g001
Figure 2. Research methodology including data collection, data preprocessing, feature augmentation, data standardization and balancing, model construction and validation, and model testing and comparison.
Bdcc 09 00148 g002
Figure 3. The class balance of the original dataset, with patients without dementia as the majority class and patients with dementia as the minority class.
Bdcc 09 00148 g003
Figure 4. Different feature combination sets. The features are categorized into six distinct groups, each represented by a different color. Inter-relation-based features (IRFs) are derived using relational equations based on medical domain knowledge applied to features within the same group.
Bdcc 09 00148 g004
Figure 5. Dataset before and after applying K-Means SMOTE. The minority class (patients with dementia) was resampled to match the number of instances of the majority class (patients without dementia).
Bdcc 09 00148 g005
Figure 6. t-SNE visualization of original dataset + 4 IRFs applying (a), SMOTE (b), ADASYN (c) and K-Means SMOTE (d). The blue dots are patients without dementia and the red dots patients with dementia.
Bdcc 09 00148 g006
Figure 7. ROC curves of all models using original dataset.
Bdcc 09 00148 g007
Figure 8. ROC curves of all models using original dataset and K-Means SMOTE.
Bdcc 09 00148 g008
Figure 9. ROC curves of all models using dataset with four IRFs and K-Means SMOTE.
Bdcc 09 00148 g009
Figure 10. ROC curves of all models using dataset with eight IRFs and K-Means SMOTE.
Bdcc 09 00148 g010
Figure 11. Confusion matrix of ET model using four IRFs and K-Means SMOTE, showing high accuracy, with 97.91% correct classification for class 1 and 95.15% for class 2, and low false positive (2.09%) and false negative (4.85%) rates.
Bdcc 09 00148 g011
Figure 12. The mean absolute feature importance scores of the Extra Trees model trained on the combined dataset (four IRFs + K-Means SMOTE).
Bdcc 09 00148 g012
Figure 13. A SHAP summary plot illustrating the global and local impacts of each feature on the Extra Trees model’s predictions using the combined dataset (four IRFs + K-Means SMOTE).
Bdcc 09 00148 g013
Table 1. Original dataset and feature groups.
No.GroupFeatureData Range
1.Personal dataAge
Weight (W)
Height (H)
Gender (S)
73.17 ± 8.54
56.37 ± 9.70
155.03 ± 7.62
0–1
2.Blood pressureSystolic Blood Pressure (SBP)
Diastolic Blood Pressure (DBP)
130.00 ± 16.34
68.93 ± 9.9
3.Lipid levelsCholesterol (Chol)
Triglyceride (TG)
Low-Density Lipoprotein (LDL)
High-Density Lipoprotein (HDL)
171.02 ± 28.77
115.81 ± 33.59
112.19 ± 21.17
44.95 ± 8.67
4.Blood sugar levelFasting Blood Sugar (FBS)123.47 ± 62.52
5.Minerals and chemical substancesCreatinine (Cr)
Blood Urea Nitrogen (BUN)
Hemoglobin (Hb)
Potassium (K)
Sodium (Na)
1.59 ± 1.45
25.96 ± 16.44
11.34 ± 1.72
3.96 ± 0.49
137.67 ± 3.02
6.Blood cellsWhite Blood Cell (WBC)
Neutrophil (Neut)
Platelet (Plt)
Lymphocyte (Lymph)
9006.04 ± 2639.41
74.65 ± 12.80
238,667.17 ± 60,548.65
18.12 ± 7.45
Table 2. IRF-augmented features.
No.Features
Detail
Description
1.Average blood pressure (ABP)ABP, a key indicator of circulation, is calculated from systolic and diastolic pressures during heart contraction and relaxation, respectively.
2.Cholesterol–HDL Ratio (CHR)CHR, used to assess cardiovascular risk, is calculated by dividing total cholesterol by HDL.
3.Neutrophil-to-Lymphocyte Ratio (NLR)NLR, used to assess inflammation and immune response, is calculated by dividing neutrophils by lymphocytes and is commonly applied in chronic disease and cancer evaluation.
4.Modification of Diet in Renal Disease (MDRD)MDRD, used to assess kidney function, is calculated from serum creatinine adjusted for age, gender, and ethnicity, and is commonly used in chronic kidney disease management.
5.Neutrophil Count (NC)NC, used to assess immune function, measures the number of neutrophils (white blood cells) in the blood.
6.Triglyceride–HDL Ratio (TG/HDL Ratio)TG/HDL, used to assess cardiovascular risk and insulin resistance, is calculated by dividing triglyceride levels by HDL cholesterol; higher ratios indicate greater risk.
7.Chronic Kidney Disease Epidemiology Collaboration (CKD-EPI) CKD-EPI, used for accurate kidney function assessment, improves upon MDRD by incorporating serum creatinine, age, gender, and ethnicity, aiding in chronic kidney disease diagnosis.
8.HDL-LDL ratio (HDL/LDL Ratio)HDL/LDL Ratio, used to assess cardiovascular health, is calculated by dividing HDL by LDL; higher ratios indicate better cholesterol balance and reduced risk.
Table 3. Examples from original dataset with four IRFs.
Original FeaturesIRFs
AGEWHSSBPDBPCholTGLDLHDLFBSCrBUNHbKNaWBCNeutPltABPCHRNLRMDRD
7460.73153.020128.3864.84145.6786.9489.5741.7116.281.0317.6311.0784.20137.0912,21091.09292,530193.220.46551.62632.0848
7454.56147.210129.3962.59170.64133.04119.4542.28158.70.9716.9312.2593.90139.3612,27691.65287,970191.980.35391.42853.1466
7461.34155.710127.3763.89146.0381.6789.8140.1999.481.004520.0710.9694.09137.1510,72591.30246,440191.260.44751.62592.0320
8347.16143.691134.4958.61170.93120.31119.343.95142.231.75289.4002.40137.8010,86286.40390,000193.100.36831.43272.7374
Table 4. K-S test summarization.
Oversampling MethodFeatures with D > 0.05Max D-ValueMost Affected Features
K-Means SMOTE30.4692Height (0.4692), ABP (0.3405), sbp (0.2024)
SMOTE40.1595Height (0.0801), dbp (0.1595), sbp (0.0527), ABP (0.0792)
ADASYN30.2474Height (0.2474), platelet (0.0531), na (0.0551)
Table 5. Summary of Friedman test’s average ranks across cross-validation performance metrics.
DatasetBest ModelAccuracyPrecisionRecallF1 ScoreAUC-ROCAvg Rank (Mean)
Original + 4 IRFsET1.201.151.451.301.001.22
Original + 4 IRFs + ADASYNET1.101.001.101.001.001.04
Original + 4 IRFs + SMOTEET1.001.001.001.001.001.00
Original + 4 IRFs + K-Means SMOTEET1.051.001.101.201.001.07
Table 6. Performance of classification models on unseen test data across oversampling techniques.
DatasetBest ModelAccuracyPrecisionRecallF1 ScoreAUC
OriginalET95.15%95.98%93.00%94.29%98.85%
Original + ADASYNET94.74%93.85%94.21%94.03%98.76%
Original + SMOTEET94.94%94.72%93.68%94.17%98.73%
Original + K-Means SMOTEET95.26%95.68%93.48%94.47%98.81%
Table 7. Model performance based on stratified 10-fold cross-validation on the original dataset.
ModelOriginal Dataset Features (No. of Features = 20)
Precision (%)Recall (%)F1 Score (%)Accuracy (%)AUC
GB0.93 ± 0.010.92 ± 0.010.93 ± 0.010.94 ± 0.010.98 ± 0.00
RF0.95 ± 0.010.92 ± 0.010.94 ± 0.010.95 ± 0.010.99 ± 0.00
ET0.96 ± 0.010.93 ± 0.010.94 ± 0.010.95 ± 0.010.99 ± 0.00
SVM0.34 ± 0.000.50 ± 0.000.40 ± 0.000.68 ± 0.000.78 ± 0.01
KNN0.86 ± 0.010.84 ± 0.010.85 ± 0.010.87 ± 0.010.92 ± 0.01
ANN0.55 ± 0.140.58 ± 0.090.53 ± 0.120.68 ± 0.020.76 ± 0.02
Table 8. Model performance based on stratified 10-fold cross-validation on original with four IRFs and K-Means SMOTE.
ModelOriginal Dataset with 4 IRFs and K-Means SMOTE (No. of Features = 24)
Precision (%)Recall (%)F1 Score (%)Accuracy (%)AUC
GB0.95 ± 0.010.95 ± 0.010.95 ± 0.010.95 ± 0.010.99 ± 0.00
RF0.96 ± 0.000.96 ± 0.000.96 ± 0.000.96 ± 0.000.99 ± 0.00
ET0.96 ± 0.010.96 ± 0.010.96 ± 0.010.96 ± 0.010.99 ± 0.00
SVM0.76 ± 0.010.75 ± 0.010.74 ± 0.010.75 ± 0.010.83 ± 0.01
KNN0.90 ± 0.010.90 ± 0.010.90 ± 0.010.90 ± 0.010.96 ± 0.01
ANN0.75 ± 0.050.68 ± 0.080.64 ± 0.130.68 ± 0.080.77 ± 0.07
Table 9. Model performance based on stratified 10-fold cross-validation on original with eight IRFs and K-Means SMOTE.
ModelOriginal Dataset with 8 IRFs and K-Means SMOTE (No. of Features = 28)
Precision (%)Recall (%)F1 Score (%)Accuracy (%)AUC
GB0.95 ± 0.000.95 ± 0.000.95 ± 0.000.95 ± 0.000.99 ± 0.00
RF0.96 ± 0.010.96 ± 0.010.96 ± 0.010.96 ± 0.010.99 ± 0.00
ET0.96 ± 0.010.96 ± 0.010.96 ± 0.010.96 ± 0.010.99 ± 0.00
SVM0.77 ± 0.010.76 ± 0.010.75 ± 0.010.76 ± 0.010.84 ± 0.01
KNN0.91 ± 0.010.91 ± 0.010.91 ± 0.010.91 ± 0.010.96 ± 0.01
ANN0.79 ± 0.040.76 ± 0.060.75 ± 0.060.76 ± 0.060.82 ± 0.05
Table 10. Accuracy comparison.
Accuracy (%)
ModelOriginal
Dataset
Original Dataset
+ K-Means SMOTE
Original Dataset
+ K-Means SMOTE
+ 4 IRFs
Original Dataset
+ K-Means SMOTE
+ 8 IRFs
SVM93.0594.7394.5294.50
GB93.8494.5894.6795.10
ET95.0896.3996.4796.52
RF94.6396.0296.1096.27
KNN91.2492.5892.4492.56
ANN92.6894.7094.9594.90
Table 11. Precision comparison.
Precision (%)
ModelOriginal
Dataset
Original Dataset
+ K-Means SMOTE
Original Dataset
+ K-Means SMOTE
+ 4 IRFs
Original Dataset
+ K-Means SMOTE
+ 8 IRFs
SVM94.3594.2694.2594.05
GB94.4493.9894.0793.92
ET94.0194.7294.7994.47
RF93.6694.1493.9993.82
KNN97.3497.5597.4697.57
ANN94.7895.0395.1095.13
Table 12. Recall comparison.
Recall (%)
ModelOriginal
Dataset
Original Dataset
+ K-Means SMOTE
Original Dataset
+ K-Means SMOTE
+ 4 IRFs
Original Dataset
+ K-Means SMOTE
+ 8 IRFs
SVM94.9694.2293.8594.16
GB96.5395.3195.1195.49
ET98.7997.9797.8697.57
RF98.5597.7697.6697.34
KNN93.4091.0390.9491.13
ANN94.8594.3594.3494.36
Table 13. Comparison of F1 score.
F1 Score (%)
ModelOriginal DatasetOriginal Dataset
+ K-Means SMOTE
Original Dataset
+ K-Means SMOTE
+ 4 IRFs
Original Dataset
+ K-Means SMOTE
+ 8 IRFs
SVM94.6694.2494.0594.11
GB95.4794.6494.5994.70
ET96.3496.3296.3096.00
RF96.0495.9295.7995.55
KNN95.3394.1894.0994.24
ANN94.8194.6994.7294.75
Table 14. Average AUC-ROC comparison.
Average AUC-ROC (%)
ModelOriginal DatasetOriginal Dataset
+ K-Means SMOTE
Original Dataset
+ K-Means SMOTE
+ 4 IRFs
Original Dataset
+ K-Means SMOTE
+ 8 IRFs
SVM97.1098.5998.5798.68
GB98.0398.8798.8998.91
ET98.7499.4999.5199.45
RF98.5999.3999.3599.33
KNN96.2097.1296.8296.96
ANN96.9898.4498.5698.44
Table 15. Results of the ablation study.
Model ConfigurationIRFsK-Means SMOTEClassifierAccuracy
(%)
Recall
(%)
Precision
(%)
F1 Score
(%)
AUC-ROC
(%)
Full ModelincludedincludedET96.4797.8694.7996.3099.51
w/o IRFsnot includedincludedET96.3098.0194.7396.2699.49
w/o SMOTEincludednot includedET94.8599.0593.6496.2298.88
w/o IRFs and SMOTEnot includednot includedET95.0898.6393.9696.3498.74
RF instead of ETincludedincludedRF96.1097.6693.9995.7999.35
Disclaimer/Publisher’s Note: The statements, opinions and data contained in all publications are solely those of the individual author(s) and contributor(s) and not of MDPI and/or the editor(s). MDPI and/or the editor(s) disclaim responsibility for any injury to people or property resulting from any ideas, methods, instructions or products referred to in the content.