
Predicting Early Employability of Vietnamese Graduates: Insights from Data-Driven Analysis Through Machine Learning Methods

 ,
,  ,
,  ,
,  and
and
Abstract
1. Introduction
2. Related Works
2.1. Graduate Employability Predictions

| Source | Research Context | Tasks | Methods | Results |
|---|---|---|---|---|
| Mishra et al. [13] | Master of Computer applications of students in India | Classification | DT, RF, NB, MLP, SMO | DT: 70.19% |
| Casuat and Festijo [16] | Graduates of engineering in the Philippines | Classification | DT, RF, SVM | DT: 85% RF: 84% SVM: 91.22% |
| He et al. [30] | China | Classification Regression | DT, RF | 77.18% |
| ElSharkawy et al. [18] | 296 graduates of IT and several IT employers in Egypt | Classification | DT, NB, LR, RF, SVM | DT: 100%, LR and SVM: 98% |
| Alkashami et al. [31] | Three Jordanian universities | Statistics Classification | Adaptive neuro-fuzzy inference system (ANFIS), DT, SVM, NB, MLP | DT: F1 of 82.4% SVM: F1 of 77.8%. |
| Baffa et al. [32] | Nigeria | Clustering Classification | RF, LR, DT | DT: 97% RF: 98% |
| Jayachandran and Joshi [17] | India | Classification | RF, DT, k-nearest neighbor (KNN), SVM, gradient boosting, adaptive boosting, and extreme gradient boosting | SVM: 74.37% |
2.2. Machine Learning Model Selection
2.2.1. Decision Trees (DTs)
2.2.2. Support Vector Machine (SVM)
2.3. Key Factors for Graduate Employability
| Factors | Description | References |
|---|---|---|
| Major | Fields of study in the degree programs that graduates were enrolled in. | [35,37] |
| Gender | The gender of graduates: female or male. | [32,35,36,37] |
| University entrance scores | The scores for university entrance exams used as admission criteria. | [2,13,16] |
| Academic performance | GPA scores and scores for assignments, projects, internships, etc. Weighted grades of degree courses. | [16,17,30,32,35,36,37] |
3. Methodology
- (1)
- Set the parameters of each model as shown in Table 6;
- (2)
- Process the ML models with training, testing, and cross-validation;
- (3)
- Repeat Steps (1)~(2) ten times;
- (4)
- Calculate the mean value and standard deviation (SD) to compare the prediction performance among the constructed AI models.
| Dataset | Number of Graduates | Percentage |
|---|---|---|
| Training set | 488 | 80% |
| Testing set | 122 | 20% |
| Total | 526 | 100% |
| Model | Parameters | Parameter Values |
|---|---|---|
| SVM | Kernel | rbf |
| C | 1 | |
| CART | Criterion | Gini * |
| Max depth | 3, 4, 5 for pruning the tree | |
| Random state | None | |
| C5.0 | Default in the See5 software | |
- (a)
- Confusion matrix: Table 7 describes the confusion matrix values used in the present study. TP means that actually employed recent graduates are correctly predicted as “employed”; TN means that actually unemployed recent graduates are correctly predicted as “unemployed”. FP and FN are errors, showing that actually employed and unemployed recent graduates are incorrectly predicted/classified.
- (b)
- Accuracy is measured through Equation (2).
- (c)
- ROC–AUC: The ROC curve is a plot utilized to visualize the behavior of classification models. The AUC is used to measure whether a model can classify “employed” and “unemployed” classes correctly.
| Positive Prediction is “employed” | Negative Prediction is “unemployed” | |
|---|---|---|
| Recent graduate is actually “employed” | True Positive (TP) | False Negative (FN) |
| Recent graduate is actually “unemployed” | False Positive (FP) | True Negative (TN) |
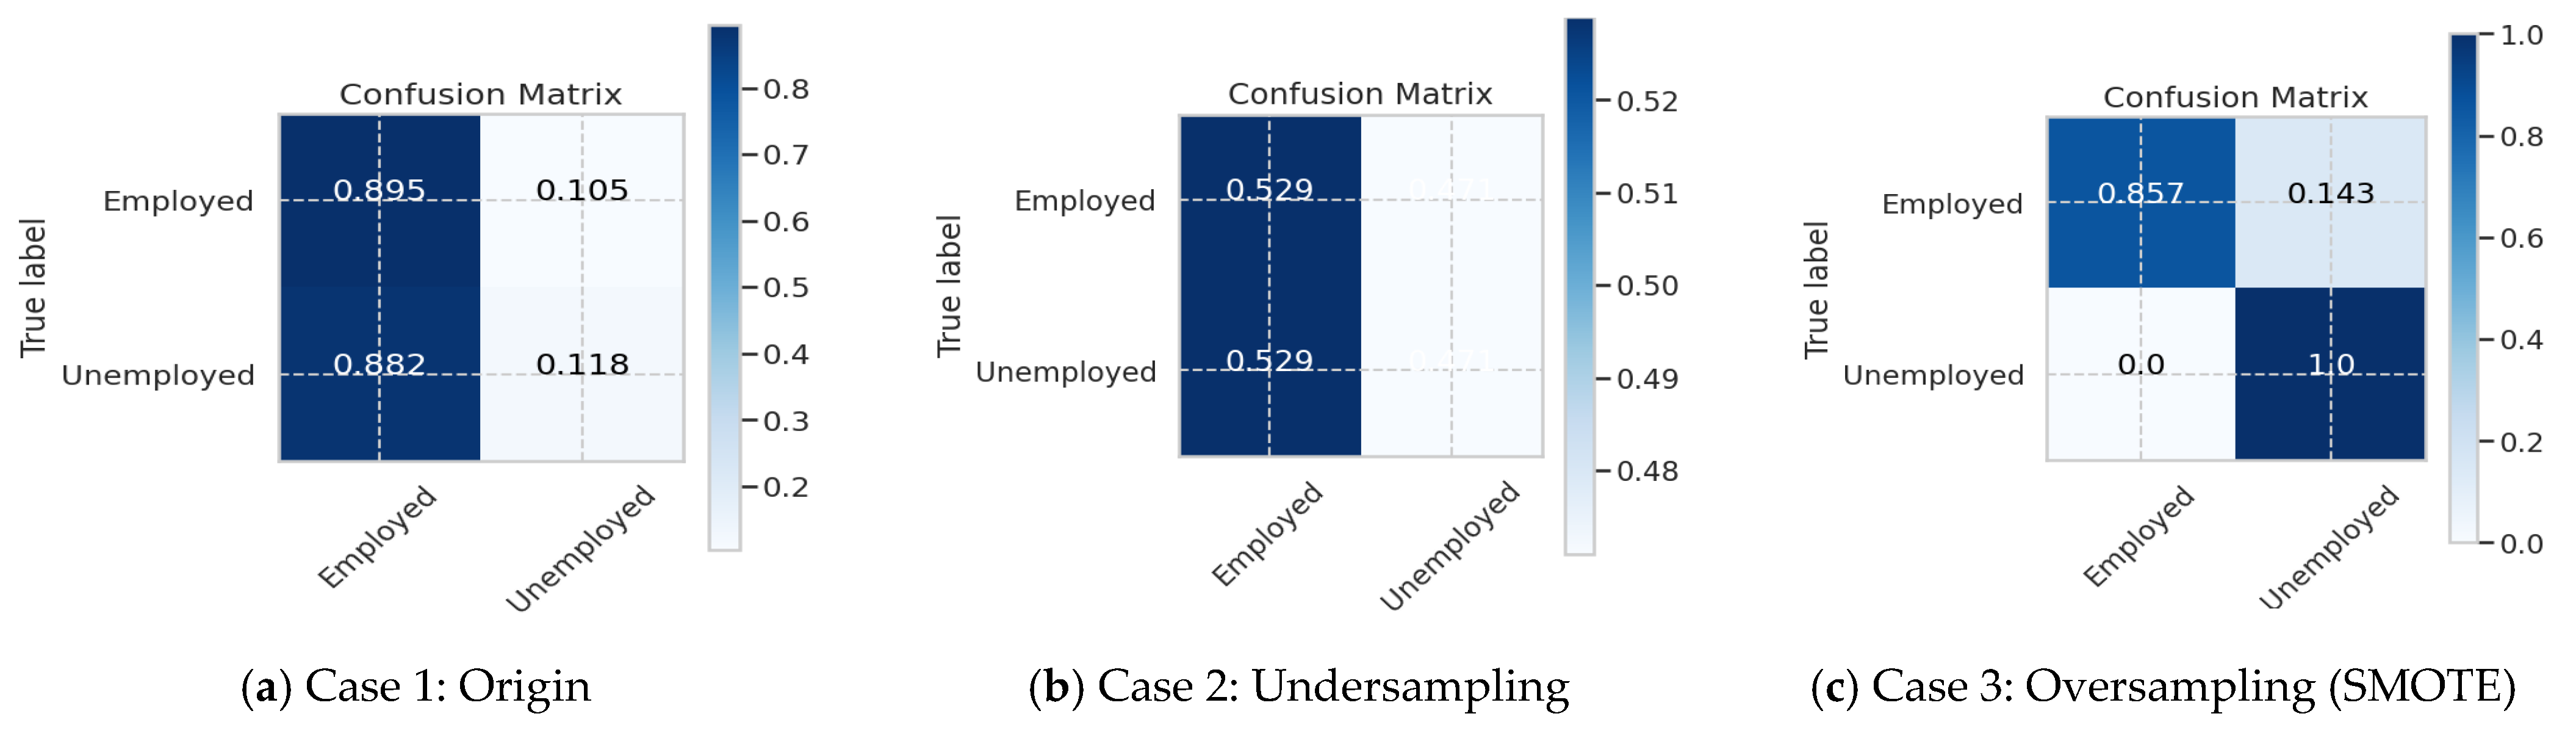
4. Results
4.1. Results of the Classification
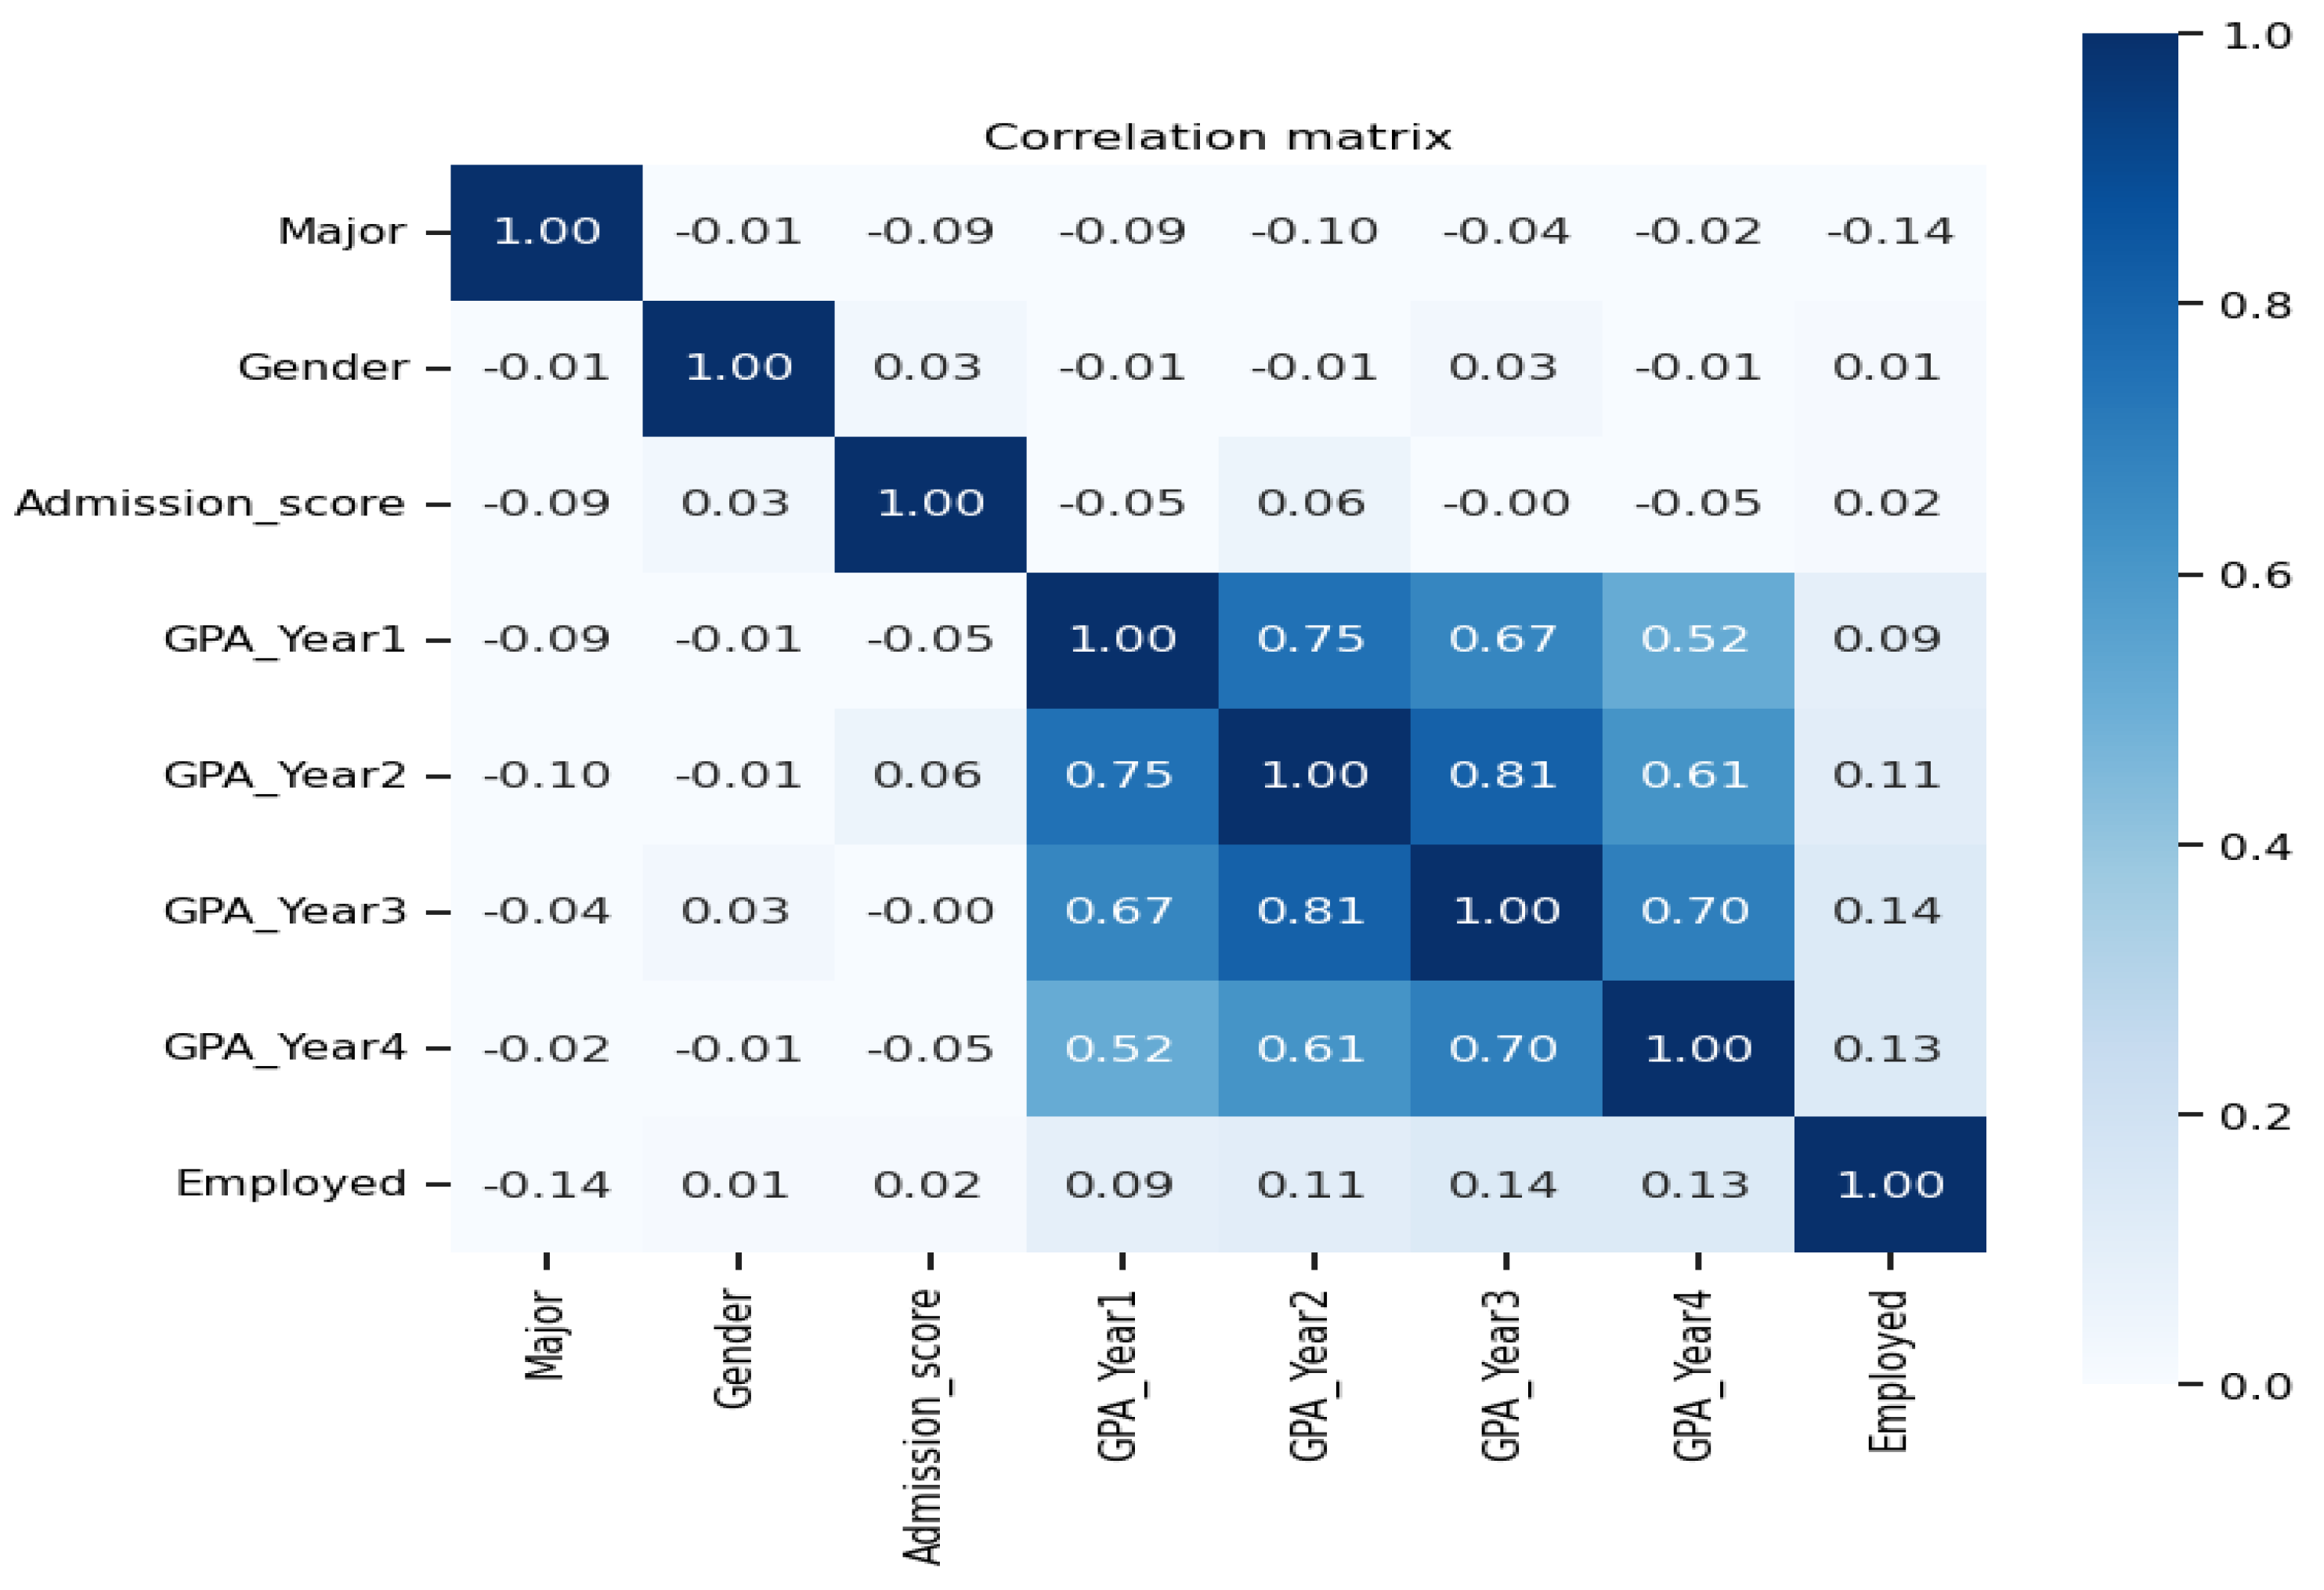
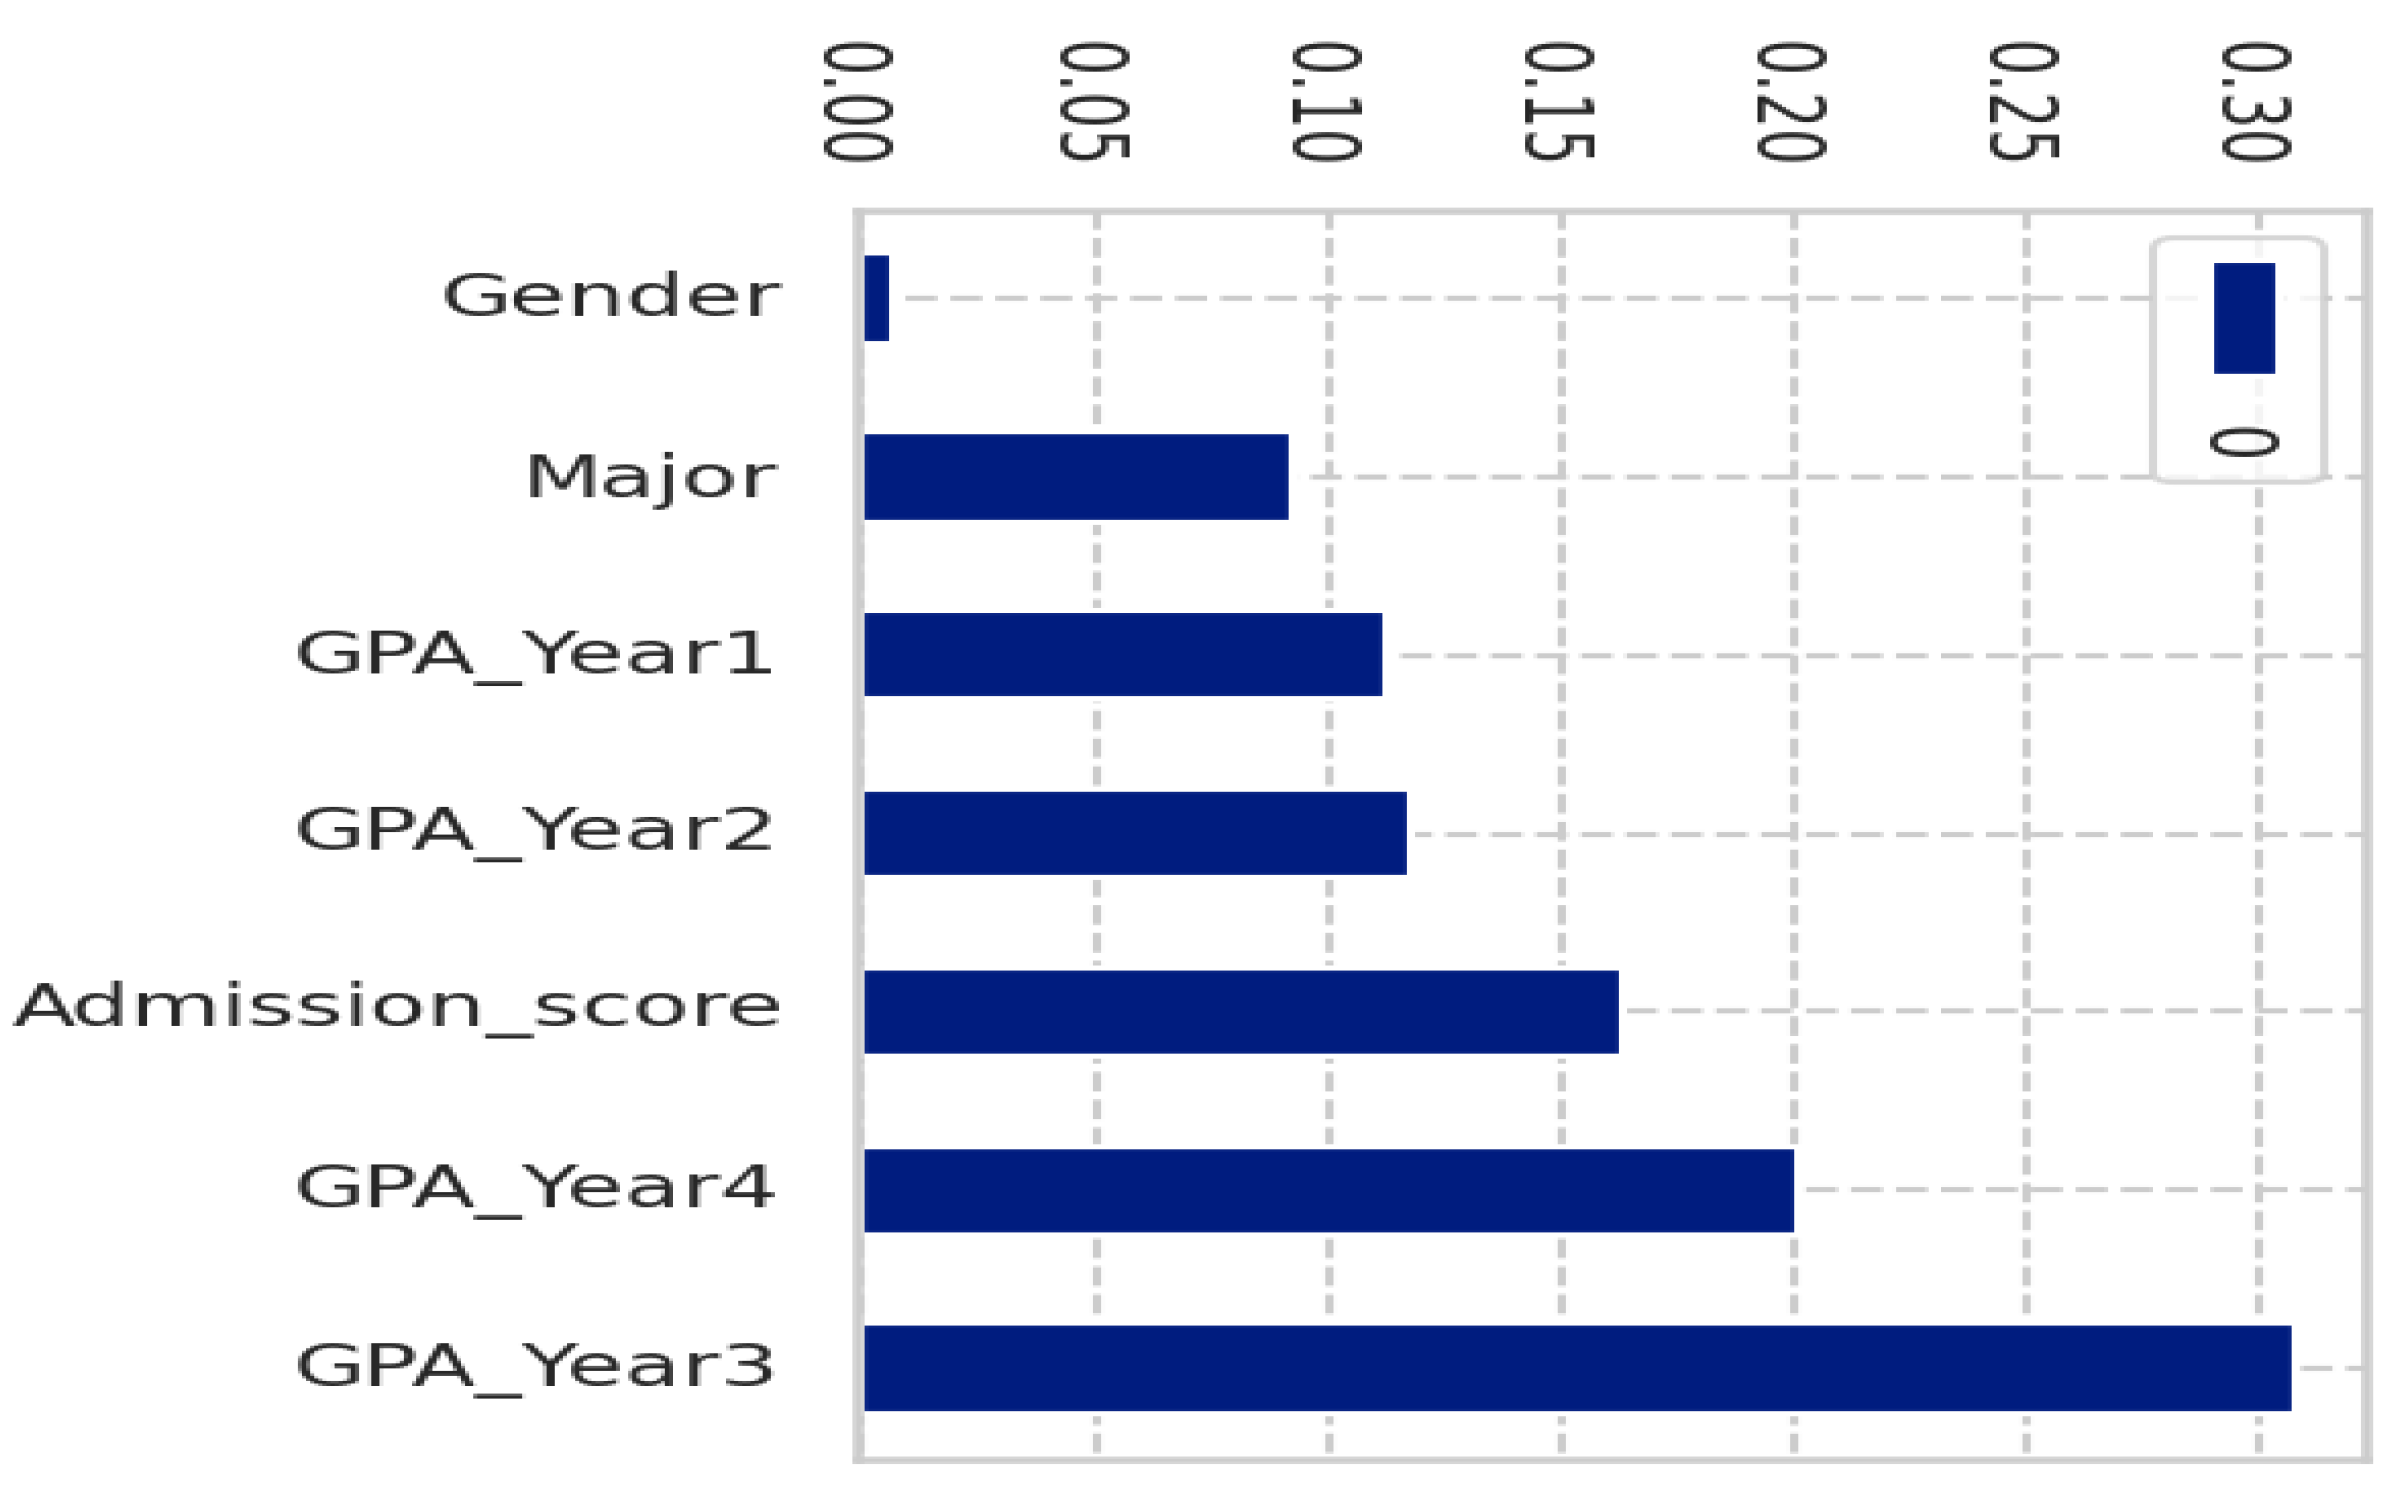
4.2. Results of Importance Features
5. Discussion
5.1. Research Findings
- Employment: Rules 1~8
- (1)
- If GPA_Year 3 = 5.85~8.32, GPA_Year 4 ≤ 8.54, and Major ≤ 20.5, then employability = Yes;
- (2)
- If Admission score > 18.64, GPA_Year 3 > 8.2, and GPA_Year 4 ≤ 8.8, then employability= Yes;
- (3)
- If Major = 1~1, GPA_Year 2 = 6.65~6.92, and GPA_Year 3 > 6.63, then employability= Yes;
- (4)
- If GPA_Year 4 > 8.54, then employability= Yes;
- (5)
- If GPA_Year 3 > 5.84 and Major ≤ 4.5, then employability= Yes;
- (6)
- If Major = 16~21, Admission score ≤ 17.17, and GPA_Year 3 > 6.77, then employability= Yes;
- (7)
- If Major = 6~21 and Admission score: ≤ 16.23, then employability= Yes;
- (8)
- If Gender = Male, Admission score: > 17.43, and GPA_Year 1 > 7.7, then employability= Yes.
- Unemployment: Rules 9~14
- (9)
- If Major = 18~21, Admission score ≤ 20.87, and GPA_Year 1 ≤ 7.16, then employability= No;
- (10)
- If Admission score < 17.9 and GPA_Year 3 = 5.81~ 6.63, then employability= No;
- (11)
- If Major = 5~21, Gender = Female, GPA_Year 2 = 7.52~8.48, GPA_Year 3 > 8.23, and GPA_Year 4 > 8.85, then employability= No;
- (12)
- If Major = 5 ~16, Gender = Female, GPA_Year 2 ≤ 7.52, and GPA_Year 3 > 7.85, then employability= No;
- (13)
- If Gender = Male and GPA_Year 1 < 7.77, then employability= No;
- (14)
- If Major = 5~7, GPA_Year 1 ≤ 6.57, and GPA_Year 2 = 6.37~6.92, then employability= No.
- In the academic curriculum of the research university, the third and fourth years consist of professional subjects and industry internships, which are very much in demand by recruiters and potentially provide job offers after internships. Graduates of almost all majors, except Tourism, with a high GPA in year 3 (ranging from 5.85 to 8.32 points) and in year 4 (≤ 8.54 points) are employable within 6 months after graduation. Under a similar situation, students whose GPA in their third year is lower than 5.81 are not employable even if they have high admission scores;
- The university entrance exam score is important for recent graduates’ employability. It has a strong relationship with their GPA in the third year. Students with admission scores of > 18.64 points, which is 2 points higher than the minimum score, and a GPA in their third year higher than 8.23 points, will be employed. Students with admission scores lower than 17.9 points and a GPA in year 3 between 5.81~6.63 points will be unemployed;
- Most majors provided by the research university, except Tourism, majorly contribute to the early employability of recent graduates. Graduates of Tourism are unemployed perhaps resulting from the effect of post-COVID-19 pandemic.
5.2. Discussions on Research Findings
- Course description
- Learning outcomes
| Learning Outcomes/Objectives | Boom’s level |
| (1) Know |
| (2) Understand |
| (3) Apply |
| (4) Analyze |
| (5) Evaluate |
| (6) Create |
6. Conclusions
6.1. Concluding Remarks
| Source | Research Context | Research Major/Field of Study | Graduation Time | Data Collection Method | Accuracy Performance | Most Influential Factors |
|---|---|---|---|---|---|---|
| Mishra et al. [13] | India | Master-degree graduates of Computer Applications | Unclear | Questionnaire | 70.19% | Course projects, third-semester GPA, and academic hours |
| He et al. [30] | China | Computer Applications | 2016 | School | 77.18% | Academic achievement and graduation qualification |
| Alkashami et al. [31] | Jordan | Information technology, Computer science, engineering | 2015–2019 | School | 82.4% | X |
| Jantawan and Tsai [43] | Thailand | Computer science and information technology | 12 months since graduation | Local goverment | 98.3% | X |
| Casuat and Festijo [16] | The Philippines | Engineering (on-the-job students) | 2015–2019 | Career Center of Technological Institute (on-the-job training faculty) | 85% | X |
| This study | Vietnam’s Mekong Delta | 21 majors/fields of study | Within 6 months of graduation | School database | 93.6% | Third-year GPA, university entrance scores, and final-year GPA |
6.2. Limitation and Future Works
Author Contributions
Funding
Data Availability Statement
Acknowledgments
Conflicts of Interest
References
- Oliver, B. Teaching to promote graduate employability. In University Teaching in Focus; Routledge: London, UK, 2021; pp. 201–216. [Google Scholar]
- Kumar, M.S.; Babu, G.P. Comparative study of various supervised machine learning algorithms for an early effective prediction of the employability of students. J. Engineer. Sci. 2019, 10, 240–251. [Google Scholar]
- Bird, S.A. Community of Practice in a Seminar Setting: An Action Research Approach to Graduate Employability and Skills in Higher Education. Ph.D. Thesis, University of the West of England, Bristol, UK, 2023. [Google Scholar]
- Shibuya, S. Urbanization, jobs, and the family in the Mekong delta, Vietnam. J. Compar. Fami. Stu. 2018, 49, 93–108. [Google Scholar] [CrossRef]
- Vo, L.V.; Nguyen, L.; Le, U.V. The Status of provincial universities in the Mekong Delta area of Vietnam. Inter. J. Innova. Creat. Chan. 2020, 11, 105–120. [Google Scholar]
- Tran, T.T. Is graduate employability the ‘whole-of-higher-education-issue’? J. Edu. Work 2015, 28, 207–227. [Google Scholar] [CrossRef]
- General Statistics Office of Vietnam. Education. 2020. Available online: https://www.gso.gov.vn/en/px-web/?pxid=E1019&theme=Education (accessed on 15 May 2024).
- General Statistics Office of Vietnam. Education. 2024. Available online: https://www.gso.gov.vn/en/px-web/?pxid=E0263&theme=Population%20and%20Employment (accessed on 15 May 2024).
- Nguyen, V.T.; Peiró, J.M.; Le, Q.C.; González-Romá, V.; Martinez-Tur, V. Vietnamese Graduates’ Labour Market Entry and Employment: A Tracer Study; Uppsala University: Uppsala, Sweden, 2020. [Google Scholar]
- Thang, P.V.M.; Wongsurawat, W. Enhancing the employability of IT graduates in Vietnam. High. Edu. Skill. Work-Based Learn. 2016, 6, 146–161. [Google Scholar] [CrossRef]
- Phan, V.T.T.; Nguyen, L.D.T.; Nguyen, K.D. Twenty-First century essential employability skills for English as a foreign language undergraduate in a context of the Mekong Delta. Euro. J. Edu. Res. 2022, 11, 1089–1102. [Google Scholar] [CrossRef]
- Curuksu, J.D. Data Driven. An Introduction to Management Consulting in the 21st Century; Management for Professionals; Springer: Cham, Switzerland, 2018. [Google Scholar] [CrossRef]
- Mishra, T.; Kumar, D.; Gupta, S. Students’ employability prediction model through data mining. Inter. J. Appl. Eng. Res. 2016, 11, 2275–2282. [Google Scholar]
- Rattan, V.; Mittal, R.; Singh, J. Generative AI with ensemble machine learning framework for computer science graduates employability prediction using educational big data. Inter. J. Com. Digi. Sys. 2024, 17, 1–15. [Google Scholar] [CrossRef]
- Huynh-Cam, T.T.; Chen, L.S.; Lu, T.C. Early prediction models and crucial factor extraction for first-year undergraduate student dropouts. J. Appli. Res. High. Edu. 2024, 17, 624–639. [Google Scholar] [CrossRef]
- Casuat, C.D.; Festijo, E.D. Predicting Students’ Employability Using Machine Learning Approach. In Proceedings of the 2019 IEEE 6th International Conference on Engineering Technologies and Applied Sciences (ICETAS), Kuala Lumpur, Malaysia, 20–21 December 2019; pp. 1–5. [Google Scholar]
- Jayachandran, S.; Joshi, B. Customized support vector machine for predicting the employability of students pursuing engineering. Inter. J. Infor. Tech. 2024, 16, 3193–3204. [Google Scholar] [CrossRef]
- ElSharkawy, G.; Helmy, Y.; Yehia, E. Employability prediction of information technology graduates using machine learning algorithms. Inter. J. Advan. Com. Sci. App. 2022, 13, 359–367. [Google Scholar] [CrossRef]
- Pinto, L.H.; Ramalheira, D.C. Perceived employability of business graduates: The effect of academic performance and extracurricular activities. J. Vocation. Behav. 2017, 99, 165–178. [Google Scholar] [CrossRef]
- He, H.; Garcia, E.A. Learning from imbalanced data. IEEE Trans. Know. Data Eng. 2009, 21, 1263–1284. [Google Scholar]
- Chawla, N.V.; Bowyer, K.W.; Hall, L.O.; Kegelmeyer, W.P. SMOTE: Synthetic Minority Over-sampling Technique. J. Arti. Intel. Res. 2002, 16, 321–357. [Google Scholar] [CrossRef]
- Drummond, C.; Holte, R.C. C4.5, class imbalance, and cost sensitivity: Why under-sampling beats over-sampling. In Workshop on Learning from Imbalanced Datasets II; ICML: Washington, DC, USA, 2003. [Google Scholar]
- Behle, H. Students’ and graduates’ employability. A framework to classify and measure employability gain. Policy Rev. High. Edu. 2020, 4, 105–130. [Google Scholar] [CrossRef]
- Menon, M.E.; Pashourtidou, N.; Polycarpou, A.; Pashardes, P. Students’ expectations about earnings and employment and the experience of recent university graduates: Evidence from Cyprus. Inter. J. Edu. Develop. 2012, 32, 805–813. [Google Scholar] [CrossRef]
- Tavares, O. The role of students’ employability perceptions on Portuguese higher education choices. J. Edu. Work 2017, 30, 106–121. [Google Scholar] [CrossRef]
- Rowe, A.D.; Zegwaard, K.E. Developing graduate employability skills and attributes: Curriculum enhancement through work-integrated learning. Asia-Pac. J. Coop. Educ. 2017, 18, 87–99. [Google Scholar]
- Murtagh, F.; Devlin, K. The development of data science: Implications for education, employment, research, and the data revolution for sustainable development. Big Data Cog. Comp. 2018, 2, 14. [Google Scholar] [CrossRef]
- Bennett, D.; Knight, E.; Li, I. The impact of pre-entry work experience on university students’ perceived employability. J. Further High. Edu. 2023, 47, 1140–1154. [Google Scholar] [CrossRef]
- Prastika, N.D.; Amalia, S.; Wardani, R.; Anggraini, F. Revealing the work readiness of fresh graduates in the capital city environment new country. Daengku J. of Human. Soc. Sci. Inno. 2022, 2, 656–663. [Google Scholar]
- He, S.; Li, X.; Chen, J. Application of Data Mining in Predicting College Graduates Employment. In Proceedings of the 2021 4th International Conference on Artificial Intelligence and Big Data (ICAIBD), Chengdu, China, 28–31 May 2021; pp. 65–69. [Google Scholar]
- Alkashami, M.; Taamneh, A.; Khadragy, S.; Shwedeh, F.; Aburayya, A.; Salloum, S. AI different approaches and ANFIS data mining: A novel approach to predicting early employment readiness in middle eastern nations. Inter. J. Data Net. Sci. 2023, 7, 1267–1282. [Google Scholar] [CrossRef]
- Baffa, M.H.; Miyim, M.A.; Dauda, A.S. Machine learning for predicting students’ employability. UMYU Sci. 2023, 2, 001–009. [Google Scholar]
- Chang, J.R.; Chen, M.Y.; Chen, L.S.; Chien, W.T. Recognizing important factors of influencing trust in O2O models: An example of Opentable. Soft Comp. 2020, 24, 7907–7923. [Google Scholar] [CrossRef]
- Chen, L.S.; Chang, P.C. Identifying Crucial Website Quality Factors of Virtual Communities. In Proceedings of the International Multi Conference of Engineers and Computer Scientists (IMECS 2010), Hong Kong, 17–19 March 2010; pp. 487–492. [Google Scholar]
- Othman, Z.; Shan, S.W.; Yusoff, I.; Kee, C.P. Classification techniques for predicting graduate employability. Inter. J. Adv. Sci. Engineer. Infor. Tech. 2018, 8, 1712–1720. [Google Scholar] [CrossRef]
- Gong, H.; Zhou, C.; Chen, Y.; Teng, C. Analysis on the influencing factors of graduate employment quality based on training data mining. In Proceedings of the 2020 International Conference on Information Science and Education (ICISE-IE), Sanya, China, 4–6 December 2020; pp. 209–214. [Google Scholar]
- Haque, R.; Quek, A.; Ting, C.Y.; Goh, H.N.; Hasan, M.R. Classification techniques using machine learning for graduate student employability predictions. Inter. J. Adv. Sci. Engineer. Infor. Tech. 2024, 14, 45. [Google Scholar] [CrossRef]
- Kaushik, A. Gini Impurity and Entropy for Decision Tree. Available online: https://medium.com/@arpita.k20/gini-impurity-and-entropy-for-decision-tree-68eb139274d1#:~:text=Gini%20Impurity%20measures%20how%20well,tree%20to%20the%20leaf%20node (accessed on 30 April 2025).
- Huynh-Cam, T.T.; Chen, L.S.; Nguyen, V.C.; Nguyen, T.H.; Lu, T.C. Why first-year e-students are dissatisfied: Machine learning methods for enhancing retention. Inter. J. Appli. Sci. Engineer. 2024, 21, 2023532. [Google Scholar] [CrossRef]
- Salas-Velasco, M. Mapping the (mis) match of university degrees in the graduate labor market. J. Labour Market Res. 2021, 55, 14. [Google Scholar] [CrossRef]
- Jung, J.; Wang, Y.; Sanchez Barrioluengo, M. A scoping review on graduate employability in an era of ‘Technological Unemployment’. Higher Edu. Res. Develop. 2024, 43, 542–562. [Google Scholar] [CrossRef]
- University of Arkansas. Using Bloom’s Taxonomy to Write Effective Learning Objectives. 2022. Available online: https://tips.uark.edu/using-blooms-taxonomy/#gsc.tab=0 (accessed on 1 February 2025).
- Jantawan, B.; Tsai, C.F. The application of data mining to build classification model for predicting graduate employment. arXiv 2013, arXiv:1312.7123. [Google Scholar]
- Mohseni, S.; Zarei, N.; Ragan, E.D. A multidisciplinary survey and framework for design and evaluation of explainable AI systems. ACM Trans. Inter. Intel. Sys. TIIS 2021, 11, 1–45. [Google Scholar] [CrossRef]
- Ali, S.; Abuhmed, T.; El-Sappagh, S.; Muhammad, K.; Alonso-Moral, J.M.; Confalonieri, R.; Herrera, F. Explainable Artificial Intelligence (XAI): What we know and what is left to attain Trustworthy Artificial Intelligence. Info. Fusion 2023, 99, 101805. [Google Scholar] [CrossRef]

| No. | Factor Names | Distribution | Frequency | Percentage |
|---|---|---|---|---|
| 1 | Field of study | Social works | 08 | 1.31 |
| Political education | 07 | 1.15 | ||
| Pre-school education | 97 | 15.9 | ||
| Physical education | 08 | 1.31 | ||
| Primary education | 42 | 6.89 | ||
| Accounting | 67 | 10.98 | ||
| Information and Communication | 30 | 4.92 | ||
| English linguistics | 71 | 11.64 | ||
| Chinese linguistics | 75 | 12.3 | ||
| Agriculture | 09 | 1.48 | ||
| Aquaculture | 23 | 3.77 | ||
| Cultural management | 04 | 0.66 | ||
| Business administration | 30 | 4.92 | ||
| Musical education | 14 | 2.3 | ||
| Chemistry education | 12 | 1.97 | ||
| History education | 02 | 0.33 | ||
| Literature education | 21 | 3.44 | ||
| English teacher education | 19 | 3.11 | ||
| Mathematic education | 13 | 2.13 | ||
| Finance and Banking | 26 | 4.26 | ||
| Tourism | 32 | 5.25 | ||
| 2 | Gender | Female | 444 | 72.79 |
| Male | 166 | 27.21 | ||
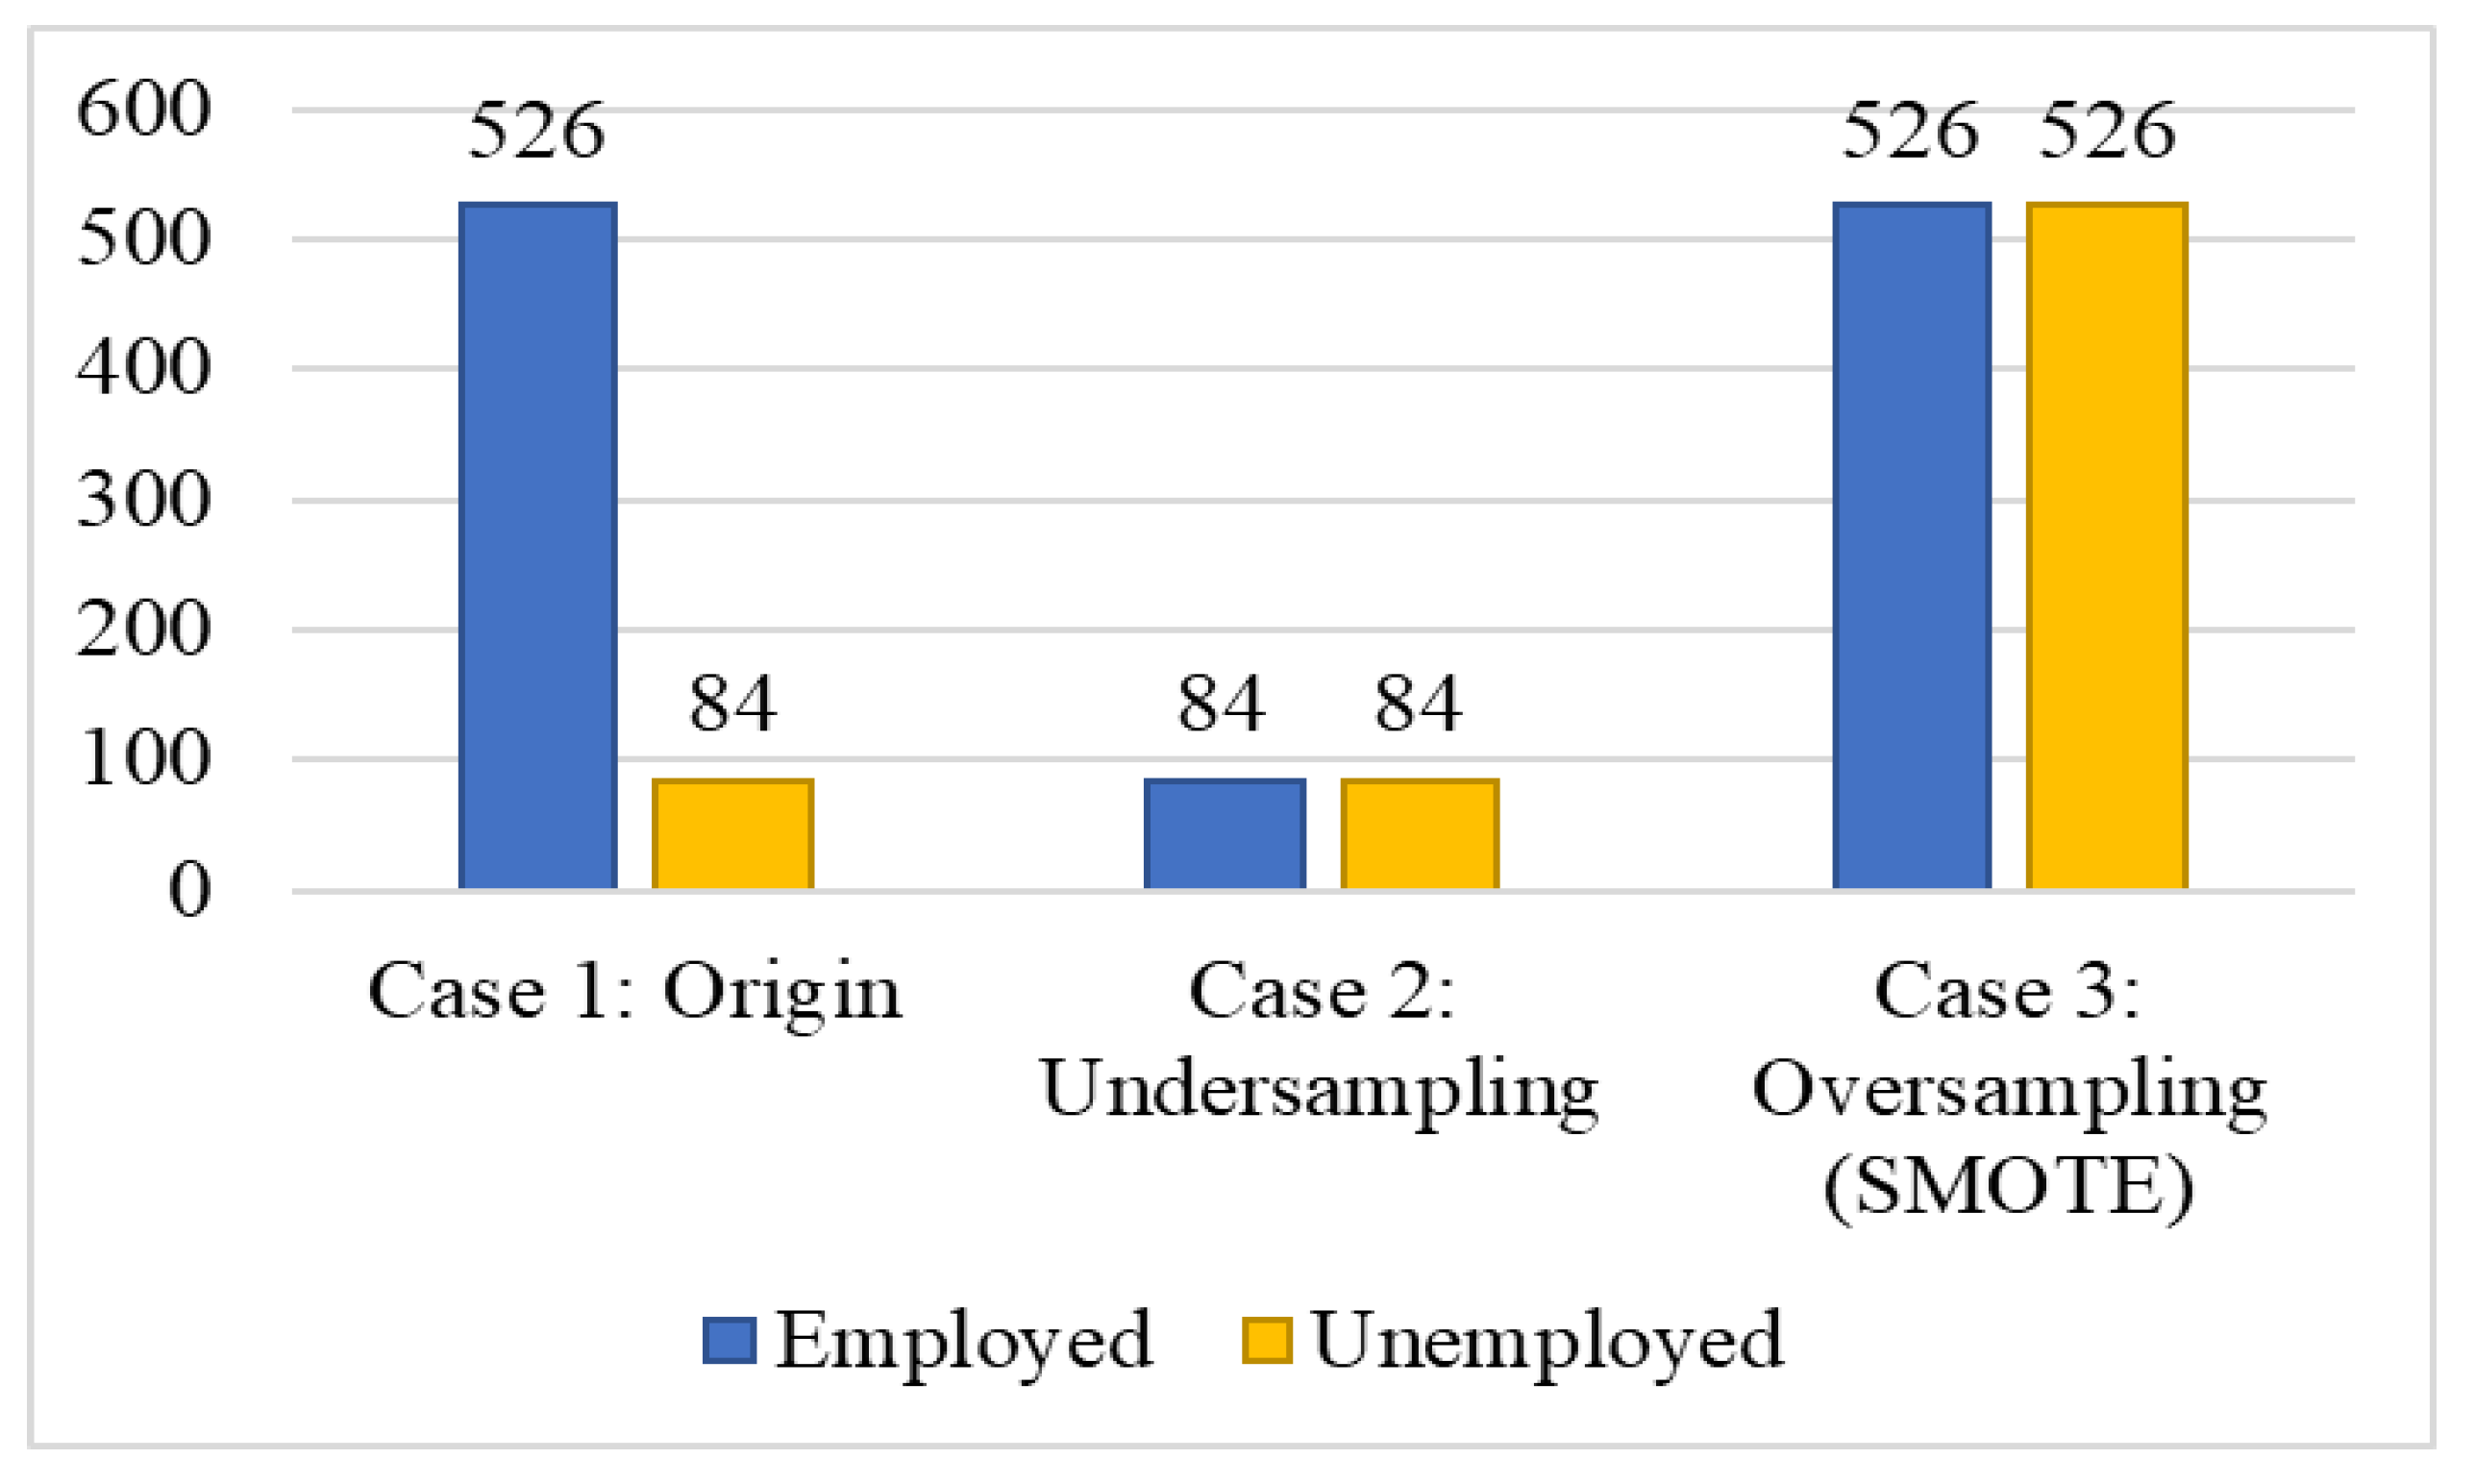
| 3 | Employment status | Employed in < 6 months | 526 | 86.23 |
| Unemployed < 6 months | 84 | 13.77 |
| No. | Factor | Description | Type | Preprocessed/Transferred Values |
|---|---|---|---|---|
| 1 | Major | Fields of study in the degree programs that recent graduates were enrolled in. | Category | 1 = Social works, 2 = Political education, 3 = Pre-school education, 4 = Physical education, 5 = Primary education, 6 = Accounting, 7 = Information and Communication, 8 = English linguistics, 9 = Chinese linguistics, 10 = Agriculture, 11 = Aquaculture, 12 = Cultural management, 13 = Business admiration, 14 = Musical education, 15 = Chemistry education, 16 = History education, 17 = Literature education, 18 = English teaching, 19 = Mathematic education, 20 = Finance and Banking, 21 = Tourism |
| 2 | Gender | The gender of recent graduates. | Category | 1 = Male, 2 = Female |
| 3 | Admission_score | The min–max scores for the university entrance exams that the recent graduates took for admission to the university. | Numeric | 14~27.5 |
| 4 | GPA_Year 1 * | Recent graduates’ GPA in the 1st year of university. | 4.32~8.73 (min–max) | |
| 5 | GPA_Year 2 * | Recent graduates’ GPA in the 2nd year of university. | 4.15~8.87 (min–max) | |
| 6 | GPA_Year 3 * | Recent graduates’ GPA in the 3rd year of university. | 5.60~9.47 (min–max) | |
| 7 | GPA_Year 4 * | Recent graduates’ GPA in the 4th year of university. | 7.03~9.51 (min–max) | |
| 8 | Output (class label): Employed | Graduates were employed or unemployed within 6 months after graduation. | Category | 1 = Employed, 0 = Unemployed |
| Model | Case 1 Origin | Case 2 Undersampling | Case 3 Oversampling (SMOTE) |
|---|---|---|---|
| Mean (SD) | Mean (SD) | Mean (SD) | |
| C5.0 | 85.81 (1.71) | 52.6 (3.17) | 71.32 (2.94) |
| CART | 76.23 (3.26) | 56.28 (6.69) | 93.60 (1.49) |
| SVM | 86.00 (0.00) | 53.89 (9.80) | 62.10 (3.11) |
Disclaimer/Publisher’s Note: The statements, opinions and data contained in all publications are solely those of the individual author(s) and contributor(s) and not of MDPI and/or the editor(s). MDPI and/or the editor(s) disclaim responsibility for any injury to people or property resulting from any ideas, methods, instructions or products referred to in the content. |
© 2025 by the authors. Licensee MDPI, Basel, Switzerland. This article is an open access article distributed under the terms and conditions of the Creative Commons Attribution (CC BY) license (https://creativecommons.org/licenses/by/4.0/).
Share and Cite
Chen, L.-S.; Huynh-Cam, T.-T.; Nguyen, V.-C.; Lu, T.-C.; Le-Huynh, D.-K. Predicting Early Employability of Vietnamese Graduates: Insights from Data-Driven Analysis Through Machine Learning Methods. Big Data Cogn. Comput. 2025, 9, 134. https://doi.org/10.3390/bdcc9050134
Chen L-S, Huynh-Cam T-T, Nguyen V-C, Lu T-C, Le-Huynh D-K. Predicting Early Employability of Vietnamese Graduates: Insights from Data-Driven Analysis Through Machine Learning Methods. Big Data and Cognitive Computing. 2025; 9(5):134. https://doi.org/10.3390/bdcc9050134
Chicago/Turabian StyleChen, Long-Sheng, Thao-Trang Huynh-Cam, Van-Canh Nguyen, Tzu-Chuen Lu, and Dang-Khoa Le-Huynh. 2025. "Predicting Early Employability of Vietnamese Graduates: Insights from Data-Driven Analysis Through Machine Learning Methods" Big Data and Cognitive Computing 9, no. 5: 134. https://doi.org/10.3390/bdcc9050134
APA StyleChen, L.-S., Huynh-Cam, T.-T., Nguyen, V.-C., Lu, T.-C., & Le-Huynh, D.-K. (2025). Predicting Early Employability of Vietnamese Graduates: Insights from Data-Driven Analysis Through Machine Learning Methods. Big Data and Cognitive Computing, 9(5), 134. https://doi.org/10.3390/bdcc9050134