Article

Discovering Key Successful Factors of Mobile Advertisements Using Feature Selection Approaches

1
Department of Applied English, Chaoyang University of Technology, Taichung City 413310, Taiwan
2
Department of Information Management, Chaoyang University of Technology, Taichung City 413310, Taiwan
3
Department of Industrial Engineering and Management, National Taipei University of Technology, Taipei 106344, Taiwan
*
Author to whom correspondence should be addressed.
Big Data Cogn. Comput. 2025, 9(5), 119; https://doi.org/10.3390/bdcc9050119
Submission received: 9 March 2025 / Revised: 1 May 2025 / Accepted: 2 May 2025 / Published: 5 May 2025

Abstract

:
Programmatic buying has attracted growing interest from manufacturers and has become a driving force behind the growth of digital advertising. Among various formats, mobile advertisements (ads) have emerged as a preferred choice over traditional ones due to their advanced automation, adaptability, and cost-effectiveness. Despite their increasing adoption, academic research on mobile ads remains relatively limited. Unlike conventional statistical analysis techniques, the proposed feature selection methods eliminate the need for assumptions related to data properties such as independence, normal distribution, and constant variance in regression. Additionally, feature selection techniques have recently gained traction in big data analysis, addressing the limitations inherent in traditional statistical approaches. Consequently, this study aims to determine the key success factors of mobile ads in fostering customer loyalty, offering advertisers valuable insights for optimizing mobile ad design. This study begins by identifying potential factors influencing mobile advertising effectiveness. Then, it applies Support Vector Machine Recursive Feature Elimination (SVM-RFE), correlation-based selection, and consistency-based selection methods to determine the key drivers of customer retention. The findings reveal that “Price” and “Preference” are the most significant contributors to enhancing repurchase intention. Moreover, factors such as “Language”, “Perceived Usefulness”, “Interest”, “Mobile Device”, and “Informativeness” are also essential in maximizing the effectiveness of mobile advertising.

1. Introduction

Due to the COVID-19 pandemic, a significant portion of consumer behavior has shifted from in-store to online purchases [1]. As a result, many businesses have refocused their sales strategies on digital platforms. Programmatic buying is one of the leading developments supporting this transformation, which refers to using computer algorithms to deliver the right advertisement to the right consumer at the right time. In Taiwan, the programmatic buying market grew by over 30% in 2022, with 70% of advertisers adopting it and nearly half reporting satisfaction with the results [2]. Programmatic buying has thus become a driving force in the growth of digital advertising [3].
Programmatic advertising, a core component of programmatic buying, leverages big data and automated decision-making technologies to deliver highly personalized marketing messages. This includes real-time bidding, audience segmentation, and ad placement optimization [4]. In 2019, over 60% of the global digital advertising spend (USD 333.25 billion) was allocated to programmatic channels. Despite widespread adoption, academic research on programmatic advertising remains limited, especially within mobile contexts [5].
Simultaneously, the proliferation of mobile devices has dramatically changed consumer behavior and increased reliance on mobile commerce [6,7]. Mobile advertising—the delivery of promotional content through mobile platforms—has emerged as a dominant form of digital advertising [8]. It extends beyond traditional display ads to include formats on social media, video platforms, and native in-app environments [9]. The convergence of programmatic advertising with mobile platforms has introduced new opportunities and challenges in targeting, personalization, and user engagement [10].
Mobile advertising offers marketers a flexible, cost-effective way to reach users in real-time. However, consumer acceptance varies based on content relevance, perceived usefulness, and delivery context. Past research has emphasized informativeness, entertainment value, credibility, and user engagement [11,12,13,14,15]. While studies have explored these variables using traditional statistical methods, limited work has investigated their impact using feature selection approaches. Moreover, most existing models rely on assumptions such as data normality or independence, which may not hold in real-world marketing data [16,17,18].
Despite the increasing adoption of programmatic mobile advertising, academic research remains limited, particularly regarding theoretical integration. To strengthen the conceptual foundation, this study anchors key constructs in established theories: “Perceived Usefulness” and “Ease of Use” are derived from the Technology Acceptance Model (TAM); “Credibility” aligns with the Elaboration Likelihood Model (ELM); “Preference” and “Interest” reflect the Theory of Reasoned Action (TRA); and “Informativeness” is rooted in Uses and Gratifications Theory. These linkages enhance the theoretical contribution and contextual relevance of this study. Furthermore, few studies have systematically analyzed which mobile ad factors contribute most significantly to customer loyalty. Existing research often focuses on general attitudes or behavioral intentions rather than post-purchase loyalty metrics. Additionally, firm-level variables such as brand trust or competitive positioning are frequently excluded [19,20,21].
To address these gaps, this study aims to identify critical success factors in mobile advertising that enhance customer loyalty. We adopt three feature selection techniques—Support Vector Machine Recursive Feature Elimination (SVM-RFE), correlation-based selection, and consistency-based selection—to analyze survey data without relying on strict statistical assumptions. This approach helps uncover the most influential mobile ad attributes, offering theoretical insights and practical guidance for advertisers seeking to optimize engagement and loyalty outcomes.

2. Literature Review

2.1. Programmatic Advertising

Programmatic advertising has dominated online advertising, defined as “the use of data and technology that enables marketers to make decisions about the advertisement they want to send to the customers in real-time” [2]. It was projected to account for 86.12% of all display ad spending in 2022 [1] and continues to grow with automated data processing. It relies on real-time, data-driven automation to target audiences, often individual consumers. The Mobile Marketing Association defines mobile ads as “a form of advertising that can transmit advertising messages through mobile phones, personal digital assistants (PDAs), or other wireless communication devices” [22]. Compared to traditional campaigns, programmatic advertising uses advanced software to deliver highly targeted content based on user data. Its defining feature is automation, though definitions and interpretations vary.
Programmatic buying is a key driver of digital advertising growth [3]. Despite its importance, there is no unified definition. Shehu et al. [23] and Li et al. [24] describe it as a big-data-enabled IT practice that delivers personalized content via real-time bidding. This system lets advertisers bid for ad placements to reach the right audience at the right time [5]. However, relevant academic studies remain limited [25]. Concerns arise when premium ads appear on low-quality websites, negatively affecting brand perception [23]. Thus, this study focuses on app-based advertising. Despite the rapid rise of this multi-billion-dollar industry, programmatic advertising has received limited scholarly attention [26]. Meanwhile, apps have transformed digital behavior, enabling users to consume content and shop online, especially during the pandemic. Advertising has shifted from websites to apps, making mobile ads a significant revenue source for app developers [18]. Behavioral data allow for individual-level targeting, making data quality crucial. Advertisers must build detailed user databases to enhance targeting. This study, therefore, focuses on mobile ads to identify key factors that enhance customer loyalty.

2.2. Mobile Advertising

The mobile ads market in Asia reached USD 19.6 billion in 2021 [16], highlighting its growing importance. As defined by the American Marketing Association (AMA), advertising involves delivering persuasive messages to a target audience to promote products, services, or organizations [27]. It is a core marketing tool aimed at creating, communicating, and delivering value [27]. Mobile advertising extends this concept to mobile devices, using wireless technology to encourage purchases. Consumer acceptance is crucial. Guven [28] notes that while initial reactions to mobile ads may be negative, engaging content can increase tolerance. Similarly, Lu et al. [15] argue that relevance and perceived value are key to effectiveness.
According to the authors of [29], these factors reduce intrusiveness and positively influence attitudes toward ads. Maseeh et al. [30] distinguish between perceived benefits and risks, emphasizing that users accept mobile marketing when the value outweighs the drawbacks. Tan et al. [31] reinforce this, stating that acceptance depends on relevant content. Kerst et al. [32] further suggest that consumers compare an ad’s utility to that of alternative activities; higher utility leads to more favorable attitudes.

2.3. Customer Loyalty

Kwon et al. [33] describe brand loyalty as a firm commitment to repurchase or revisit a preferred product or service continuously, even when external factors or marketing strategies attempt to influence switching behavior. This definition underscores the two widely discussed dimensions of loyalty—attitudinal and behavioral [34]. According to Liu et al. [35], behavioral loyalty is reflected in repeated purchases of a brand, whereas attitudinal loyalty signifies an intrinsic commitment stemming from the perceived unique value of the brand. Therefore, in mobile advertising, customer loyalty is understood as a dual-dimensional construct that includes behavioral repetition and attitudinal dedication.
Drawing from prior research [36], customer loyalty in online shopping is a favorable disposition toward repurchasing, influenced by advertisements. It is considered a post-purchase phenomenon, in which consumers compare expectations shaped by mobile ads with their actual experiences of a product or service [37]. Customer loyalty is a key indicator of consumer behaviors such as repeat purchases, positive word-of-mouth, and brand commitment [38]. Within the Management Information Systems (MIS) field, customer loyalty is often used as a proxy for system success and has been extensively examined in empirical studies [39]. Accordingly, this study conceptualizes customer loyalty as a consumer’s overall emotional response based on their engagement with mobile advertisements from the m-company.
As noted by the authors of [40], customer loyalty is a key determinant of net benefits and individual impact. It drives repeat purchases and encourages consumers to recommend m-products or services to others. Shahzad et al. [41] further suggested that dissatisfied customers are more inclined to seek alternative options and may be more receptive to competitors’ marketing efforts than satisfied consumers. While previous studies indicate that mobile advertising is a strong predictor of customer loyalty [15], there is still a lack of comprehensive analysis that contextualizes this relationship. Therefore, identifying and defining the key factors in mobile advertising that enhance loyalty is essential. The following section explores these determinants. In addition, we will use repurchase intention to measure customer loyalty.

2.4. Potential Factors of Mobile Advertisements

This section identifies key factors influencing mobile advertising based on existing literature. Chen and Hsieh [22] outlined six essential elements for designing personalized mobile ads: pricing strategies, consumer preferences, promotional activities, user interests, brand perception, and mobile device type. These findings offer practical guidance for industry growth. Parreño et al. [42] highlighted entertainment value, irritation, and perceived usefulness as major drivers of positive consumer attitudes. Likewise, Flores et al. [43] found that engagement level, language, and ad placement context significantly influence consumer perception. Language-based ads enhance brand affinity, while placing ads on relevant platforms captures more attention [44].
Through a study on Korean consumers, Yang et al. [45] established that five elements—perceived usefulness, ease of use, entertainment value, annoyance, and credibility—are strong indicators of mobile ad effectiveness. Chen and Liu [44] highlighted concerns about data privacy regarding how individuals aged 18 to 24 perceive mobile advertisements. Meanwhile, Kim and Han [46] emphasized that informativeness, trustworthiness, entertainment, and incentives are central to encouraging users to engage with mobile ads. These four factors were further utilized to develop a predictive model for mobile ad effectiveness [33].
Additionally, Tseng and Wei [47] pointed out that mobile ads could adopt rich media formats, where users can engage with ads by expanding their display via a “Tap-to-Expand” function to enhance customer attraction [14]. Rich media mobile advertising includes diverse formats such as animated content, floating ads, interactive video ads, and expandable advertisements [15]. In Korea, cloud computing has enabled real-time, location-based, and context-aware formats [30]. With advancements in hardware and software—such as mobile technology and cloud computing—rich media mobile advertising has evolved to offer multiple presentation styles and targeted customer engagement strategies.
Chakraborty et al. [48] also observed that social media and game-based ad elements were widely incorporated among the ten most influential mobile advertising strategies. These allow direct consumer-brand interaction via platforms like social media and personalized campaigns [44]. For instance, the global fast-food chain McDonald’s ventured into mobile advertising in July 2022, launching its first campaign that integrated social media and rich media technologies. These ads were placed on popular platforms, including Facebook, Twitter, and the National Football League (NFL) mobile sites [49]. Similarly, Macy’s strengthened its mobile commerce initiatives by utilizing interactive advertising and continuously testing its online sales strategies throughout 2021. All of the mentioned potential factors of mobile ads are given in Table 1.

3. Methods

3.1. Implemental Procedure

Feature selection plays a crucial role in data mining and machine learning, particularly in terms of handling high-dimensional data, which can negatively impact the learning performance of machine learning models [18,50]. To mitigate this, it reduces dimensionality and enhances accuracy by eliminating irrelevant or redundant features [51,52,53,54].
This study adopts SVM-RFE to identify key factors affecting user loyalty in mobile advertising. Originally used in gene selection for cancer classification [55,56], SVM-RFE applies the Support Vector Machine algorithm to assign weight rankings and iteratively removes the least significant features [52,57,58]. Widely used across fields, SVM-RFE has been applied in electricity price forecasting [59], gas sensor optimization [50], and Alzheimer’s prediction [60]. Albashish et al. [58] proposed BBO-SVM-RFE by integrating Binary Biogeography Optimization, while Chang et al. [57] used it with LASSO to identify trust criteria. It also helped identify live-streaming behavior predictors [61] and gender recognition features using gait data [62].
Tseng and Wei [47] found that integrating SVM-RFE with other methods enhances effectiveness. Thus, following Figure 1, this study applies SVM-RFE alongside two other techniques to extract critical mobile advertising factors influencing loyalty. This research builds upon previous successful studies using feature selection to handle data collected from questionnaires. For example, ref. [63] employed feature selection techniques to identify key factors influencing online learners’ performance based on data collected from a Kano-style questionnaire. Similarly, ref. [64] successfully identified critical factors of in-app purchases using feature selection methods such as SVM-RFE, DT, and IG. Ref. [65]’s IS-DT feature selection method was proposed to identify important service quality factors in programmatic buying from questionnaire data. Therefore, this study also applies feature selection methods to process data collected through questionnaires.
The implemental procedure has been clarified step by step as follows:
Step 1: Define candidate mobile ad factors
This study will collect current studies from the literature on mobile ads, collect possible factors from the literature, attempt to redefine mobile ad factors, and use these factors to design a questionnaire. The defined independent variables and their definitions are listed in Table 1. In addition, we use “repurchase intention” to measure customers’ loyalty.
Step 2: Design the questionnaire
This step began by designing a questionnaire after identifying potential mobile ad factors from the above literature on mobile ads. Each mobile ad factor was divided into two questions, found in Appendix A, with the two questions and definitions overlapping. The questionnaire is divided into two parts. Part one is about the factors that affect mobile ads and the other five scales; part two is about the basic survey of the subjects on mobile ads and the basic information of the subjects. The developed question items are provided in Appendix A.
To show how to measure independent and dependent variables, here is a brief illustrative example. We take the “game-based (No. 20)” factor as an example. According to the definition mentioned in Table 1, we can create 2 question items, which can be found in Appendix A, for measuring the independent variable and the other question item for measuring the dependent variable, as follows:
Independent variable (No. 20: game-based)
Q 39: If a mobile advertisement adopts the style of interactive mini-games (such as jigsaw puzzles, word solitaire, and guessing riddles), what do you think of it?
(A) Very important; (B) Important; (C) Neutral; (D) Unimportant; (E) Very unimportant.
Q 40: What do you think about whether the mobile advertisement is linked to the game app's content, or if the advertisement screen appears after the game ends?
(A) Very important; (B) Important; (C) Neutral; (D) Unimportant; (E) Very unimportant.
Dependent variable
Q: If an advertisement includes the above factors that you think are important or very important, and you have bought similar products (services) in this ad, will you repurchase these products (services) because you have seen this ad?
(A) Very unwilling; (B) Unwilling; (C) Neutral; (D) Willing; (E) Very willing.
Step 3: Pre-test
At this stage, the designed mobile ads questionnaire should be tested first. The questionnaires were sent to the targeted population using the Snowball sampling method in Taiwan. This method is used to distribute to the acquaintances of the subjects because the primary distribution focus is on adolescents (ages 15 to 29). Those who know them collaborate to enhance their factors. According to the respondents’ feedback, this mobile ad questionnaire was revised.
Step 4: Data collection
Data for this study were gathered both offline and online using a set of questionnaires. In order to gather the respondents’ perspectives, we circulated a set of questionnaires using the snowball sampling technique.
Step 5: Data preparation
The ordinal data of the independent variable will be encoded using values from 1 to 5 and then normalized to a range between 0 and 1. The dependent variable is repurchase intention, which is represented by 1 and 0 to indicate the presence or absence of the intention to repurchase, respectively. At this stage, the collected questionnaires are subjected to a 5-fold cross-validation method, which is divided into five equal parts, of which four parts are used as the training set, the remaining one part is used as the test set, and then five rounds are performed. The 5-fold cross-validation method can be used in the results of three feature selection methods, and the performance evaluation is more accurate.
Step 6: Feature selection
In this step, the customer loyalty variable is selected using a voting mechanism and three feature selection methods to represent the critical factors of mobile ads. The process of SVM-RFE, correlation-based, and consistency-based feature selection methods has been given in Section 3.2, Section 3.3 and Section 3.4.
Step 7: Building the SVM model
For each extracted feature subset, we will use it to build the SVM model. Suppose the smaller feature subset can perform better or have a classification similar to the original feature subset. In that case, the smaller feature subset obtained by the feature selection method has more or similar information. We know that the selected features are more important.
Step 8: Performance evaluation and drawing conclusions
This step evaluated the performance of different feature selection methods, followed by a sensitivity analysis. Finally, this study concludes with implications of the research and practice based on this evaluation.

3.2. SVM-RFE

We used the SVM-RFE method [58,66]. The SVM-RFE algorithm is given as follows in Equations (1)–(13).
Inputs:
Training examples
X 0 = [ X 1 , X 2 , , X k , , X l ] T
Class labels
y = [ y 1 , y 2 , , y k , , y l ] T
Initialize:
Subset of surviving features
s = [ 1 , 2 , , n ]
Feature ranked list
r = [ ]
Repeat until
s = [ ]
Restrict training examples to good feature indices
X = X 0 ( : , s )
Train the classifier
α = S V M t r a i n ( X , y )
Compute the weight vector of dimension length(s)
W = k α k y k x k
Compute the ranking criteria
c i = ( w i ) 2 ,   f o r   a l l   i
Find the feature with the smallest ranking criterion
f = arg min ( c )
Update the feature ranked list
r = [ s ( f ) , r ]
Eliminate the feature with the smallest ranking criterion
s = s ( 1 : f 1 ,   f + 1 ;   l e n g t h ( s ) )
Output:
Feature ranked list
r

3.3. Correlation-Based Method

This method regards each feature as an individual with the ability to predict. When the features of the subset are related to each other, the features in the subset are highly related to the category. The correlation-based method is a straightforward filter algorithm. This method will retain the highly related features to the class, while the poorly related features will be ignored, and then the retained features will be accepted by this method. The core Equation (14) is based on the correlation method [47].
M s = k r c f ¯ k + k ( k 1 ) r f f ¯
Ms is an advantage that contains k features in the feature subset S; r c f ¯ is the mean of feature-class associations ( f S), r f f ¯  and is the mean of the internal associations between features and other features; the equation can be considered a set of eigenvalues that can predict the class.
The best first method determines a greedy hill-climbing algorithm with backtracking, a regional search optimization technology that can efficiently evaluate every attribute. By adding or deleting a single attribute, its search direction can be divided into forward search and backward search. Greedy stepwise is a greedy search for the attribute subsets owned by a space. This method is similar to Best First, and it can also search in both directions, but it does not use backtracking; instead, it adds or deletes when approaching the critical point to retain the best subset of attributes. In addition, the linear forward selection is a method extended from the best first search strategy. However, it reduces the number of evaluations in the search and uses a rigorous method to generate the final subset. This method limits the expansion of the number of attributes at each stage. The method is used to determine the optimal subset size. Further, genetic search uses a simple genetic algorithm [67] to start the search by selecting attributes indexed by the number of generations, probabilities of crossover and mutation, and population size search strategy [68].

3.4. Consistency-Based Feature Selection Method

This method projects the training samples onto the subset. The attributes of the subset achieve a consistency level in the category value, and then the value contained in the attributes of the subset is evaluated. This method uses the Las Vegas Filter (LVF) algorithm [69] which is shown as below (Algorithm 1) to help the method efficiently filter out the results when selecting features. This method uses γ (allowable inconsistency ratio) to establish a standard for feature selection, reducing dimensions, and its calculus. The method is given as follows.
Algorithm 1 LVF algorithm
    Enter: MAX-TRIES,
         D—dataset;
             N—number of attributes;
             γ—allowable inconsistency rate;
      Output: A set of features that satisfy the conformance criteria.
Cbest = N;
For i = 1 to MAX-TRIES
      S = random Set(seed);
      C = num of Features(S);
      If (C<Cbest)
             if (Incon check (S, D) < γ)
                   Sbest = S; Cbest = C;
                   print_Current_Best(S);
      Else if (C = Cbest) and
(Incon check (S, D) < γ))
                   print_Current_Best(S)
      end for

4. Results and Discussion

4.1. Summary of Collected Data

In total, 482 questionnaires were filled out for this study. The sample gathered for fundamental data analysis is shown in Table 2. Most of the sample participants are male, with a percentage of 64.11%; their highest level of education is primarily a university or junior college; and their age range is primarily 20 to 29 years old, with a percentage of 65.98%; their average monthly income is primarily less than NTD 20,000 (New Taiwan Dollars), with a percentage of 83.61%; and their average daily time spent on mobile devices is primarily 3 to 6 h. Their number of mobile device purchases in a half-year is primarily less than five. In addition, the number of clicks on mobile ads in half a year is mainly 0 to 3 times, followed by 3 to 10 times, accounting for 60.17% and 30.50%, respectively. The reasons for clicking mobile ads recently, except for accidental clicks, are that they are interested in the advertised products, and that the advertisements attracted them. Accounted for 45.64% and 43.36%, the respondents found mobile ads mainly on Facebook, followed by Apps and YouTube video and audio websites, at percentages of 70.54%, 65.35%, and 54.56%, respectively. Their consumption behavior model is primarily future-focused, with purchases making up 80.70%.
The basic data analysis results show that most mobile ad locations are app-based. In-app mobile ads are preferred by 82% of developers [11], followed by the social networking site Facebook. It has been discovered that Facebook has a high exposure rate for mobile ads, allowing mobile device users to view them. It is simple to locate mobile ads. The third option is the video-sharing website YouTube. According to Susan Wojcicki, Senior Vice President of Google Advertising, nearly 50% of mobile device (mobile and tablet) users currently use YouTube (of which 50% are active) as YouTube is a repository for many mobile ads [15]. Therefore, we focus on YouTube platform. Moreover, mobile ads are often clicked unintentionally, as noted by the product manager of mobile display ads at Google, despite the increasing size of mobile phone and tablet screens. It is still easy to accidentally slide on or click links or advertisements one does not want to see. According to third-party research data, up to 50% of mobile ad clicks are accidental, which is not much different from the results of this study [14].
As a result, Google has implemented various measures to prevent false clicks, leading to a decrease in the click rate of floating reports and increased costs for advertisers. For example, in mobile image advertisements, Google identifies the picture frame as a high misclick area because users who click on adjacent content or are scrolling may accidentally touch it. It is recommended that users click on the center of the image to browse the advertising website or application, as this can reduce the burden on mobile device users and help report their click-through rate more accurately [12]. The number of samples collected in this study was tested for reliability and validity, as shown in Table 3. KMO and Bartlett were used to test their validity, and the value was 0.902 *** (when its p value was less than 0.001, it was three stars). Cronbach’s Alpha value indicates that the data can correctly measure the characteristics that this research requires. In addition, Cronbach’s Alpha value is used to test its reliability, and the values of its factors are all greater than 0.7 [20], which indicates good reliability and that the data are stable and consistent.

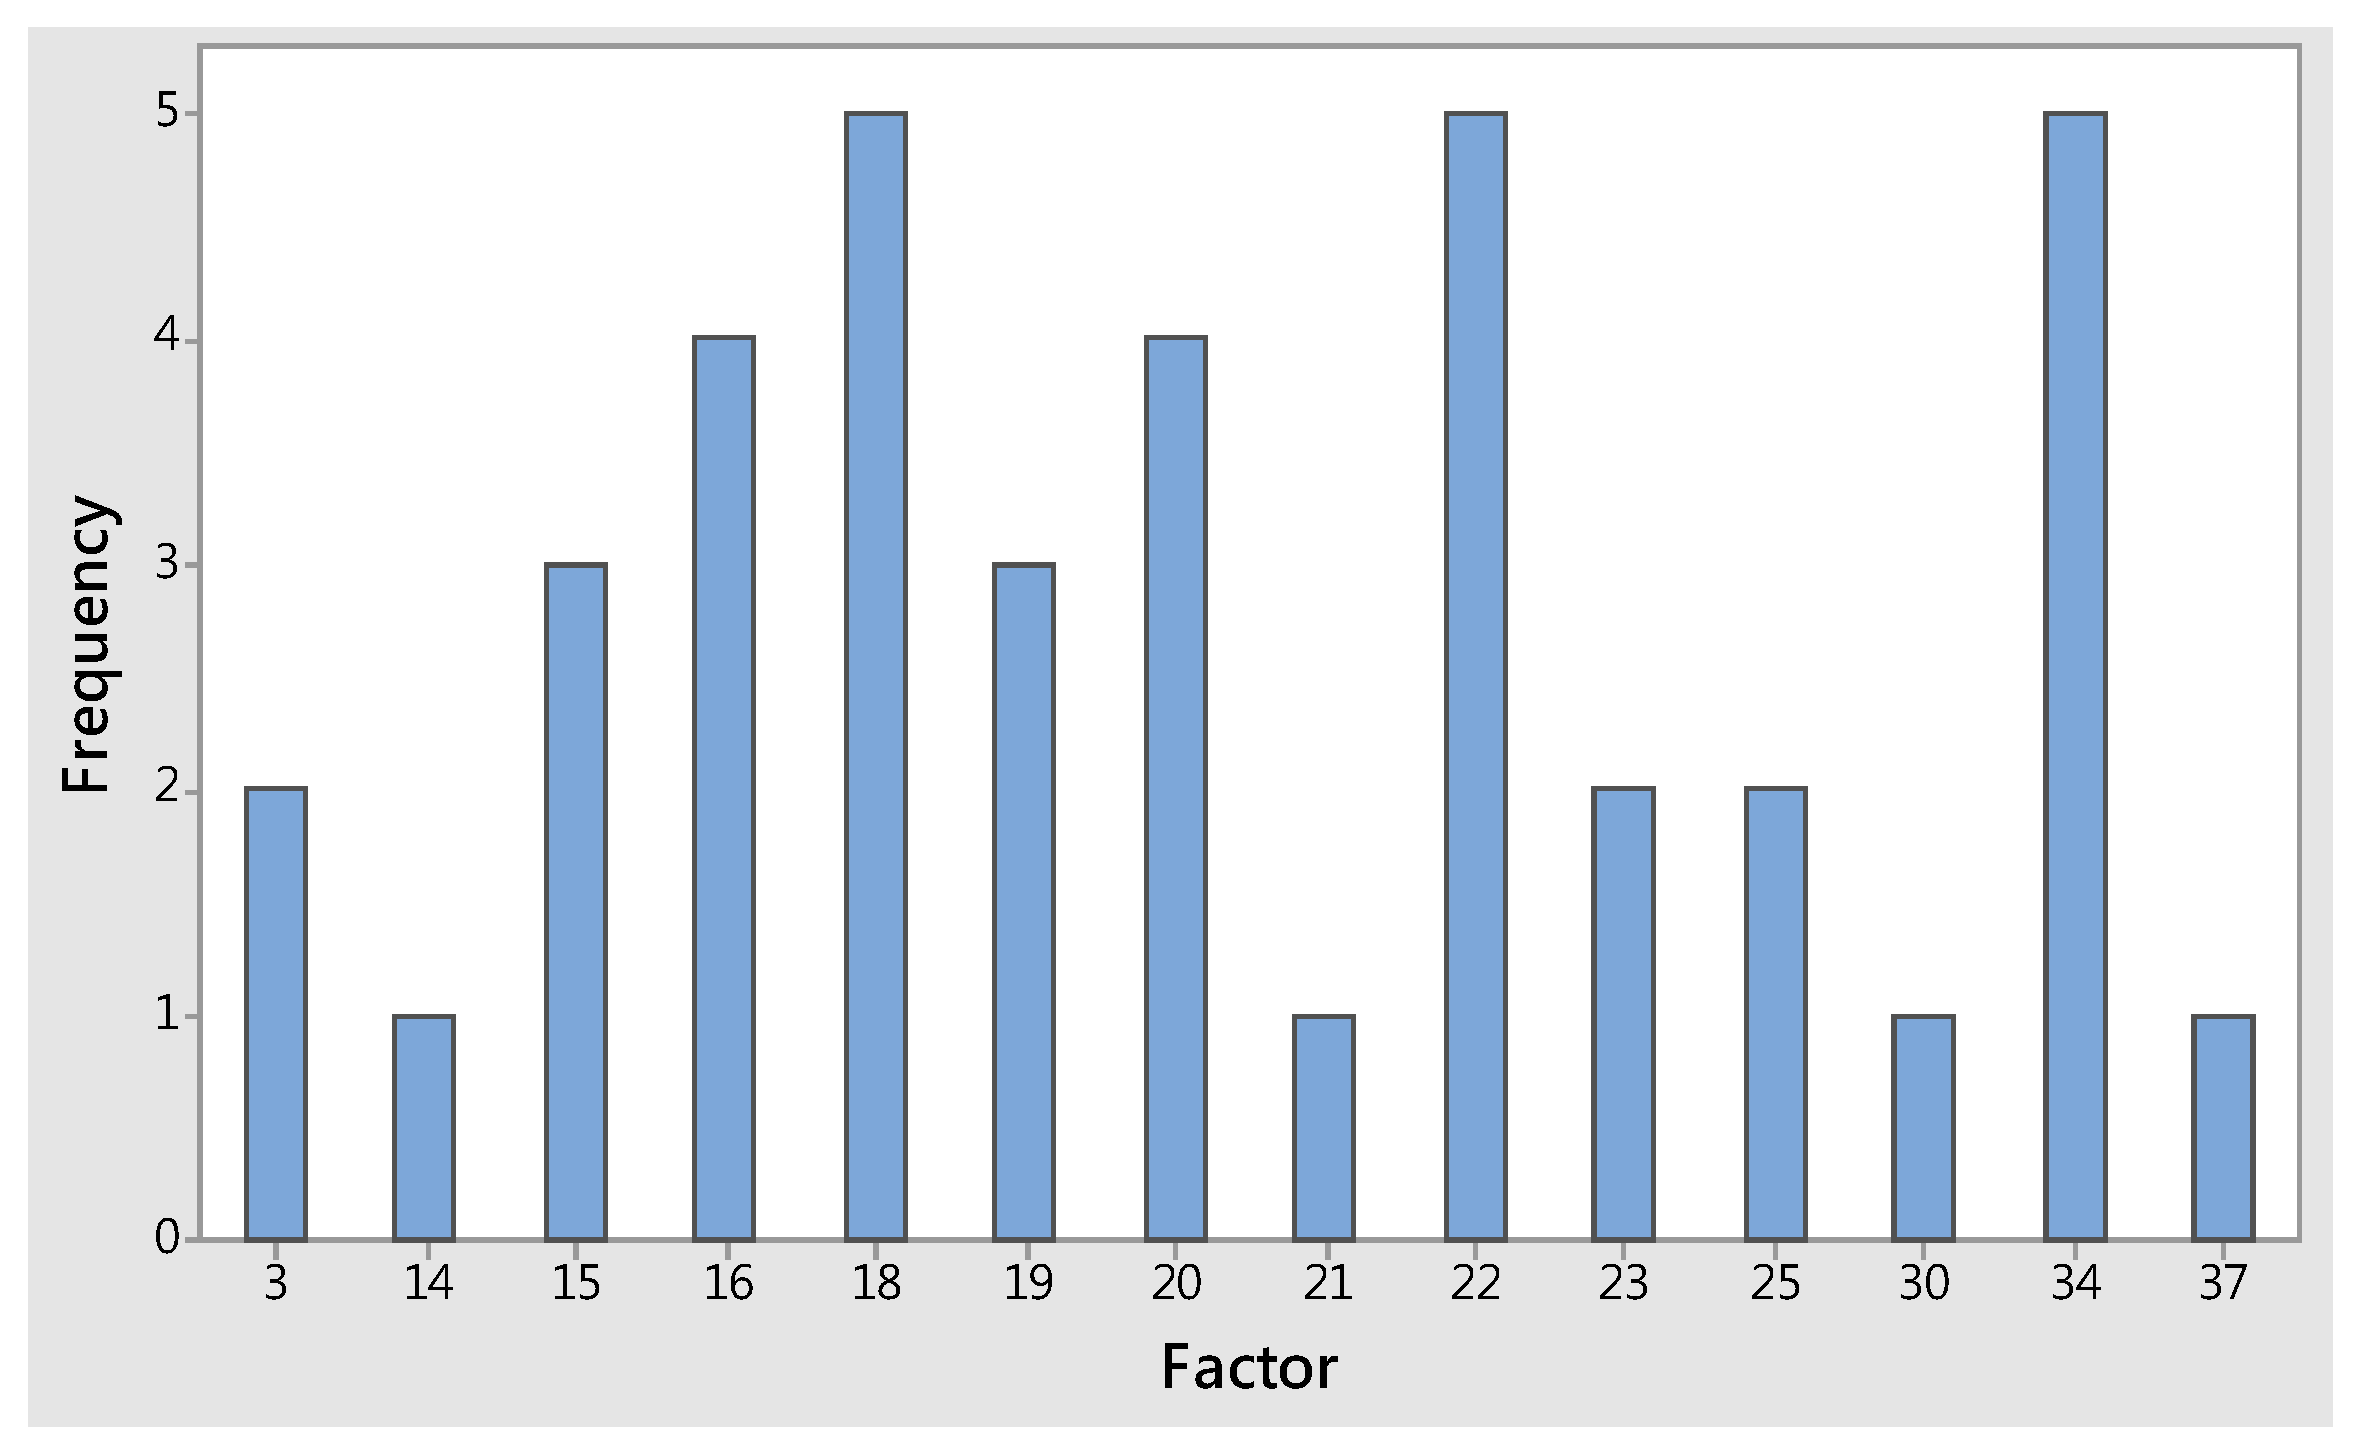
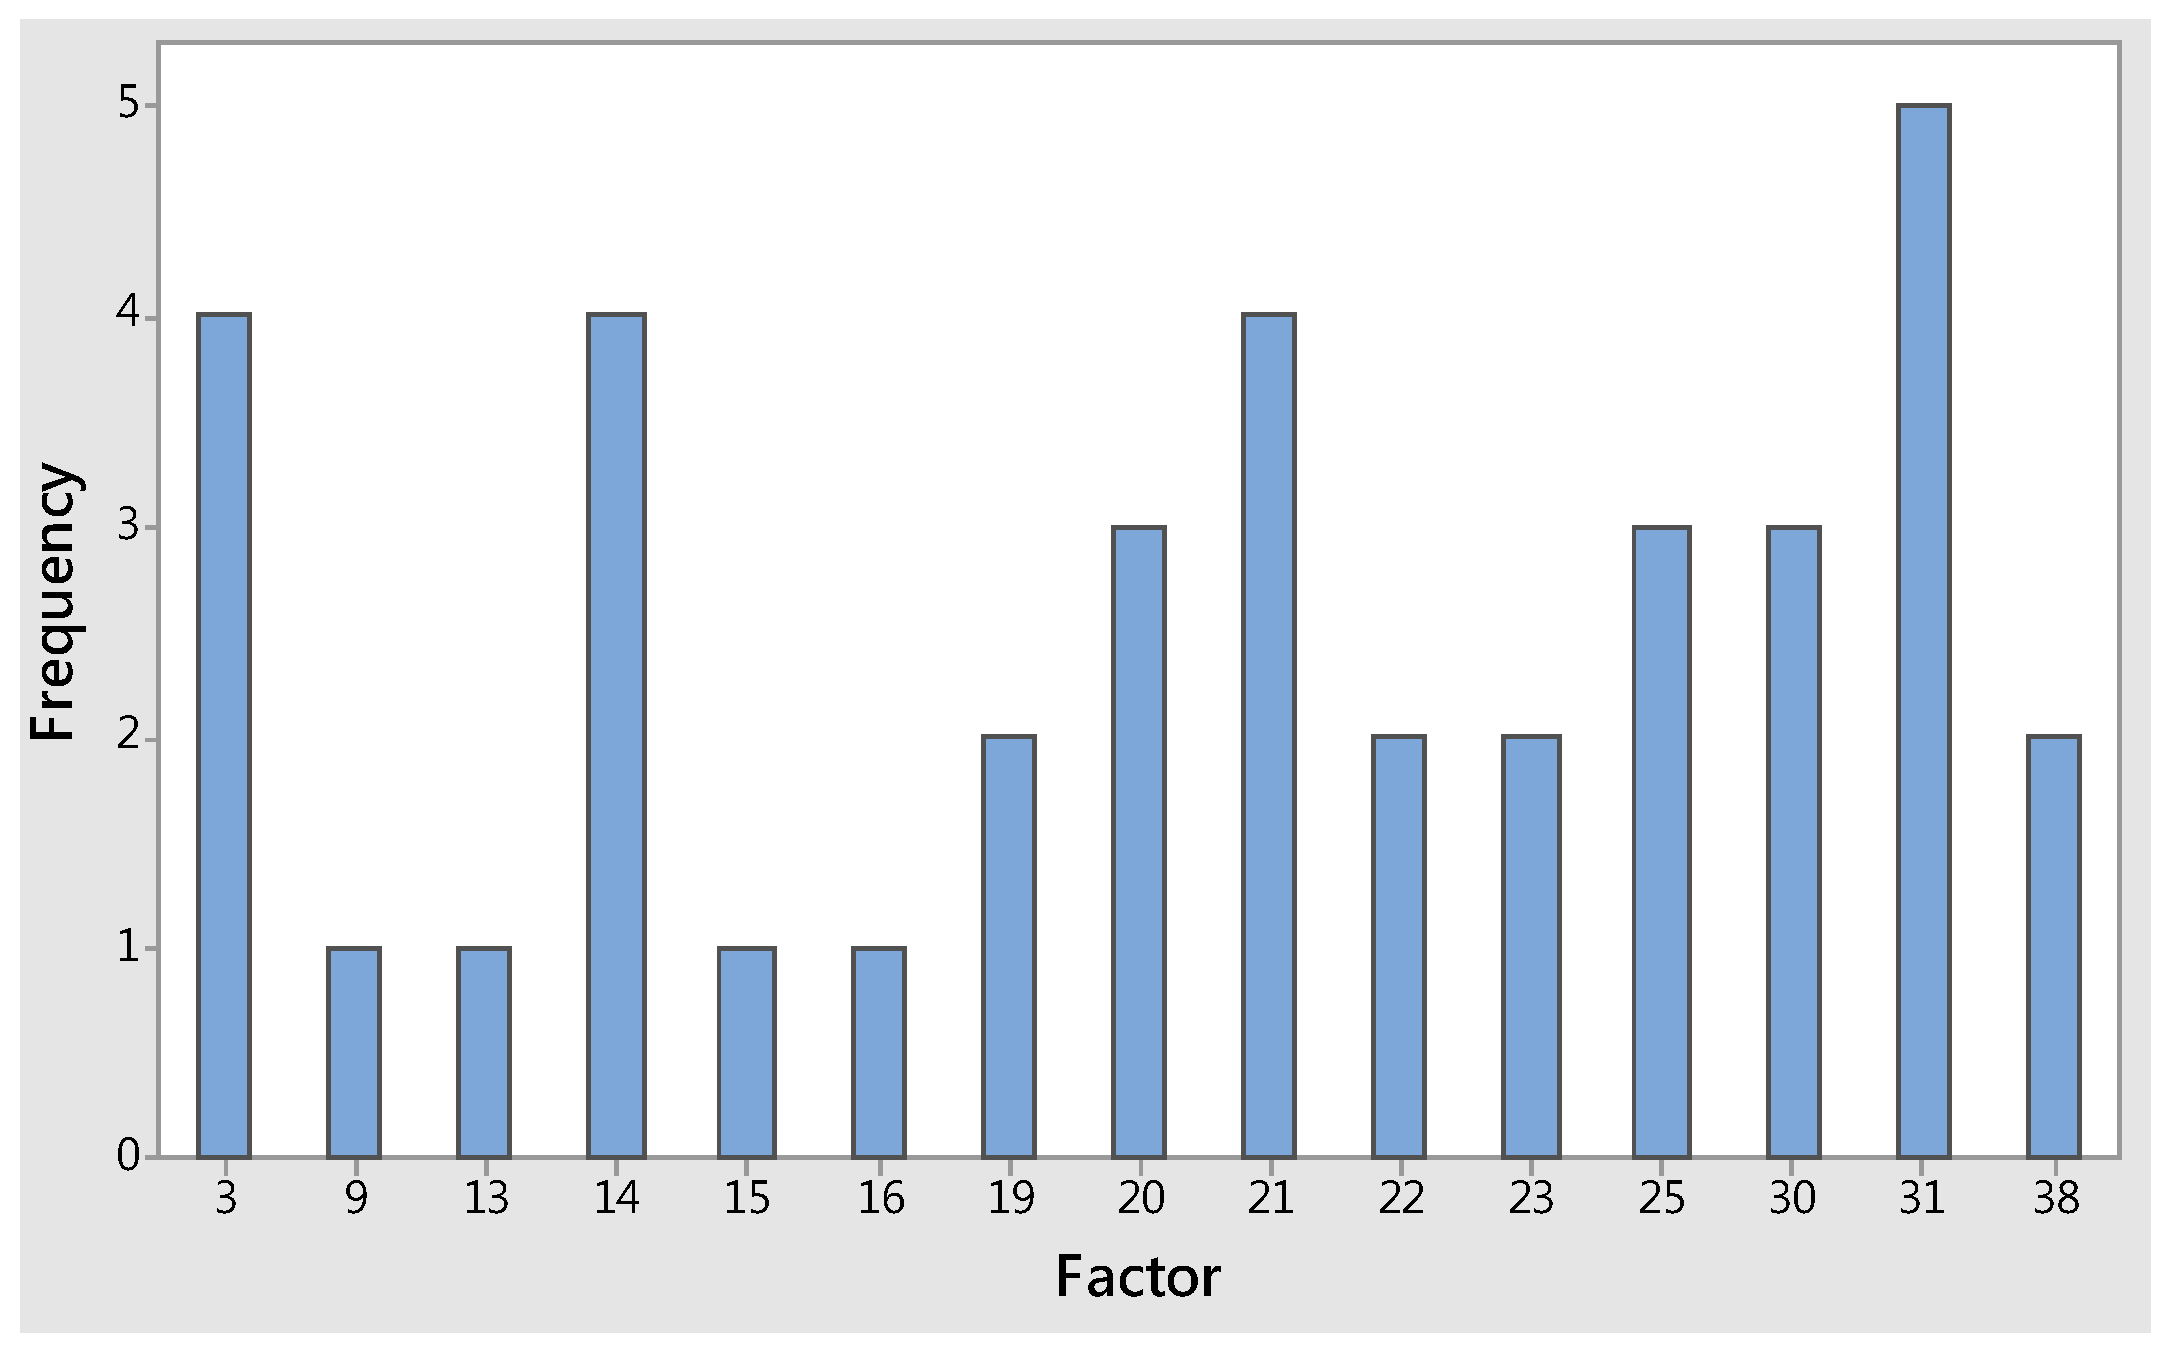
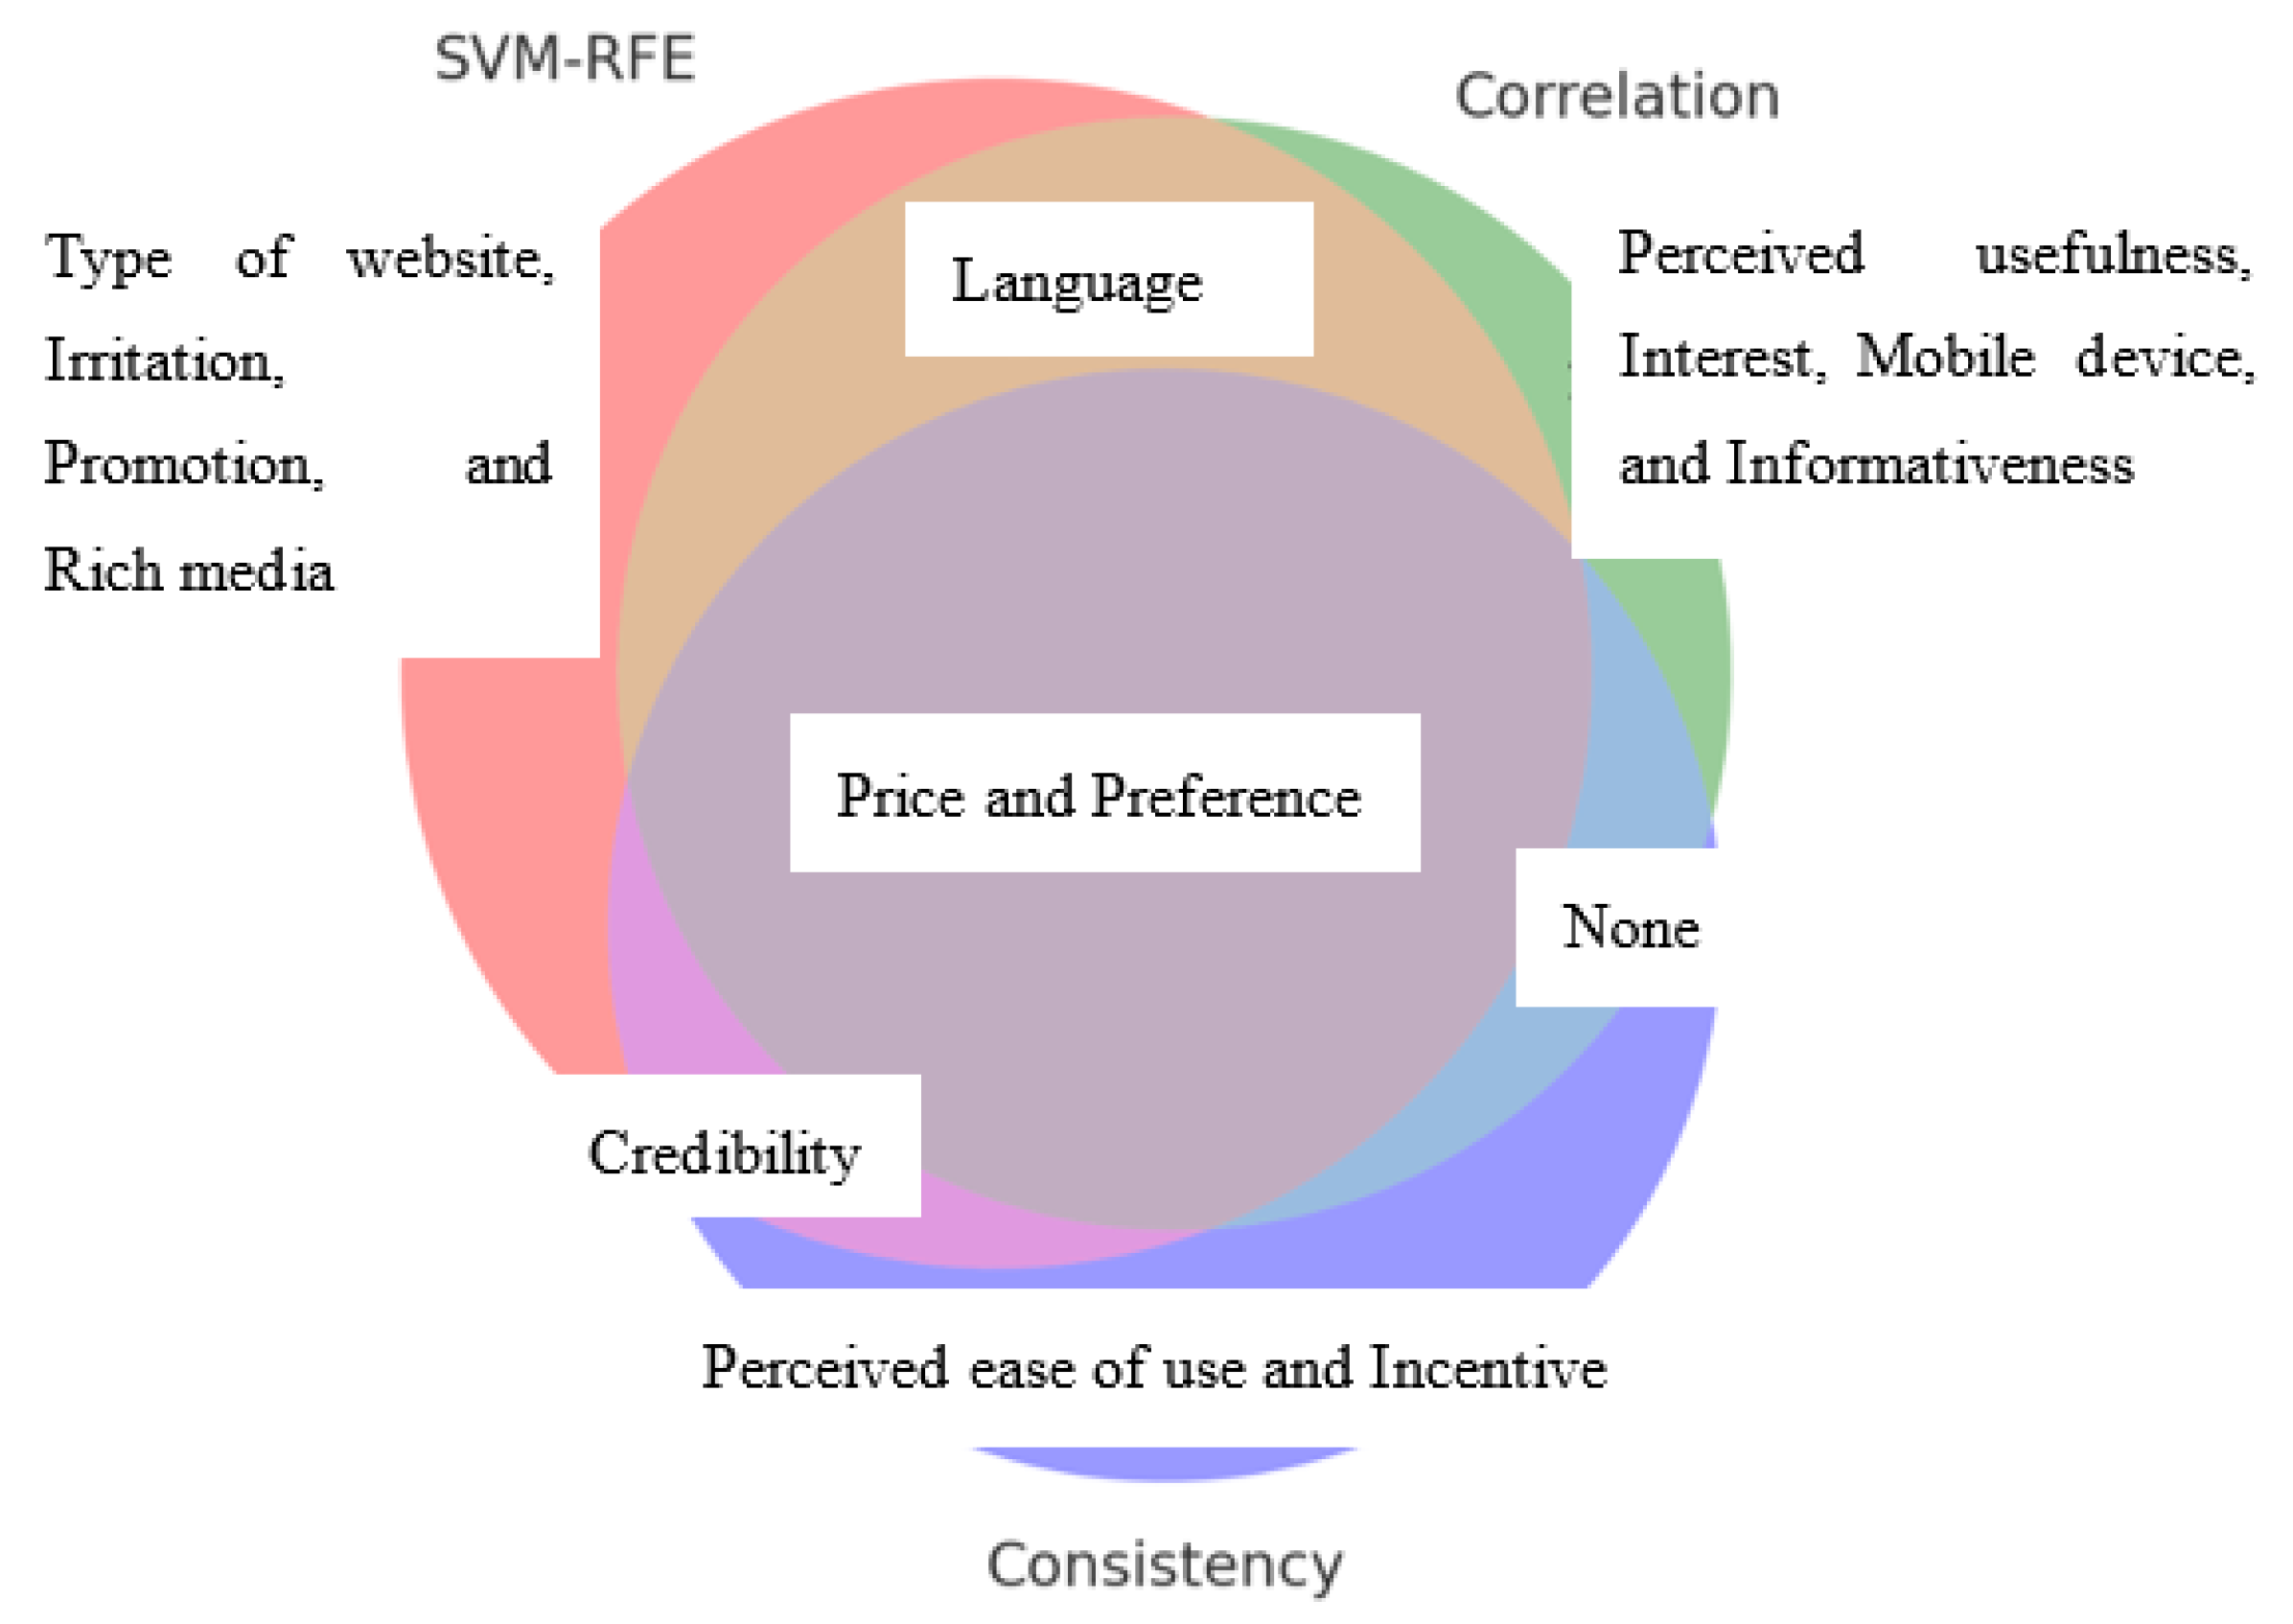
4.2. Results of Feature Selection

In this step, we used SVM-RFE with the rankers’ opinions. The ranker calculated each input factor, generated a Merit value, and arranged it in order from the best to the worst. This research also uses this ranking to select the top 10 positions identified by each fold as important factors. The factors that appear in all five folds using the voting mechanism are retained and become important factors of the mobile ads screened out by this method.
Figure 2 summarizes the results of the SVM-RFE selection method using Equations (1)–(13). Each fold uses a ranker. After finding the important factors, the ranker is used to sort the factors from the best to the worst according to the generated merit value, and a voting mechanism is performed. The factors are found in each fold. All factors appear to keep the selected mobile ads as the important group for this method, with a 100% probability. The important mobile ads factors affecting the click rate of this method are customer loyalty factors numbered 3, 6, 11, 18, 20, 22, 24, and 38.
Secondly, we used a correlation-based method to select the important factors affecting mobile ad loyalty. This method uses four search methods: best first, genetic search, greedy stepwise, and linear forward selection, as discussed in Section 3.2. A search strategy combines this approach and a voting mechanism to filter out important factors.
Table 4 is the analysis results of the correlation method using Equation (14). Each fold adopts four search strategies. After each important factor is found, the first voting mechanism is carried out, and the important factors represented by each fold are screened out. The second voting mechanism is repeated more than three times (with a probability of more than 60%), and the matching factors are unified, which is the final selection of the important factor group of mobile ads for this method. This method is important in affecting customer loyalty. However, according to Figure 3, the mobile ads factors are customer loyalty are 15, 16, 18, 19, 20, 22, and 34.
Finally, we used a consistency-based method to select three important factors that affect mobile ads, depending on the variables. This method uses four search methods: best first, genetic search, greedy stepwise, and linear forward selection. The search strategy incorporates this approach and utilizes a voting mechanism to filter out important factors.
The results of the consistency method analysis are shown in Table 5. For each fold, four search strategies are used. After discovering the important factor, the first voting mechanism is used, and the important factors represented by each fold are screened out. In Figure 4, we carry out the second voting mechanism, repeat it more than three times (that is, more than 60% probability), and integrate the matching factors, that is, the final selection of important factors for mobile ads for this method is represented by the numbers 3, 14, 20, 21, 25, 30, and 31.

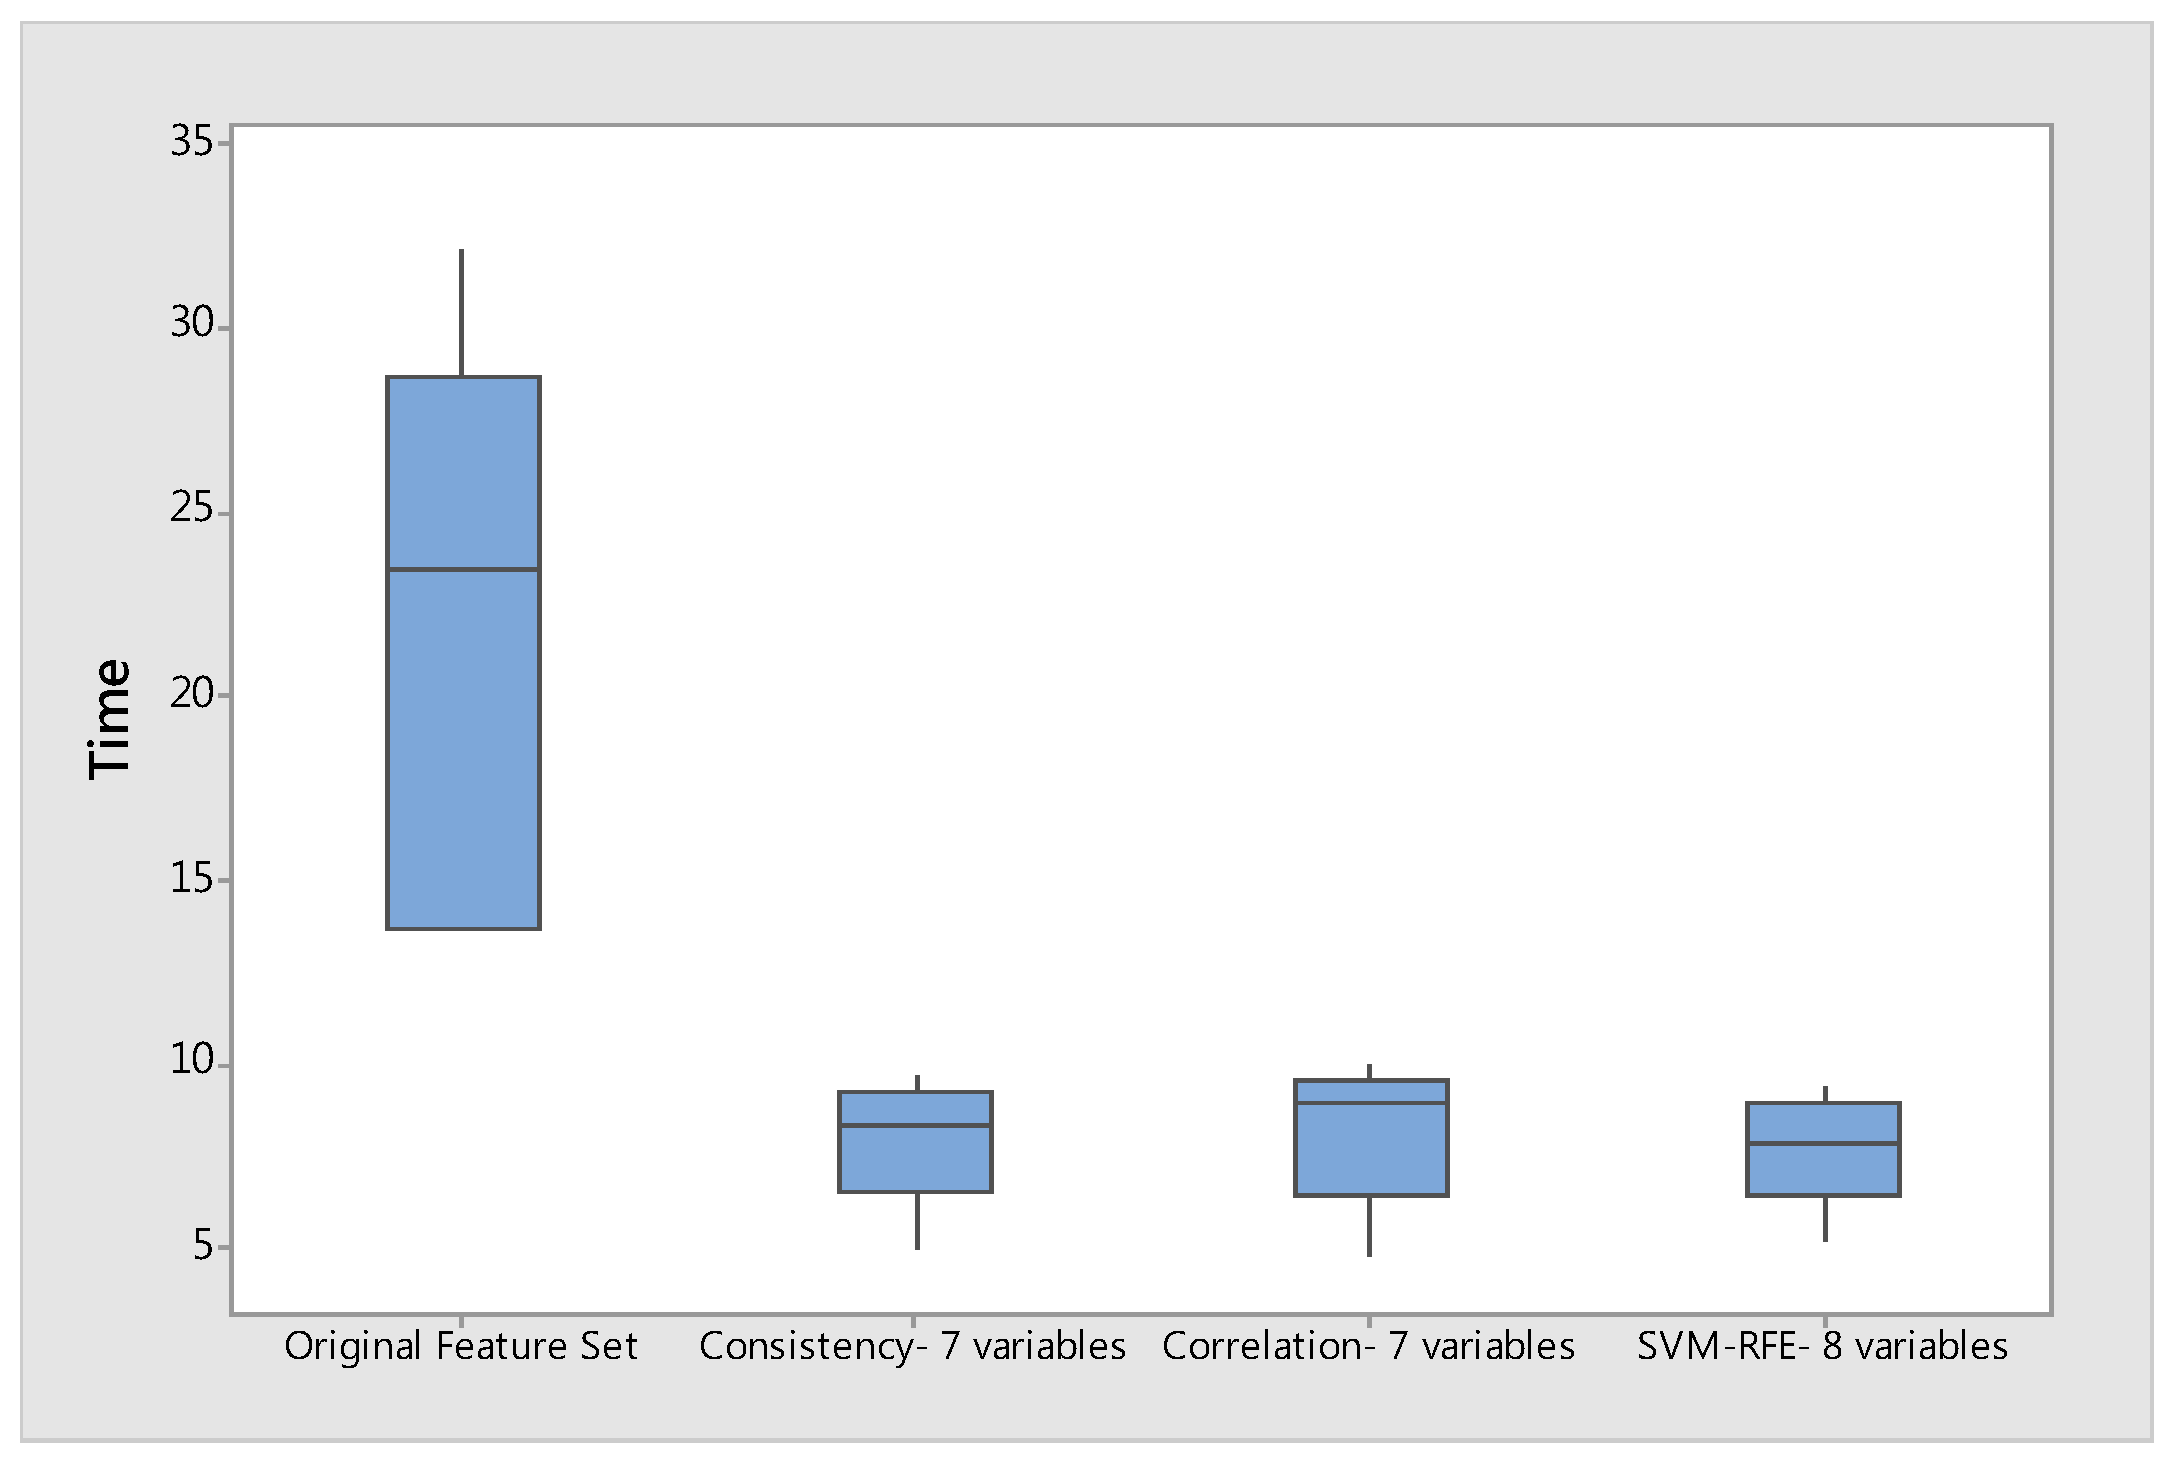
4.3. Performance Evaluation

Table 6 summarizes the results of three feature selection methods. We use two variables to represent each factor and three methods to filter the variables. Finally, the selected variables point to the original variables. The factors that have been selected by more than one method are “language”, “credibility”, “price”, and “preference”. Figure 5 provides a simple Venn diagram to show overlapping key features across feature selection methods
Next, we use an SVM classifier to evaluate the performance of selected feature subsets. Table 7 lists the classification performance of SVM using the original feature set without implementing feature selection and the results of using three feature subsets using three feature selection methods. It could be considered as a comparison base. From Table 7, in the original feature set, we find that the mean values of accuracy and F1 are 68.12% and 65.36%, respectively. Moreover, the training time is 21.67 s on average.
In the consistency-based method, it can be found that Fold4 has the highest classification accuracy, and Fold1 takes the least time. The average accuracy is slightly lower than the original feature set, and F1 is slightly improved. However, the average training time is reduced to 8 s from 21.67 s. In the correlation-based method, the performance improved, regardless of accuracy and F1. Furthermore, the average training remains at 8.21 s. In SVM-RFE, the average training time reaches 7.75 s. Both accuracy and F1 are slightly lower than the original feature selection. The comparison of training time can be found in Figure 6.
Regarding efficiency, t-tests on training time at the 95% confidence level have been performed as shown in Table 8. The p-values for the three groups were 0.01, 0.011, and 0.009, respectively, all below 0.05. These results confirm that applying dimensionality reduction via consistency, correlation, or SVM-RFE significantly reduces model training time, demonstrating the efficiency of the reduced models.
The original feature set contains 40 variables, which are reduced to 8, 7, and 7 after feature selection. However, regardless of accuracy or F1, its performance gap is insignificant. Among them, the results of the correlation-based method are even better, which means that the same or even better classification performance can be achieved using fewer variables. That means the selected features are important.

4.4. Sensitivity Analysis

In addition to using performance evaluation to screen important factors for the three feature selection methods, sensitivity analysis is also used to verify performance, which uses the opposite factor group (those factors are not selected by the feature selection method) to classify. To compare whether the performance is higher than the performance of the selected feature subset by feature selection methods. The feature selection method is unsuitable if its performance exceeds the selected feature subsets.
Sensitivity analysis will take longer than the important factor groups selected by the three feature selection methods because we used all features except the selected feature subsets. The results are shown in Table 9. As can be seen from the table below, the correlation-based method and SVM-RFE have passed the sensitivity analysis. The correlation-based method and SVM-RFE are suitably used as feature selection tools in this case.
At a 95% confidence level, t-tests were conducted to compare classification model accuracy and training time using the original features versus only the selected important features across three methods: consistency, correlation, and SVM-RFE. The results showed that the p-values were all greater than 0.05, indicating no significant difference in classification performance between models built with reduced features and those using all. This suggests that the selected subset of features retains most of the information in the complete set, making them important features. Moreover, for all three methods, the models built with fewer important features required significantly less training time than models using the complete feature set.

5. Conclusions

The present study tried to identify potential factors of mobile ads. Then, we applied SVM-RFE, correlation-based, and consistency-based feature selection methods to identify the critical factors that directly improve customer loyalty. Our results indicated that the correlation-based and SVM-RFE methods outperform the consistency-based feature selection methods. The correlation-based method selected seven critical factors that can improve customer loyalty, namely “language”, “perceived usefulness”, “price”, “preference”, “interest”, “mobile device”, and “informativeness”. Among them, price and preference were selected by all feature selection methods. Table 10 summarizes the suggestions provided.
The contributions of this study to customer loyalty research are as follows: First, the traditional conceptualization of customer loyalty was successfully applied in the new mobile commerce context. Second, the results indicated that customer loyalty is affected by “language”, “perceived usefulness”, “price”, “preference”, “interest”, “mobile device”, and “informativeness”.
This study proposed feature selection-based methods to identify the important factors that enhance customer loyalty. Compared to conventional statistical analysis approaches, feature selection can ignore the assumptions of the data used, such as independence, normality, and constant variance in regression. In addition, feature selection methods have also been widely used to analyze big data in recent years. Moreover, the feature selection method can handle various data, including text. This can make up for the shortcomings of traditional statistical methods.

5.1. Implications of the Research and Practice

This study validated existing literature within the context of customer loyalty in mobile ads and identified the critical factors to improve customer loyalty through mobile ads using three feature selection methods, including SVM-RFE, correlation-based, and consistency-based methods, for the first time. Hence, our implications of the research are as follows: Our work is significant as the online world has become more prevalent in customers’ lives in the past decade and even more so during the COVID-19 pandemic. Our contribution is threefold. First, as far as the author knows, this is the first study conducted in the context of improving mobile ads to improve customer loyalty. We used novel datasets to estimate customers’ preferences for mobile ads, and our study used a larger sample representative of the present generation (who frequently use mobile apps for their shopping). Second, we explored the important factors of mobile ads using three techniques. We considered how proposed user targeting methods affect customers’ interests, and how they are helpful to advertisers and AdTech companies whose services make up the online advertising ecosystem. Third, feature selection methods based on SVM-RFE, correlation-based, and consistency-based feature selection methods were presented in this study. As a result, the presented methodology differs from previous studies’ methodologies and adds a new method to the mobile marketing literature. From a managerial and policy perspective, our research speaks to the future of the programmatic ad sector. It indicates the best prediction of what customers want from the other stakeholders in the online market. Finally, the findings of this study provide the most important factors for increasing customer loyalty to advertisers and promoting agencies.
Several practical implications for advertisers and promoting agencies are presented, and various important factors across the mobile ads process are identified. First, based on our results, “Price” and “Preference” were identified as the most important factors in improving customer loyalty. Hence, management attention may be more fruitful if focused on such factors in their advertising processes. Accordingly, to increase customer loyalty, advertisers and managers need to be concerned about the experience of consumers, from the first encounter through purchasing to delivery and beyond, as this can influence consumer satisfaction, thus influencing customer loyalty. Second, prior research has shown that information quality, website type, and media may influence customer loyalty and improve sales through mobile ads. This demonstrates the significance of value as a strategic goal from a managerial perspective. The importance of employing correlation-based SVM-RFE and this study’s empirical results further highlight consistency-based feature selection methods. We replaced the traditional qualitative analysis that used questionnaires with feature selection approaches. This approach’s outcome promotes client loyalty. Customer loyalty should be included in their current loyalty valuation techniques, and corrective action should be taken to improve it.

5.2. Practical Implications

The findings of this study offer several practical implications for advertisers, mobile app developers, and digital marketing strategists. By identifying “Price” and “Preference” as the most critical factors influencing customer loyalty across all three feature selection methods, businesses are encouraged to tailor mobile ads that provide transparent pricing and align with consumer preferences. For example, leveraging location-based services or browsing histories to recommend relevant products can significantly enhance ad relevance and customer engagement. A concrete tactic might involve sending a push notification offering a 10% discount on items left in a user’s cart, triggered when the user is near a physical store location or at a specific time of day.
Additionally, other consistently influential factors—such as “Language”, “Perceived Usefulness”, “Interest”, “Mobile Device”, and “Informativeness”—highlight the importance of content quality and personalization. Advertisements using localized language, clear value propositions, and device-optimized formats can foster stronger user connections and reduce ad fatigue. Mobile ads should go beyond mere exposure to provide genuinely helpful content that supports customers in their decision-making process.
Furthermore, integrating feature selection techniques into mobile marketing analytics demonstrates a promising direction for optimizing ad performance. Businesses can adopt these data-driven methods to refine large sets of user data and isolate key drivers of consumer behavior without relying on assumptions typical in traditional statistical models. This approach improves marketing efficiency and supports strategic investment in content development.
Lastly, given the high click rates on platforms like Facebook, YouTube, and in-app environments—as observed in the data analysis—marketers should prioritize these channels for campaign deployment. Ensuring that mobile ads are interactive and minimally intrusive can help address the common issue of accidental clicks, enhancing the accuracy of engagement metrics and overall campaign effectiveness.

5.3. Limitations and Future Direction

This study presents several limitations that warrant consideration. First, while it is among the first to apply SVM-RFE, correlation-based, and consistency-based feature selection methods to identify key factors affecting customer loyalty in mobile advertising, the findings are derived from a single empirical study. Generalizing these results to other ad formats or user groups—such as offline ads or older consumers—should be performed cautiously. Moreover, firm-level variables such as relative price, market share, and profitability, which are known to correlate with customer loyalty, were not included in the analysis.
Second, the sample is highly skewed toward young Taiwanese participants, with most respondents aged 15 to 29 and primarily students. Although this demographic aligns with mobile and online gaming audiences, it limits the broader applicability of the findings across diverse populations. To mitigate potential response bias, subgroup-level factor loading assessments were conducted to evaluate variance homogeneity and detect latent response bias. However, the snowball sampling technique may also introduce bias, as it generates homogeneous participant pools with similar traits and preferences.
Future research should adopt more rigorous sampling methods, such as stratified or quota sampling, to enhance generalizability and robustness and target a broader demographic across regions and industries. Cross-cultural studies that include more diverse variables can also provide deeper insights into the dynamics of mobile ad effectiveness and customer loyalty. In addition, future studies could also use model-agnostic interpretability techniques (e.g., SHAP values [69]) to serve as a reference model for validating feature importance beyond SVM-RFE or correlation filters.
In future studies, the researcher can use various feature selection methods or big data tools to improve customer loyalty. Additionally, we only used 482 samples in this study. Future works can increase the data size to sample representative examples.

Author Contributions

Conceptualization, L.-S.C., K.-F.Y. and C.-C.L.; methodology, V.N., K.-F.Y. and C.-C.L.; software, K.-F.Y., C.-C.L. and V.N.; validation, L.-S.C. and K.-F.Y.; formal analysis, KFC, V.N. and L.-S.C.; investigation, K.-F.Y., C.-C.L. and V.N.; resources, K.-F.Y. and L.-S.C.; data curation, V.N. and C.-C.L.; writing—original draft preparation, V.N. and K.-F.Y.; writing—review and editing, L.-S.C.; visualization, K.-F.Y. and C.-C.L.; supervision, L.-S.C. and K.-F.Y.; project administration, L.-S.C.; funding acquisition, K.-F.Y. and L.-S.C. All authors have read and agreed to the published version of the manuscript.

Funding

This research was funded by the National Science and Technology Council, Taiwan, under grant no. NSTC 112-2410-H-027-029.

Institutional Review Board Statement

Not applicable.

Informed Consent Statement

Not applicable.

Data Availability Statement

Data are available upon request.

Acknowledgments

This study was supported in part by the National Science and Technology Council, Taiwan (Grant No. NSTC 112-2410-H-027-029), and Chaoyang University of Technology.

Conflicts of Interest

The authors declare no conflicts of interest.

Appendix A

Independent Variables
No.FactorsQuestion itemsQuestion descriptions
A1Involvement1The interactive Q&A questions in mobile ads require your participation. What do you think?
2The event information contained in the mobile advertisement requires the participation of the audience. What do you think?
A2Language3When the mobile advertisement is used in the local language (Chinese), what do you think?
4What do you think when the mobile advertisement is used in the international language (English)?
A3Type of website5When viewing a specific website (such as Mobile01) with a mobile device, mobile advertisements related to the browsing theme (such as mobile phone products) appear, what do you think?
6When using online dictionaries or online translation, mobile advertisements for English cram school discount programs appear, what do you think?
A4Information Privacy7When mobile advertising will properly use your public personal information (such as IP address, cookie temporary storage records, browsing records), what do you think?
8When mobile advertising will protect your privacy and personal information (such as consumption records, current location), what do you think?
A5Entertainment9When mobile advertising gives you a pleasant atmosphere, what do you think?
10When mobile advertising gives you a sense of joy and the effect of making you smile, what do you think?
A6Irritation11When mobile advertising avoids bringing you disgust, disgust, helplessness and discomfort, what do you think?
12What do you think when mobile ads don’t bother you during your busy hours or important moments?
A7Perceived Usefulness13When mobile advertising can help you inquire about the products (services) you need, what do you think?
14When using the weather forecast app, it shows that it is rainy, and if there is an action advertisement that you urgently need (such as a taxi to the house, providing a path that does not get wet), what do you think?
A8Perceived ease of use15If you can use mobile advertising to inquire about products (services) very easily, what do you think?
16When you use the gourmet app to view nearby food, it provides an advertisement service for ordering food immediately, what do you think?
A9Credibility17The mobile advertiser provides a guarantee of authenticity or a 100% guarantee of product quality, otherwise unconditional compensation, what do you think?
18All information in mobile advertising and all online transactions involved are protected by law. What do you think?
A10Price19Mobile advertising provides clear product or service price information, what do you think?
20What do you think when mobile ads provide price comparison information on other websites for the same (or similar) products as advertised?
A11Preference21If mobile advertising provides purchase suggestions based on your historical purchase records, what do you think?
22When the mobile advertisement adopts your personal preferences (such as simple style, Japanese products, etc.) to provide purchase suggestions, what do you think?
A12Promotion23Click on the mobile advertisement to enjoy product discounts, or provide discount QR codes, what do you think?
24When mobile advertising (service) is combined with seasonal specials or anniversary promotions, what do you think?
A13Interest25Mobile advertising provides relevant advertising information based on your personal interests (such as sports and video games). What do you think?
26Mobile advertisements provide content-related information based on the types of users’ interests (such as travel and beauty), what do you think?
A14Brand name27When there are product brand names (such as sports brands Nike, SONY) in the mobile advertisement, what do you think?
28Mobile advertisements provide brand information of products (services) (such as i-phone6), what do you think?
A15Mobile device29Mobile advertising combined with mobile devices held by consumers to deliver marketing activities of similar products (such as protective cases for i-pads), what do you think?
30Mobile advertising provides advertisements for products of the same brand based on mobile devices (such as promoting i-mac, i-phone, and ios-compatible APPs for i-pad users), what do you think?
A16Informativeness31What do you think when mobile advertising provides concise, quick-to-grasp, and important product (service) information?
32When mobile advertisements provide rich and detailed product (service) information, what do you think?
A17Incentives33The mobile advertisement provides click to draw prizes and scan the QR code to accumulate bonus points. What do you think?
34What do you think when mobile advertising offers discount coupons for group buying or membership benefits?
A18Social media35When mobile advertising is combined with social media (such as Facebook, Twitter, and so on) marketing, what do you think?
36When mobile advertising is combined with Youtube video website marketing, what do you think?
A19Rich media37What do you think when mobile advertising uses various ways to present advertising content (such as video, animation, and sound)?
38Mobile advertisements use video and audio to present the appearance of the product and use text to describe the product’s functions in detail. What do you think?
A20Game-based39If the mobile advertisement adopts the nature of interactive mini-games (such as jigsaw puzzles, word solitaire, and guessing riddles), what do you think?
40If the mobile advertisement attached to the content of the game APP or the advertisement screen displayed after the game is over, what do you think?
Dependent variable
Repurchase intention1If an advertisement includes the above factors that you think they are important or very important, and you have bought similar products (services) in this ads. Will you repurchase these products (services) because you have seen this ad?
Note: Four search methods are used for each fold, and the repeated factors will be filled in. Finally, the factors with more than three repetitions in 5Fold experiments are the important factors selected by this method.

References

  1. Lee, M.; Lee, J.H.; Kim, D.H. Gender recognition using optimal gait feature based on recursive feature elimination in normal walking. Expert Syst. Appl. 2022, 189, 116040. [Google Scholar] [CrossRef]
  2. Huynh-Cam, T.T.; Nalluri, V.; Chen, L.S.; Yang, Y.Y. IS-DT: A New Feature Selection Method for Determining the Important Features in Programmatic Buying. Big Data Cogn. Comput. 2022, 6, 118. [Google Scholar] [CrossRef]
  3. Yahoo. 2021 Programmatic Buying Research Insights Report. 2021. Available online: https://www.adtech.yahooinc.com/zh-tw/insights/2021dspsurvvey (accessed on 15 June 2024).
  4. Enberg, J. Global Digital Ad Spending 2019. eMarketer, Report. Available online: https://www.emarketer.com/content/global-digital-ad-spending-2019 (accessed on 1 August 2024).
  5. Samuel, A.; White, G.R.; Thomas, R.; Jones, P. Programmatic advertising: An exegesis of consumer concerns. Comput. Hum. Behav. 2021, 116, 106657. [Google Scholar] [CrossRef]
  6. Scholz, J.; Duffy, K. We ARe at home: How augmented reality reshapes mobile marketing and consumer-brand relationships. J. Retail. Consum. Serv. 2018, 44, 11–23. [Google Scholar] [CrossRef]
  7. Kapinga, A.F.; Suero Montero, C.; Mbise, E.R. Mobile marketing application for entrepreneurship development: Codesign with women entrepreneurs in Iringa, Tanzania. Electron. J. Inf. Syst. Dev. Ctries. 2019, 85, e12073. [Google Scholar] [CrossRef]
  8. Srinivasan, N.; Singh, S. Guest editorial: Digital marketing trends. J. Indian Bus. Res. 2022, 14, 85–87. [Google Scholar] [CrossRef]
  9. Sarker, I.H.; Hoque, M.M.; Uddin, M.; Alsanoosy, T. Mobile data science and intelligent apps: Concepts, AI-based modeling and research directions. Mob. Netw. Appl. 2021, 26, 285–303. [Google Scholar] [CrossRef]
  10. Moslehpour, M.; Christianti, G.; Kuan Lin, P.; Aminah, H.; Barry, M. Why Do Taiwanese Consumers Purchase Korean Beauty Product? In Proceedings of the 2021 7th International Conference on E-Business and Applications, Singapore, 24–26 February 2021; pp. 219–225. [Google Scholar] [CrossRef]
  11. Izquierdo-Yusta, A.; Olarte-Pascual, C.; Reinares-Lara, E. Attitudes toward mobile ads among users versus non-users of the mobile Internet. Telemat. Inform. 2015, 32, 355–366. [Google Scholar] [CrossRef]
  12. Kim, K.Y.; Lee, B.G. Marketing insights for mobile ads and consumer segmentation in the cloud era: AQ–R hybrid methodology and practices. Technol. Forecast. Soc. Change 2015, 91, 78–92. [Google Scholar] [CrossRef]
  13. Dahana, W.D.; Miwa, Y.; Morisada, M. Linking lifestyle to customer lifetime value: An exploratory study in an online fashion retail market. J. Bus. Res. 2019, 99, 319–331. [Google Scholar] [CrossRef]
  14. Jebarajakirthy, C.; Maseeh, H.I.; Morshed, Z.; Shankar, A.; Arli, D.; Pentecost, R. Mobile ads: A systematic literature review and future research agenda. Int. J. Consum. Stud. 2021, 45, 1258–1291. [Google Scholar] [CrossRef]
  15. Lu, C.C.; Wu, L.; Hsiao, W.H. Developing customer product loyalty through mobile ads: Affective and cognitive perspectives. Int. J. Inf. Manag. 2019, 47, 101–111. [Google Scholar] [CrossRef]
  16. Ren, F.; Zhang, Y.; Liu, G. Case Studies of China’s SP Industry Development. In Introduction to the Science Popularization Industry; Springer: Berlin/Heidelberg, Germany, 2021; pp. 159–250. [Google Scholar] [CrossRef]
  17. Truong, V. Optimizing mobile in-app advertising effectiveness using app publishers-controlled factors. J. Mark. Anal. 2024, 12, 925–943. [Google Scholar] [CrossRef]
  18. Gao, H.; Kuang, L.; Yin, Y.; Guo, B.; Dou, K. Mining consuming behaviors with temporal evolution for personalized recommendation in mobile marketing apps. Mob. Netw. Appl. 2020, 25, 1233–1248. [Google Scholar] [CrossRef]
  19. Nanda, A.; Xu, Y.; Zhang, F. How would the COVID-19 pandemic reshape retail real estate and high streets through acceleration of E-commerce and digitalization? J. Urban Manag. 2021, 10, 110–124. [Google Scholar] [CrossRef]
  20. Firdaus, A.; Anuar, N.B.; Razak, M.F.A.; Hashem, I.A.T.; Bachok, S.; Sangaiah, A.K. Root exploit detection and features optimization: Mobile device and blockchain based medical data management. J. Med. Syst. 2018, 42, 112. [Google Scholar] [CrossRef]
  21. Schouten, A.P.; Janssen, L.; Verspaget, M. Celebrity vs. Influencer endorsements in advertising: The role of identification, credibility, and Product-Endorser fit. Int. J. Advert. 2020, 39, 258–281. [Google Scholar] [CrossRef]
  22. Chen, P.T.; Hsieh, H.P. Personalized mobile ads: Its key attributes, trends, and social impact. Technol. Forecast. Soc. Change 2012, 79, 543–557. [Google Scholar] [CrossRef]
  23. Shehu, E.; Abou Nabout, N.; Clement, M. The risk of programmatic advertising: Effects of website quality on advertising effectiveness. Int. J. Res. Mark. 2021, 38, 663–677. [Google Scholar] [CrossRef]
  24. Li, J.; Ni, X.; Yuan, Y.; Wang, F.Y. A hierarchical framework for ad inventory allocation in programmatic advertising markets. Electron. Commer. Res. Appl. 2018, 31, 40–51. [Google Scholar] [CrossRef]
  25. Gonzalvez-Cabañas, J.C.; Mochón, F. Operating an advertising programmatic buying platform: A case study. IJIMAI 2016, 3, 6–15. [Google Scholar] [CrossRef]
  26. White, G.R.; Samuel, A. Programmatic Advertising: Forewarning and avoiding hype-cycle failure. Technol. Forecast. Soc. Change 2019, 144, 157–168. [Google Scholar] [CrossRef]
  27. Quesenberry, K.A. Social Media Strategy: Marketing, Advertising, and Public Relations in the Consumer Revolution; Rowman & Littlefield Publishers: Lanham, MD, USA, 2020. [Google Scholar]
  28. Guven, H. Industry 4.0 and marketing 4.0: In perspective of digitalization and E-Commerce. In Agile Business Leadership Methods for Industry 4.0; Emerald Publishing Limited: Leeds, UK, 2020. [Google Scholar] [CrossRef]
  29. Akpojivi, U.; Bevan-Dye, A. Mobile advertisements and information privacy perception amongst South African Generation Y students. Telemat. Inform. 2015, 32, 1–10. [Google Scholar] [CrossRef]
  30. Maseeh, H.I.; Jebarajakirthy, C.; Pentecost, R.; Ashaduzzaman, M.; Arli, D.; Weaven, S. A meta-analytic review of mobile ads research. J. Bus. Res. 2021, 136, 33–51. [Google Scholar] [CrossRef]
  31. Tan, G.W.H.; Lee, V.H.; Hew, J.J.; Ooi, K.B.; Wong, L.W. The interactive mobile social media advertising: An imminent approach to advertise tourism products and services? Telemat. Inform. 2018, 35, 2270–2288. [Google Scholar] [CrossRef]
  32. Kerst, A.; Zielasek, J.; Gaebel, W. Smartphone applications for depression: A systematic literature review and a survey of health care professionals’ attitudes towards their use in clinical practice. Eur. Arch. Psychiatry Clin. Neurosci. 2020, 270, 139–152. [Google Scholar] [CrossRef]
  33. Kwon, J.H.; Jung, S.H.; Choi, H.J.; Kim, J. Antecedent factors that affect restaurant brand trust and brand loyalty: Focusing on US and Korean consumers. J. Prod. Brand Manag. 2020, 30, 990–1015. [Google Scholar] [CrossRef]
  34. Eid, M.B.A.H. Customer lifetime value: Investigating the factors affecting attitudinal and behavioural brand loyalty. TQM J. 2021, 34, 476–493. [Google Scholar] [CrossRef]
  35. Liu, K.N.; Tsai, T.I.; Xiao, Q.; Hu, C. The impact of experience on brand loyalty: Mediating effect of images of Taiwan hotels. J. China Tour. Res. 2021, 17, 395–414. [Google Scholar] [CrossRef]
  36. Abuhashesh, M.Y.; Alshurideh, M.T.; Sumadi, M. The effect of culture on customers’ attitudes toward Facebook advertising: The moderating role of gender. Rev. Int. Bus. Strategy 2021, 31, 416–437. [Google Scholar] [CrossRef]
  37. Cao, Y.; Ajjan, H.; Hong, P. Post-purchase shipping and customer service experiences in online shopping and their impact on customer satisfaction: An empirical study with comparison. Asia Pac. J. Mark. Logist. 2018, 30, 400–416. [Google Scholar] [CrossRef]
  38. Alavijeh, M.R.K.; Esmaeili, A.; Sepahvand, A.; Davidaviciene, V. The effect of customer equity drivers on word-of-mouth behavior with mediating role of customer loyalty and purchase intention. Eng. Econ. 2018, 29, 236–246. [Google Scholar] [CrossRef]
  39. Nguyen-Phuoc, D.Q.; Su, D.N.; Tran, P.T.K.; Le, D.T.T.; Johnson, L.W. Factors influencing customer’s loyalty towards ride-hailing taxi services–A case study of Vietnam. Transp. Res. Part A Policy Pract. 2020, 134, 96–112. [Google Scholar] [CrossRef]
  40. Karunaratna, A.C.; Kumara, P.A.P. Determinants of customer loyalty: A literature review. J. Cust. Behav. 2018, 17, 49–73. [Google Scholar] [CrossRef]
  41. Shahzad, A.; Yaqub, R.M.S.; Di Vaio, A.; Hassan, R. Antecedents of customer loyalty and performance improvement: Evidence from Pakistan’s telecommunications sector. Util. Policy 2021, 70, 101208. [Google Scholar] [CrossRef]
  42. Parreño, J.M.; Sanz-Blas, S.; Ruiz-Mafé, C.; Aldás-Manzano, J. Key factors of teenagers’ mobile ads acceptance. Ind. Manag. Data Syst. 2013, 113, 732–749. [Google Scholar] [CrossRef]
  43. Flores, W.; Chen, J.C.V.; Ross, W.H. The effect of variations in banner ad, type of product, website context, and language of advertising on Internet users’ attitudes. Comput. Hum. Behav. 2014, 33, 37–47. [Google Scholar] [CrossRef]
  44. Chen, L.S.; Liu, C.C. Using feature selection approaches to identify critical factors of mobile advertisements. In Proceedings of the International MultiConference of Engineers and Computer Scientists, Hong Kong, China, 18–20 March 2015; pp. 14–17. [Google Scholar]
  45. Yang, B.; Kim, Y.; Yoo, C. The integrated mobile ads model: The effects of technology-and emotion-based evaluations. J. Bus. Res. 2013, 66, 1345–1352. [Google Scholar] [CrossRef]
  46. Kim, Y.J.; Han, J. Why smartphone advertising attracts customers: A model of Web advertising, flow, and personalization. Comput. Hum. Behav. 2014, 33, 256–269. [Google Scholar] [CrossRef]
  47. Tseng, C.H.; Wei, L.F. The efficiency of mobile media richness across different stages of online consumer behavior. Int. J. Inf. Manag. 2020, 50, 353–364. [Google Scholar] [CrossRef]
  48. Chakraborty, G.; Cheng, L.C.; Chen, L.S.; Bornand, C. Selecting important features related to efficacy of mobile advertisements. In Proceedings of the Asian Conference on Intelligent Information and Database Systems, Kanazawa, Japan, 3–5 April 2017; Volume 1, pp. 728–737. [Google Scholar] [CrossRef]
  49. Sun, Y. Marketing Competition Analysis of the Feasibility of Investment in McDonald’s. In Proceedings of the 2022 2nd International Conference on Enterprise Management and Economic Development, Dalian, China, 27–29 May 2022; pp. 944–994. [Google Scholar] [CrossRef]
  50. Malan, N.S.; Sharma, S. Feature selection using regularized neighbourhood component analysis to enhance the classification performance of motor imagery signals. Comput. Biol. Med. 2019, 107, 118–126. [Google Scholar] [CrossRef] [PubMed]
  51. Chaudhuri, A.; Sahu, T.P. A hybrid feature selection method based on Binary Jaya algorithm for micro-array data classification. Comput. Electr. Eng. 2021, 90, 106963. [Google Scholar] [CrossRef]
  52. Chang, J.-R.; Chen, M.-Y.; Chen, L.-S.; Tseng, S.-C. Why Customers Don’t Revisit in Tourism and Hospitality Industry? IEEE Access 2019, 7, 146588–146606. [Google Scholar] [CrossRef]
  53. Zhang, R.; Xie, P.; Wang, C.; Liu, G.; Wan, S. Classifying transportation mode and speed from trajectory data via deep multi-scale learning. Comput. Netw. 2019, 162, 106861. [Google Scholar] [CrossRef]
  54. Li, M.; Wang, H.; Yang, L.; Liang, Y.; Shang, Z.; Wan, H. Fast hybrid dimensionality reduction method for classification based on feature selection and grouped feature extraction. Expert Syst. Appl. 2020, 150, 113277. [Google Scholar] [CrossRef]
  55. Guyon, I.; Weston, J.; Barnhill, S.; Vapnik, V. Gene selection for cancer classification using support vector machines. Mach. Learn. 2002, 46, 389–422. [Google Scholar] [CrossRef]
  56. Guyon, I.; Elisseeff, A. An introduction to variable and feature selection. J. Mach. Learn. Res. 2003, 3, 1157–1182. [Google Scholar]
  57. Chang, J.-R.; Chen, M.-Y.; Chen, L.-S.; Chien, W.-T. Recognizng Important Factors of Influencing Trust in O2O Models: An Example of OpenTable. Soft Comput. 2020, 24, 7907–7923. [Google Scholar] [CrossRef]
  58. Albashish, D.; Hammouri, A.I.; Braik, M.; Atwan, J.; Sahran, S. Binary biogeography-based optimization based SVM-RFE for feature selection. Appl. Soft Comput. 2021, 101, 107026. [Google Scholar] [CrossRef]
  59. Shao, Z.; Yang, S.; Gao, F.; Zhou, K.; Lin, P. A new electricity price prediction strategy using mutual information-based SVM-RFE classification. Renew. Sustain. Energy Rev. 2017, 70, 330–341. [Google Scholar] [CrossRef]
  60. Almansour, N.A.; Syed, H.F.; Khayat, N.R.; Altheeb, R.K.; Juri, R.E.; Alhiyafi, J.; Olatunji, S.O. Neural network and support vector machine for the prediction of chronic kidney disease: A comparative study. Comput. Biol. Med. 2019, 109, 101–111. [Google Scholar] [CrossRef] [PubMed]
  61. Chen, W.-K.; Chen, L.-S.; Pan, Y.-T. A text mining-based framework to discover the important factors in text reviews for predicting the views of live streaming. Appl. Soft Comput. 2021, 111, 107704. [Google Scholar] [CrossRef]
  62. Lee, I.G.; Yoon, S.W.; Won, D. A mixed integer linear programming support vector machine for cost-effective group feature selection: Branch-cut-and-price approach. Eur. J. Oper. Res. 2022, 299, 1055–1068. [Google Scholar] [CrossRef]
  63. Chen, W.-K.; Chang, J.-R.; Chen, L.-S.; Hsu, R.-Y. Using Refined Kano Model and Decision Trees to Discover Learners’ Needs for Teaching Videos. Multimed. Tools Appl. 2022, 81, 8317–8347. [Google Scholar] [CrossRef]
  64. Nalluri, V.; Chang, J.-R.; Chen, L.-S.; Yan, C.-W. Using feature selection methods to identify important factors of in-game consumption. Enterp. Inf. Syst. 2025, 2024, 2442403. [Google Scholar] [CrossRef]
  65. Chen, Y.; Liu, Z.; Chen, Z. AMS: A hyperspectral image classification method based on SVM and multi-modal attention network. Knowl.-Based Syst. 2025, 314, 113236. [Google Scholar] [CrossRef]
  66. Katoch, S.; Chauhan, S.S.; Kumar, V. A review on genetic algorithm: Past, present, and future. Multimed. Tools Appl. 2021, 80, 8091–8126. [Google Scholar] [CrossRef]
  67. Suresh, A.; Udendhran, R.; Balamurgan, M. Hybridized neural network and decision tree based classifier for prognostic decision making in breast cancers. Soft Comput. 2020, 24, 7947–7953. [Google Scholar] [CrossRef]
  68. Shimamura, S.; Hirata, K. Introducing fluctuation into increasing order of symmetric uncertainty for consistency-based feature selection. In Proceedings of the International Conference on Theory and Applications of Models of Computation, Kitakyushu, Japan, 13–16 April 2019; pp. 550–565. [Google Scholar] [CrossRef]
  69. Tanone, R.; Li, L.-H.; Saifullah, S. ViT-CB: Integrating hybrid Vision Transformer and CatBoost to enhance brain tumor detection with SHAP. Biomed. Signal Process. Control 2025, 100, 107027. [Google Scholar] [CrossRef]
Figure 1. Research flow chart of this study.
Bdcc 09 00119 g001
Figure 2. SVM-RFE selection factors for customer loyalty.
Bdcc 09 00119 g002
Figure 3. Correlation-based method selection factors for customer loyalty.
Bdcc 09 00119 g003
Figure 4. Consistency-based method selection factors for customer loyalty.
Bdcc 09 00119 g004
Figure 5. Overlapping key features across feature selection methods.
Bdcc 09 00119 g005
Figure 6. Comparison of training time between full and reduced models.
Bdcc 09 00119 g006
Table 1. List of factors of mobile ads.
No.Name of the FactorsDefinitionSupports
A1InvolvementThe extent to which customers engage with mobile advertisements.[43,44]
A2LanguageThe linguistic style and wording utilized in mobile advertisements.[43,44]
A3Type of websiteThe alignment of advertised products with the website where the ads are displayed.[43,44]
A4Information PrivacyThe safeguarding of users’ data and privacy by mobile advertisements.[29]
A5EntertainmentMobile ads evoke joy, delight, and smiles, positively influencing people.[42,45,46]
A6IrritationMobile ads generate annoyance, aversion, and other undesirable reactions.[42,44,45]
A7Perceived UsefulnessConsumers perceive the information in mobile advertisements as useful.[42,44,45]
A8Perceived ease of useMobile advertisements are user-friendly and effortless to navigate.[44,45]
A9CredibilityMobile ads create a sense of credibility and dependability for consumers.[44,45,46]
A10PriceMobile ads offer comprehensive pricing details for products and services.[22,44]
A11PreferenceMobile ads provide personalized information tailored to users’ interests.[22,44]
A12PromotionMobile ads incorporate promotional campaigns targeted at customers.[22,44]
A13InterestMobile ads present content relevant to users’ individual preferences.[22,44]
A14Brand nameMobile ads convey details regarding particular brands.[22,44]
A15Mobile deviceMobile ads distribute promotional messages that match the brand of the user’s mobile device.[22]
A16InformativenessMobile advertisements supply consumers with substantial and sufficient information.[44,46]
A17IncentivesMobile ads share promotional details through incentives like coupons, discounts, freebies, and rewards.[46]
A18Social mediaMobile ads leverage social media platforms for marketing campaigns.[48]
A19Rich mediaMobile ads include diverse multimedia formats (e.g., animations, audio, or videos) to communicate advertising messages.[47]
A20Game-basedMobile ads are embedded within games as part of marketing strategies.[44,48]
Table 2. Basic data analysis.
TitleScalePercentage (%)
GenderMale64.11%
Female35.89%
Highest educationBelow middle school0.00%
High school (vocational)2.70%
University/College79.67%
Institute and above17.63%
AgeUnder 1928.01%
20~29 years old65.98%
30~39 years old2.70%
40~49 years old2.49%
50~59 years old0.62%
Over 60 years old0.21%
Average monthly incomeLess than NTD 20,00083.61%
Between NTD 20,000 and 40,000 11.41%
Between NTD 40,000 and 60,000 4.36%
More than NTD 60,000 0.62%
Use a mobile device (every day)Between 0 and 3~ h28.84%
Between 3 and 6~ h45.44%
Between 6 and 9~ h18.46%
More than 9 h7.26%
Number of purchases made using mobile devices (half a year)Within 5 times75.93%
5~10 times15.77%
10~20 times5.81%
More than 20 times2.49%
Number of clicks on mobile ads (half a year)0~3 times60.17%
3~10 times30.50%
10~30 times5.80%
More than 30 times3.53%
Top reasons for recent clicks on mobile ads
(check)
Advertising is creative38.17%
Ads are interactive15.35%
Advertising is useful16.80%
Ads attract me43.36%
Interested in advertised products45.64%
Accidentally pressed53.53%
Never ordered10.79%
Where to find mobile ads
(check)
App65.35%
Shopping site41.08%
Facebook70.54%
Twitter5.81%
Youtube54.56%
Newsletter10.17%
Other2.28%
Purchase behaviorImmediate purchase8.30%
Consider buying in the future80.70%
Do not consider buying11.00%
Table 3. Reliability analysis.
FactorsCronbach’s AlphaFactorsCronbach’s Alpha
Involvement0.887Preference0.880
Language0.885Promotion0.880
Type of Website0.887Interest0.880
Information Privacy0.893Brand Name0.884
Entertainment0.884Mobile Device0.882
Irritation0.889Informativeness0.880
Perceived Usefulness0.882Incentives0.881
Perceived ease of use0.879Social Media0.884
Credibility0.883Rich Media0.882
Price0.881Game-based0.888
Table 4. Selection factors based on the correlation method.
MethodsFold1Fold2Fold3Fold4Fold5
Best First3,12,14,15,
16,18,19,20,
22,23,25,30,
31,34
3,13,15,16,
18,20,22,25,
30,34
3,15,16,18,
19,20,22,23,
25,30,34,37
3,13,14,15,
16,18,20,21,
22,25,30,31,
32,34,38
3,12,14,15,
16,18,19,20,
21,22,23,25,
30,34,37
Genetic
Search
3,10,15,16,
18,19,21,22,
23,34,37
15,16,18,19,
20,21,22,25,
26,31,34
3,15,16,18,
19,20,21,22,
23,26,34,37
12,14,16,18,
19,20,21,22,
25,30,34,37
15,16,18,19,
20,22,26,34
Greedy
Stepwise
3,12,14,15,
16,18,19,20,
22,23,25,30,
31,34
3,13,15,16,
18,20,22,25,
31,34
3,15,16,18,
19,20,22,23,
25,30,34,37
3,13,14,15,
16,18,20,21,
22,25,30,31,
32,34
3,12,14,15,
16,18,19,20,
21,22,23,25,
30,34,37
Linear Forward
Selection
3,12,14,15,
16,18,19,20,
22,23,25,30,
31,34
3,13,15,16,
18,20,22,25,
30,34
3,15,16,18,
19,20,22,23,
25,30,34,37
3,13,14,15,
16,18,20,21,
22,25,30,31,
32,34,38
3,12,14,15,
16,18,19,20,
21,22,23,25,
30,34,37
voting mechanism3,15,16,18,
19,22,23,34
15,16,18,20,
22,25,34
3,15,16,18,
19,20,22,23,
34,37
14,18,20,21,
22,25,30,34
15,16,18,19,
20,22,34
15 (80%), 16 (80%), 18 (100%), 19 (60%), 20 (80%), 22 (100%), 34 (100%)
Note: Four search methods are used for each fold, and the repeated factors will be filled in. Finally, the factors with more than three repetitions in 5Fold experiments are the important factors selected by this method.
Table 5. Selection factors based on the consistency method.
MethodsFold1Fold2Fold3Fold4Fold5
Best First3,9,13,16,19,
20,21,22,23,
25,30,31,38
3,9,13,14,
17,19,20,21,
22,23,25,30,
31,32,34,38
3,13,14,16,
17,19,20,21,
22,23,31,34
3,9,14,17,20,
22,23,25,30,
31,37,38
3,13,14,15,
17,20,21,22,
25,30,31,38
Genetic
Search
3,5,6,9,17,19,
20,21,23,25,
30,31,37,38
2,3,5,12,13,
14,15,19,21,
22,23,25,27,
30,31,35,38,
39
3,9,12,14,16,
19,21,22,25,
29,31,32,37,
38
3,9,10,13,14,
20,23,25,27,
30,31,35,38
3,4,9,10,14,
15,19,18,19,
20,21,23,30,
31,35,37,38
Greedy
Stepwise
3,9,13,16,19,
20,21,22,25,
30,31,38
9,13,14,15,
19,20,21,22,
23,25,30,31,
32,34
3,10,13,14,
16,17,19,20,
21,22,23,31,
34
3,9,14,17,20,
22,23,25,30,
31,37,38
3,13,14,15,
17,20,21,22,
25,30,31,38
Linear Forward
Selection
9,13,19,20,
21,22,23,25,
30,31,32,34,
38
3,9,13,14,
17,19,20,21,
22,23,25,26,
27,30,31,34,
38
3,9,13,14,16,
17,20,21,22,
23,25,31,34,
38
3,14,16,20,
21,22,23,25,
30,31,34,37,
38
3,12,14,15,
18,19,20,21,
22,23,31
voting mechanism9,19,20,21,
25,30,31,38
13,14,19,21,
22,23,25,30,
31
3,14,16,21,
22,31
3,14,20,23,
25,30,31,38
3,14,15,20,
21,31
3 (60%), 14 (80%), 20 (60%), 21 (80%), 25 (60%), 30 (60%), 31 (100%)
Note: Four search methods are used for each fold, and the repeated factors will be filled in. Finally, the factors with more than three repetitions in 5Fold are the important factors selected by this method.
Table 6. Summary of selected factors by three feature selection methods.
FactorsNo.ConsistencyCorrelationSVM-
RFE
Involvement1
2
Language3 VV
4
Type of Website5
6 V
Information Privacy7
8
Entertainment9
10
Irritation11 V
12
Perceived Usefulness13
14 V
Perceived ease of use15V
16V
Credibility17
18V V
Price19V
20VVV
Preference21 V
22V V
Promotion23
24 V
Interest25 V
26
Brand Name27
28
Mobile Device29
30 V
Informativeness31 V
32
Incentives33
34V
Social Media35
36
Rich Media37
38 V
Game-based39
40
Table 7. Performance evaluation by SVM.
Original Feature Set (Without Implementing Feature Selection)—40 Variables
IndicatorsFold1Fold2Fold3Fold4Fold5Avg.(std.)
Accuracy (%)62.5067.7170.8369.7969.7968.12(3.34)
Precision (%)61.8068.5069.4072.6069.2068.30(3.96)
Recall (%)62.5067.7070.8069.8069.8068.12(3.34)
F1 (%)60.8064.0066.9067.0068.1065.36(2.97)
Time (s)13.6832.1013.7025.3523.5121.67
Consistency—7 variables
Accuracy (%)62.5066.6767.7169.7967.7166.88(2.70)
Precision (%)61.8066.6767.0077.4066.8067.93(5.72)
Recall (%)62.5066.6767.7069.8067.7066.87(2.70)
F1 (%)60.8063.2067.3065.4066.6064.66(2.66)
Time (s)5.048.168.338.789.708.00
Correlation—7 variables
Accuracy (%)63.5466.6772.9270.8370.8368.96(3.78)
Precision (%)63.3066.7071.8074.7070.2069.34(4.44)
Recall (%)63.5066.7072.9070.8070.0868.80(3.71)
F1 (%)61.2063.2071.8067.9069.7066.76(4.44)
Time (s)10.034.888.978.089.118.21
SVM-RFE—8 variables
Accuracy (%)60.4265.6365.6368.7670.8366.25(3.94)
Precision (%)59.4064.8064.4072.9070.6066.42(5.37)
Recall (%)60.4065.6065.6068.8070.8066.24(3.95)
F1 (%)58.6062.9064.8065.1069.0064.08(3.78)
Time (s)5.277.698.539.367.897.75
Table 8. Hypothesis testing for efficiency.
Hypothesesp-ValueDecision
H 0 :   μ f u l l μ c o n s i s t e n c y H 1 :   μ f u l l > μ c o n s i s t e n c y 0.01Reject H0
H 0 :   μ f u l l μ c o r r e l a t i o n H 1 :   μ f u l l > μ c o r r e l a t i o n 0.011Reject H0
H 0 :   μ f u l l μ S V M R F E H 1 :   μ f u l l > μ S V M R F E 0.009Reject H0
Table 9. Results of the sensitivity analysis.
Used Features IndicatorsSelected FactorsUnselected FactorsPass or Not
Consistency
Accuracy (%)66.88(2.70)68.34(2.51)Not
Time (s)8.0018.90
Number of used features733
Correlation
Accuracy (%)68.96(3.78)67.50(2.59)Pass
Time (s)8.2121.06
Number of used features733
SVM-RFE
Accuracy (%)66.25(3.94)66.46(1.36)Pass
Time (s)7.7520.40
Number of used features832
Table 10. The selected important factors and the given suggestions.
Selected FactorsSuggestionsSelected FactorsSuggestions
PriceMobile ads should give customers clear product price information, such as displaying the product’s price tag in the mobile advertisement.InterestMobile ads should show products or services that customers are interested in. For example, mobile ads can provide advertisements for video games and beauty products according to gender and launch advertisements for their favorite products according to personal preferences.
PreferenceMobile ads should provide customers with their preferred products or services, as mobile ads can distribute possible advertisements according to the customer’s location (car parking area).
LanguageMobile ads can increase customer loyalty if they use text-based language that is friendly to viewers, such as local catchphrases or language that incorporates current events.Mobile deviceMobile ads should be served with customer-owned devices, e.g., ads for products of the same brand on customer-owned branded devices.
Perceived usefulnessMobile ads should be helpful to customers, such as providing customers with the products they need to search for on mobile ads or recommending products when customers need them.InformativenessMobile ads should give customers enough product information. For example, mobile ads should let customers know the content of the product.
Disclaimer/Publisher’s Note: The statements, opinions and data contained in all publications are solely those of the individual author(s) and contributor(s) and not of MDPI and/or the editor(s). MDPI and/or the editor(s) disclaim responsibility for any injury to people or property resulting from any ideas, methods, instructions or products referred to in the content.

