Article

AI-Powered Trade Forecasting: A Data-Driven Approach to Saudi Arabia’s Non-Oil Exports

College of Computer Science and Information Technology, King Faisal University, P.O. Box 380, Al-Ahsa 31982, Saudi Arabia
*
Author to whom correspondence should be addressed.
Big Data Cogn. Comput. 2025, 9(4), 94; https://doi.org/10.3390/bdcc9040094
Submission received: 7 March 2025 / Revised: 27 March 2025 / Accepted: 31 March 2025 / Published: 9 April 2025
(This article belongs to the Special Issue Industrial Data Mining and Machine Learning Applications)

Abstract

This paper investigates the application of artificial intelligence (AI) in forecasting Saudi Arabia’s non-oil export trajectories, contributing to the Kingdom’s Vision 2030 objectives for economic diversification. A suite of machine learning models, including LSTM, Transformer variants, Ensemble Stacking, XGBRegressor, and Random Forest, was applied to historical export and GDP data. Among them, the Advanced Transformer model, configured with an increased attention head size, achieved the highest accuracy (MAPE: 0.73%), effectively capturing complex temporal dependencies. The Non-Linear Blending Ensemble, integrating Random Forest, XGBRegressor, and AdaBoost, also performed robustly (MAPE: 1.23%), demonstrating the benefit of leveraging heterogeneous learners. While the Temporal Fusion Transformer (TFT) provided a useful macroeconomic context through GDP integration, its relatively higher error (MAPE: 5.48%) highlighted the challenges of incorporating aggregate indicators into forecasting pipelines. Explainable AI tools, including SHAP analysis and Partial Dependence Plots (PDPs), revealed that recent export lags (lag1, lag2, lag3, and lag10) were the most influential features, offering critical transparency into model behavior. These findings reinforce the promise of interpretable AI-powered forecasting frameworks in delivering actionable, data-informed insights to support strategic economic planning.

1. Introduction

The Kingdom of Saudi Arabia (KSA) is strategically diversifying its economy as part of its Vision 2030, moving away from its traditional reliance on oil revenues to foster a more robust, versatile economic landscape. This pivot necessitates innovative approaches to understanding and predicting economic dynamics, particularly in non-oil export sectors, which are poised to play a pivotal role in the nation’s future economic stability and growth [1,2]. Artificial intelligence (AI) presents a groundbreaking opportunity to enhance the accuracy and efficiency of these predictions, leveraging advanced computational techniques to analyze complex, voluminous datasets more effectively than traditional statistical methods [3,4,5].
The challenge lies in the need for precise and reliable forecasting methods to guide economic planning and policy decisions. Accurate forecasts are essential for Saudi Arabia to effectively navigate its economic diversification and achieve sustainable growth. Indeed, the integration of AI into economic forecasting represents not merely a technological upgrade but a paradigm shift in how data-driven insights can inform strategic decision making processes.
This research focuses on employing a suite of sophisticated machine learning models, including Long Short-Term Memory networks (LSTM), Transformers, and XGBoost, to analyze and predict the future trajectories of Saudi Arabia’s non-oil exports. These models were selected for their proven capability in handling sequential data and their applicability to decoding complex patterns within time-series datasets, a common characteristic of export data [6,7,8,9,10].
During the experiments of this study, baselines of the aforementioned models and their advanced versions were used. LSTM and Deep LSTM are designed to handle time-series data by maintaining long-term memory and capturing complex patterns. Transformers use self-attention mechanisms to process data in parallel, enhancing efficiency and accuracy. The XGBRegressor and Random Forest methods utilize decision trees to boost performance and control overfitting, while the AdaBoostRegressor combines weak learners to form a strong predictive model. The Temporal Fusion Transformer (TFT) further enhances forecasting by integrating LSTM-based sequence encoding with attention mechanisms, effectively capturing both short-term and long-term temporal dependencies. Overall, we found that the Transformer model, with its sophisticated configurations, achieved the highest predictive accuracy.
In addition, Explainable AI (XAI) tools were employed in this study to identify key features, like recent export lags, providing interpretability and transparency in the model’s predictions. The Ensemble Blending Model, which combines Random Forest, XGBoost, and AdaBoost through an XGBoost Regressor as the meta-learner, leverages the strengths of these base models to achieve robust predictions. Namely, the XAI techniques, including SHAP Force Plots, Feature Importance analysis, and Partial Dependence Plots, revealed the critical role of recent temporal lags (lag1, lag2, and lag3) in shaping forecast outcomes. Moreover, the Ensemble Stacking model, which utilizes the Ridge Regression as the meta-learner, balances the diverse strengths of the base models to produce a harmonized and accurate predictive framework [6,7,10,11,12,13,14,15].
Furthermore, by incorporating the Gross Domestic Product (GDP) data as a contextual feature, the model generates forecasts that offer valuable macroeconomic insights. Indeed, the inclusion of GDP indicators in these models allows for a nuanced understanding of how broader economic conditions affect export performance [16]. However, our preliminary findings indicate that integrating GDP data may not always enhance predictive accuracy. For instance, the Transformer model incorporating GDP data exhibited a slight increase in the Mean Absolute Percentage Error (MAPE) values, suggesting that certain macroeconomic indicators might introduce noise rather than clarity into the predictive models. Conversely, the Advanced Transformer model, which processes export data without GDP inclusion, achieved a markedly lower MAPE, illustrating its superior capability in isolating and learning the inherent patterns within the export data [17].
There is no doubt that the leveraging of AI in Saudi Arabia’s economic forecasting toolkit aligns with the broader objectives of Vision 2030 by promoting more informed, data-driven policymaking. In terms of enhancing the precision of export forecasts, this study not only supports economic diversification plans but also provides valuable insights that could influence policy decisions, investment strategies, and economic reforms aimed at ensuring KSA’s long-term economic sustainability and growth. This study not only tests the efficacy of AI models in economic forecasting but also critically evaluates the impact of integrating various economic indicators into these models. The outcomes of this research are expected to contribute significantly to the academic literature on economic forecasting and provide practical insights for policymakers and economic strategists in Saudi Arabia and beyond [18].
Overall, the contributions of this paper can be summarized as follows:
(1)
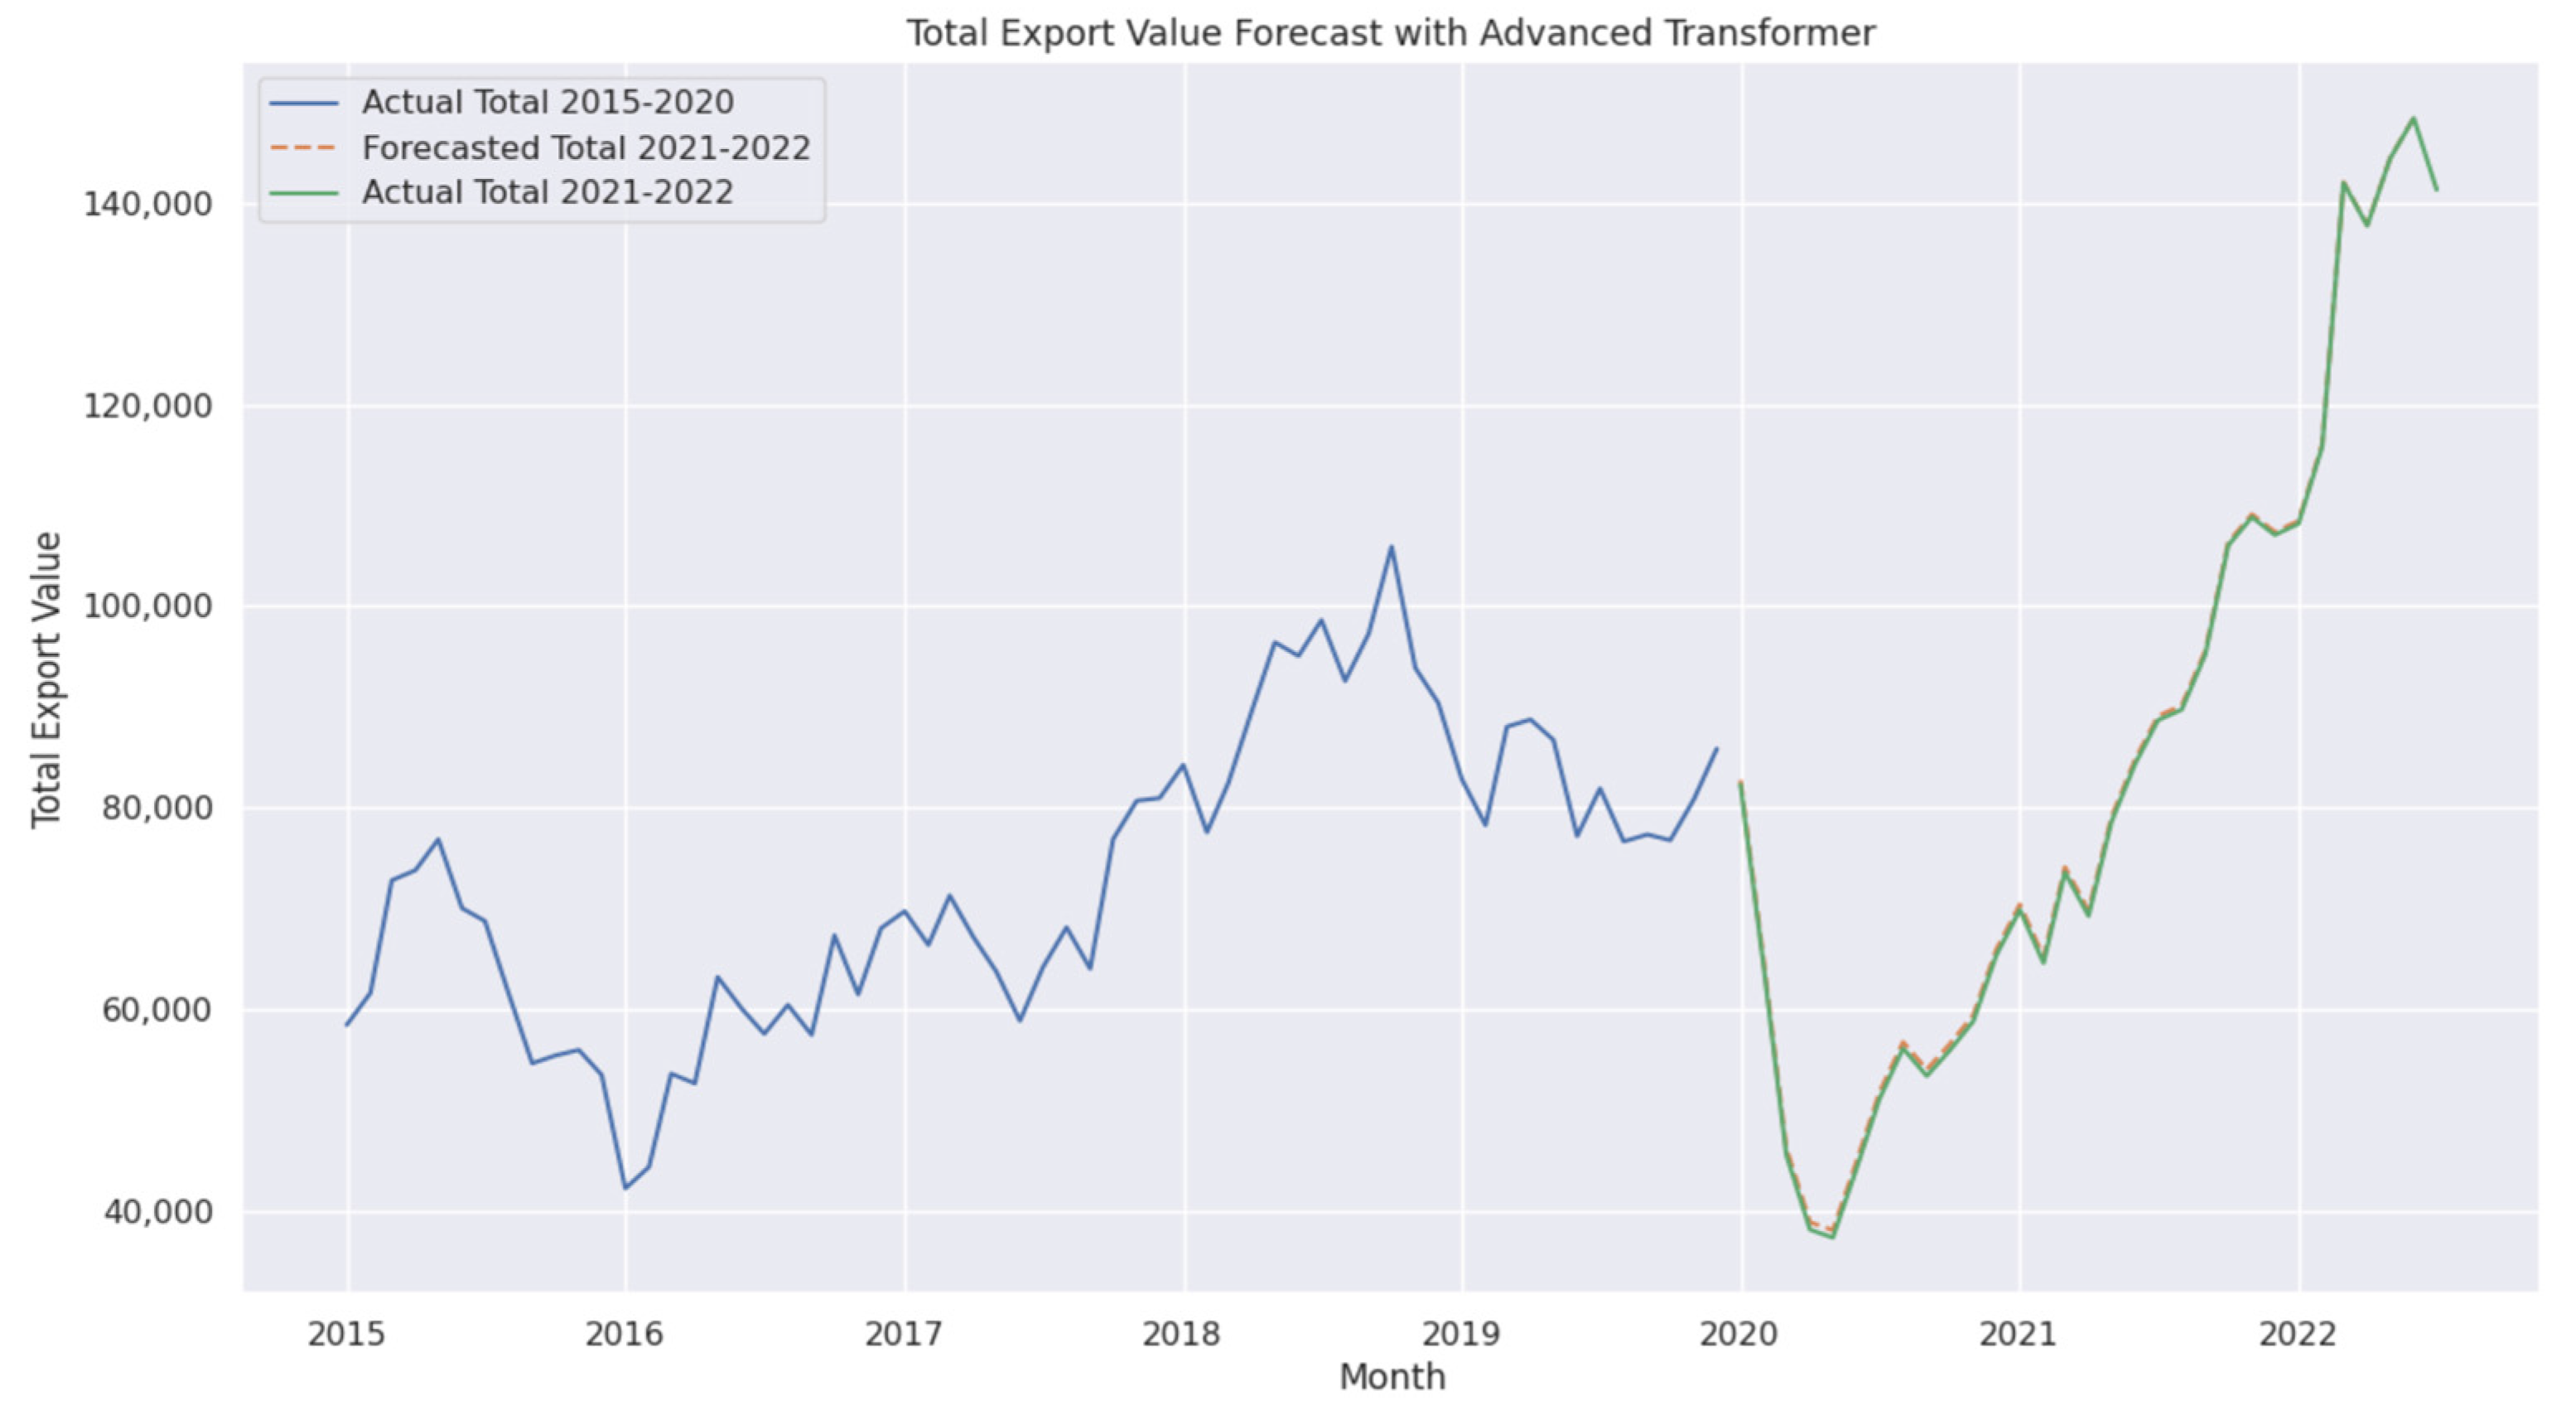
It develops an Advanced Transformer model achieving unparalleled accuracy (MAPE: 0.73%), demonstrating AI’s potential for economic diversification.
(2)
It introduces Blending and Stacking models, combining diverse algorithms with Explainable AI to improve prediction robustness and transparency.
(3)
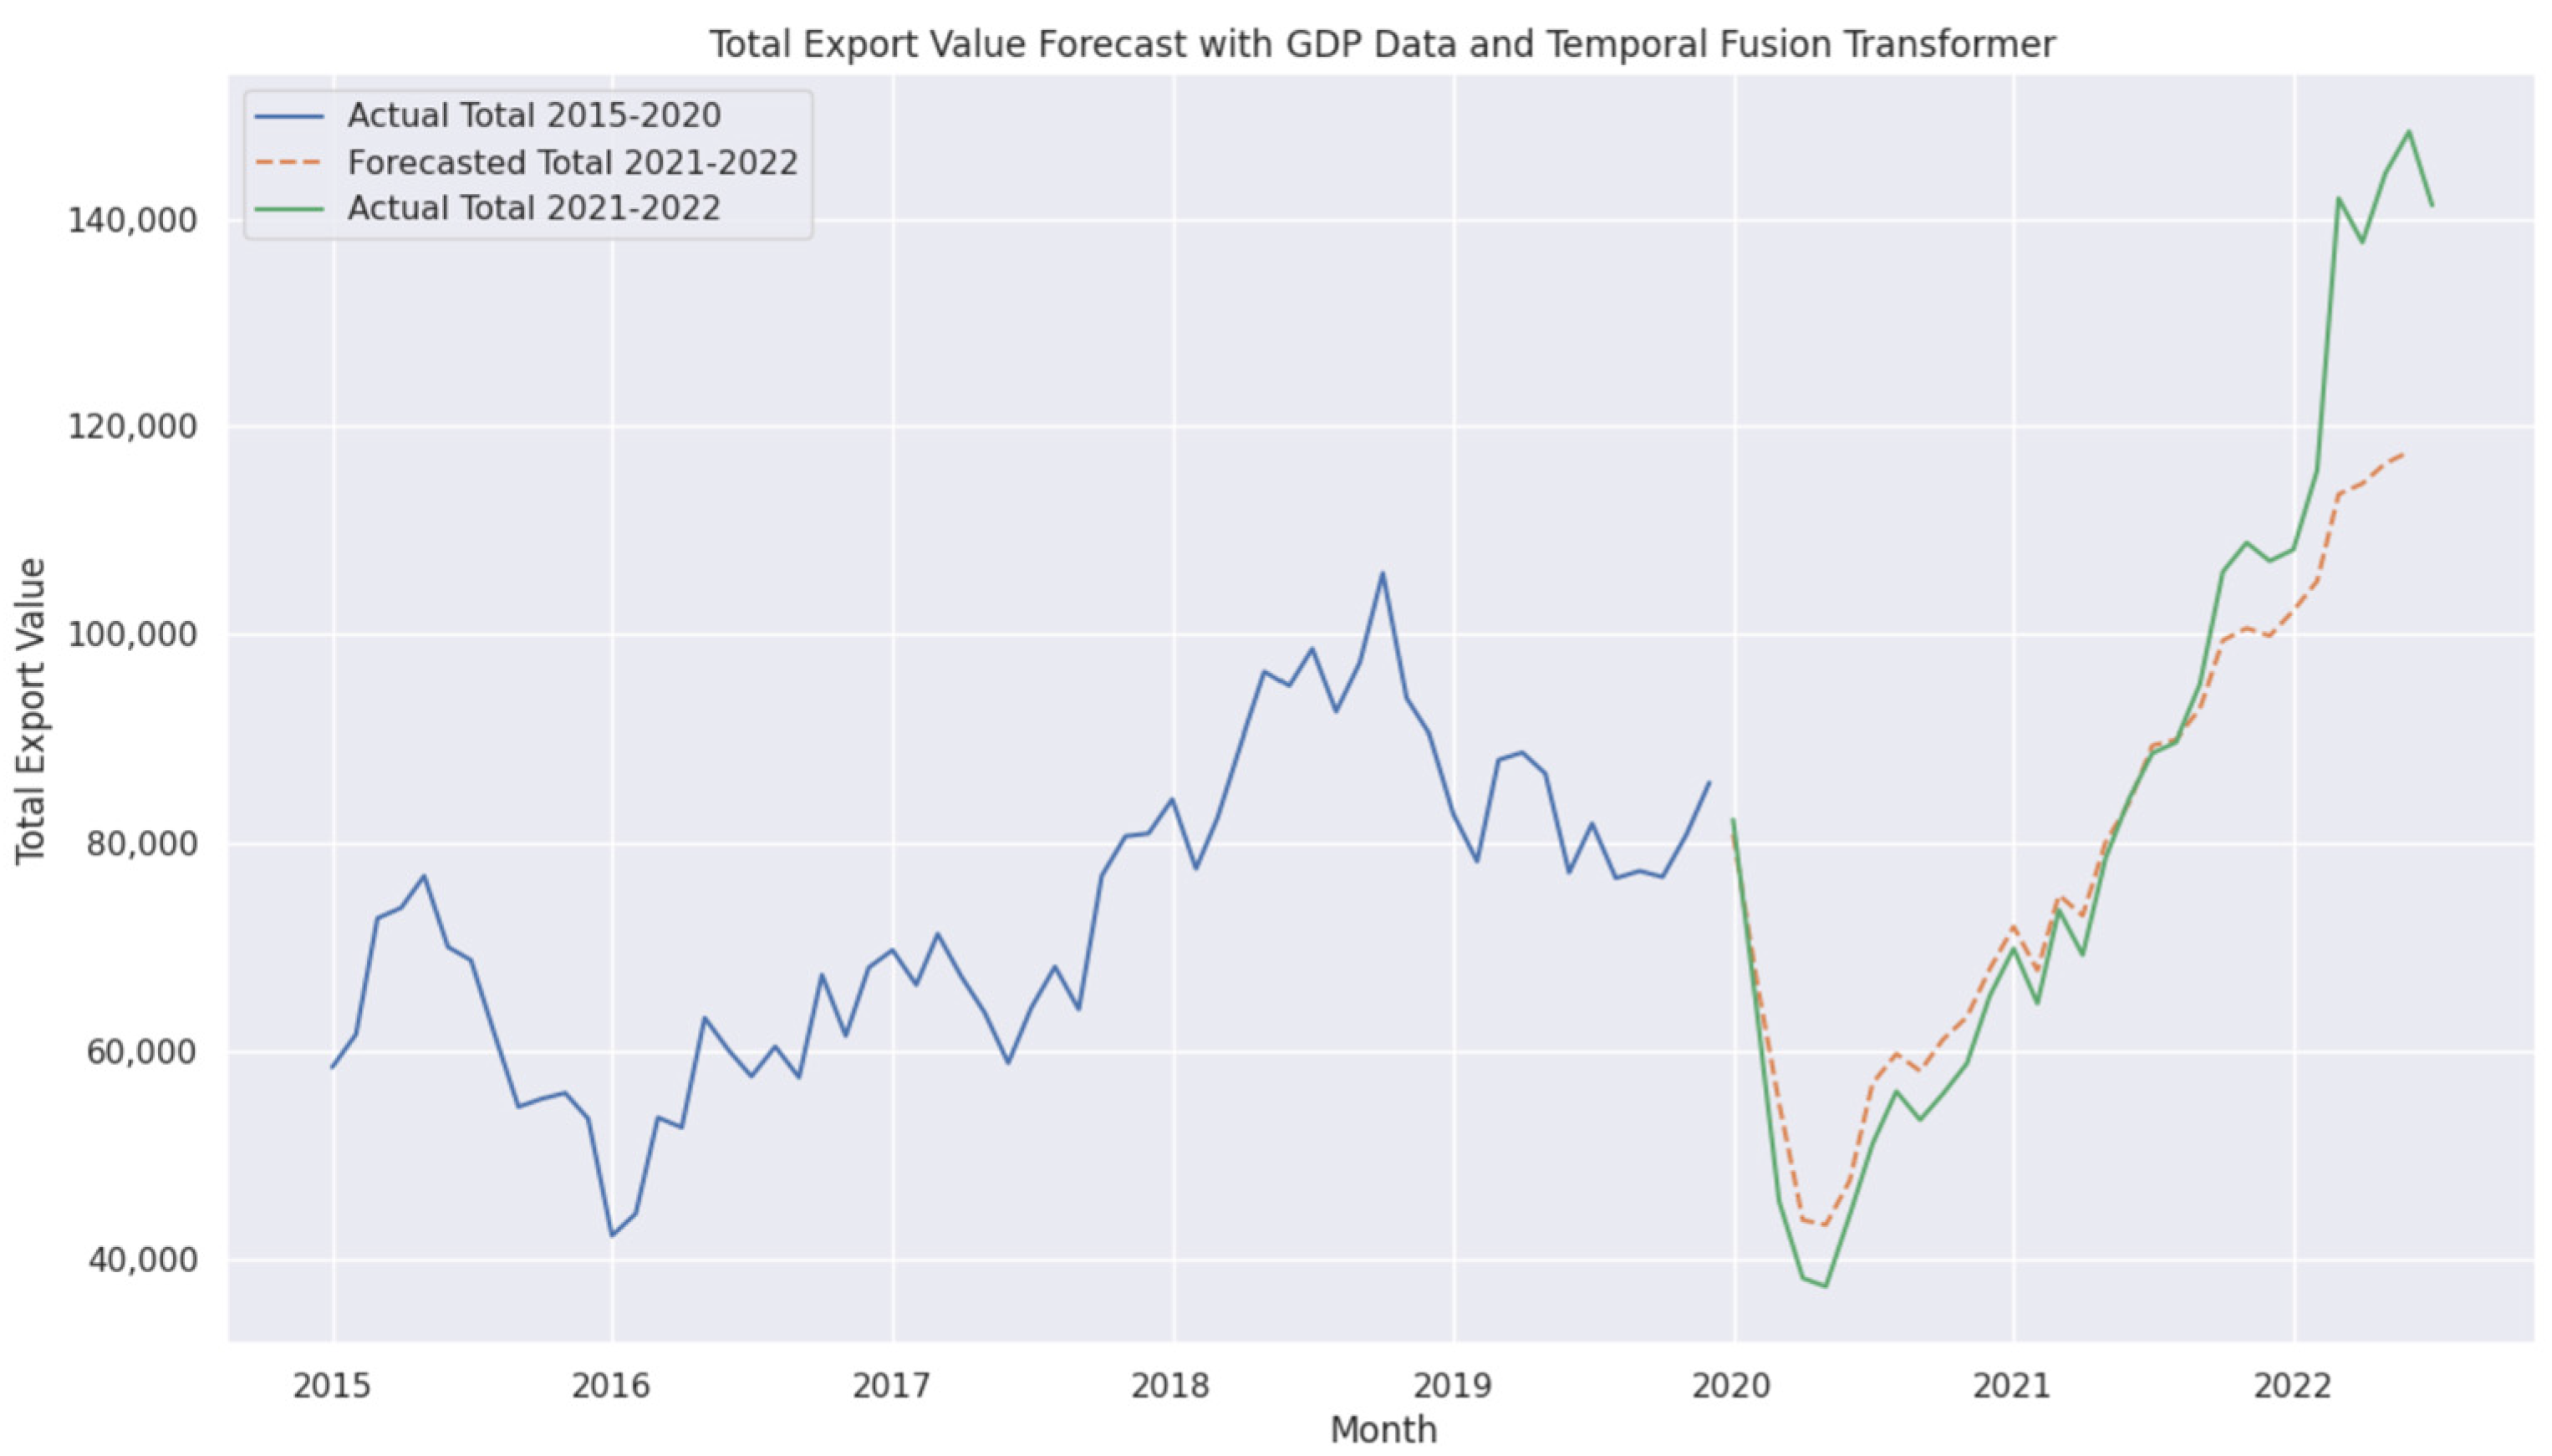
It explores GDP integration in the Transformer and Temporal Fusion Transformer (MAPEs of 2.67% and 5.48%, respectively), offering new macroeconomic insights despite noise challenges, advancing contextual forecasting.
(4)
It provides AI-driven trade forecasting insights, supporting economic diversification and enable real-time policymaking aligned with Vision 2030 objectives.
(5)
It establishes a new benchmark for AI-based economic forecasting, addressing gaps in prior studies through comprehensive model evaluation and enhancement.
The remainder of this paper is structured as follows. Section 2 presents a review of recent work in the literature related to non-oil export forecasting. Section 3 details the materials used in this study, including the dataset and the methodological framework. Section 4 provides a comprehensive analysis of the experimental results. Section 5 discusses the key findings, limitations, and broader implications of the study. Finally, Section 6 concludes the paper and outlines potential directions for future research.

2. Literature Review

The integration of AI into economic forecasting offers a transformative approach to predicting market trends, particularly in Saudi Arabia’s export sector. This section explores the application of AI methodologies across various domains, including energy demand, stock market predictions, Small and Medium Enterprises’ (SMEs) export values, and broader export diversification efforts within Saudi Arabia. By examining recent studies, this review highlights AI’s role in enhancing the accuracy and efficiency of economic forecasts, supporting the country’s strategic diversification and planning efforts [19,20].
Saudi Arabia is undergoing a crucial economic transformation, shifting from an oil-dependent economy to a more diversified landscape. In this context, AI-driven forecasting serves as a powerful tool, offering valuable insights for policymakers and strategic planners. This review synthesizes key research findings on AI applications in forecasting Saudi Arabia’s export trajectories, providing an overview of methodologies and their implications across various sectors.
Al-Fattah [21] introduced GANNATS, a model combining genetic algorithms, artificial neural networks, and data mining techniques to forecast gasoline demand in Saudi Arabia. Utilizing historical gasoline demand data from 1971 to 2016 for model validation and 2017 data for testing, the model achieved a 93.5% accuracy rate, demonstrating AI’s potential in energy forecasting.
Jarrah and Derbali [6] applied LSTM to predict Saudi stock market indices, including opening, lowest, highest, and closing prices. To enhance accuracy, they incorporated Exponential Smoothing (ES) for noise reduction. The model, trained on Saudi Stock Exchange (Tadawul) data, achieved 97.49% accuracy in forecasting closing prices over a seven-day horizon.
Jitsakul and Whasphuttisit [19] explored time-series forecasting for SMEs’ export values to Saudi Arabia using the Moving Average, decomposition, and Winter’s Method. Their dataset spanned 2017 to 2021 (60 months), with the first four years used for training and the final year for validation. The decomposition model demonstrated the best performance, highlighting its suitability for export trend analysis. Haque [20] assessed Saudi Arabia’s export diversification, emphasizing the importance of non-mineral exports. AI-driven analysis provided deeper insights into diversification trends, offering strategic guidance to reduce the country’s reliance on oil exports.
Yoo and Oh [7] proposed a Seasonal LSTM (SLSTM) model to forecast agricultural product sales, incorporating seasonal attributes (week, month, quarter) into historical time-series data. Their results showed that SLSTM outperformed AutoARIMA, Prophet, and standard LSTM in reducing error rates. These findings underscore SLSTM’s potential for enhancing supply chain stability through improved forecast accuracy.
In a broader international context, Dave et al. [8] developed a hybrid ARIMA–LSTM model to forecast Indonesia’s export volumes. While ARIMA efficiently handled linear data trends, LSTM captured non-linear patterns, resulting in superior accuracy. Their model achieved an MAPE of 7.38% and an RMSE of 1.66 × 10¹³, offering a robust forecasting tool for economic planning and policymaking. Sirisha et al. [9] compared ARIMA, SARIMA, and LSTM models, finding that LSTM outperformed the statistical models, achieving 97.5% accuracy in financial forecasting, particularly for datasets with long-term dependencies.
Despite these sincere efforts, previous studies have not fully explored Transformer-based models for predicting trade patterns. Often, they relied on traditional methods, such as LSTM and Random Forest, without conducting comprehensive comparative analyses. Additionally, while some research incorporates macroeconomic indicators, like the GDP, integration has often been limited or insufficiently optimized, sometimes introducing noise rather than improving predictive accuracy. The role of ensemble learning approaches, such as Blending and Stacking, remains underexplored, particularly in economic forecasting, where combining multiple algorithms could enhance prediction stability and robustness.
Moreover, previous studies have largely overlooked the explainability of AI models, making it difficult for decision makers to trust and interpret AI-driven forecasts. Finally, a crucial gap in the literature is the lack of integration of global economic factors, such as commodity prices, exchange rates, and trade policies, which are essential for building more reliable, context-aware forecasting models. Addressing these limitations is crucial for advancing AI-based trade forecasting and supporting data-driven economic policymaking.

3. Materials and Methods

3.1. Data Description

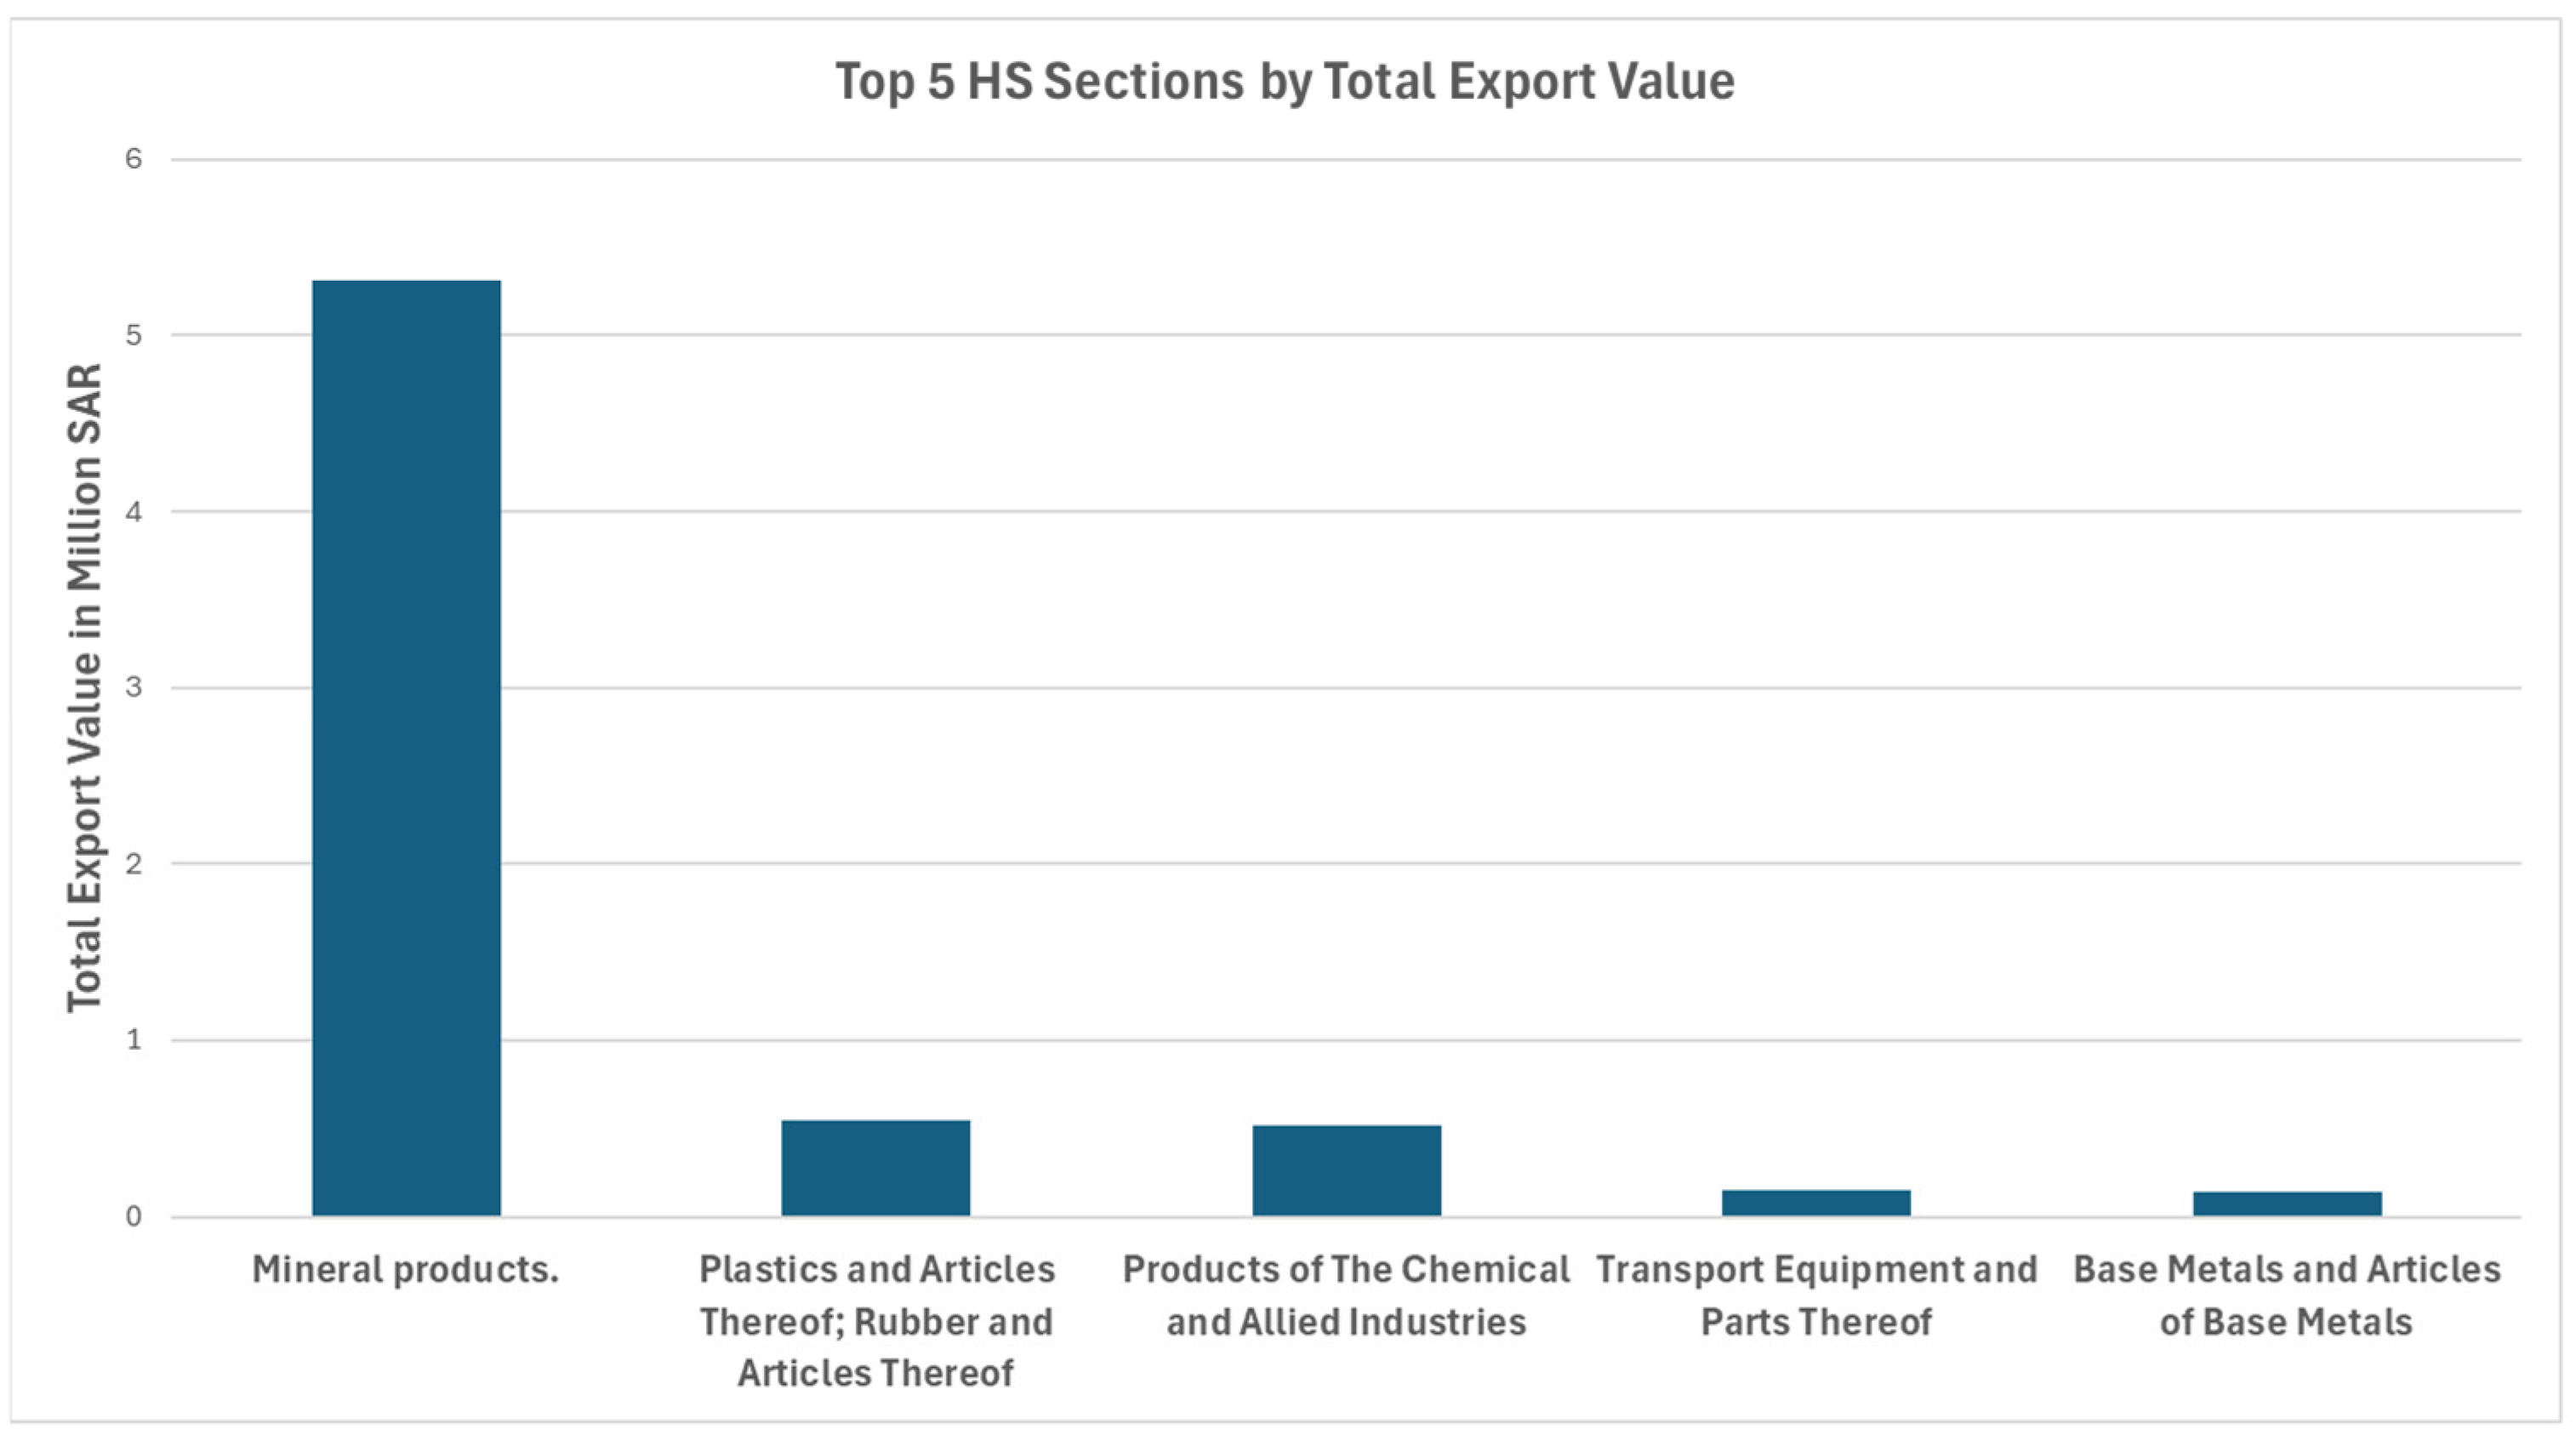
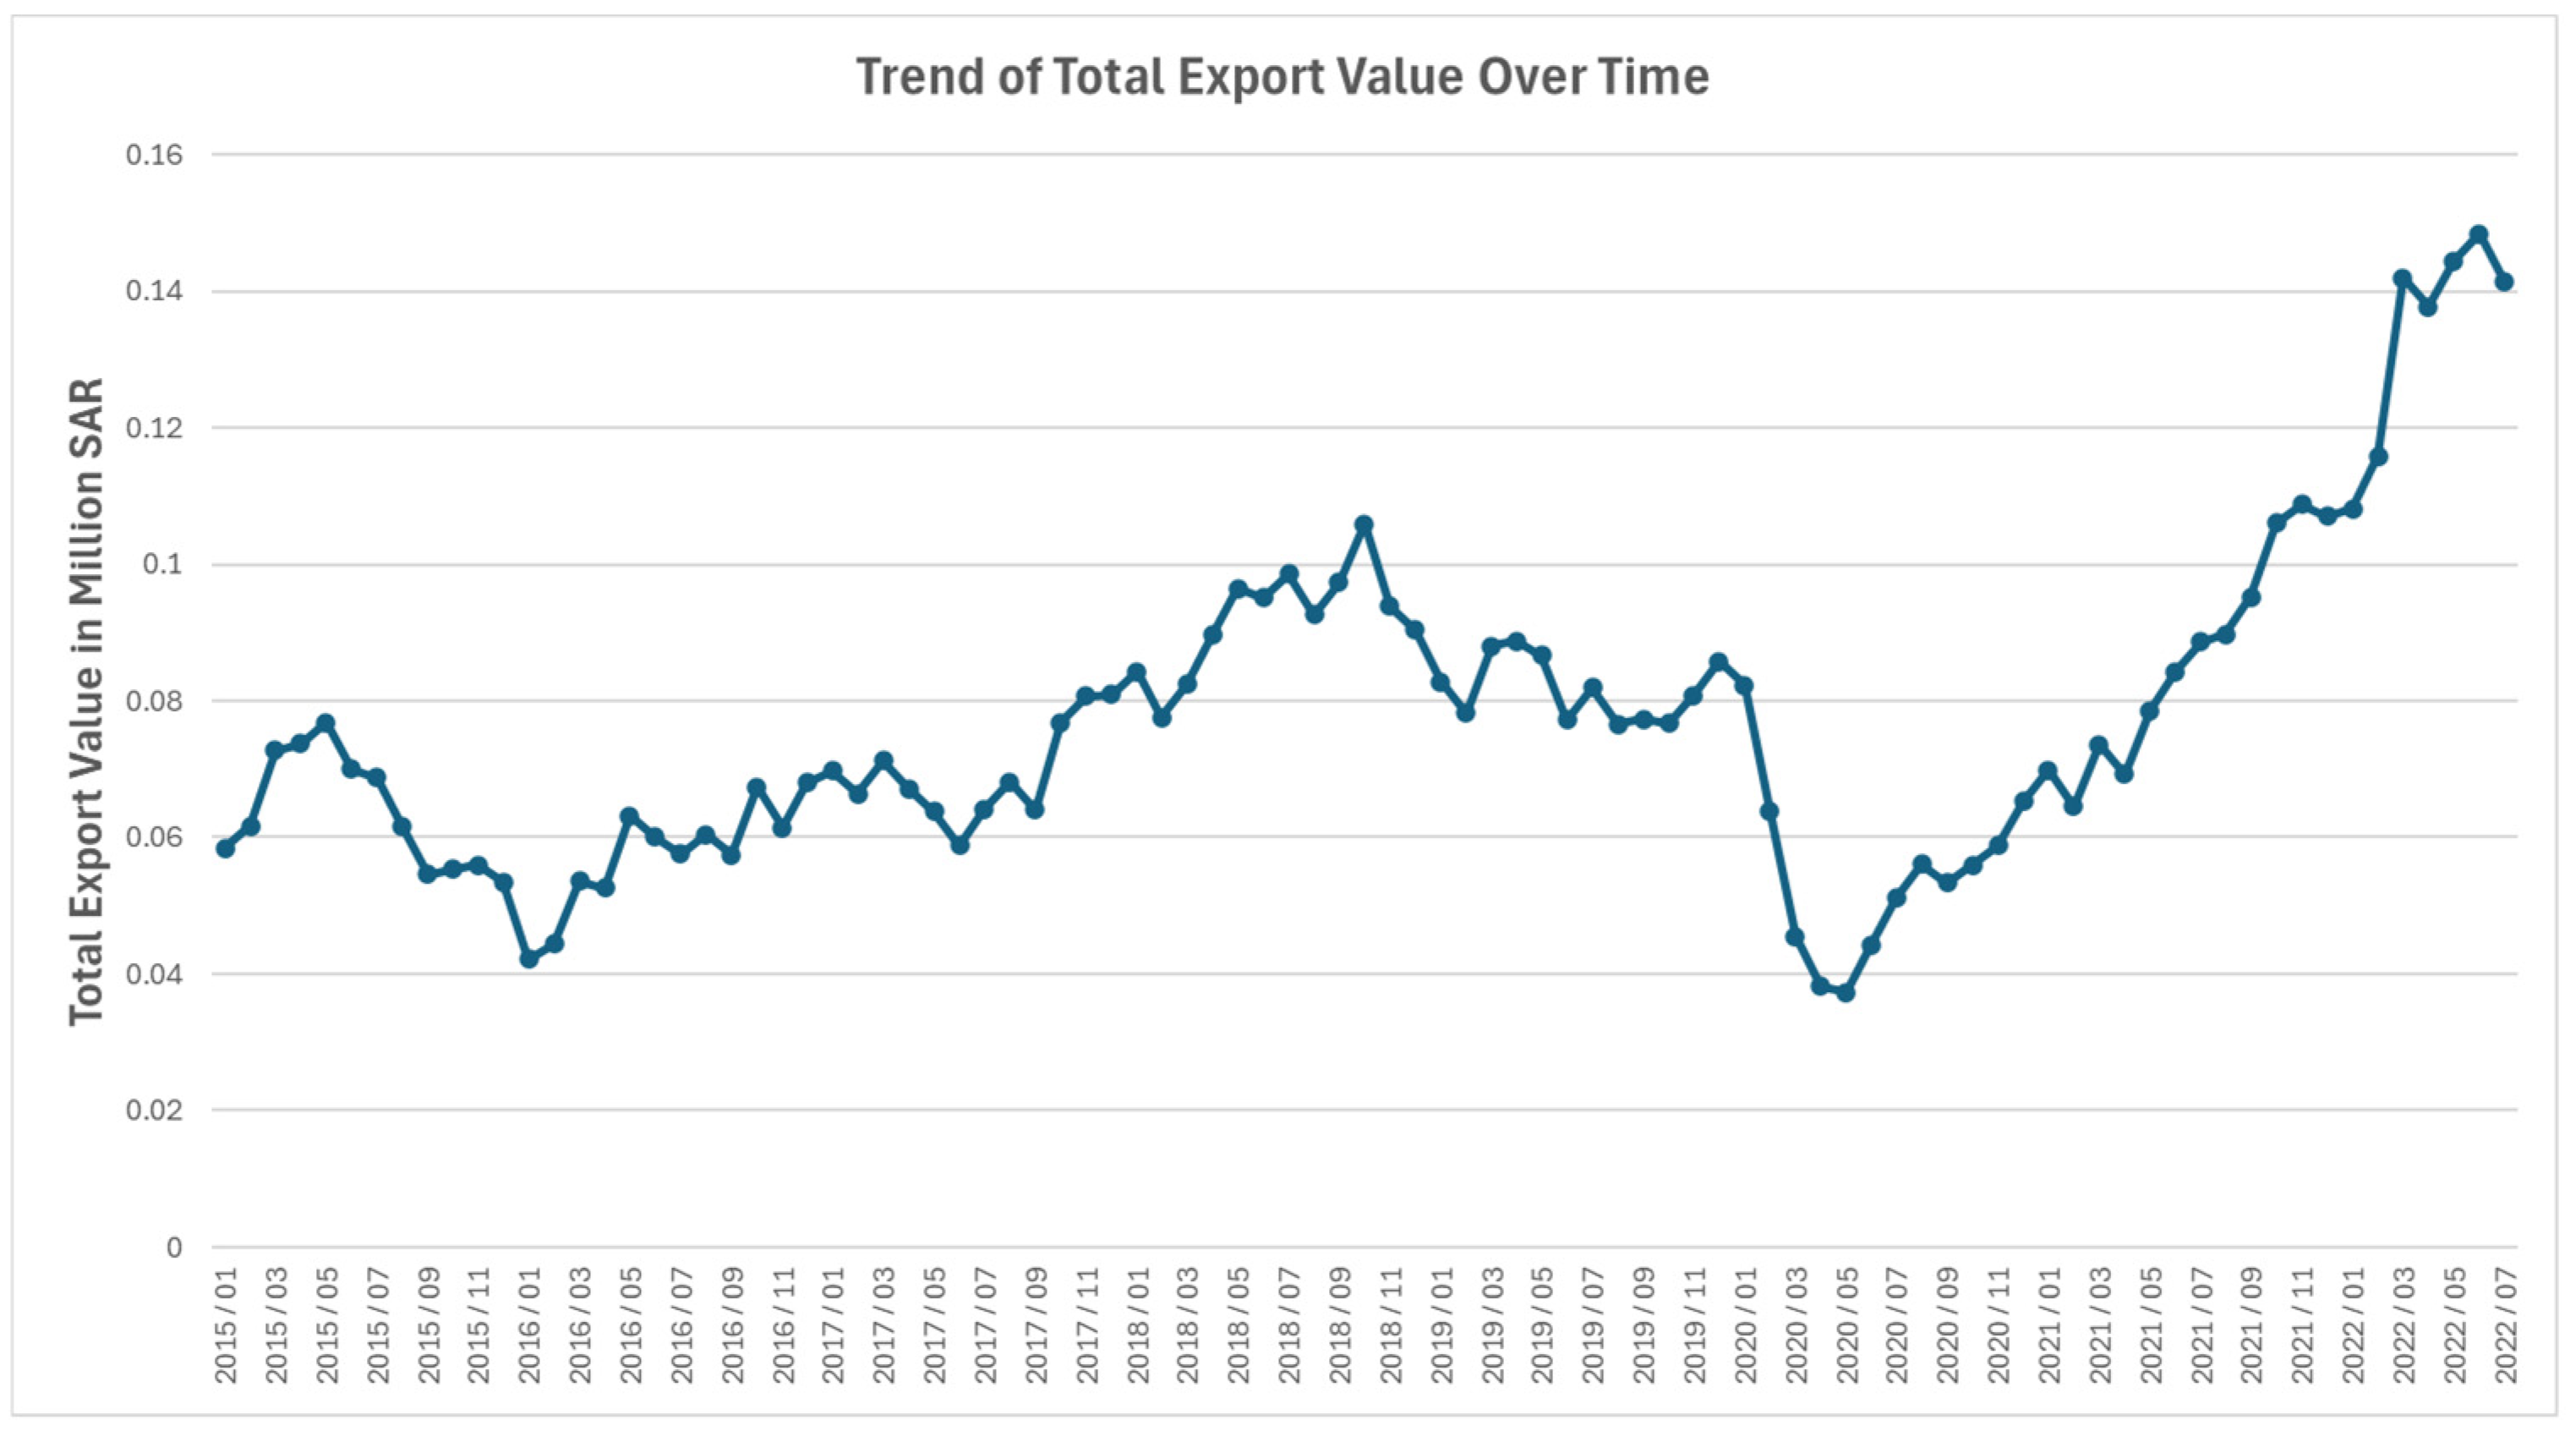
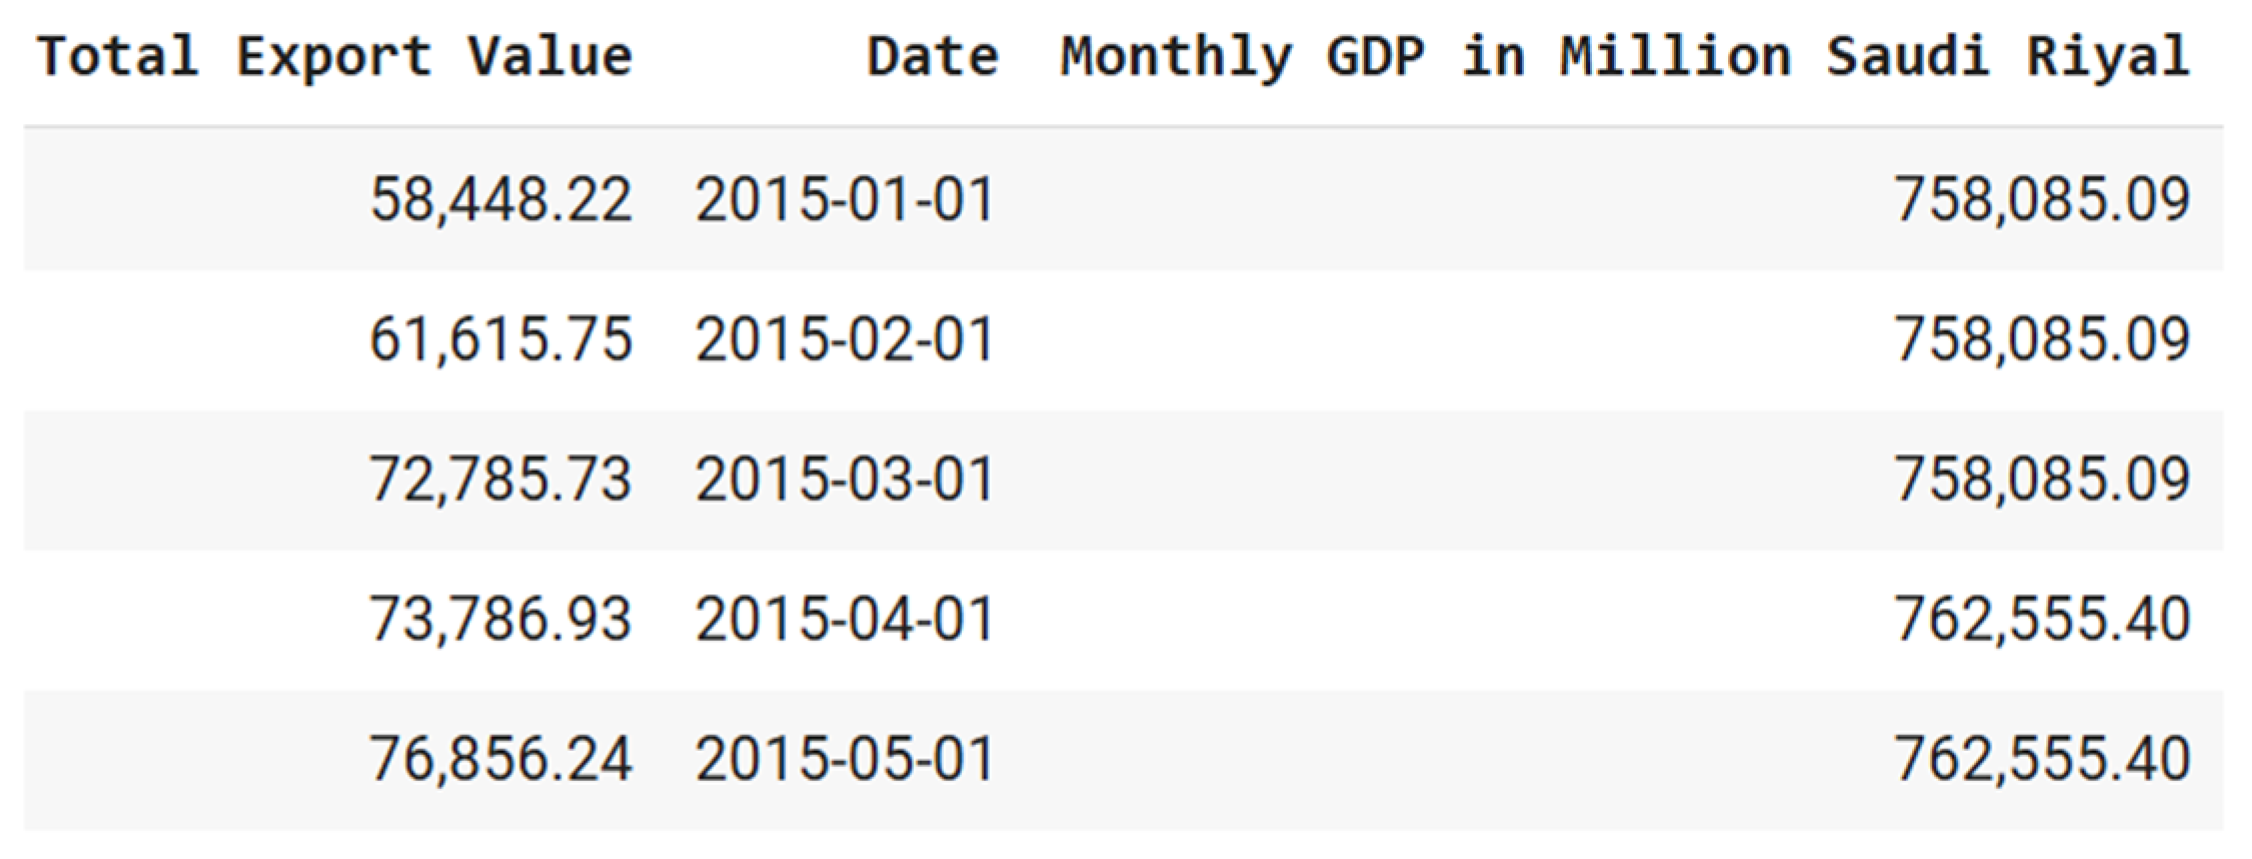
3.1.1. Export Values by Harmonized System (HS)

The dataset used in this paper comprises detailed records of Saudi Arabia’s total exports from 2015 to 2022, organized on a monthly basis. Exports are classified into 21 main categories, referred to as HS Sections, and further divided into 97 subcategories, known as HS Chapters, as shown in Figure 1 and Figure 2. The valuation of exported goods follows the Free on Board (FOB) delivery terms, which account for the cost of goods along with any additional expenses incurred until they are loaded onto the shipping vessel. As a result, the recorded export values represent all costs up to the point of departure from the export office. To clarify the results shown in the coming section, it is important to know that the average monthly export value is approximately 84,686.

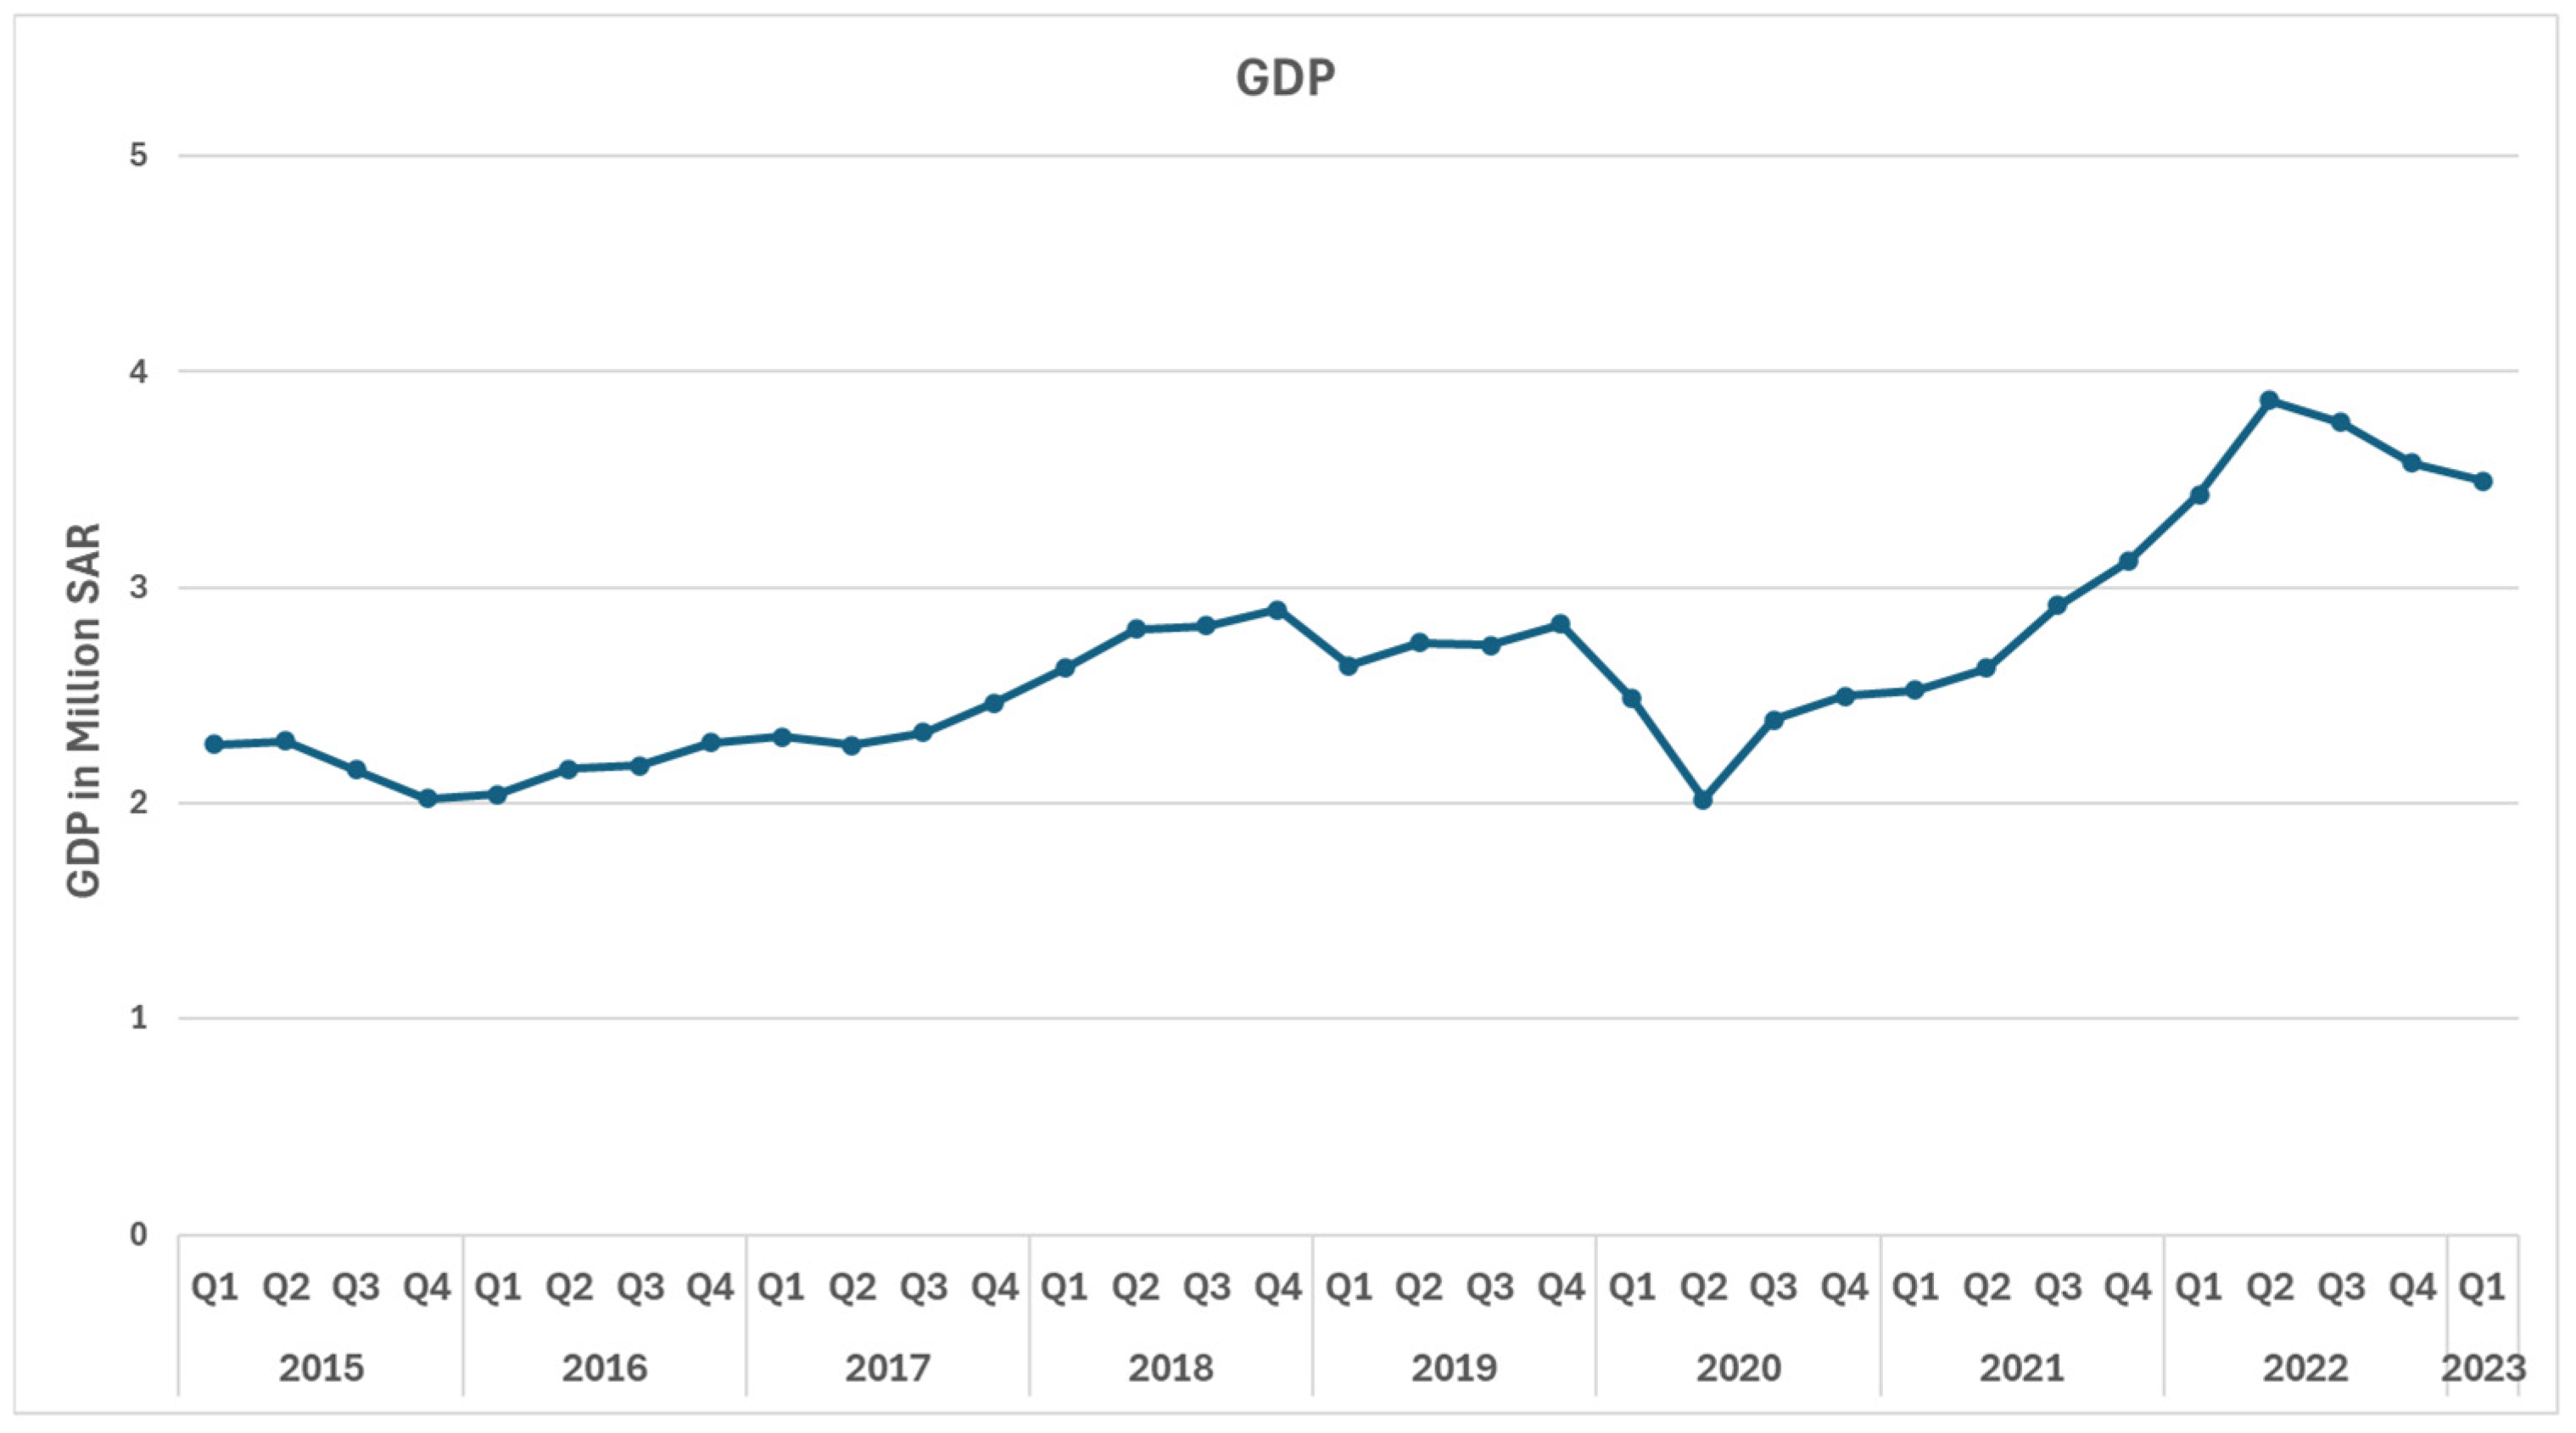
3.1.2. Gross Domestic Product (GDP)

The Gross Domestic Product (GDP) is a fundamental macroeconomic indicator that quantifies the total value of goods and services produced by a country over a specified period, irrespective of the production location. It serves as a comprehensive measure of national economic performance and is widely used in economic planning, policy evaluation, and trend analysis.
In this paper, the GDP was selected as an input variable due to its potential to reflect broader economic conditions that may influence trade activity, including investment levels, sectoral productivity, and fiscal policies. The dataset includes quarterly GDP records for Saudi Arabia spanning 2015 to 2022, categorized into 17 key sectors, such as manufacturing, government services, and construction, as illustrated in Figure 3. These sectoral breakdowns provide a high-level view of economic dynamics that could interact with export trends, particularly for long-term or contextual forecasting.

3.1.3. Data Sources and Preprocessing Procedure

The export and GDP data used in this paper were obtained from official governmental sources. Export data were sourced from the King Abdullah Petroleum Studies and Research Center (KAPSARC) [18], while GDP data were provided by the Saudi Arabian Monetary Authority (SAMA) [22]. Before analysis, the data underwent a preprocessing phase that included cleaning, normalization, and aggregation to ensure accuracy and focus on total values. Given the time-series nature of the data, transformation steps were applied to facilitate trend visualization and enhance the effectiveness of the machine learning models used in this paper.
Because GDP data are available on a quarterly basis, we converted each quarter’s total value to a monthly value by dividing by 3. We then created a monthly GDP column and merged it with the monthly export data using matching month identifiers. This alignment ensures that both data streams share the same temporal resolution. Figure 4 illustrates this merged dataset, providing a visual reference for both the GDP and the export value data used in our analysis.

3.2. Methodology

The methodology adopted in this paper follows a quantitative research framework, analyzing a comprehensive dataset of export values categorized by the Harmonized System and supplemented with GDP figures to assess economic impact. The research pipeline consists of several steps. First, data preprocessing was performed to ensure consistency, followed by aggregation based on HS Sections. Next, time-series transformation techniques were applied to facilitate trend visualization.
This paper employs a range of AI models, including LSTM, Deep LSTM, Transformer, Non-Linear Blending Ensemble, XGBRegressor, Ensemble Stacking, TFT, AdaBoostRegressor, and Random Forest [23]. Additionally, a separate iteration integrates GDP data into the Transformer model to examine the influence of broader economic indicators on forecast accuracy [24]. Model performance was evaluated using multiple metrics, including the Mean Squared Error (MSE), Root Mean Squared Error (RMSE), Mean Absolute Deviation (MAD), and Mean Absolute Percentage Error (MAPE).

3.2.1. Implementation Environment

All experiments and analyses were performed on a Windows 11 Home (version 22H2) laptop equipped with an Intel(R) Core(TM) i7-1255U CPU @ 2.60 GHz and 16 GB of RAM. The Python-based environment (3.11) included well-established data science libraries, such as NumPy, pandas, scikit-learn, TensorFlow, and PyTorch (2.6).

3.2.2. Transformer

The Transformer [25] is a deep learning architecture originally introduced for Natural Language Processing (NLP), but it has been widely adopted for time-series forecasting due to its ability to capture long-range dependencies. Unlike traditional recurrent models, which process data sequentially, the Transformer operates in parallel, significantly improving computational efficiency [26].
The core component of the standard Transformer is the self-attention mechanism, which enables the model to assign different levels of importance to various time steps in a sequence when making predictions. This is particularly valuable for economic forecasting, where past export trends influence future outcomes. The standard Transformer applies multiple attention heads to extract diverse patterns from the data. Each attention head typically has a head size of 64. Each head independently computes self-attention and is later combined, allowing the model to focus on different aspects of the input sequence. The self-attention mechanism follows the scaled dot-product attention formula:
A t t e n t i o n Q ,   K ,   V = S o f t m a x Q K T d k V
where Q, K, and V represent the query, key, and value matrices, respectively, and dk is the dimension of the keys and queries. The outputs of the self-attention mechanism are then passed through fully connected layers with ReLU activation functions, introducing non-linearity to enhance feature extraction and representation learning.
Because the standard Transformer lacks recurrence and convolutional structures, it does not inherently retain temporal ordering within time-series data. However, capturing the sequential nature of time-series data is crucial for forecasting tasks. To address this, positional encoding techniques are applied to enrich the temporal context of the input sequence [27]. In this paper, we adopt the sinusoidal positional encodings approach, which can be defined as
PE(pos, 2i) = sin (pos/10,0002i/dmodel)
PE(pos, 2i+1) = cos (pos/10,0002i/dmodel)
where pos is the position index and dmodel is the embedding size. The final layer generates export forecasts through fully connected dense layers, optimizing predictions using the Mean Squared Error (MSE) loss function for effective error minimization [25].

3.2.3. Advanced Transformer

Building on the standard Transformer architecture, the Advanced Transformer developed in this research maintains the original structure while introducing a key enhancement: increasing the attention head size to 128. This modification enables the model to capture more intricate dependencies within the export data, enhancing its ability to recognize complex patterns and improve forecasting accuracy.
It is important to note that the “128” used in describing the Advanced Transformer refers to the attention head size, not the number of time steps. The actual time-series data consist of 96 monthly observations from 2015 to 2022. Of these, 60 months (2015–2019) were used for training, and 36 months (2020–2022) were used for testing. The forecasting was conducted in a non-rolling fashion to simulate a realistic application of the model for long-term export planning and policy analysis.

3.2.4. Long Short-Term Memory (LSTM)

LSTM is a type of recurrent neural network (RNN) designed to learn long-term dependencies in sequential data. It is particularly suited to time-series forecasting, as it retains information over extended periods while mitigating the vanishing gradient problem, which affects traditional RNNs [28].

3.2.5. Deep LSTM

Deep LSTM extends the standard LSTM architecture by incorporating multiple stacked LSTM layers. This deeper structure enables the model to capture more complex patterns within time-series data, enhancing predictive performance [29].

3.2.6. XGBRegressor

XGBRegressor is a regression implementation of the XGBoost algorithm, which leverages gradient boosting on decision trees. It is widely used for its high efficiency and strong performance in handling structured and tabular data [30].

3.2.7. Random Forest

Random Forest is an ensemble learning technique that constructs multiple decision trees during training. It improves prediction accuracy by averaging the outputs of individual trees while reducing overfitting through random feature selection.

3.2.8. AdaBoostRegressor

AdaBoostRegressor is an ensemble learning method that builds a strong predictive model by iteratively combining multiple weak learners, which are typically decision trees. It adjusts the weights of weak learners to focus more on difficult training instances, progressively enhancing overall model performance.

3.2.9. Temporal Fusion Transformer (TFT)

The TFT integrates LSTM-based sequence encoding with attention mechanisms to capture temporal dependencies and contextual data patterns [31]. Its architecture consists of the following components:
  • LSTM Encoder: Extracts sequential information and retains long-term dependencies.
  • Transformer Blocks: Utilize multi-head attention mechanisms to enhance the model’s focus on relevant temporal features, capturing long-range dependencies.
  • Dense layers: Serve as the final prediction layers, incorporating GDP data as contextual input to forecast export values.
The model was trained for 400 epochs, achieving convergence in both training and validation loss. The inclusion of GDP data allows the model to account for macroeconomic factors influencing export trends while maintaining predictive accuracy.

3.2.10. Ensemble Stacking

The Stacking model [32] integrates multiple base learners, including Random Forest, XGBoost, and AdaBoost, into a unified predictive framework. Each base learner is independently trained on the dataset, and their predictions are combined as input features for the meta-learner.
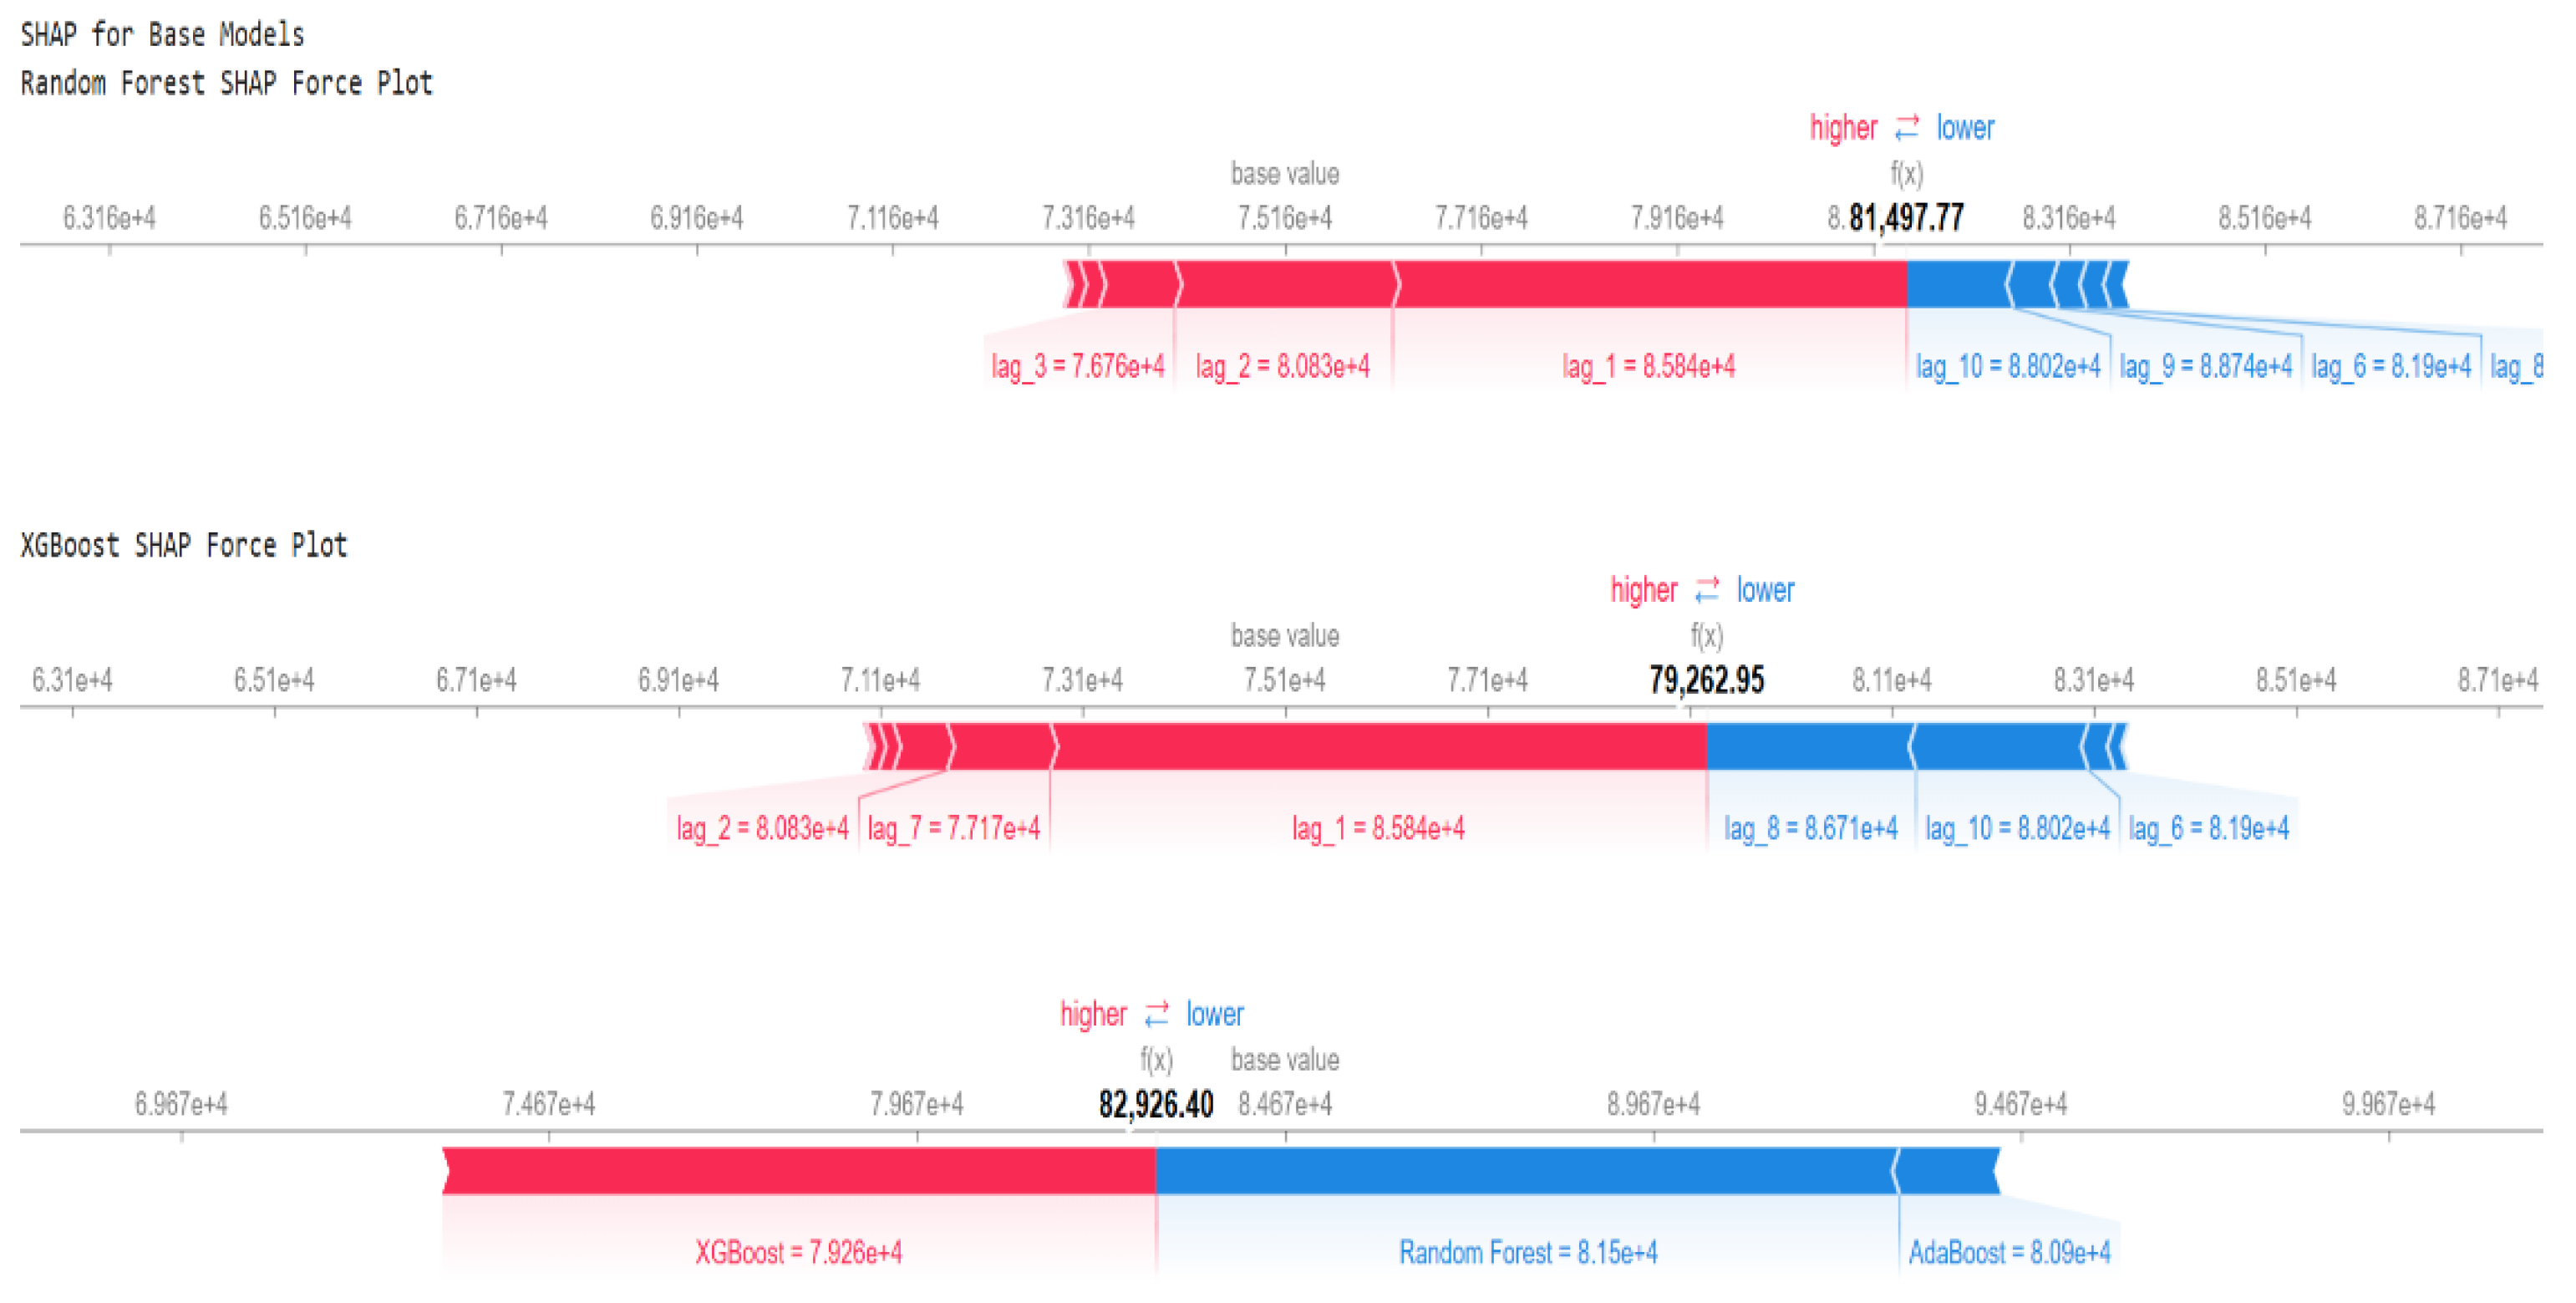
  • Base models: Random Forest captures non-linear patterns, XGBoost focuses on gradient boosting optimization, and AdaBoost reduces variance and bias in predictions.
  • Meta-learner: Ridge Regression aggregates the outputs of the base models while applying regularization to prevent overfitting.
This ensemble approach leverages the strengths of diverse models to achieve balanced performance across different data characteristics.

3.2.11. Ensemble Blending

The Non-Linear Blending model combines Random Forest, XGBoost, and AdaBoost as base regressors, using an XGBoost Regressor as the meta-learner [32].
  • Base models: Each model independently predicts export values, with Random Forest reducing variance, XGBoost optimizing through gradient boosting, and AdaBoost balancing bias.
  • Meta-learner: The XGBoost Regressor integrates the predictions of the base models to capture both linear and non-linear dependencies in the data.
To enhance interpretability, Explainable AI (XAI) techniques, such as SHAP Force Plots and Partial Dependence Plots (PDPs), were employed to analyze the Blending model’s predictions [33].

3.2.12. Performance Metrics Formulas

The performance of the forecasting models is evaluated using four metrics, as follows.
  • The Mean Squared Error (MSE), which is calculated as
1 n i = 1 n Y i Y ^ i 2
This metric measures the average squared difference between the actual values (Yi) and the predicted values ( Y ^ i ), where n is the number of samples. It indicates the average magnitude of error in the model’s predictions.
  • The Root Mean Squared Error (RMSE), which is the square root of MSE:
1 n i = 1 n Y i Y ^ i 2
This is the square root of the MSE. It provides errors in the same units as the original data, making it more interpretable.
  • The Mean Absolute Deviation (MAD) reflects the average absolute differences:
1 n i = 1 n Y i Y ^ i
This metric measures the average absolute difference between the actual values (Yi) and the predicted values ( Y ^ i ). It is less sensitive to outliers compared to MSE and RMSE. Also, and unlike MSE or RMSE, MAD is not squared, making it more interpretable in real-world units, i.e., lower MAD means better accuracy.
  • The Mean Absolute Percentage Error (MAPE) expresses accuracy as a percentage using the following form:
100 % n i = 1 n Y i Y ^ i Y i
This metric expresses the accuracy of predictions as a percentage of the actual values. It provides an intuitive measure of prediction accuracy in terms of percentage error (we can say it represents the relative prediction error).
These four metrics provide a comprehensive view of model performance, highlighting different aspects of errors in predictions. In the following, we show the performance of the aforementioned methods across these four metrics.

3.3. Explainable AI Tools: SHAP and Partial Dependence Plots (PDPs)

To enhance the interpretability of the predictive models used in this paper, we incorporated two widely accepted XAI techniques, namely, SHAP (SHapley Additive exPlanations) and Partial Dependence Plots (PDPs) [33]. SHAP is a game-theoretic approach that assigns each input feature an importance value for a particular prediction. It enables both global interpretation (across all data points) and local interpretation (for individual predictions), offering a transparent view of how input features influence the output. In our case, SHAP was instrumental in identifying that recent export lags (e.g., lag1, lag2, lag3) consistently had the most substantial contribution to model predictions.
PDPs complement SHAP by illustrating the marginal effect of a feature on the predicted outcome, averaged over the dataset. This allows us to understand not just which features are important, but how changes in their values influence the model’s predictions. For instance, the PDPs revealed that increases in recent lagged exports were strongly associated with higher predicted export volumes.
Together, SHAP and PDPs form a robust interpretability framework that enhances model transparency and trust—critical qualities in economic forecasting applications where decision makers require explainable insights, not just accurate predictions. These tools were applied in this paper, particularly to ensemble models and the Transformer variants, to support a deeper understanding of the learned relationships within the export time-series data.

4. Experimental Results and Analysis

This paper assesses the performance of various AI models in forecasting Saudi Arabia’s non-oil export volumes. Table 1 presents the performance metrics for each model, providing a comprehensive quantitative analysis of their forecasting capabilities. The following subsections compare the models based on their accuracy and predictive effectiveness.
To help interpret the error metrics, particularly the Mean Absolute Deviation (MAD), it is useful to know the scale of typical export values in the test set. In the test dataset, the average monthly export value was approximately 84,686. In addition, the last column in Table 1 shows MAD values as a percentage of the Mean.

4.1. Performance of Advanced Transformer

The Advanced Transformer model demonstrated the best performance among all models. Because MAPE represents the relative prediction error, a lower value indicates higher accuracy. The Advanced Transformer achieved an MAPE of 0.73%, the lowest among all models, as shown in Figure 5. It also attained the lowest MAD value (452), confirming its stability, reliability, and precision in forecasting non-oil exports. This reinforces its best-in-class performance. Moreover, with an MSE of 246,510 and an RMSE of 496, it effectively captures complex non-linear patterns in export data while remaining unaffected by GDP data [22].
This robustness makes the Advanced Transformer particularly suitable for forecasting scenarios with intricate data relationships. It improves upon the standard Transformer by incorporating a larger head size (128), meaning that each attention head processes 128-dimensional feature representations. This allows the model to capture more complex dependencies within the data, leading to enhanced forecasting accuracy. Additionally, more advanced configurations further optimize its performance.

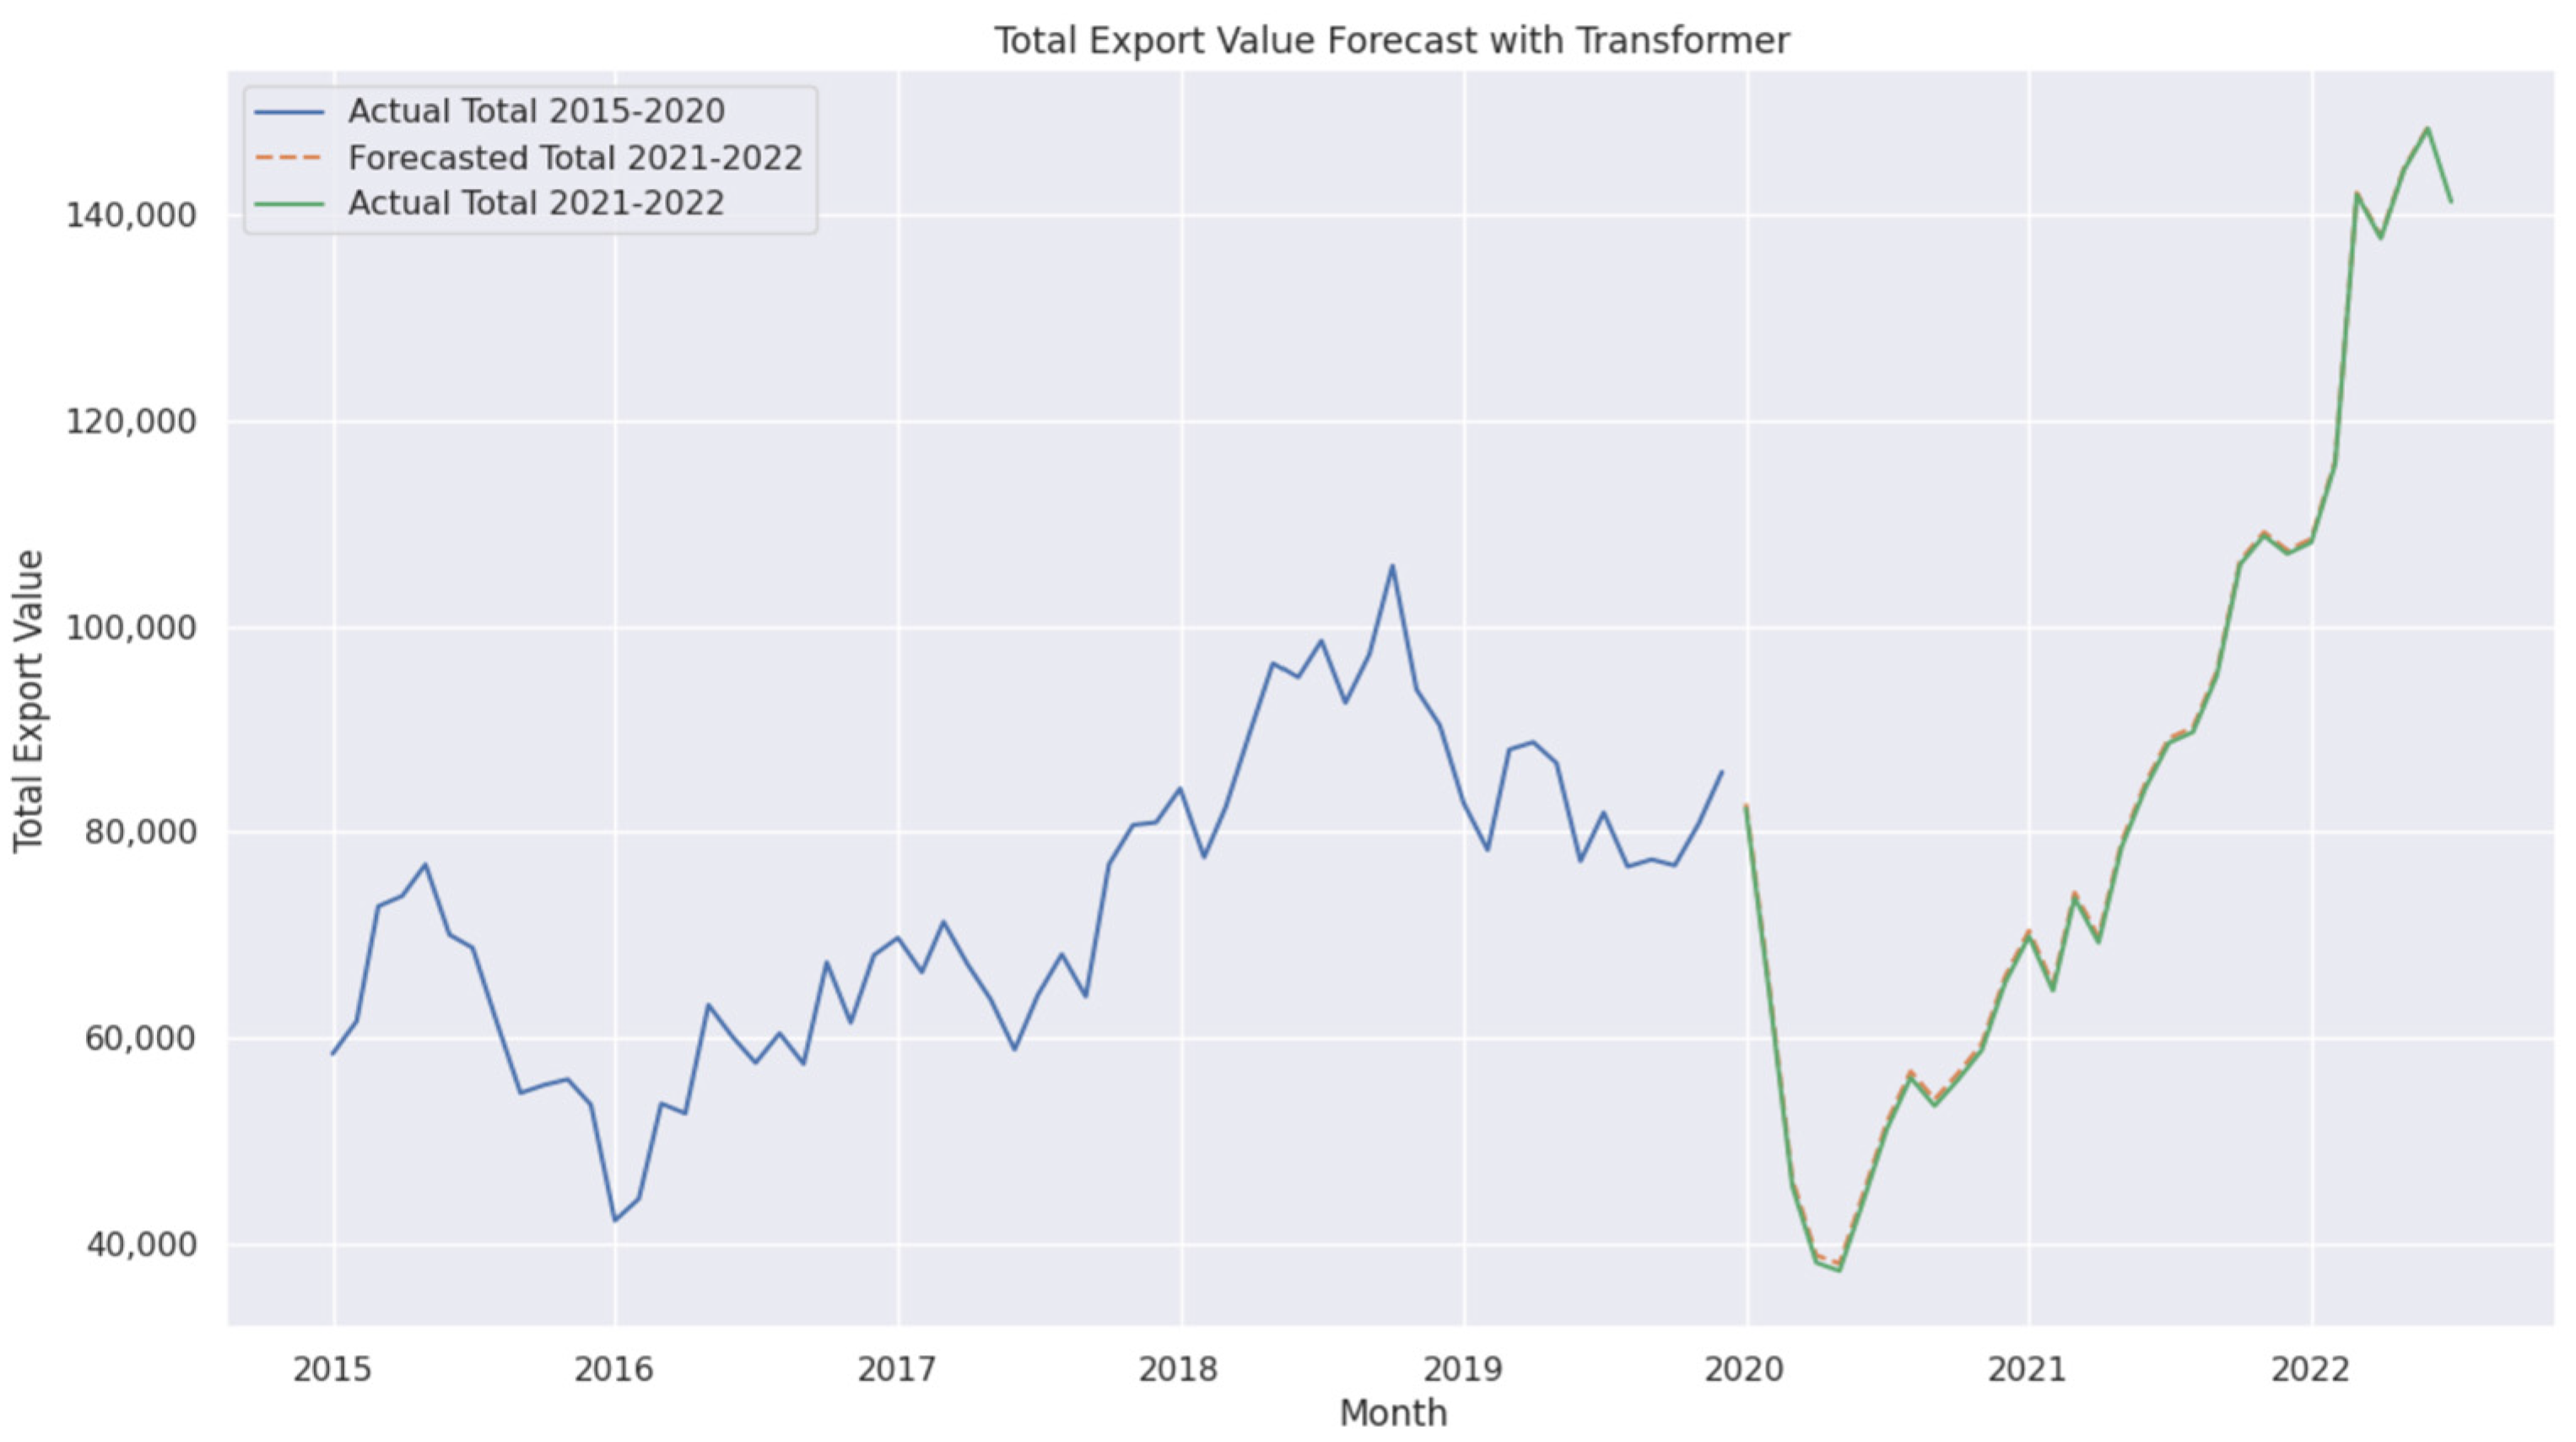
4.2. Performance of Standard Transformer

The standard Transformer model also exhibited strong performance, achieving an MAPE of 0.76% and an MAD of (482), as shown in Figure 6. Although its MSE and RMSE values were slightly higher than those of the Advanced Transformer, it remains highly effective for economic forecasting tasks. Compared to the Advanced Transformer, this model uses a smaller head size (64) and a simpler configuration, which slightly reduces its predictive accuracy but maintains computational efficiency. Briefly, the larger attention heads allow the model to capture deeper patterns and dependencies in export trends.

4.3. Performance of Ensemble Blending

The Non-Linear Ensemble Blending model achieved an MAPE of 1.23% and an MAD of (931), demonstrating strong predictive performance in forecasting non-oil exports. By integrating Random Forest, XGBoost, and AdaBoost, the Ensemble Blending model effectively captures both linear and non-linear dependencies within the data. The Blending approach combines predictions from multiple base models using an XGBoost Regressor as the meta-learner, which can be represented as follow:
Y ^ B l e n d i n g = M e t a f R F X , f X G B X , f A D A X
where
  • Y ^ B l e n d i n g is the final prediction of the Blending model.
  • f R F X ,   f X G B X ,   a n d   f A D A X are the predictions from Random Forest, XGBoost, and AdaBoost, respectively.
  • Meta(.) represents the XGBoost Regressor, which combines the predictions of base models.

4.3.1. Analysis of Ensemble Blending Performance

Explainable AI techniques, such as SHAP Force Plots, were employed to interpret the Ensemble Blending model’s decision making process, as shown in Figure 7. These plots revealed that recent export lags (lag1, lag2, lag3) were the most influential features, contributing significantly to the model’s predictive power. In other words, the most recent historical export values play a crucial role in predicting future exports. The SHAP analysis further highlighted that the XGBoost model played a dominant role in the ensemble predictions, while the Random Forest and AdaBoost models provided complementary insights, enhancing model robustness. This confirms that the Ensemble Blending model effectively captures short-term export trends, making it highly responsive to recent economic fluctuations.
To further analyze Feature Importance, a Feature Importance plot was generated, as shown in Figure 8, confirming the significant role of lag1, lag2, and lag3, while features like lag6 and lag9 exhibited minimal impact. This suggests that older historical data contribute less to the prediction, possibly due to shifting market conditions. Overall, the dominance of recent lags confirms that the Ensemble Blending model prioritizes short-term trends over long-term dependencies, which aligns well with the dynamic nature of trade and economic forecasting.
To further support the SHAP-based Feature Importance analysis, we examined the distribution of the input features used in the Ensemble Blending model. As shown in Figure 9, boxplots for lag1 through lag12 illustrate the variation and central tendency of export values across time. Notably, lag1, lag2, and lag3 have relatively higher median values and tighter interquartile ranges, indicating more stable and consistent patterns. In contrast, older lags, such as lag9 and lag12, display greater variability and slightly lower medians, which may reduce their predictive utility. These distributional characteristics align with the SHAP findings, where recent lags contributed most significantly to model output, highlighting the dominant influence of short-term export dynamics on forecast accuracy.
To further analyze model performance, Partial Dependence Plots (PDPs) were applied to the base models (Random Forest, XGBoost, and AdaBoost) to examine how key features influence export value predictions. Figure 10, Figure 11 and Figure 12 illustrate these dependencies for AdaBoost, Random Forest, and XGBoost, respectively. The PDP illustrations reveal that lag1 and lag2 have the strongest positive impact on export predictions across all models, which asserts the same conclusion that the most recent export values play a crucial role in shaping future predictions. Conversely, features like lag6 and lag9 exhibit minimal influence, suggesting that older historical data contribute less to the forecasting process. This trend is consistent across the three models, reinforcing the notion that short-term economic fluctuations drive trade forecasts more than long-term patterns.

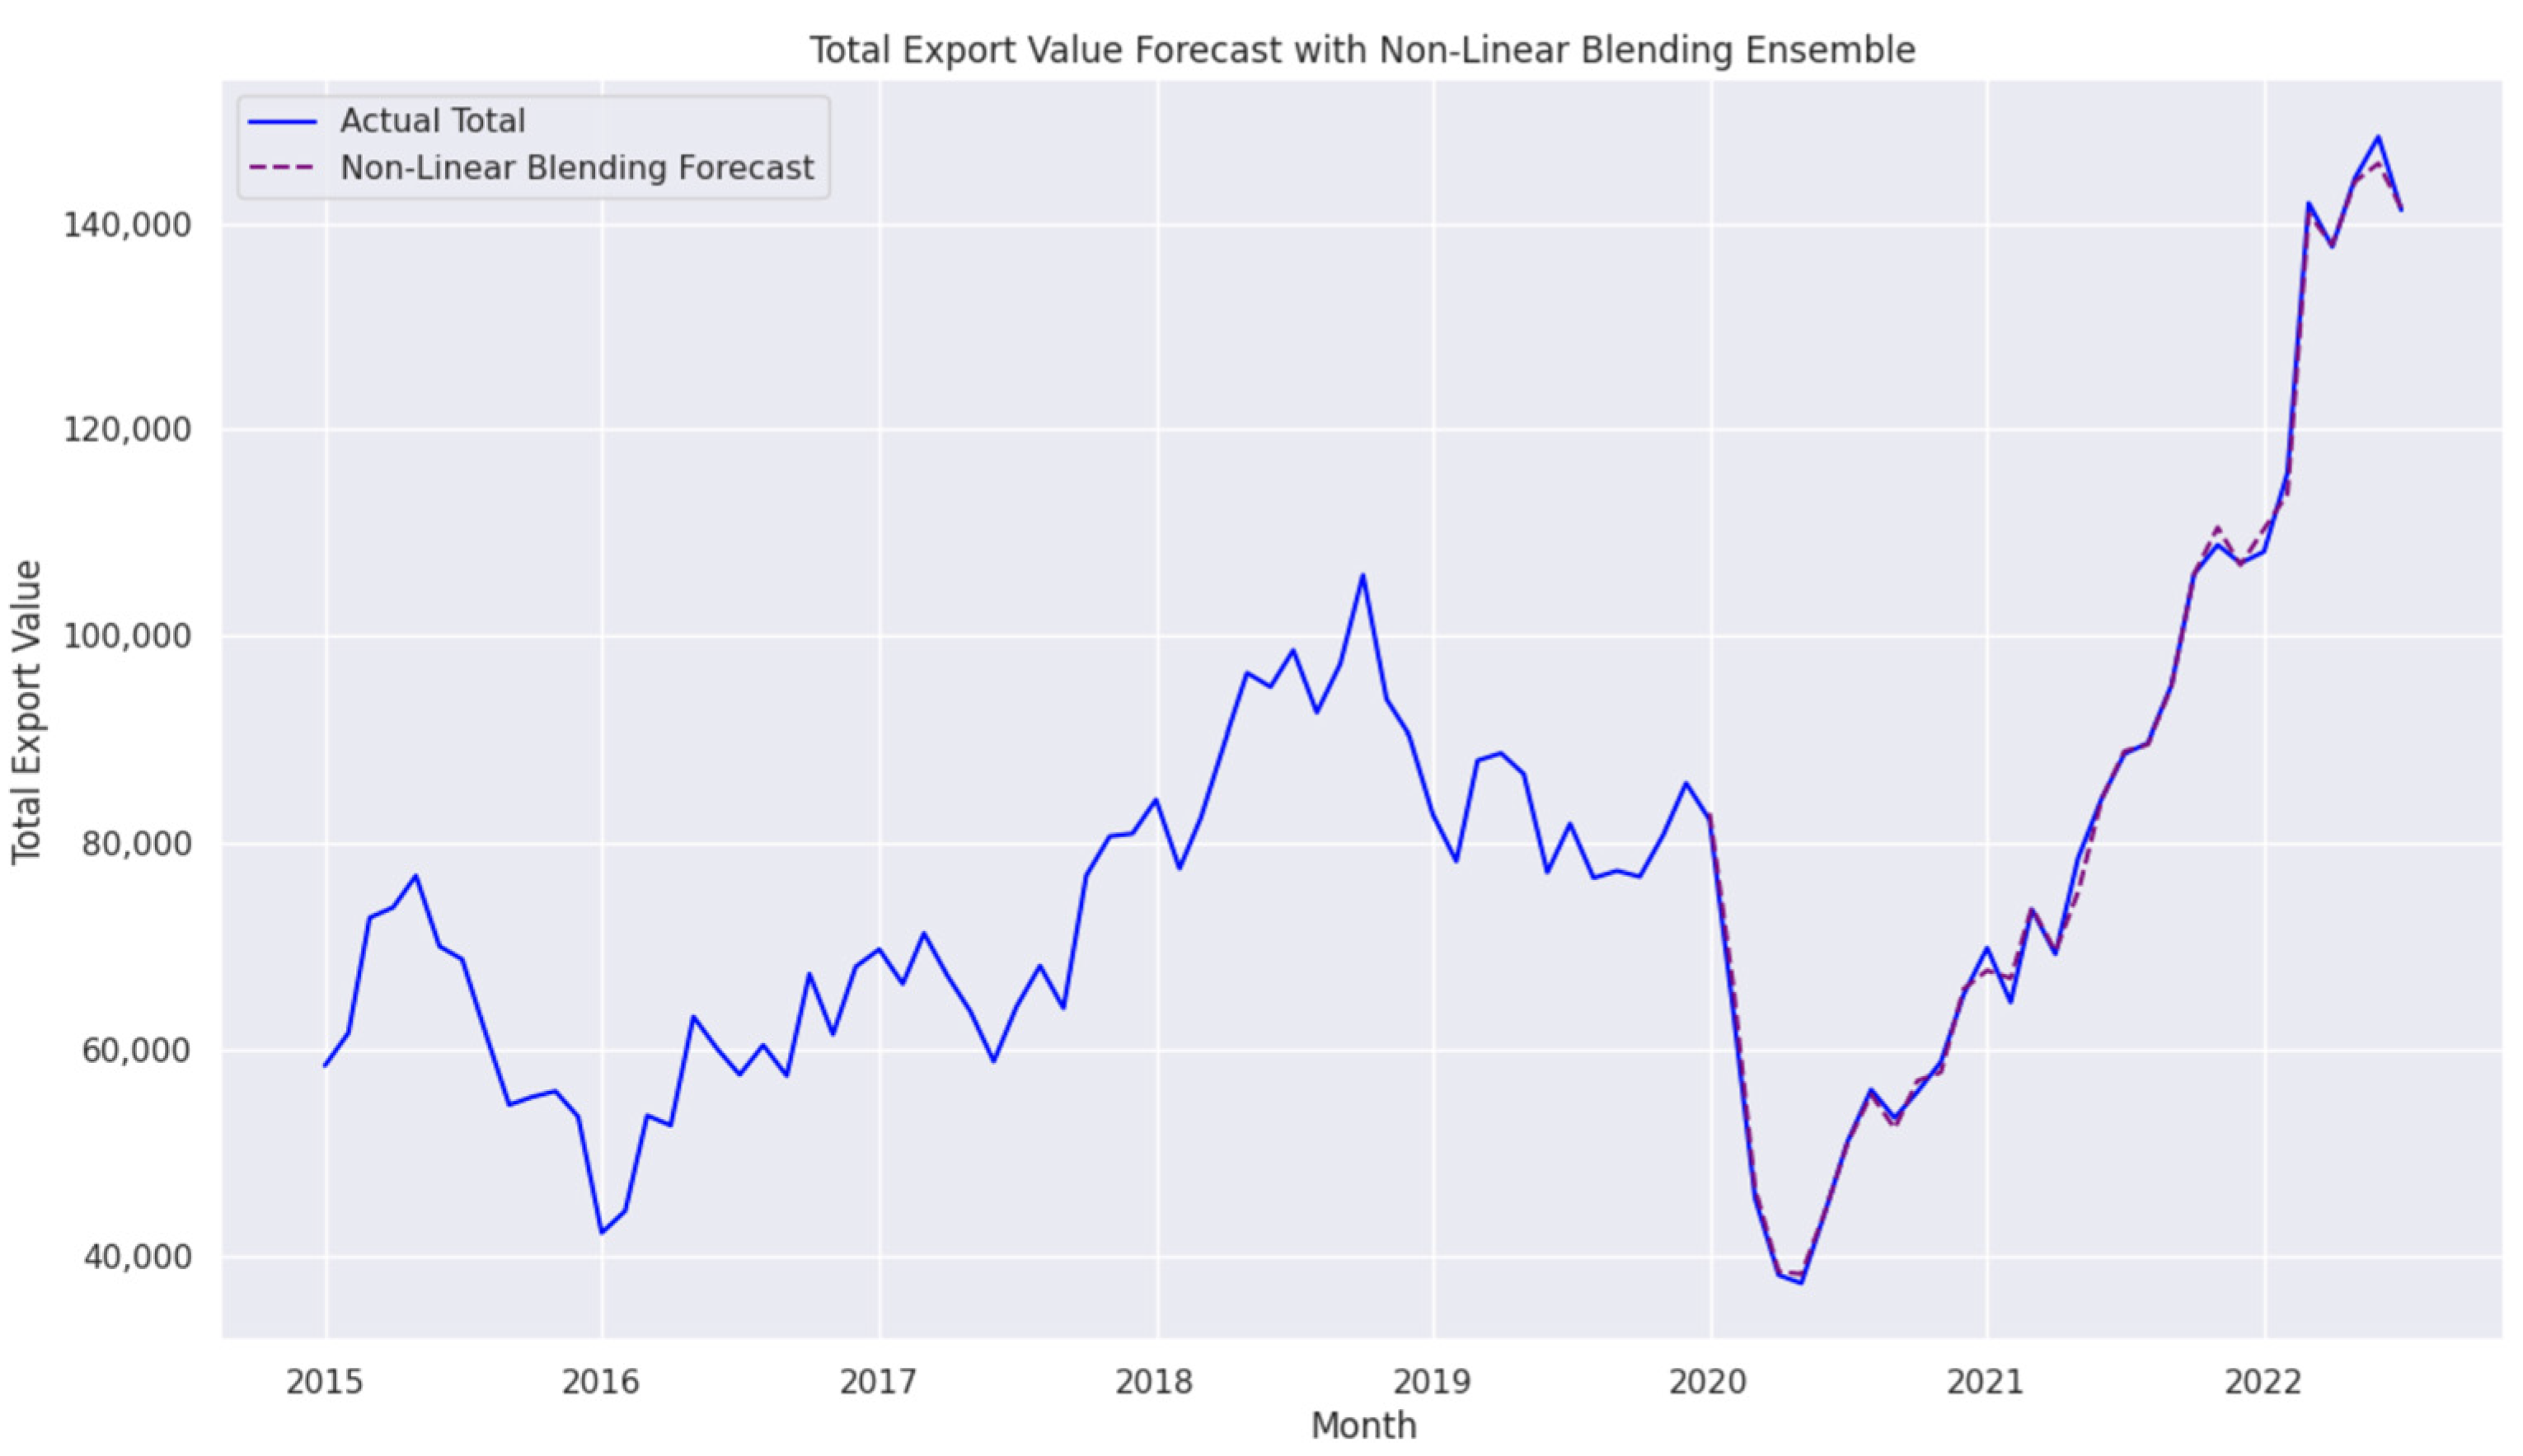
4.3.2. Forecasting Performance of the Ensemble Blending Model

The forecasting capabilities of the Ensemble Blending model were evaluated by comparing its predicted export values with actual data from 2015 to 2022. As shown in Figure 13, we can obtain the following findings:
  • The model effectively captured key export trends, particularly during the post-2020 recovery phase, highlighting its ability to track complex economic fluctuations with high accuracy.
  • The alignment between predicted and actual export values indicates that the Blending model successfully models temporal dependencies and adapts to market shifts.
  • This performance further validates the model’s ability to balance short-term accuracy and long-term stability, making it a robust choice for economic forecasting.
Figure 13. Total Export Value forecast with Non-Linear Blending Ensemble.
Bdcc 09 00094 g013

4.4. Performance of Temporal Fusion Transformer (TFT) with GDP

The TFT integrates GDP data to incorporate macroeconomic factors into non-oil export forecasting, where it achieved an MAPE of 5.48%. However, this value is higher than those of the Advanced Transformer and Blending models, and it demonstrates the potential of contextual data in improving predictions. TFT combines LSTM-based sequence encoding with attention mechanisms to capture temporal dependencies
Y ^ T F T = D e n s e T r a n s f o r m e r L S T M X
where
  • Y ^ T F T is the final prediction of the TFT model.
  • LSTM (X) represents the LSTM Encoder output for the input sequence X.
  • Transformer (·) applies the attention mechanism for long-range dependencies.
  • Dense (·) represents fully connected layers for final predictions.
The TFT architecture effectively captures both short- and long-term dependencies by combining sequence encoding with attention mechanisms. The inclusion of GDP data provided additional insights into the broader economic context influencing exports. However, the slightly higher error rate indicates that GDP data may introduce noise or require further feature engineering for optimal integration.
Figure 14 illustrates the TFT model’s forecast for 2021–2022 compared to actual export values. Additionally, training and validation loss plots in Figure 15 demonstrate stable convergence over 400 epochs, highlighting the model’s reliability. Given its ability to handle multi-feature inputs, TFT offers valuable insights for decision makers interested in the interplay between macroeconomic indicators and export performance.

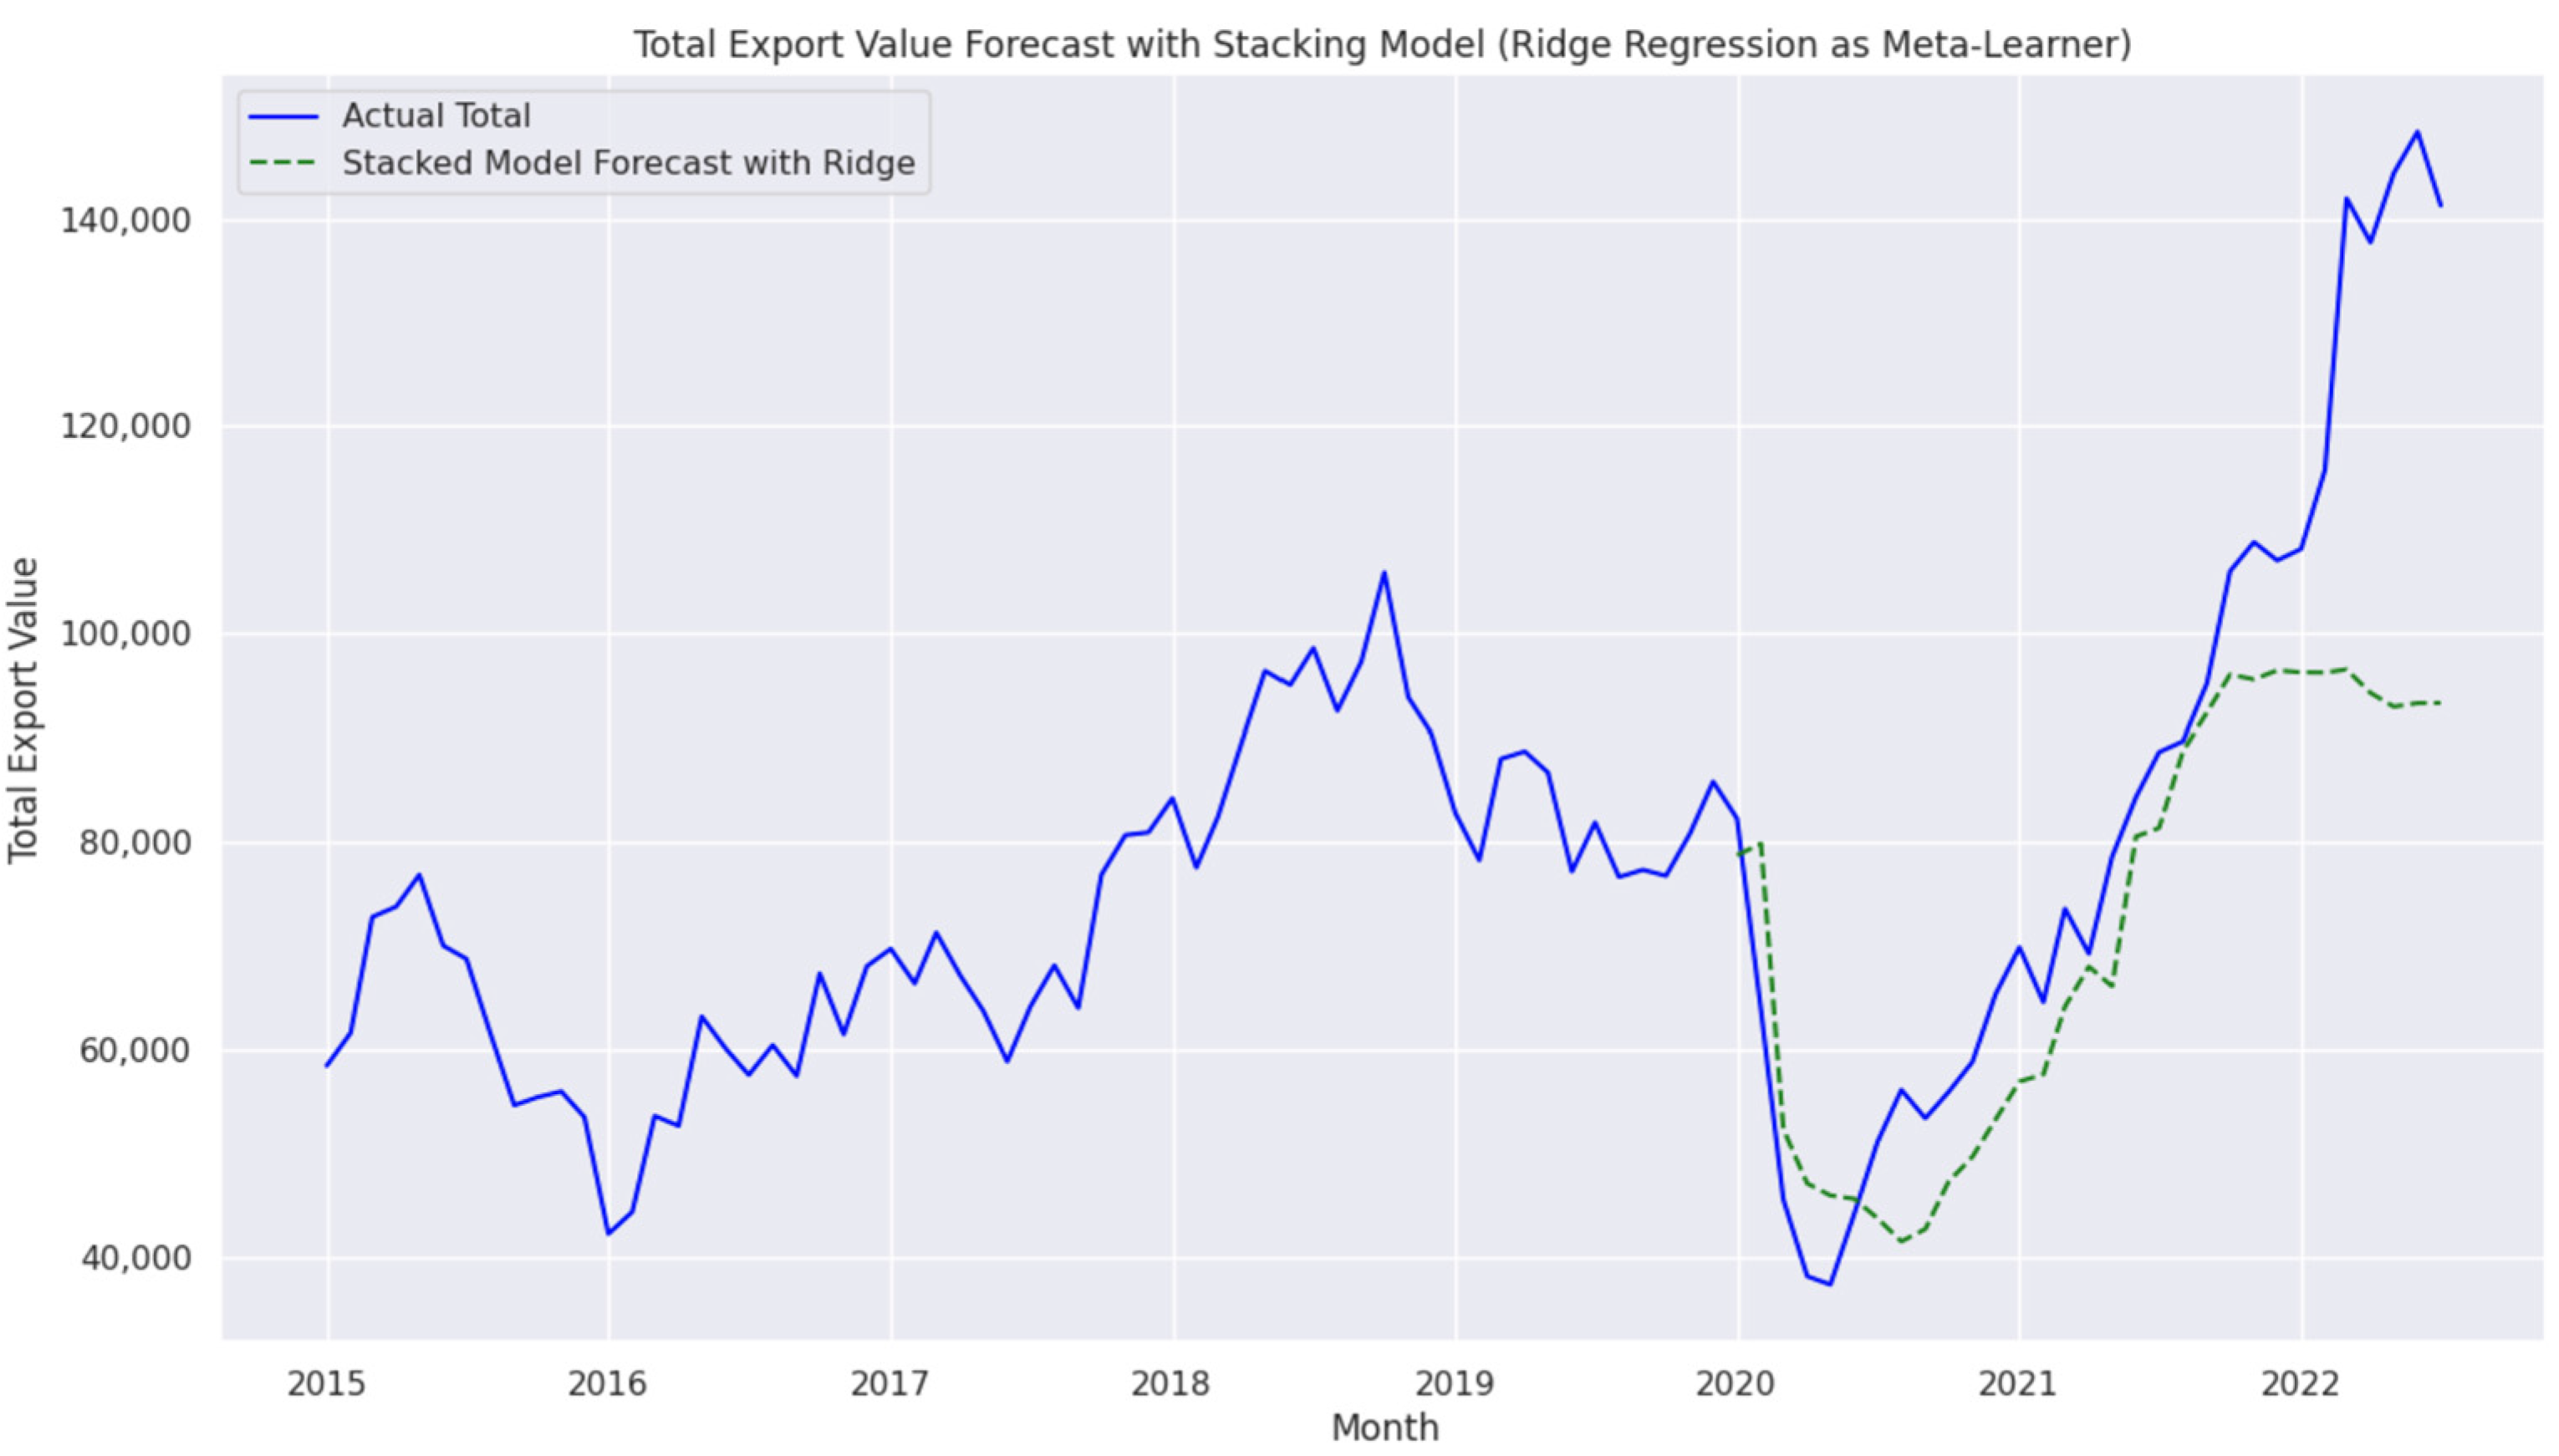
4.5. Performance of Ensemble Stacking

The Stacking model aggregates predictions from Random Forest, XGBoost, and AdaBoost, using Ridge Regression as the meta-learner. While it achieved an MAPE of 16.45%, which is higher than the Blending model, the Stacking approach demonstrated the ability to balance linear and non-linear dependencies, according to the following form:
Y ^ S t a c k i n g = R i d g e f R F X , f X G B X , f A D A X
where
  • Y ^ S t a c k i n g is the final prediction of the Stacking approach.
  • f R F X ,   f X G B X ,   a n d   f A D A X are the predictions from Random Forest, XGBoost, and AdaBoost, respectively.
  • Ridge(.) represents the Ridge Regressor as the meta-learner, applying regularization to prevent overfitting.
Figure 16 compares the Stacking approach’s forecast with the actual export values. Ridge Regression as the meta-learner helps ensure generalizability, but the higher error rates indicate that further tuning or additional meta-features may be required to improve performance, particularly in modeling highly non-linear export data.

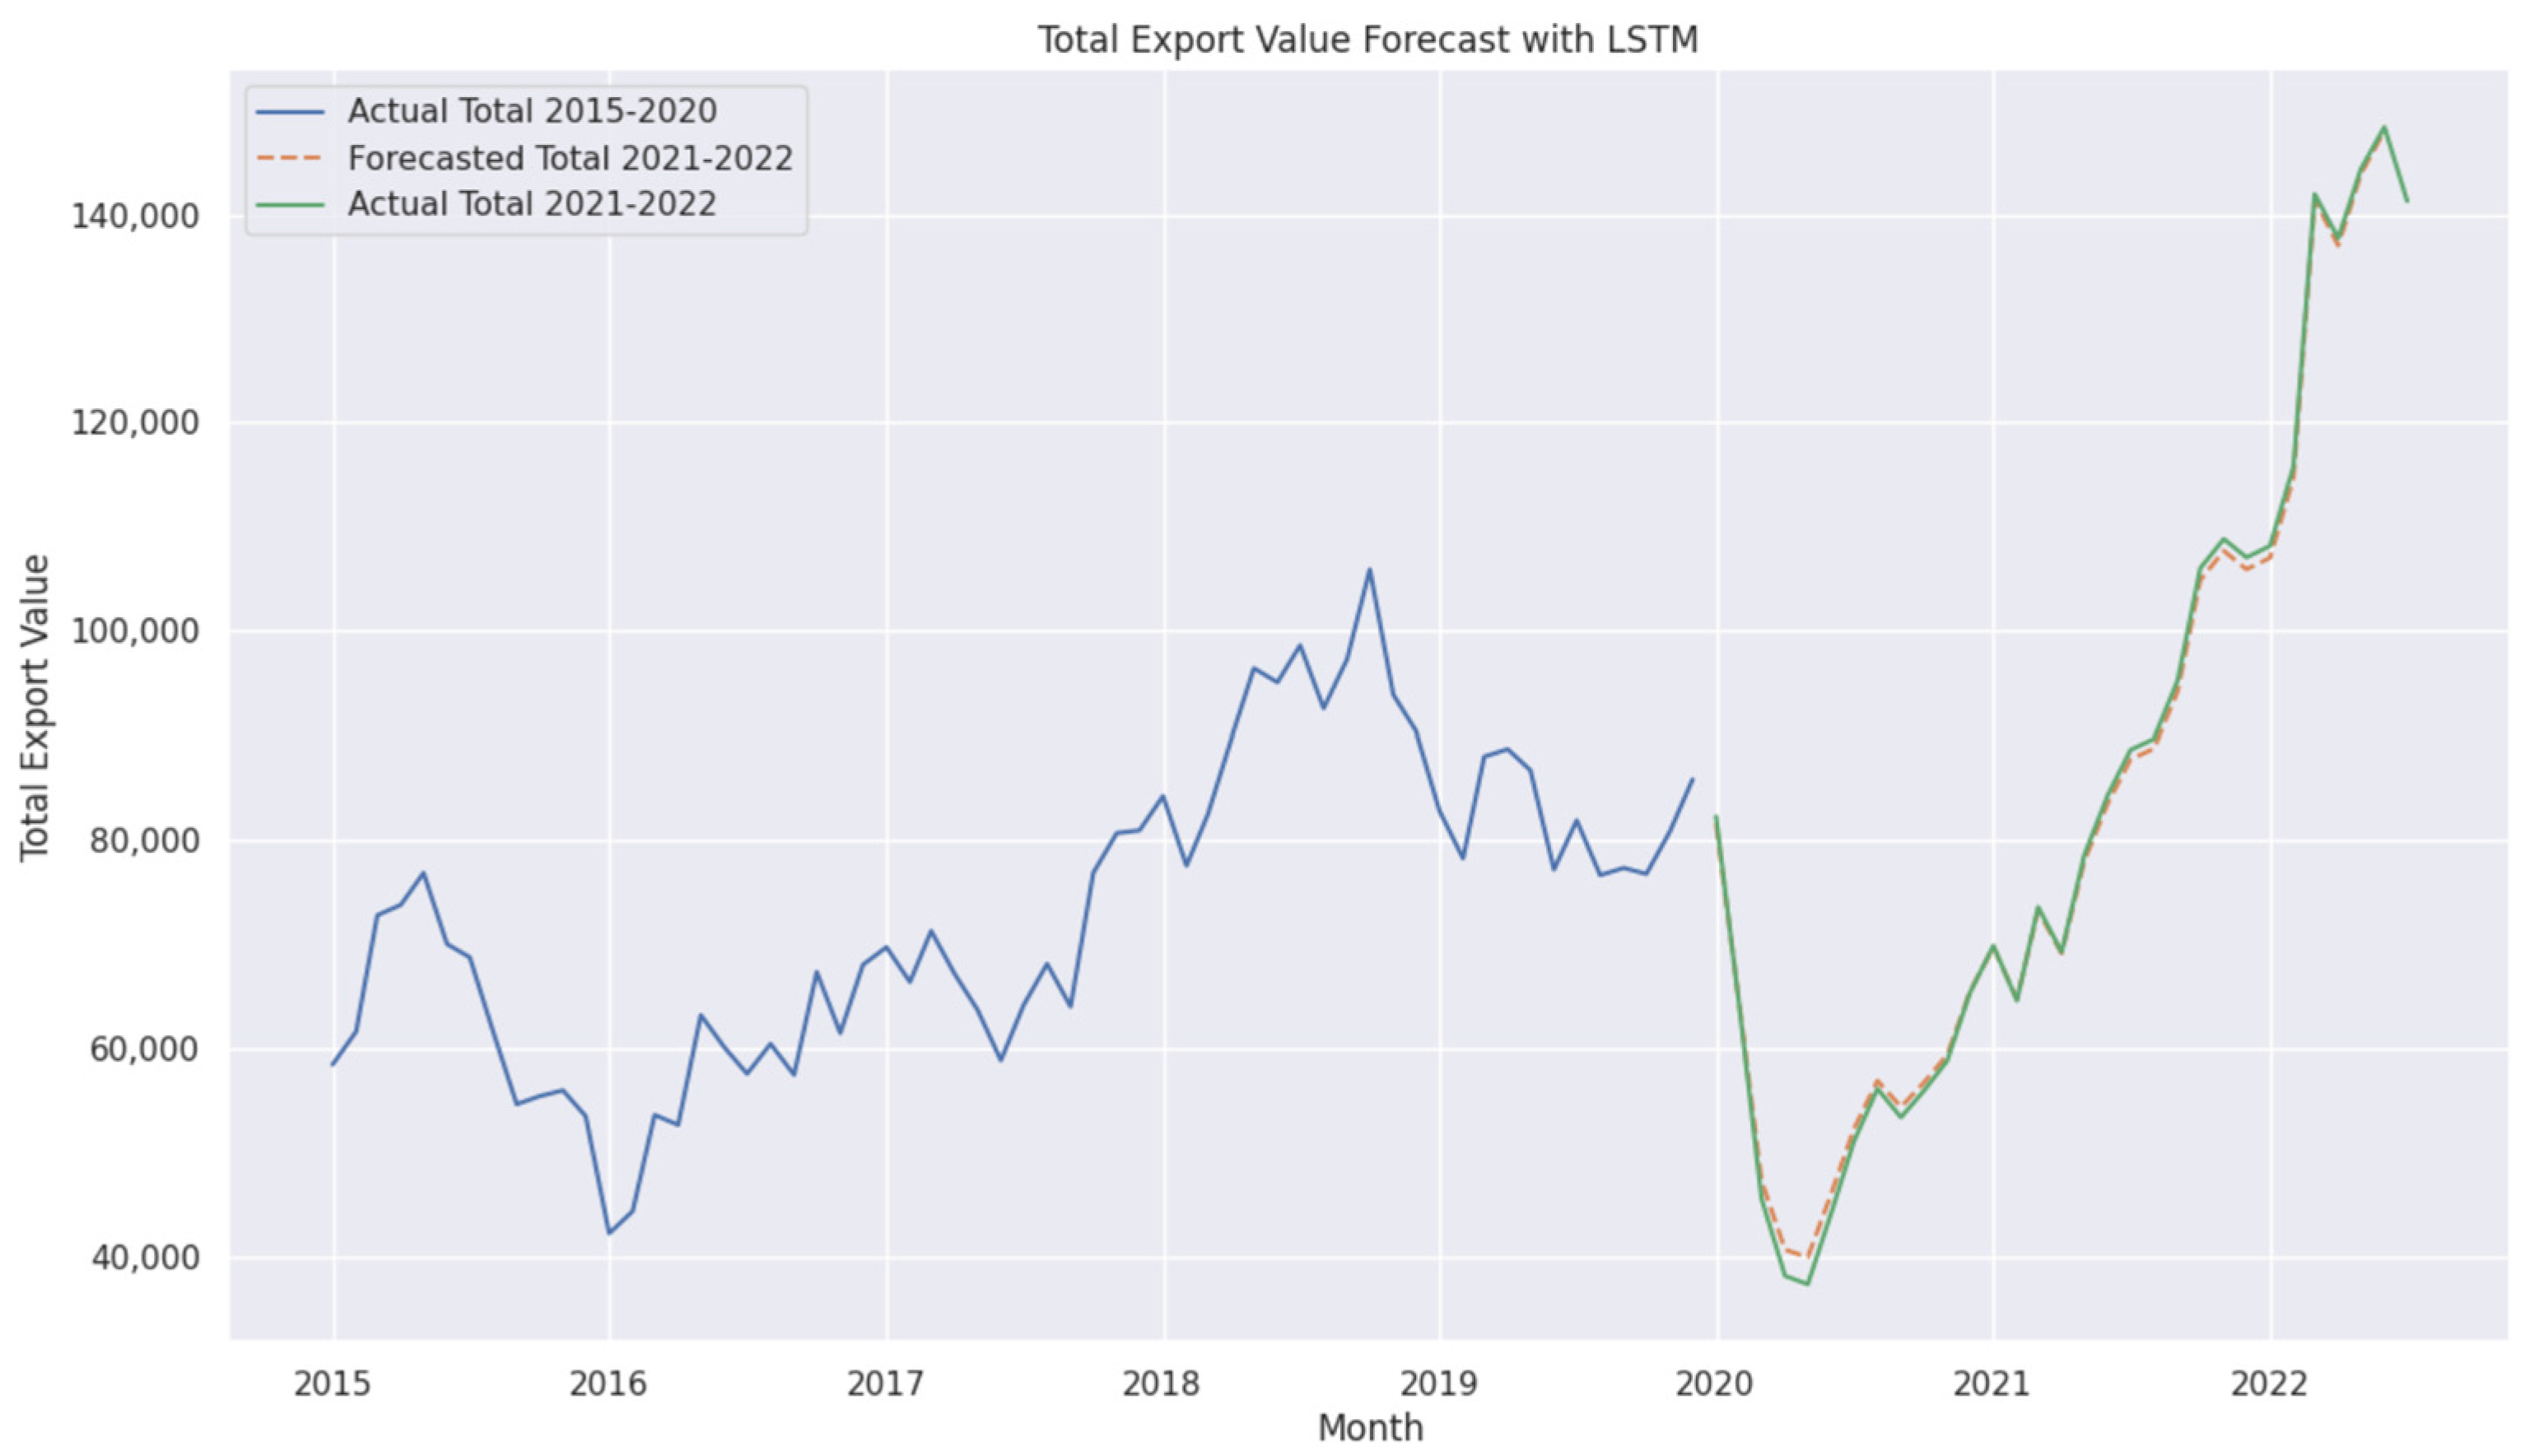
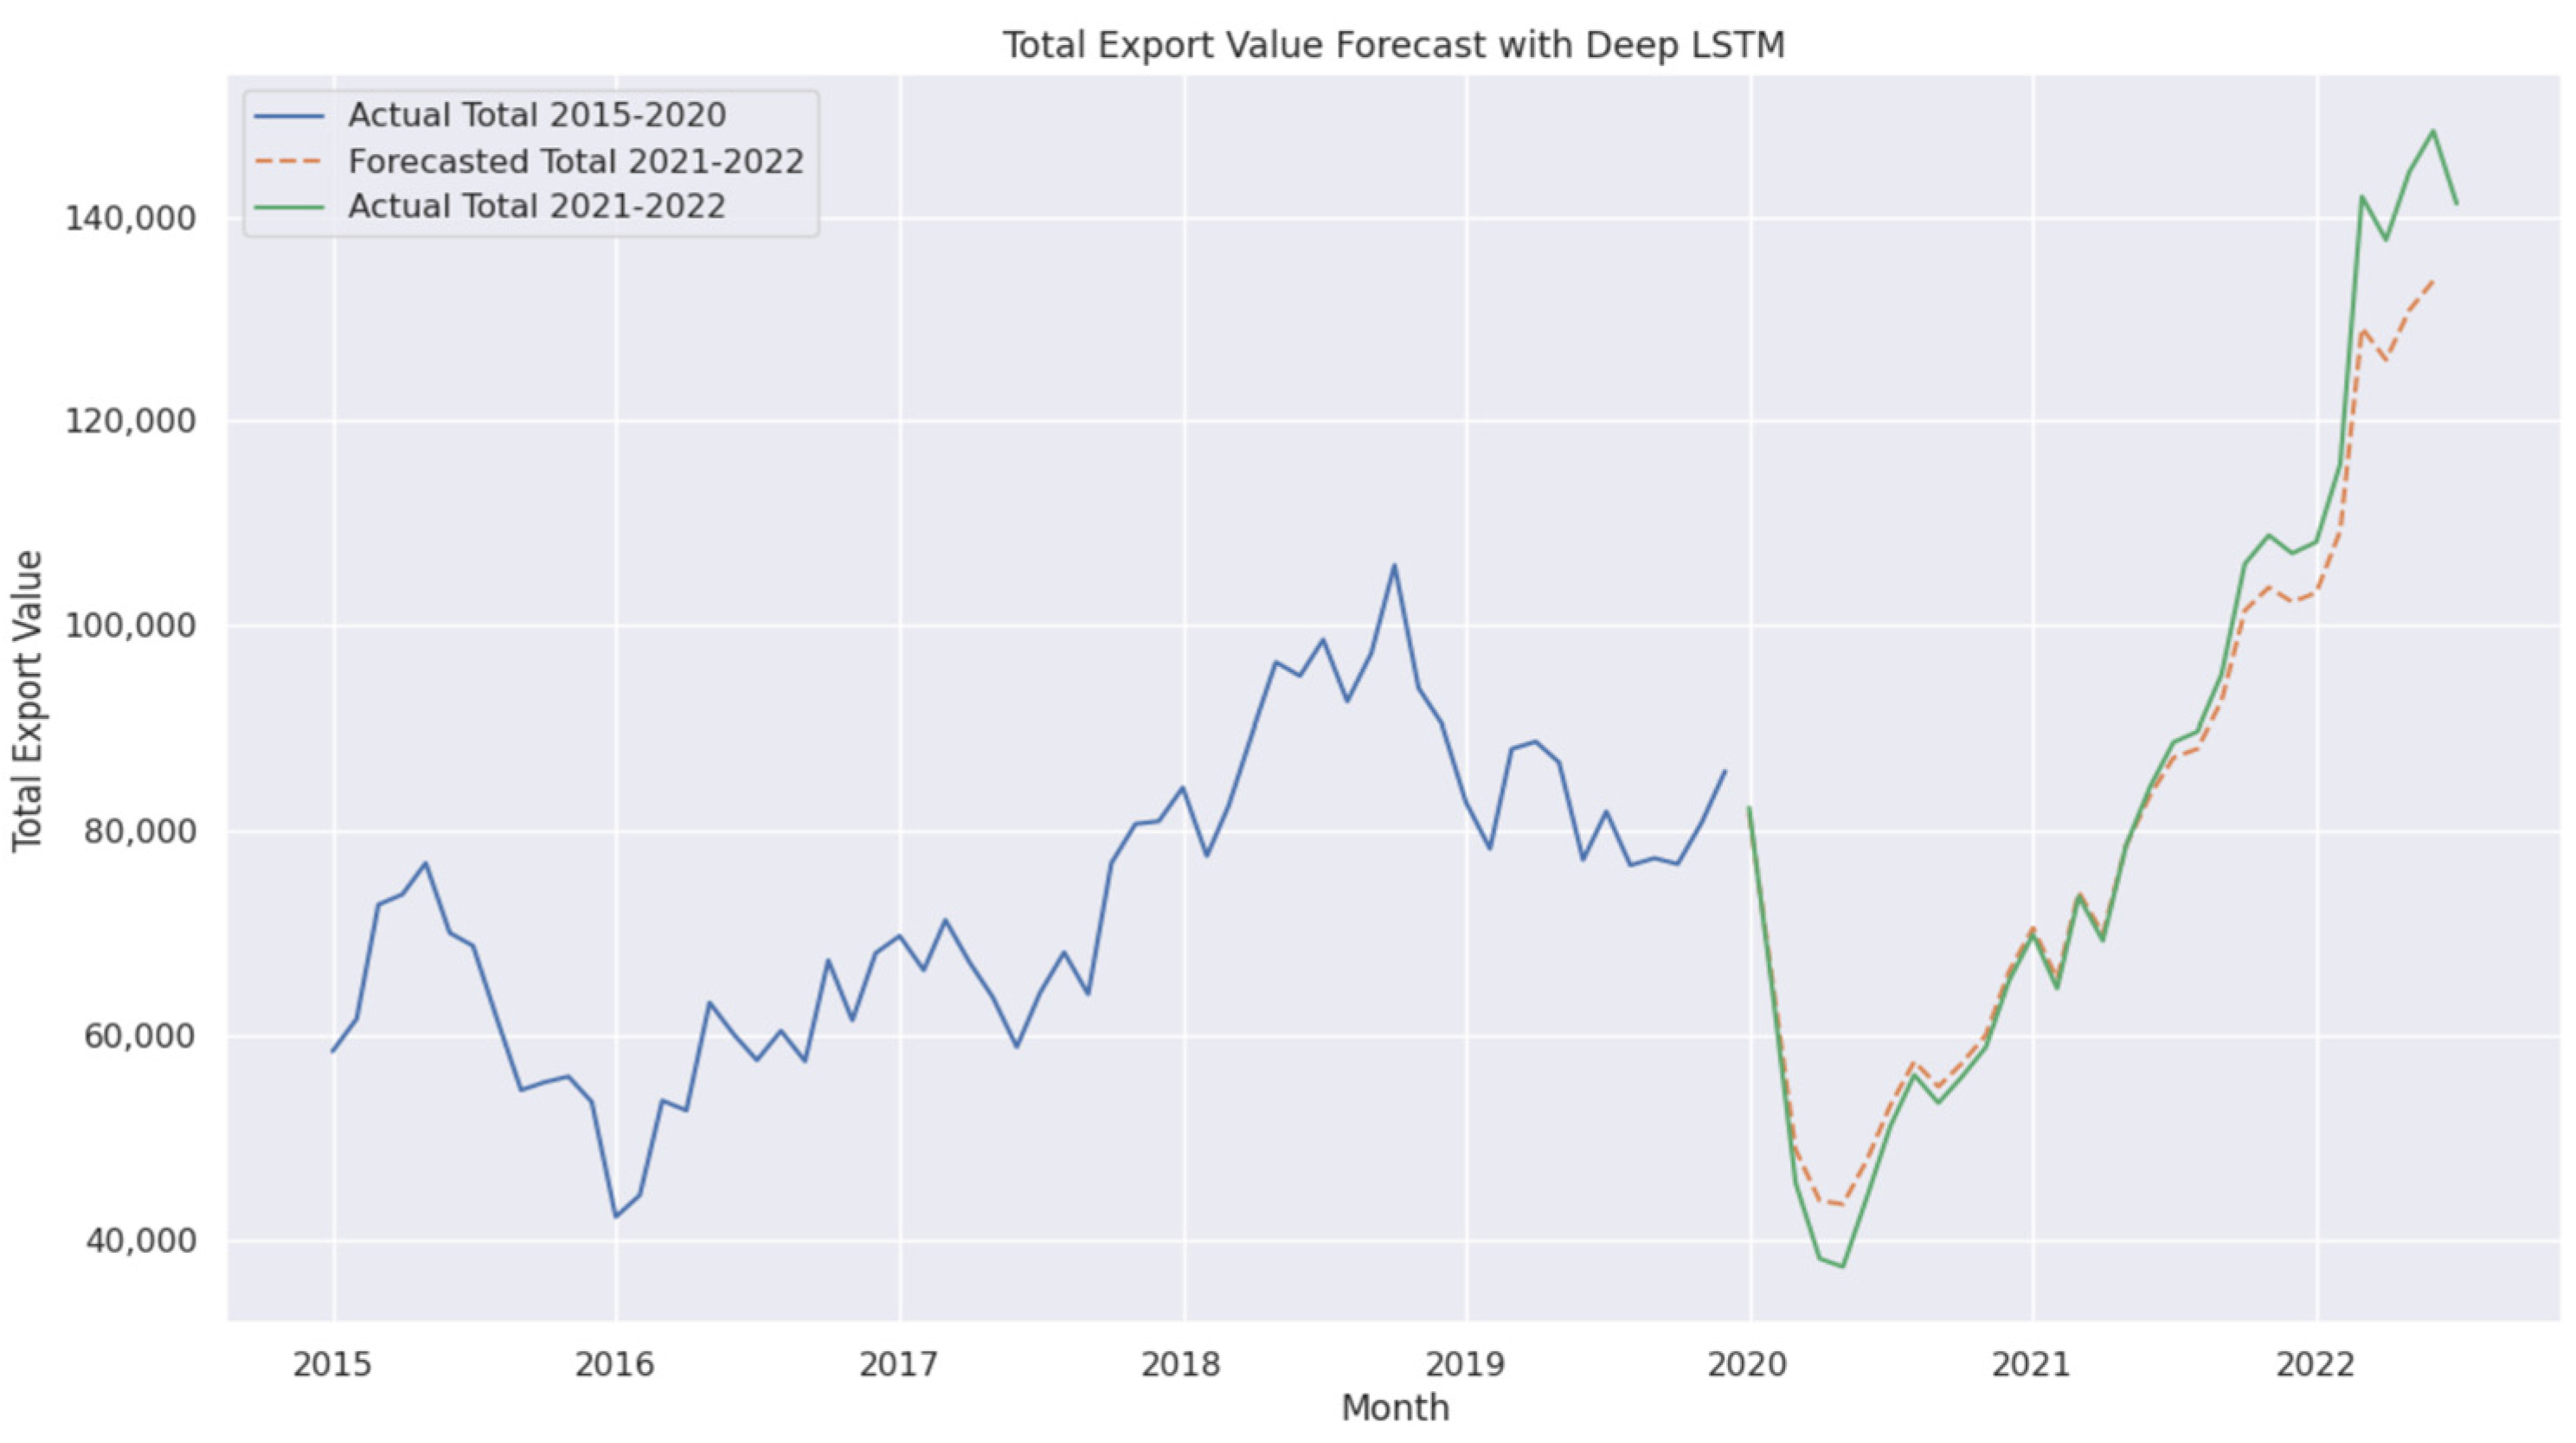
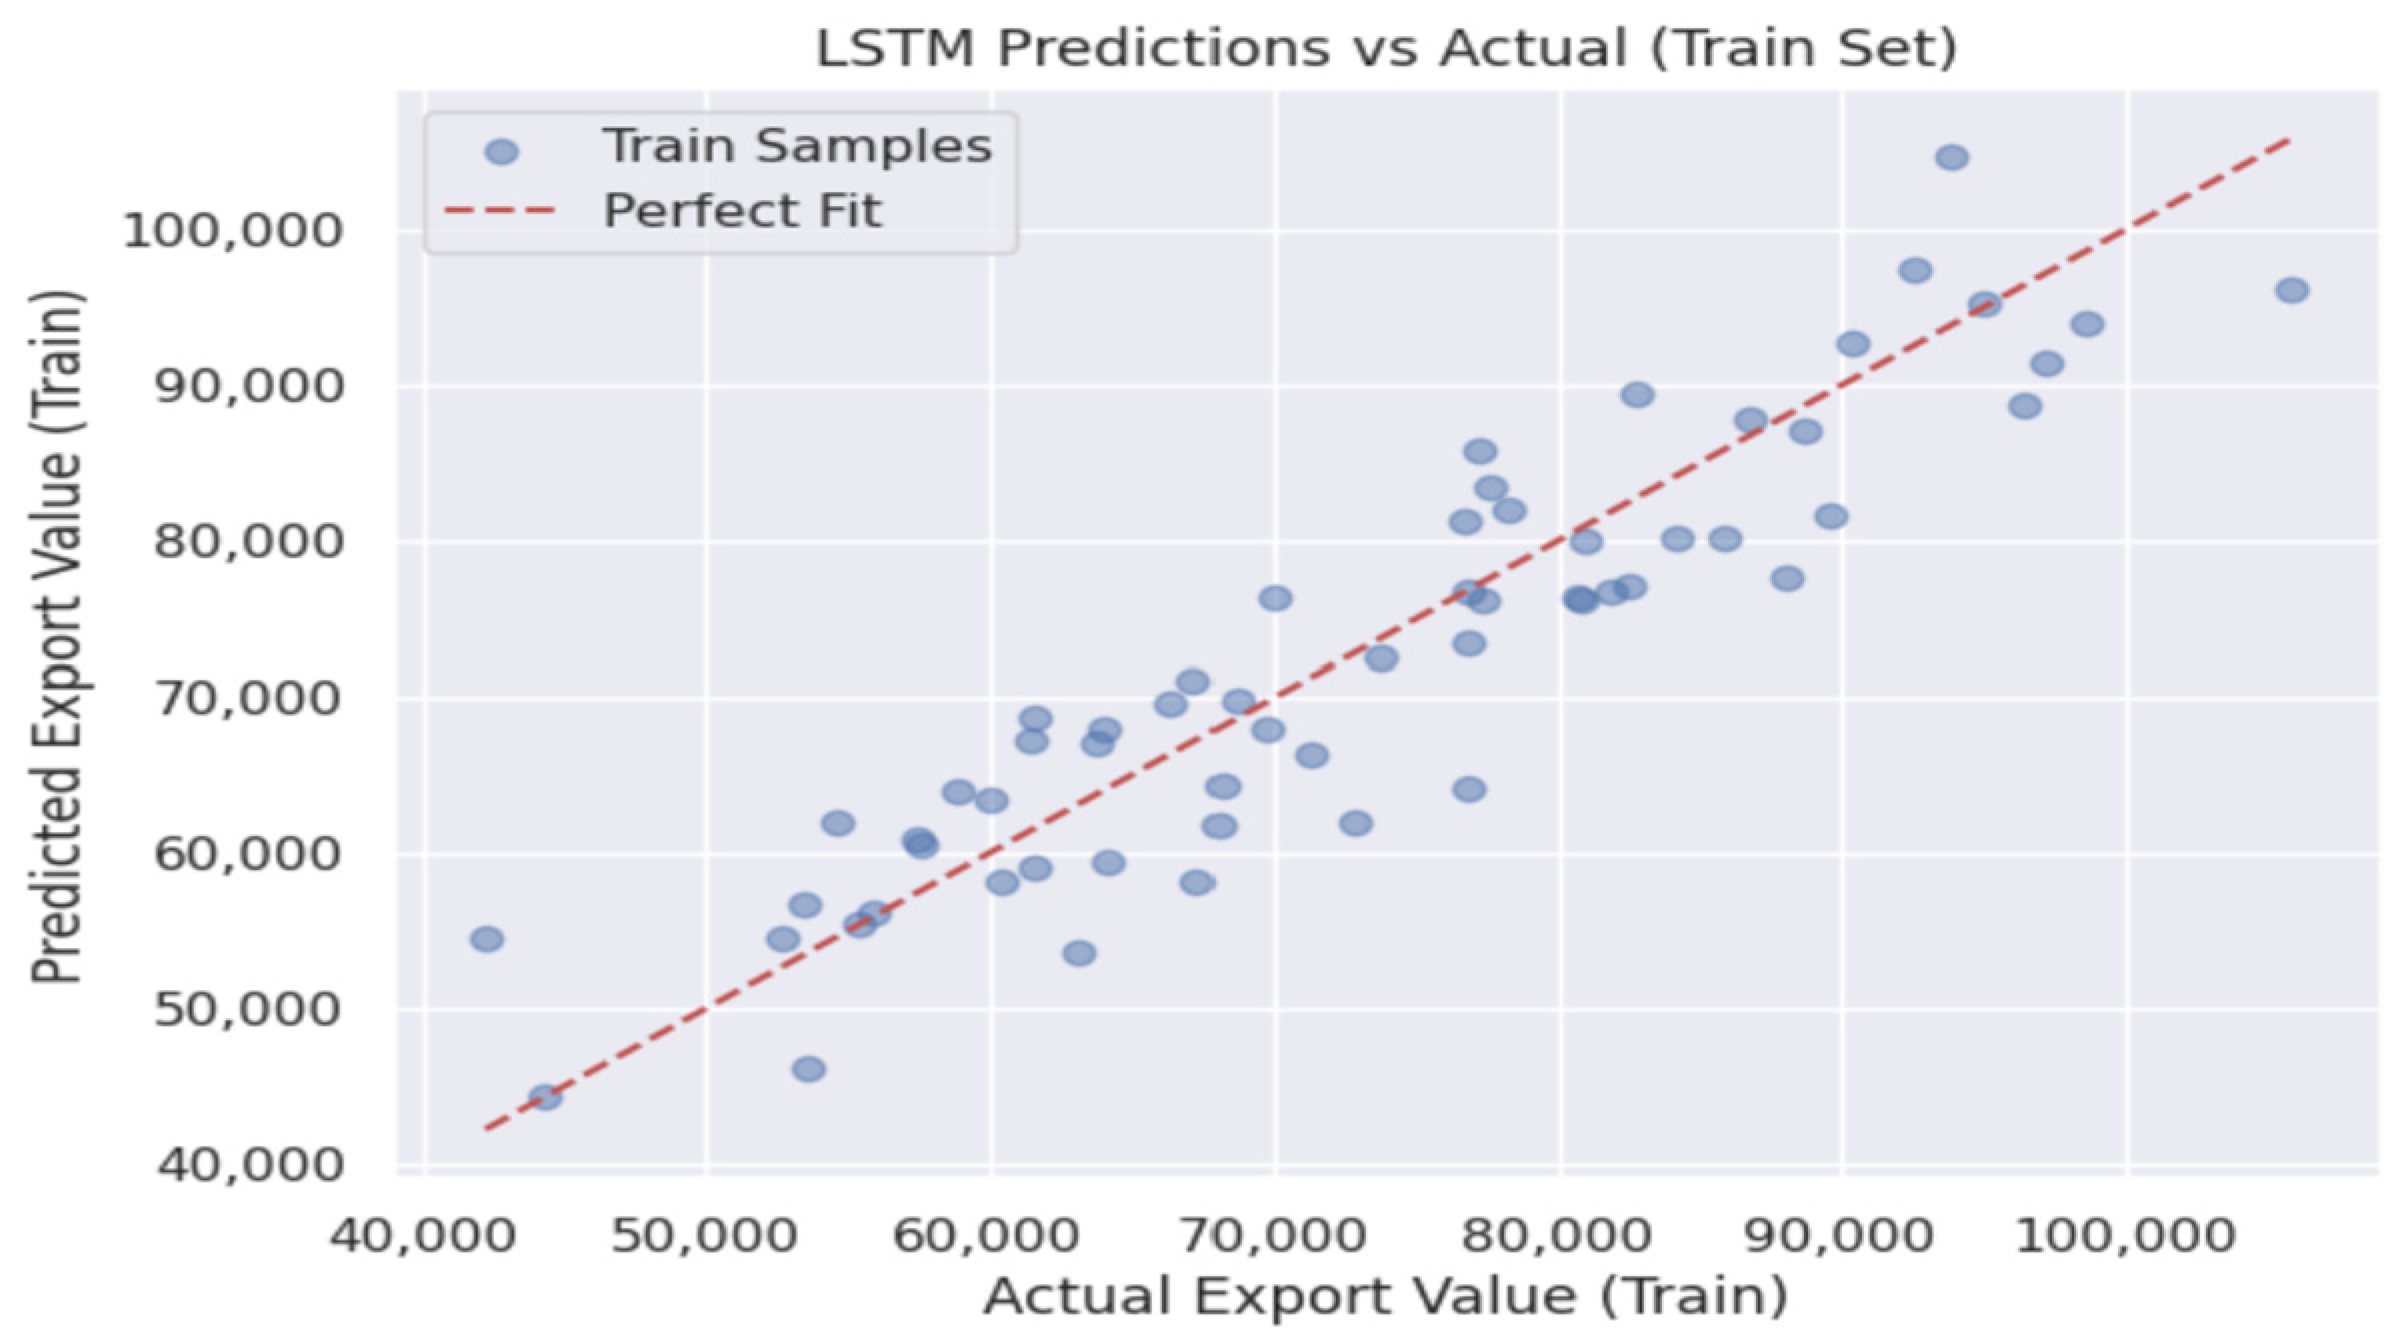
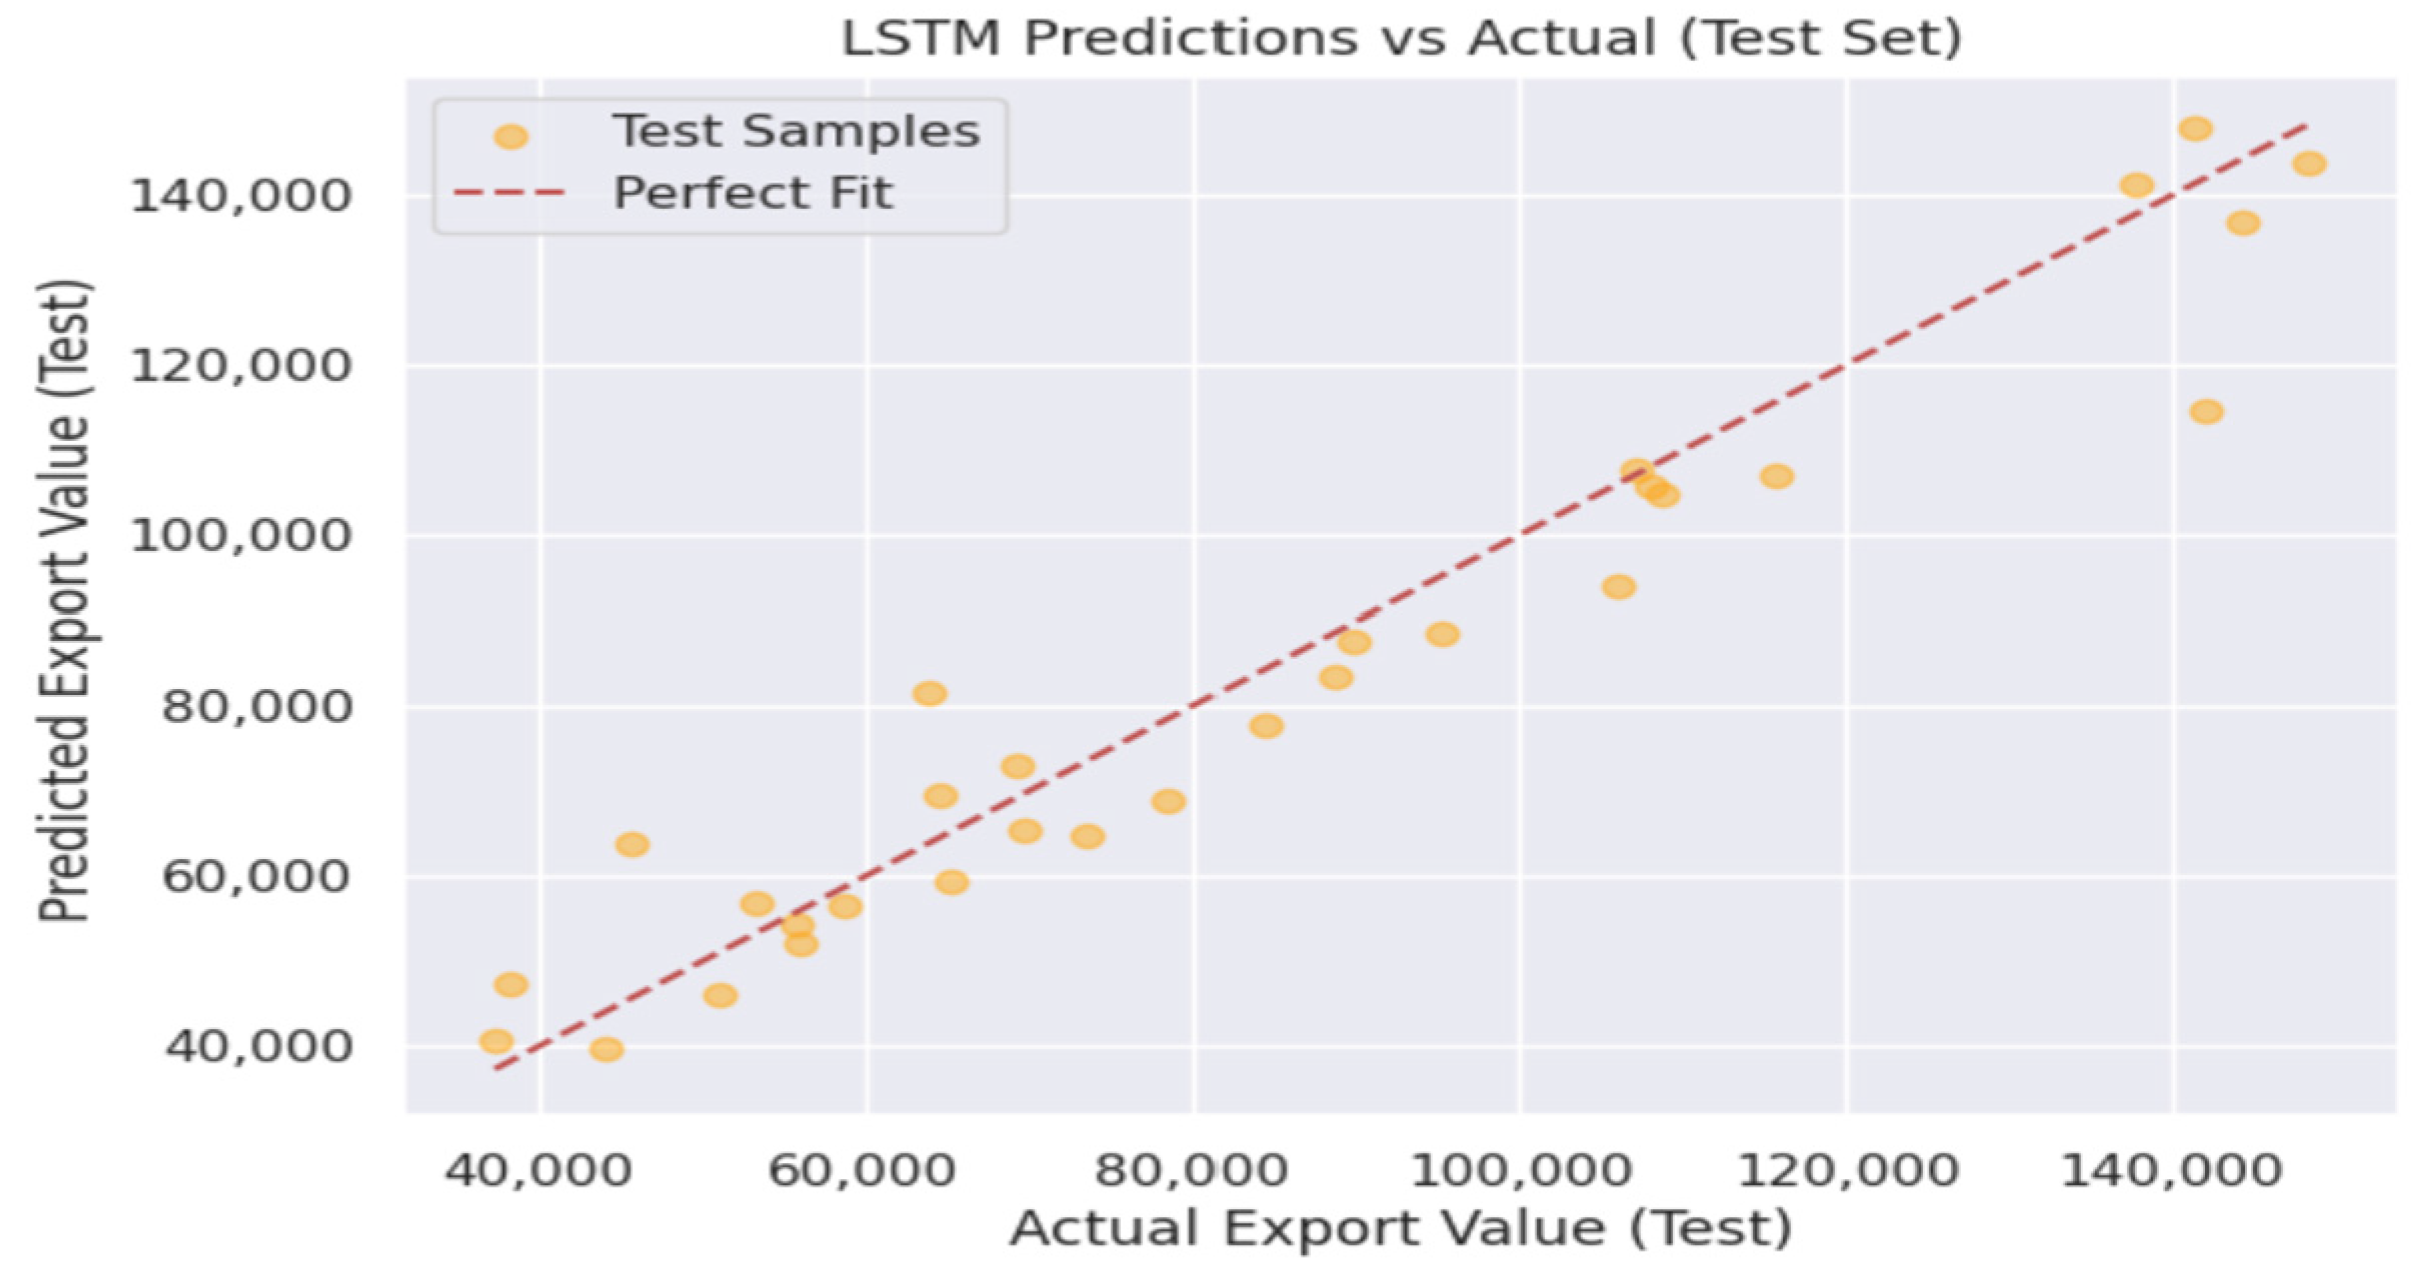
4.6. Performance of LSTM and Deep LSTM

The LSTM model demonstrated strong performance, achieving an MAPE of 1.44%, an MSE of 1,180,754, and an RMSE of 1086, highlighting its effectiveness in capturing temporal dependencies in export data, as shown in Figure 17. However, the Deep LSTM model performed significantly worse, with an MAPE of 4.52%, an MSE of 31,972,707, and an RMSE of 5654, as shown in Figure 18. This outcome is unexpected, as deeper architecture is generally assumed to enhance learning capacity. The results indicate that overfitting, increased model complexity, or suboptimal hyperparameters may have negatively impacted the Deep LSTM’s ability to generalize effectively [10].
The LSTM model utilizes gate functions to regulate the flow of information, ensuring the retention of relevant features while mitigating the vanishing gradient problem. Deep LSTM extends this architecture by stacking multiple layers, where the output of each layer serves as the input for the next, allowing the model to capture more complex representations. However, increased depth does not always lead to improved performance, as excessive complexity can result in overfitting, gradient instability, or difficulties in optimizing the model, ultimately reducing its generalization capability [34].
To complement the time-series plots, we further analyzed the LSTM model’s prediction accuracy using scatter plots of predicted versus actual export values, as shown in Figure 19 and Figure 20. Figure 19 displays the training set results, where predicted points align closely with the diagonal line, indicating strong model fit during training. Figure 20 shows the predictions using the testing set, which also generally follow the diagonal line but exhibit slightly greater spread, reflecting modest error in out-of-sample forecasting. These plots reinforce the model’s ability to capture the overall export dynamics while visually illustrating areas of stronger and weaker predictive performance.

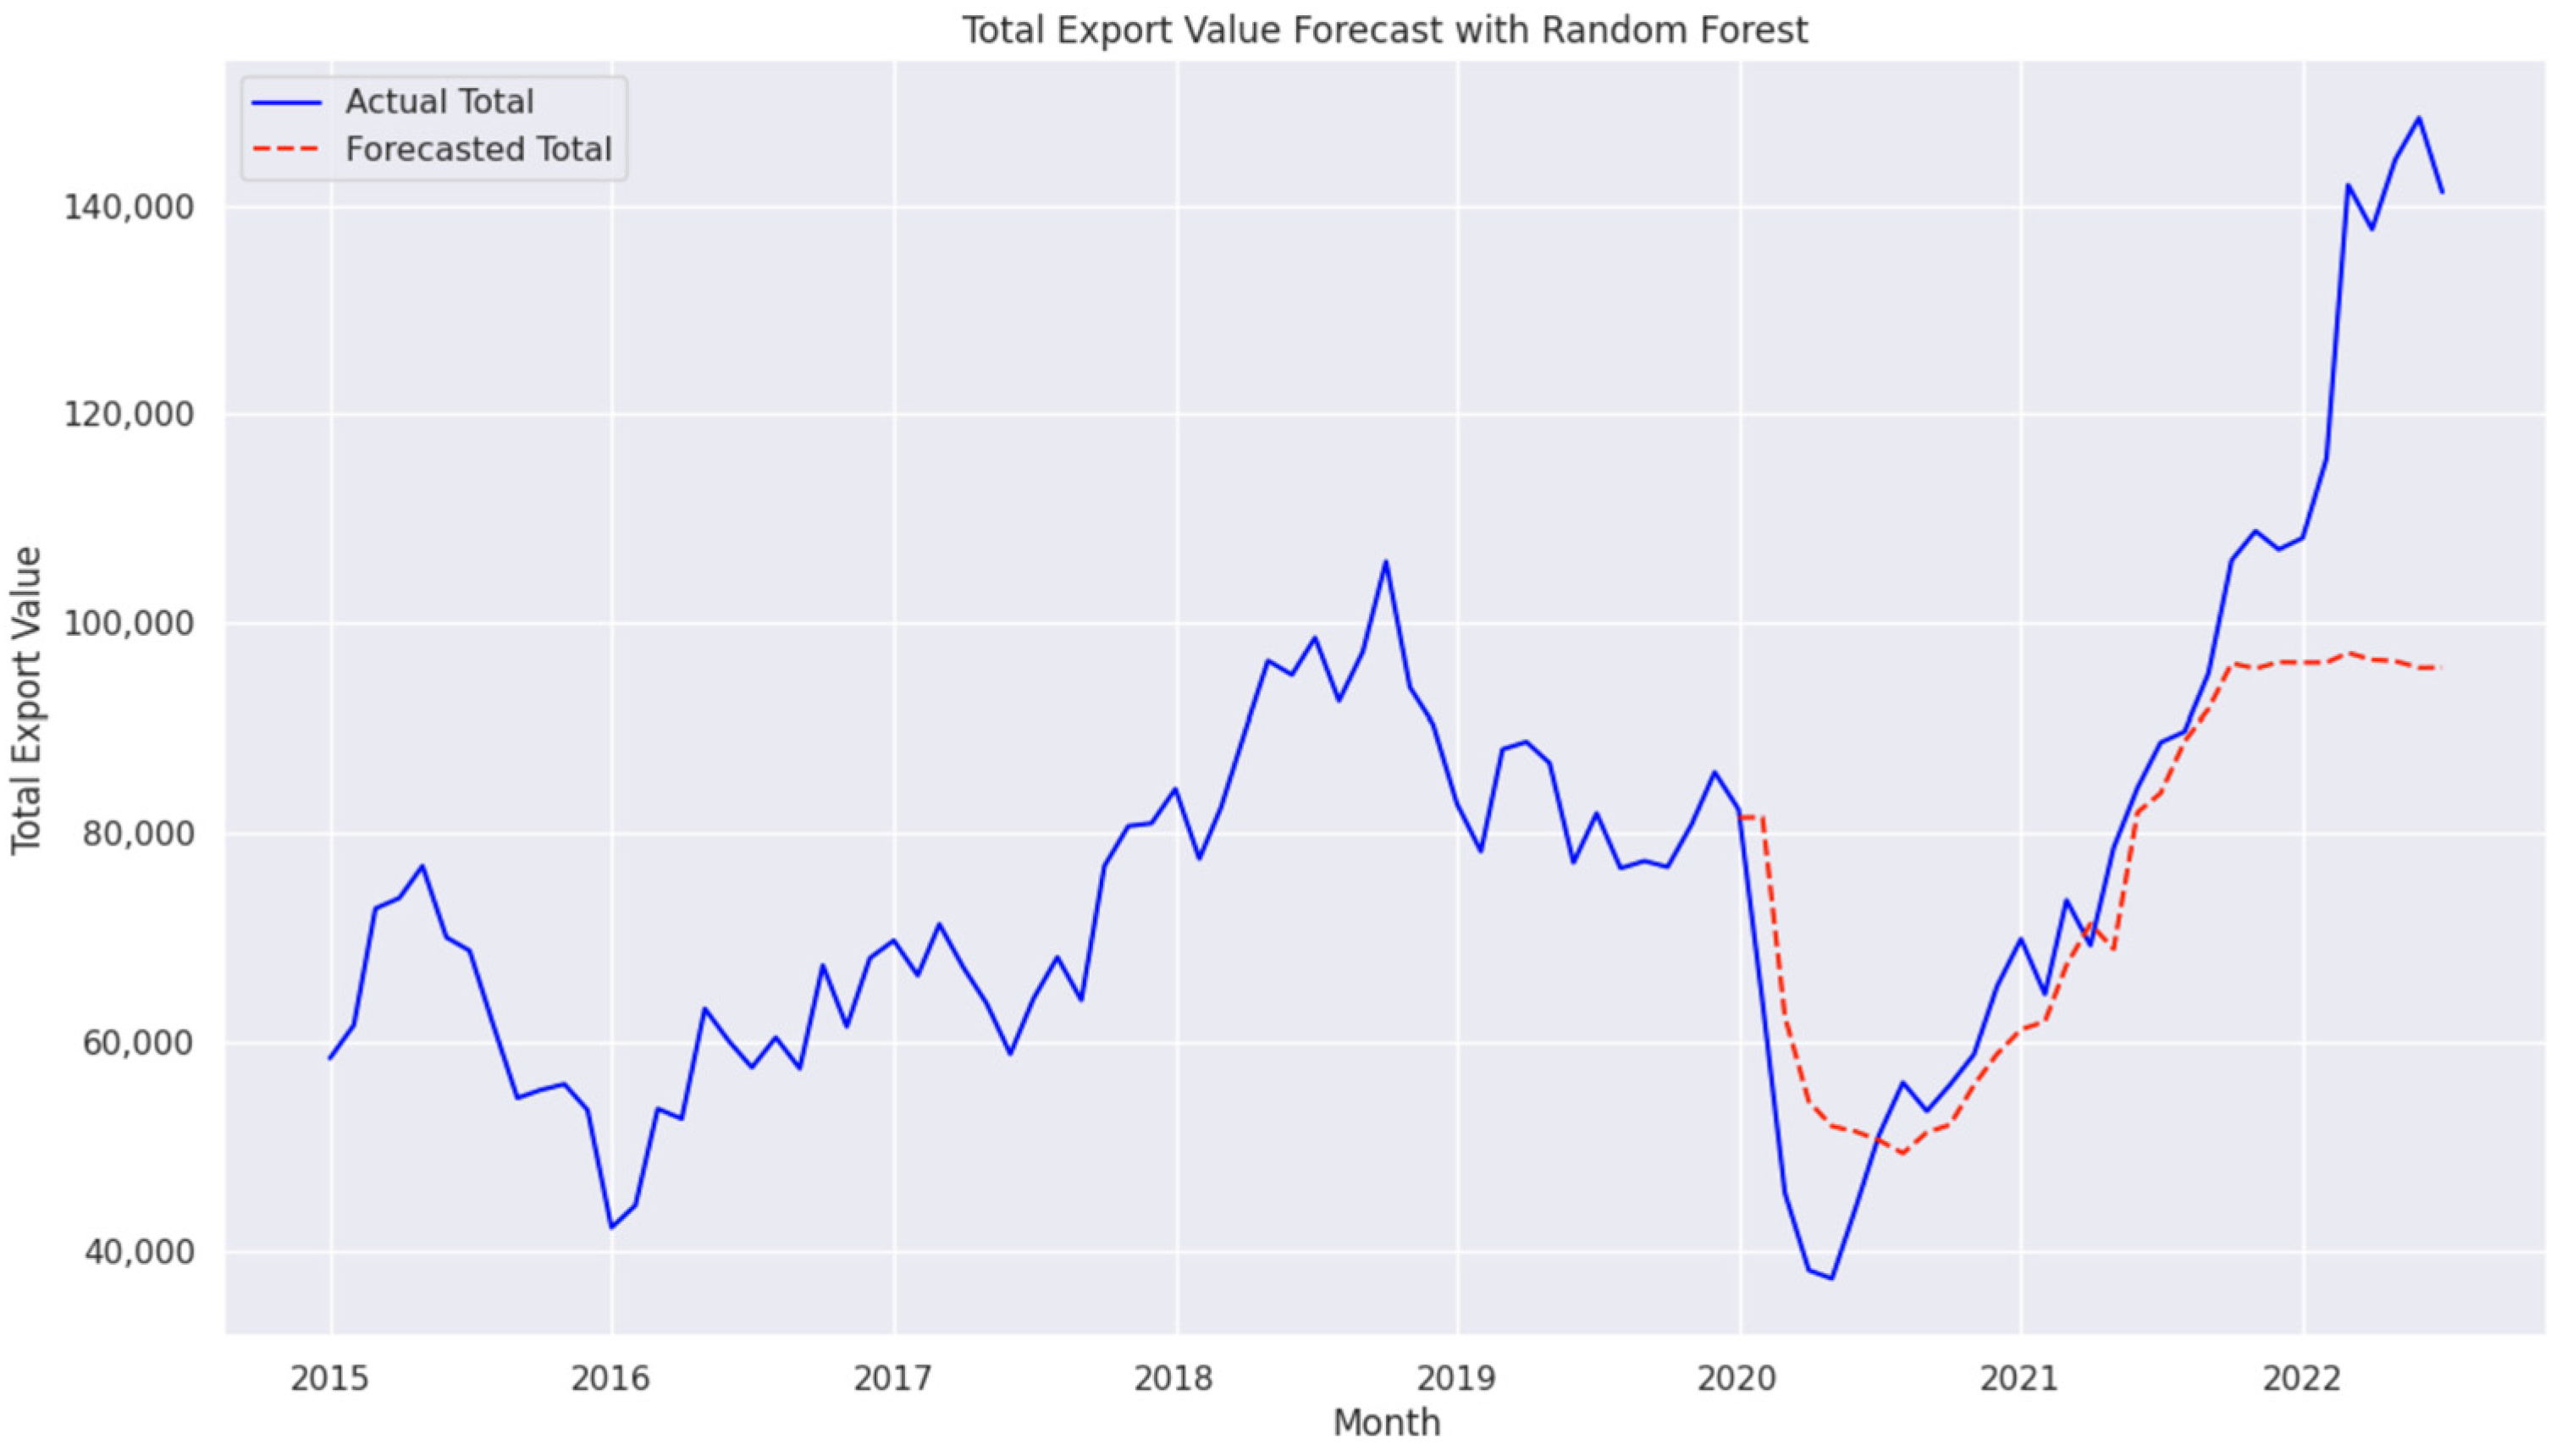
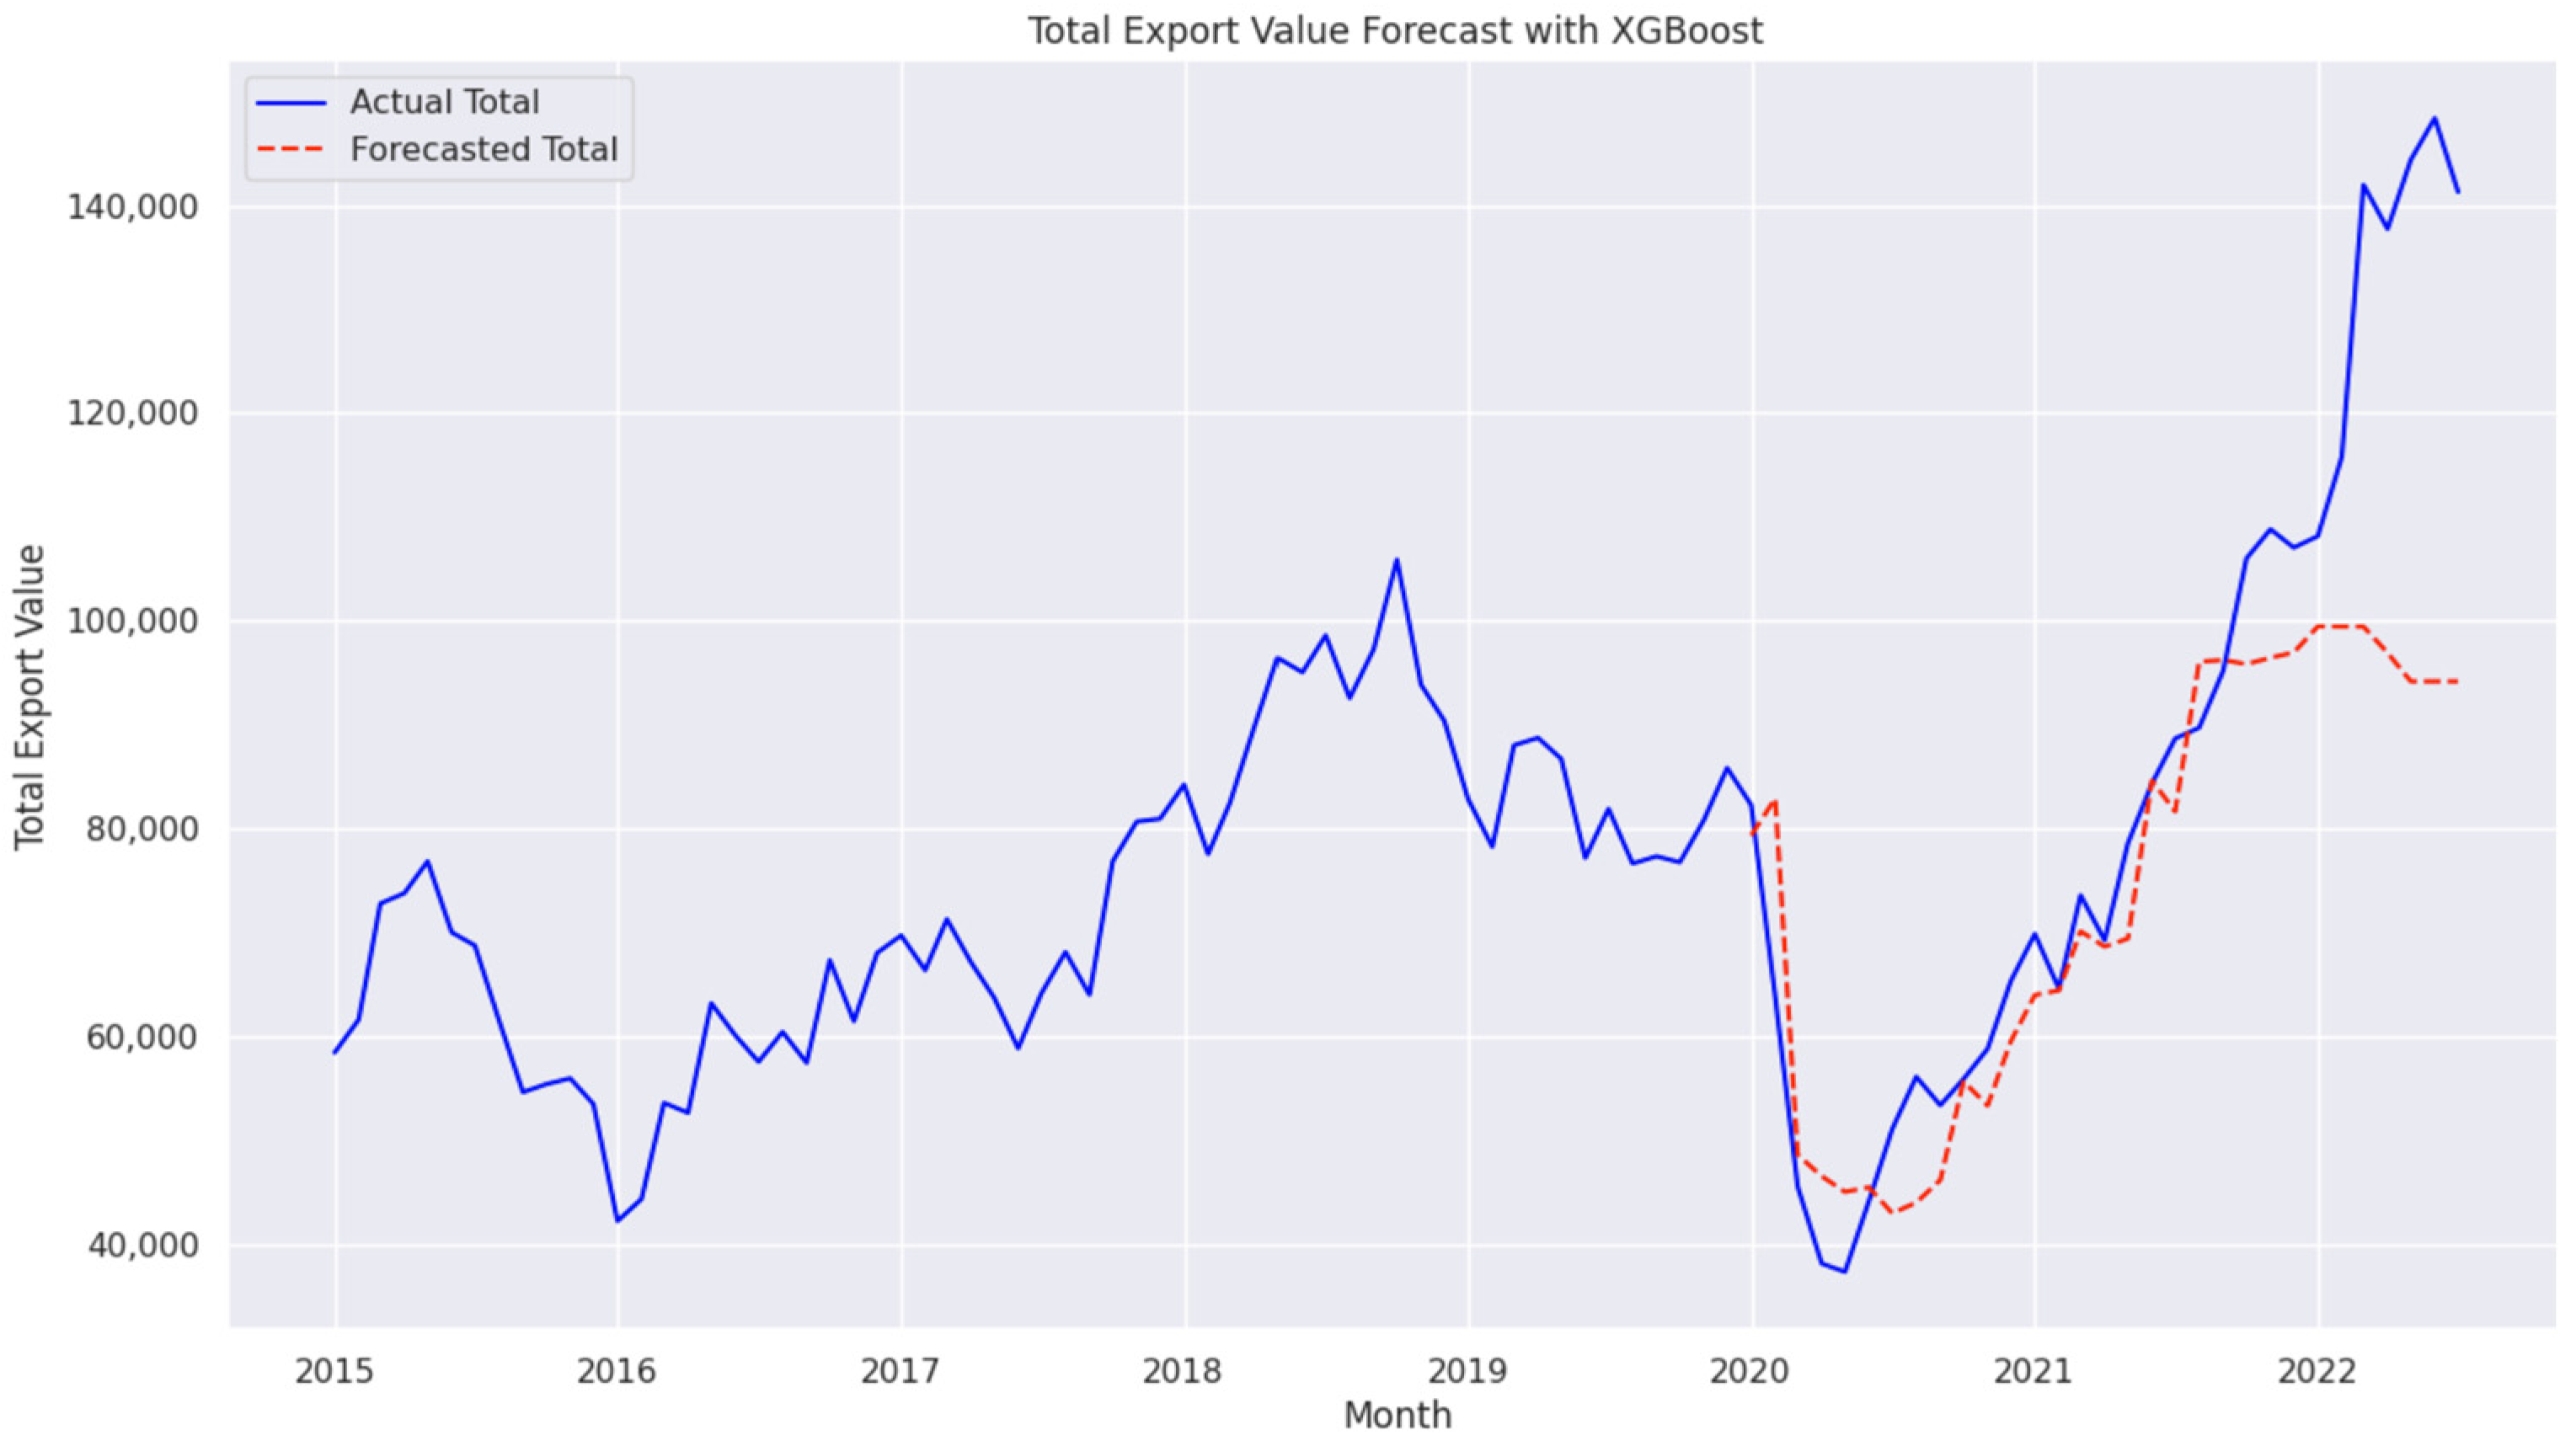
4.7. Performance of Random Forest and XGBoost

Traditional machine learning models, Random Forest and XGBoost, exhibited significantly higher error rates, with MAPEs of 15.39% and 13.36%, respectively, as shown in Figure 21 and Figure 22. The high MSE and RMSE values indicate challenges in capturing the non-linear dependencies within export data, suggesting that these models may struggle with the complexity of economic forecasting tasks [7].
Random Forest combines predictions from multiple decision trees, as follows:
Y x = 1 T t = 1 T y t x
where y t x is the prediction from the t-th tree and T is the total number of trees.
The XGBoost follows a boosting approach, combining multiple weak learners into a strong model using the following form:
Y t x = Y t 1 x + η . f t ( x )
where Y t x is the updated prediction after adding the new model at iteration t, y t 1 x represents the model from the previous iteration, η is the learning rate, and f t x is the model (weak learner) learned at iteration t.

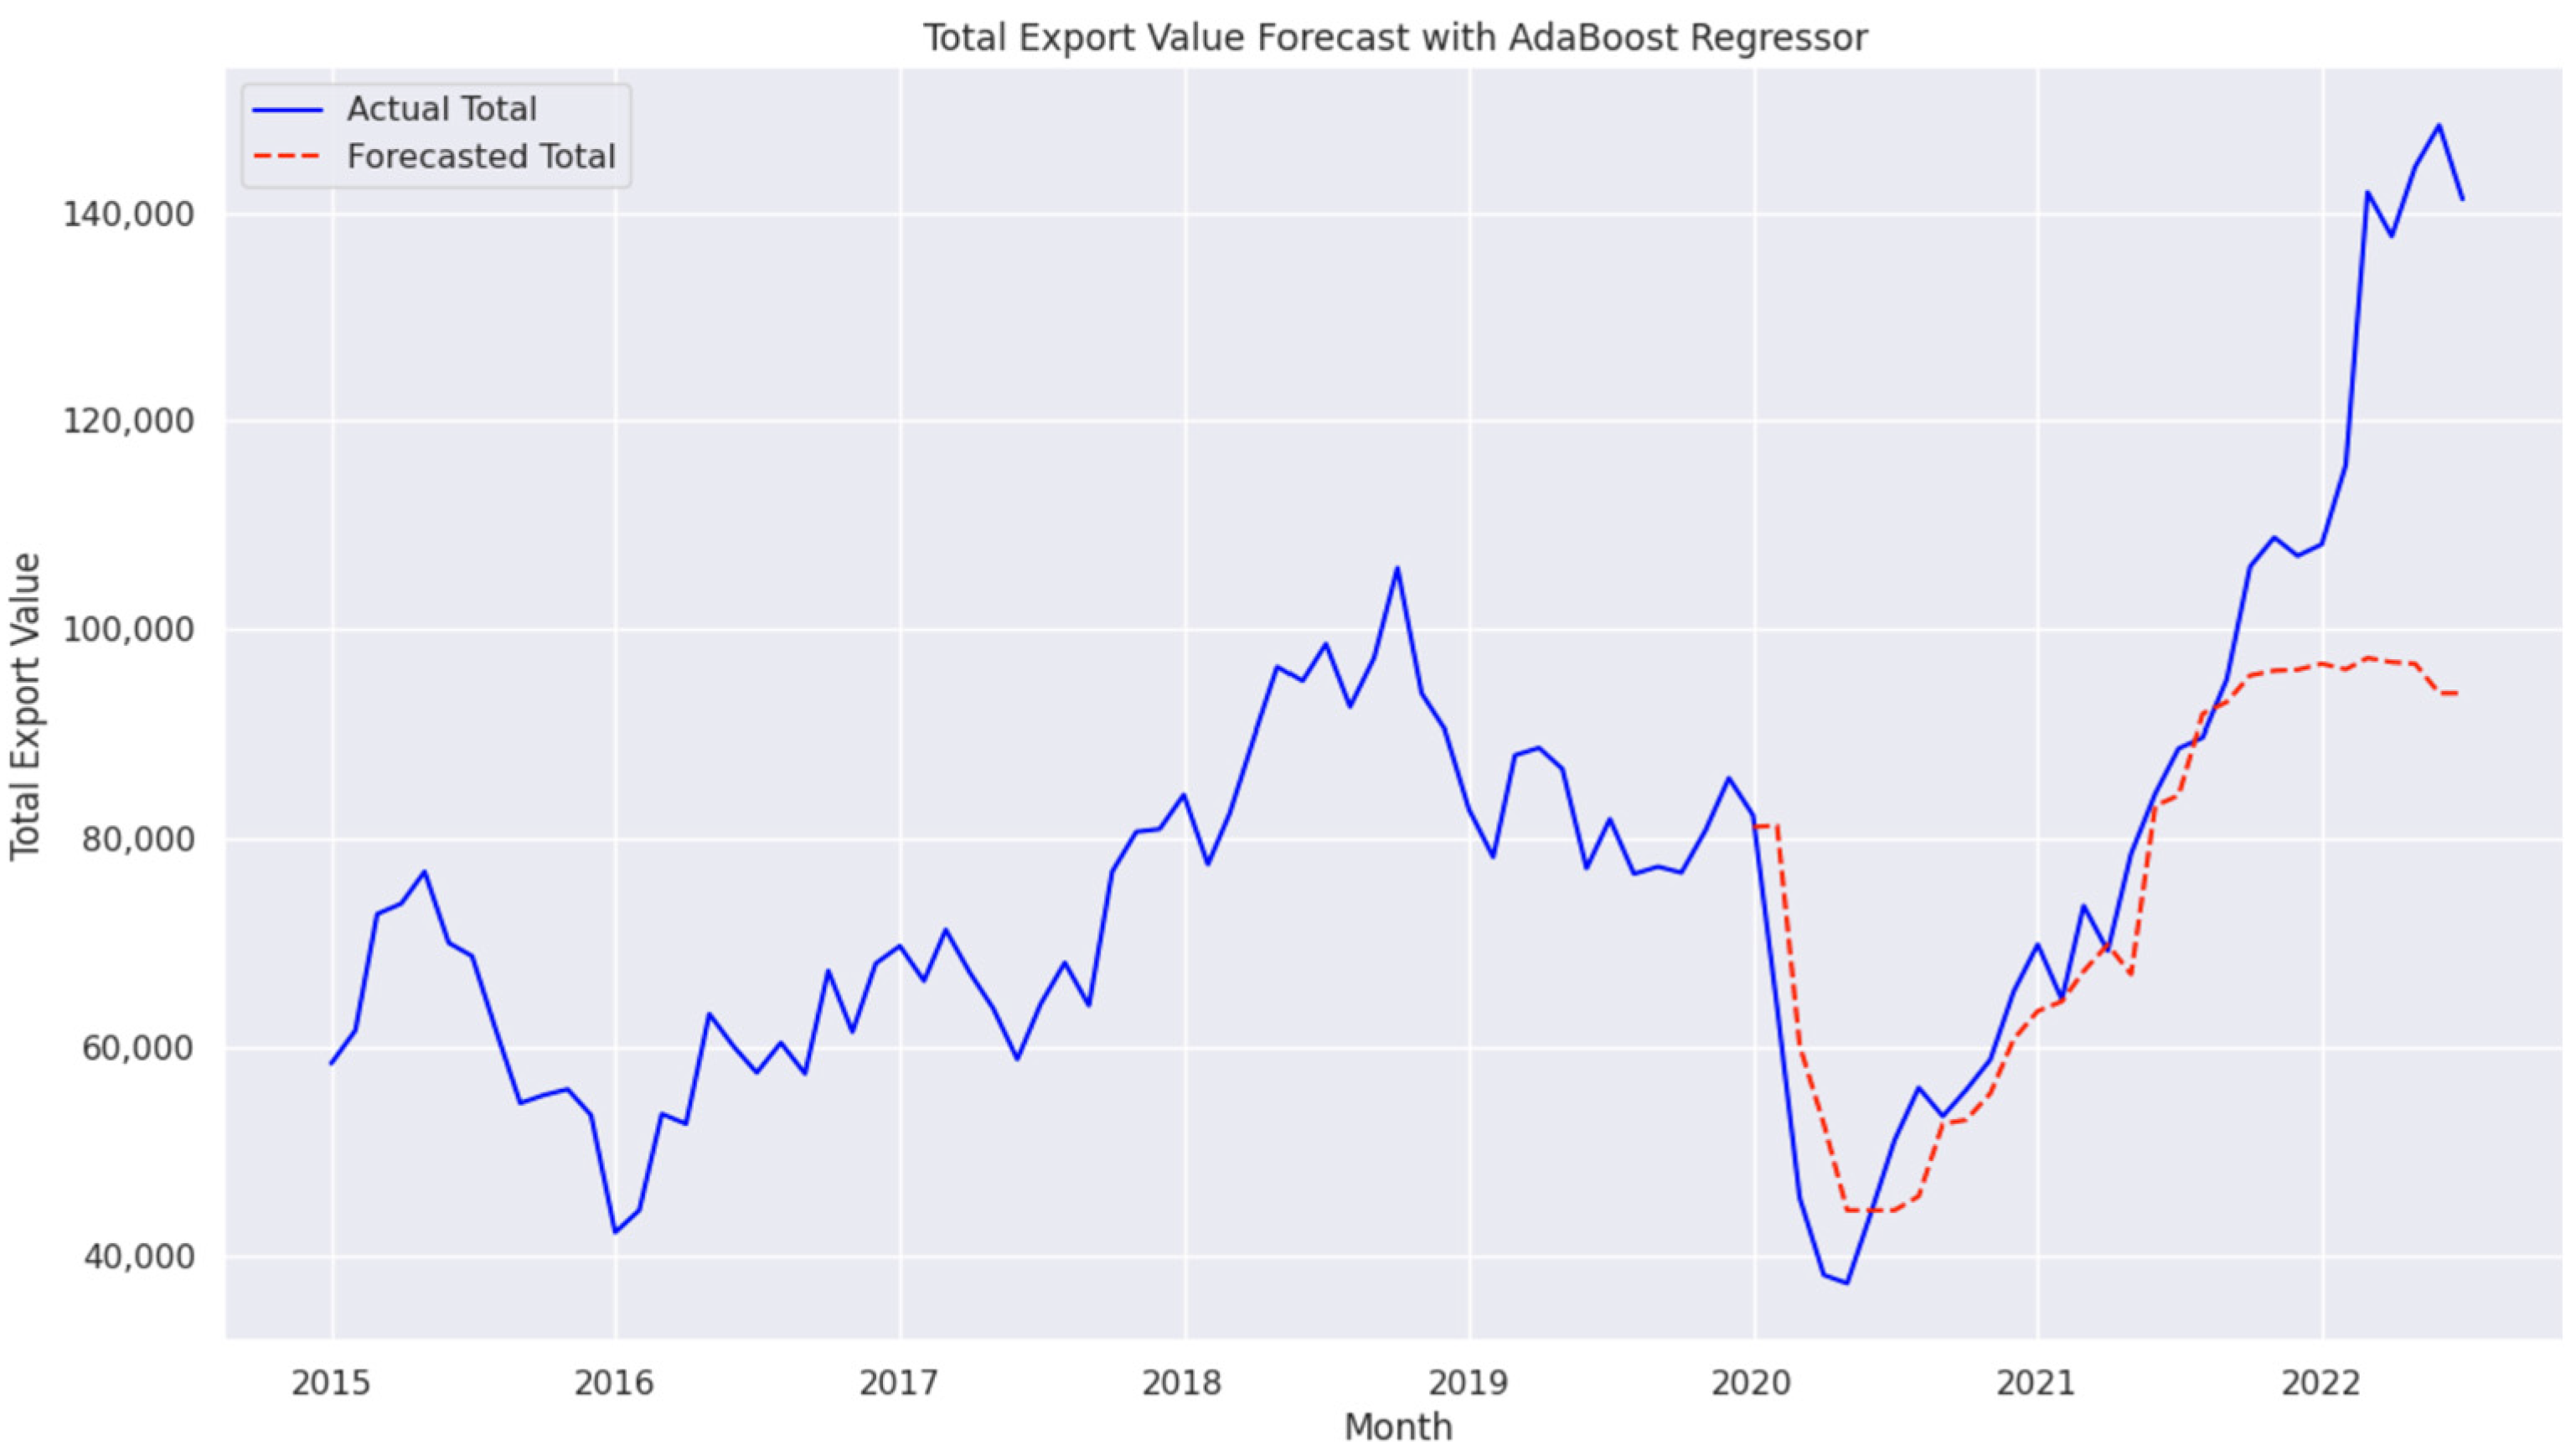
4.8. Performance of AdaBoost Regressor

The AdaBoost Regressor, which is not typically optimized for time-series forecasting, achieved an MAPE of 14.10%, an MSE of 428,840,065, an RMSE of 20,708, and an MAD of 13,515, as shown in Figure 23. These results indicate that AdaBoost can contribute to regression tasks but is generally less effective than specialized time-series models like LSTM or Transformer.
AdaBoost builds a strong learner by iteratively improving weak learners:
Y x = t = 1 T α t y t x
where α t represents the weights of each regressor and y t x is the prediction from each learner. The model iteratively adjusts these weights to focus more on instances that were previously incorrectly predicted, improving its learning over time.

4.9. Performance of Transformers with GDP

Incorporating GDP data into the Transformer model slightly reduced its forecasting accuracy, leading to an MAPE of 2.67% and increased MSE and RMSE values of 5,474,217 and 2339, respectively, as shown in Figure 24. This indicates that adding GDP data may introduce noise or interfere with the model’s ability to capture more relevant predictive patterns. The results indicate that while GDP provides a valuable macroeconomic context, its integration requires careful feature engineering to avoid diminishing model accuracy [35].

5. Discussion

5.1. AI’s Role in Economic Forecasting

The research of this paper highlights the transformative role of AI in forecasting Saudi Arabia’s non-oil export volumes, supporting the Kingdom’s Vision 2030 objectives for economic diversification and data-driven policy development. By leveraging advanced AI models, such as LSTM, Transformer architectures, XGBRegressor, and ensemble learning techniques, the study demonstrates how historical export data can be effectively utilized to improve forecasting accuracy.
Among all models, the Advanced Transformer (without GDP) achieved the highest accuracy, with an MAPE of 0.73%, outperforming the standard Transformer, which attained an MAPE of 0.76%. These results indicate that Transformer-based architectures, particularly when optimized, are highly effective for economic forecasting tasks. Furthermore, the Advanced Transformer, built upon the standard Transformer, enhances its ability to capture intricate relationships in time-series data by increasing the attention head size to 128. This modification significantly improves forecasting accuracy compared to the standard Transformer, reinforcing its effectiveness as a powerful tool for economic and trade forecasting.
It is important to clarify that the attention head size refers to the dimensionality of the space in which each attention head operates, not the number of time steps used as input. Although the model learns from sequences of limited length (96 months), increasing the head size enables richer and more expressive representations of the same temporal inputs. This explains why the Advanced Transformer, even when primarily relying on recent export lags (as shown in the SHAP and PDP analyses), can still outperform smaller models, as its larger internal representation capacity allows it to extract deeper temporal features from the same input history.
This observation is consistent with the Explainable AI (XAI) results, which showed that lag1, lag2, and lag3 were the most influential predictors. Older lags exhibited diminishing relevance, suggesting that short-term dynamics are more critical in export forecasting. However, the performance gains from the Advanced Transformer stem not from using more historical data but from its ability to model more complex interactions within the same input length. This insight helps reconcile the apparent contrast between the low utility of older lags and the superior performance of the larger head size.
Furthermore, the integration of SHAP and PDP techniques significantly enhances the interpretability of the forecasting models. SHAP provides both global feature rankings and instance-level explanations, helping stakeholders understand not just which features are important but why and how they impact individual predictions. PDPs, in turn, visualize the marginal effect of input features, illustrating the direction and strength of their relationship with the target variable. These interpretability tools are particularly valuable in economic applications, where trust in AI outputs is crucial for adoption by policymakers and analysts. By uncovering the internal logic of complex models, SHAP and PDP serve as bridges between model performance and transparency.
This paper also demonstrates the effectiveness of ensemble learning techniques, particularly the Ensemble Blending model, which combines Random Forest, XGBRegressor, and AdaBoost with XGBoost as the meta-learner, achieving an MAPE of 1.23%. This approach effectively integrates the strengths of different learning paradigms to enhance predictive robustness across diverse patterns. Similarly, the Ensemble Stacking model, using Ridge Regression as the meta-learner, aggregates outputs from the same base models to achieve balanced performance across varying data conditions.
Indeed, the integration of XAI techniques, such as SHAP Force Plots, PDPs, and Feature Importance visualizations, was essential for interpreting model decisions. These tools revealed that recent export lags are consistently the most influential features, confirming the dominance of short-term temporal dependencies in non-oil export behavior. Moreover, XAI provided transparency to understand how base and meta-models contribute to ensemble performance, offering interpretable and actionable insights for policymakers.

5.2. Impact of GDP Data on Forecasting Accuracy

An important finding of this paper is the mixed impact of incorporating GDP data into AI-based forecasting models. Although the GDP is one of the most widely used macroeconomic indicators, its integration did not improve predictive performance in our experiments. Specifically, the Temporal Fusion Transformer (TFT), when supplemented with GDP data, resulted in an MAPE of 5.48%, and the standard Transformer’s MAPE increased from 0.76% to 2.67% upon GDP inclusion.
The GDP was selected due to its role as a high-level measure of national economic activity, which—at a conceptual level—has implications for trade dynamics. However, the observed decline in performance suggests that the GDP, being a quarterly and aggregate indicator, may not capture the short-term, high-frequency variations present in monthly export data. Thus, while its inclusion was motivated by its economic relevance, the results illustrate the complexity of integrating macro-level variables into time-series models for forecasting specific trade flows.
The Advanced Transformer without GDP achieved the best results (MAPE 0.73%), reinforcing the idea that historical export data alone may provide a more consistent signal for short-term forecasting. This outcome does not negate the relevance of GDP but rather highlights the need for advanced preprocessing, feature engineering, or transformation strategies (e.g., lagging GDP values or disaggregating sectoral GDP) to fully leverage its value. The primary focus was on modeling historical export and GDP data; external factors, while potentially beneficial, were excluded to keep the research scope manageable and to avoid issues related to incomplete data.
Additionally, this experiment served as a proof of concept, showcasing both the potential and limitations of incorporating the macroeconomic context into deep learning models. Future research could explore alternative feature engineering techniques, such as dimensionality reduction, attention-based filtering, or lagged transformations of GDP, to better harness its predictive potential. Researchers could also explore different data, like commodity prices, shipping rates, or key importers’ demand indices, that tend to correlate strongly with export trends, potentially improving forecast accuracy.

5.3. Integration with the Existing Literature

This paper contributes to the growing body of research on AI-driven economic forecasting and aligns with previous work on AI applications in macroeconomic modeling. For example, Al-Fattah’s work [21] on gasoline demand forecasting and Haque’s study [20] on export diversification illustrate how AI can enhance economic predictions across different sectors. By integrating findings from these efforts, this research further strengthens the case for AI as a viable tool for economic planning beyond non-oil exports.

5.4. Methodological Strengths and Weaknesses

The research shown in this paper adopts a comprehensive methodological approach, leveraging a diverse range of AI techniques and a robust dataset to evaluate forecasting performance. The use of ensemble learning, deep learning architectures, and interpretability tools ensures a well-rounded analysis of model effectiveness. However, a key limitation is that GDP data were only applied to the Advanced Transformer and Ensemble models, leaving room for further exploration with other AI models, such as LSTM, XGBoost, or additional hybrid approaches. The step-by-step methodology adopted in this study ensures that the impact of GDP integration is systematically evaluated before extending it to other models. This controlled approach allows for more targeted improvements in feature engineering and model adaptation, ensuring that future research builds upon these findings with greater precision.

6. Conclusions

This paper underscores the significant potential of AI in enhancing the accuracy and transparency of non-oil export forecasting for Saudi Arabia, supporting data-driven economic planning in alignment with Vision 2030. The results demonstrate that the Advanced Transformer model, utilizing historical export data without GDP inputs, achieved the highest predictive performance (MAPE: 0.73%), confirming its ability to effectively model complex trade dynamics. In contrast, the integration of GDP data, while conceptually valuable as a macroeconomic indicator, led to a modest decline in forecasting accuracy. This highlights the need for careful feature selection and preprocessing when incorporating aggregate economic variables, which may introduce noise or misalignment in short-term forecasting tasks. The study further validates the utility of ensemble learning methods, particularly the non-linear Blending model, in enhancing prediction robustness by leveraging complementary strengths of different algorithms. Additionally, the inclusion of the Explainable AI techniques SHAP and PDPs contributed to model transparency by uncovering the influence of individual features, specifically recent export lags, on prediction outcomes. These tools not only improved interpretability but also helped reconcile model behavior with underlying data patterns, enhancing trust in AI-powered forecasts. Future research may focus on refining macroeconomic feature integration using lag transformations, sectoral decomposition, or dimensionality reduction techniques to improve signal extraction. Additionally, further development of hybrid AI architectures, expansion of ensemble and XAI frameworks, and optimization of data preprocessing pipelines will be critical to advance reliable and interpretable economic forecasting systems.

Author Contributions

Conceptualization, M.A. (Musab Aloudah) and M.A. (Mahdi Alajmi); methodology, M.A. (Musab Aloudah) and A.S.; software, M.A. (Musab Aloudah); validation, M.A. (Musab Aloudah), M.A. (Mahdi Alajmi), A.S., A.A., B.A. and E.A.; formal analysis, M.A. (Musab Aloudah), M.A. (Mahdi Alajmi), A.S., A.A., B.A. and E.A.; investigation, M.A. (Musab Aloudah) and A.S.; resources, M.A. (Musab Aloudah), M.A. (Mahdi Alajmi), A.S., A.A., B.A. and E.A.; data curation, M.A. (Musab Aloudah) and M.A. (Mahdi Alajmi); writing—original draft preparation, M.A. (Mahdi Alajmi) and A.S.; writing—review and editing, M.A. (Mahdi Alajmi) and A.S.; visualization, M.A. (Musab Aloudah); supervision, A.S., A.A. and B.A.; project administration, A.S. and A.A.; funding acquisition, A.A. All authors have read and agreed to the published version of the manuscript.

Funding

This research was funded by the Deanship of Scientific Research, Vice Presidency for Graduate Studies and Scientific Research, King Faisal.

Data Availability Statement

The export data is sourced from the King Abdullah Petroleum Studies and Research Center (KAPSARC) [18]. While the GDP data is sourced by the Saudi Arabian Monetary Authority (SAMA) [22].

Acknowledgments

This work was supported by the Deanship of Scientific Research, Vice Presidency for Graduate Studies and Scientific Research, King Faisal University, Saudi Arabia [Grant No. KFU250943].

Conflicts of Interest

The authors declare no conflict of interest.

References

  1. Hasanov, F.J.; Javid, M.; Joutz, F.L. Saudi non-oil exports before and after covid-19: Historical impacts of determinants and scenario analysis. Sustainability 2022, 14, 2379. [Google Scholar] [CrossRef]
  2. Available online: https://www.vision2030.gov.sa/ar/overview (accessed on 30 March 2025).
  3. Ahmed, A.; Xi, R.; Hou, M.; Shah, S.A.; Hameed, S. Harnessing big data analytics for healthcare: A comprehensive review of frameworks, implications, applications, and impacts. IEEE Access 2023, 11, 112891–112928. [Google Scholar] [CrossRef]
  4. Alreshidi, I.; Moulitsas, I.; Jenkins, K.W. Advancing aviation safety through machine learning and psychophysiological data: A systematic review. IEEE Access 2024, 12, 5132–5150. [Google Scholar] [CrossRef]
  5. Liu, Z.; Zhang, A. Sampling for big data profiling: A survey. IEEE Access 2020, 8, 72713–72726. [Google Scholar] [CrossRef]
  6. Jarrah, M.; Derbali, M. Predicting saudi stock market index by using multivariate time series based on deep learning. Appl. Sci. 2023, 13, 8356. [Google Scholar] [CrossRef]
  7. Yoo, T.-W.; Oh, I.-S. Time series forecasting of agricultural products’ sales volumes based on seasonal long short-term memory. Appl. Sci. 2020, 10, 8169. [Google Scholar] [CrossRef]
  8. Dave, E.; Leonardo, A.; Jeanice, M.; Hanafiah, N. Forecasting Indonesia exports using a hybrid model arima-lstm. Procedia Comput. Sci. 2021, 179, 480–487. [Google Scholar] [CrossRef]
  9. Sirisha, U.M.; Belavagi, M.C.; Attigeri, G. Profit prediction using arima, sarima and lstm models in time series forecasting: A comparison. IEEE Access 2022, 10, 124715–124727. [Google Scholar] [CrossRef]
  10. Reza, S.; Ferreira, M.C.; Machado, J.J.; Tavares, J.M.R. A multi head attention-based transformer model for traffic flow forecasting with a comparative analysis to recurrent neural networks. Expert Syst. Appl. 2022, 202, 117275. [Google Scholar] [CrossRef]
  11. Islam, M.; Shuvo, S.S.; Shohan, J.A.; Faruque, O. Forecasting of pv plant output using interpretable temporal fusion transformer model. In Proceedings of the 2023 North American Power Symposium (NAPS), Asheville, NC, USA, 15–17 October 2023; pp. 1–6. [Google Scholar]
  12. Hasan, M.; Abedin, M.Z.; Hajek, P.; Coussement, K.; Sultan, M.N.; Lucey, B. A blending ensemble learning model for crude oil price forecasting. Ann. Oper. Res. 2024, 1–31. [Google Scholar] [CrossRef]
  13. Pavlyshenko, B. Using stacking approaches for machine learning models. In Proceedings of the 2018 IEEE Second International Conference on Data Stream Mining & Processing (DSMP), Lviv, Ukraine, 21–25 August 2018; pp. 255–258. [Google Scholar]
  14. Carta, S.; Podda, A.S.; Reforgiato Recupero, D.; Stanciu, M.M. Explainable ai for financial forecasting. In International Conference on Machine Learning, Optimization, and Data Science, 7th International Conference, LOD 2021, Grasmere, UK, October 4–8, 2021, Revised Selected Papers, Part II; Springer: Cham, Switzerland, 2021; pp. 51–69. [Google Scholar]
  15. e Silva, L.C.; de Freitas Fonseca, G.; Andre, P.; Castro, L. Transformers and attention-based networks in quantitative trading: A comprehensive survey. In Proceedings of the 5th ACM International Conference on AI in Finance (ICAIF ′24), Brooklyn, NY, USA, 14–17 November 2024; Association for Computing Machinery: New York, NY, USA, 2024; pp. 822–830. [Google Scholar]
  16. Baumeister, C.; Guérin, P. A comparison of monthly global indicators for forecasting growth. Int. J. Forecast. 2021, 37, 1276–1295. [Google Scholar] [CrossRef]
  17. Kozik, R.; Pawlicki, M.; Choraś, M. A new method of hybrid time window embedding with transformer-based traffic data classification in iot-networked environment. Pattern Anal. Appl. 2021, 24, 1441–1449. [Google Scholar] [CrossRef]
  18. Exports Value by Harmonized System. 2024. Available online: https://datasource.kapsarc.org/explore/dataset/exports-value-by-harmonized-system/information/?disjunctive.hs_section&disjunctive.hs_chapter&sort=time_period (accessed on 30 March 2025).
  19. Jitsakul, W.; Whasphuttisit, J. Forecasting the export value of smes using time series analysis. In Proceedings of the 2022 7th International Conference on Business and Industrial Research (ICBIR), Bangkok, Thailand, 19–20 May 2022; pp. 671–676. [Google Scholar]
  20. Haque, M.I. Assessing the progress of exports diversification in saudi arabia: Growth-share matrix approach. Probl. Perspect. Manag. 2020, 18, 118. [Google Scholar]
  21. Al-Fattah, S.M. A new artificial intelligence gannats model predicts gasoline demand of saudi arabia. J. Pet. Sci. Eng. 2020, 194, 107528. [Google Scholar] [CrossRef]
  22. Gross Domestic Product by Kind of Economic Activity at Current Prices Quarterly. 2024. Available online: https://datasource.kapsarc.org/explore/dataset/saudi-arabia-gross-domestic-product-by-kind-of-economic-activity-at-current-pric/information// (accessed on 30 March 2025).
  23. Makridakis, S.; Spiliotis, E.; Assimakopoulos, V. Statistical and machine learning forecasting methods: Concerns and ways forward. PLoS ONE 2018, 13, e0194889. [Google Scholar] [CrossRef]
  24. Batarseh, F.; Gopinath, M.; Nalluru, G.; Beckman, J. Application of machine learning in forecasting international trade trends. arXiv 2019, arXiv:1910.03112. [Google Scholar]
  25. Vaswani, A.; Shazeer, N.; Parmar, N.; Uszkoreit, J.; Jones, L.; Gomez, A.N.; Kaiser, Ł.; Polosukhin, I. Attention is All you Need. In Advances in Neural Information Processing Systems; Curran Associates, Inc.: New York, NY, USA, 2017; Volume 30. [Google Scholar]
  26. Foumani, N.M.; Tan, C.W.; Webb, G.I.; Salehi, M. Improving position encoding of transformers for multivariate time series classification. Data Min. Knowl. Discov. 2024, 38, 22–48. [Google Scholar] [CrossRef]
  27. Peng, B.; Alcaide, E.; Anthony, Q.; Albalak, A.; Arcadinho, S.; Biderman, S.; Cao, H.; Cheng, X.; Chung, M.; Grella, M.; et al. RWKV: Reinventing RNNs for the Transformer Era. In Findings of the Association for Computational Linguistics: EMNLP; Association for Computational Linguistics: Singapore, 2023; pp. 14048–14077. [Google Scholar]
  28. Hochreiter, S.; Schmidhuber, J. Long short-term memory. Neural Comput. 1997, 9, 1735–1780. [Google Scholar] [CrossRef]
  29. Sagheer, A.; Kotb, A. Time Series Forecasting of Petroleum Production using Deep LSTM Recurrent Networks. Neurocomputing 2019, 323, 203–213. [Google Scholar] [CrossRef]
  30. Chen, T.; Guestrin, C. XGBoost: A Scalable Tree Boosting System. In Proceedings of the 22nd ACM SIGKDD International Conference on Knowledge Discovery and Data Mining, San Francisco, CA, USA, 13–17 August 2016; pp. 785–794. [Google Scholar]
  31. Lim, B.; Arık, S.Ö.; Loeff, N.; Pfister, T. Temporal Fusion Transformers for interpretable multi-horizon time series forecasting. Int. J. Forecast. 2021, 37, 1748–1764. [Google Scholar] [CrossRef]
  32. Chatzimparmpas, A.; Martins, R.M.; Kucher, K.; Kerren, A. Empirical Study: Visual Analytics for Comparing Stacking to Blending Ensemble Learning. In Proceedings of the 2021 23rd International Conference on Control Systems and Computer Science (CSCS), Bucharest, Romania, 26–28 May 2021; pp. 1–8. [Google Scholar]
  33. Lundberg, S.M.; Lee, S.-I. A unified approach to interpreting model predictions. In Proceedings of the 31st International Conference on Neural Information Processing Systems (NIPS′17), Long Beach, CA, USA, 4–9 December 2017. [Google Scholar]
  34. Hu, Y.; Wei, R.; Yang, Y.; Li, X.; Huang, Z.; Liu, Y.; He, C.; Lu, H. Performance Degradation Prediction Using LSTM with Optimized Parameters. Sensors 2022, 22, 2407. [Google Scholar] [CrossRef] [PubMed]
  35. Maccarrone, G.; Morelli, G.; Spadaccini, S. GDP Forecasting: Machine Learning, Linear or Autoregression? Front. Artif. Intell. 2021, 4, 757864. [Google Scholar] [CrossRef] [PubMed]
Figure 1. Top 5 HS Sections by Total Export Value.
Bdcc 09 00094 g001
Figure 2. Top 5 HS Sections by trend of Total Export Value.
Bdcc 09 00094 g002
Figure 3. Gross Domestic Product (GDP).
Bdcc 09 00094 g003
Figure 4. Merged monthly GDP and export data.
Bdcc 09 00094 g004
Figure 5. Total Export Value forecast with Advanced Transformer.
Bdcc 09 00094 g005
Figure 6. Total Export Value forecast with Transformer.
Bdcc 09 00094 g006
Figure 7. SHAP force plot for the Ensemble Blending model.
Bdcc 09 00094 g007
Figure 8. Feature Importance plot for the Ensemble Blending model.
Bdcc 09 00094 g008
Figure 9. Boxplots of export value lag features.
Bdcc 09 00094 g009
Figure 10. Partial Dependence Plots for AdaBoost.
Bdcc 09 00094 g010
Figure 11. Partial Dependence Plots for Random Forest.
Bdcc 09 00094 g011
Figure 12. Partial Dependence Plots for XGBoost.
Bdcc 09 00094 g012
Figure 14. Total Export Value forecast with GDP data and Temporal Fusion Transformer.
Bdcc 09 00094 g014
Figure 15. Training and validation loss for TFT.
Bdcc 09 00094 g015
Figure 16. Forecast vs. actual export values for Stacking model.
Bdcc 09 00094 g016
Figure 17. Total Export Value forecast with LSTM.
Bdcc 09 00094 g017
Figure 18. Total Export Value forecast with Deep LSTM.
Bdcc 09 00094 g018
Figure 19. LSTM predictions vs. actual values (training set).
Bdcc 09 00094 g019
Figure 20. LSTM predictions vs. actual values (testing set).
Bdcc 09 00094 g020
Figure 21. Total Export Value forecast with Random Forest.
Bdcc 09 00094 g021
Figure 22. Total Export Value forecast with XGBoost.
Bdcc 09 00094 g022
Figure 23. Total Export Value forecast with AdaBoost Regressor.
Bdcc 09 00094 g023
Figure 24. Total Export Value forecast with Transformer including GDP data.
Bdcc 09 00094 g024
Table 1. Performance metrics for different forecasting models.
ModelMSERMSEMADMAPEMAD as % of Mean
Advanced Transformer246,5104964520.73%0.53%
Transformer259,8625094820.76%0.57%
Ensemble Blending1,698,95221309311.23%1.10%
LSTM1,180,75410868921.44%1.05%
Transformer with GDP5,474,217233920002.67%2.36%
Deep LSTM31,972,707565438844.519%4.59%
TFT with GDP80,225,739895653955.48%6.37%
XGBRegressor416,618,49820,41113,15513.36%15.53%
AdaBoostRegressor428,840,06520,70813,51514.10%15.96%
Random Forest428,208,02420,69314,00815.39%16.54%
Ensemble Stacking469,002,74821,65615,30116.45%18.07%
Disclaimer/Publisher’s Note: The statements, opinions and data contained in all publications are solely those of the individual author(s) and contributor(s) and not of MDPI and/or the editor(s). MDPI and/or the editor(s) disclaim responsibility for any injury to people or property resulting from any ideas, methods, instructions or products referred to in the content.

