Article

Development of a Predictive Model for the Biological Activity of Food and Microbial Metabolites Toward Estrogen Receptor Alpha (ERα) Using Machine Learning

1
Department of Food Technology and Bioengineering, Plekhanov Russian University of Economics, 36 Stremyanny per., 115054 Moscow, Russia
2
Research Laboratory of Applied Biotechnology, Cherepovets State University, 5 Lunacharsky pr., 162602 Cherepovets, Russia
3
Apq Control LLC, Office 11, 45 Pervomajskaya st., 162612 Cherepovets, Russia
4
Department of Biotechnology, Aquaculture, Soil Science and Land Management, Astrakhan Tatishchev State University, 20a, Tatishchev st., 414056 Astrakhan, Russia
5
Basic Department of Trade Policy, Plekhanov Russian University of Economics, 36 Stremyanny per., 115054 Moscow, Russia
6
Department of Management and Economics, State University of Humanities and Social Studies, 30 Zelenaya st., 140400 Moscow, Russia
*
Authors to whom correspondence should be addressed.
Big Data Cogn. Comput. 2025, 9(4), 86; https://doi.org/10.3390/bdcc9040086
Submission received: 31 January 2025 / Revised: 8 March 2025 / Accepted: 28 March 2025 / Published: 1 April 2025

Abstract

:
The interaction of estrogen receptor alpha (ERα) with various metabolites—both endogenous and exogenous, such as those present in food products, as well as gut microbiota-derived metabolites—plays a critical role in modulating the hormonal balance in the human body. In this study, we evaluated a suite of 27 machine learning models and, following systematic optimization and rigorous performance comparison, identified linear discriminant analysis (LDA) as the most effective predictive approach. A meticulously curated dataset comprising 75 molecular descriptors derived from compounds with known ERα activity was assembled, enabling the model to achieve an accuracy of 89.4% and an F1 score of 0.93, thereby demonstrating high predictive efficacy. Feature importance analysis revealed that both topological and physicochemical descriptors—most notably FractionCSP3 and AromaticProportion—play pivotal roles in the potential binding to ERα. Subsequently, the model was applied to chemicals commonly encountered in food products, such as indole and various phenolic compounds, indicating that approximately 70% of these substances exhibit activity toward ERα. Moreover, our findings suggest that food processing conditions, including fermentation, thermal treatment, and storage parameters, can significantly influence the formation of these active metabolites. These results underscore the promising potential of integrating predictive modeling into food technology and highlight the need for further experimental validation and model refinement to support innovative strategies for developing healthier and more sustainable food products.

1. Introduction

Modern biological and medical sciences face a formidable challenge: the need for the rapid and precise identification of novel bioactive compounds capable of interacting with key molecular targets, such as protein receptors that act as transcription factors. These receptors play a critical role in regulating gene expression [1,2] and in governing essential biological processes [3,4,5,6], including cellular growth, differentiation, metabolism, and immune response. Dysregulation in these systems often underlies socially significant diseases such as cancer, diabetes, neurodegenerative disorders, and autoimmune conditions.
Traditional approaches for the discovery, identification, and testing of new bioactive compounds require enormous amounts of time and financial resources. Experimentally evaluating thousands—or even millions—of potential substances to determine their activity toward specific receptors is labor-intensive and costly. Thus, a promising direction in this field is the development and application of methodologies based on modern machine learning (ML) technologies, which are opening new horizons in drug discovery and the identification of key metabolite effectors [7].
Estrogen receptor alpha (ERα) is a pivotal nuclear receptor and transcription factor that regulates various physiological processes, including the development of the reproductive system, bone homeostasis, and cardiovascular function [8,9,10]. Moreover, its involvement in hormone-dependent cancers—especially breast cancer—underscores its significant biological importance [11,12,13,14]. Despite extensive research on ERα and its established ligands, the interactions between various metabolites and ERα remain relatively underexplored. Emerging evidence suggests that microbial byproducts can significantly impact human metabolism and health [15,16,17,18,19,20,21], implying that a deeper understanding of these interactions could unveil novel mechanisms underlying hormonal balance and metabolic regulation. Additionally, food-derived metabolites, such as xenoestrogens, may play an important role in ERα activation [22].
In light of these findings, our study is focused on predicting the potential biological activity of various metabolites toward ERα using machine learning [23,24]. Within this work, we developed 27 machine learning models optimized through cross-validation methods, enabling a comprehensive comparison of different algorithms. Our analysis demonstrated that the linear discriminant analysis (LDA) model provided the best performance across key metrics, which justified its selection for further application.
To construct the training dataset, we employed 75 molecular descriptors that encompass a broad range of physicochemical, topological, and electronic properties of the compounds, thereby ensuring a comprehensive characterization of the metabolites under study. A dataset was curated from the ChEMBL database [25], comprising compounds with quantitatively measured activity (IC50 values). The quantitative activity data were transformed into a binary variable (Activity) using a threshold of 1000 nM—a value widely accepted in pharmacological research to distinguish active (IC50 ≤ 1 μM) from inactive compounds [26]. This threshold ensures consistency with established criteria and facilitates the reliable training of predictive models.
Among the various machine learning approaches, LDA was selected for its interpretability and efficiency in class discrimination [27,28]. The LDA model was developed and optimized using the selected dataset, achieving an accuracy of 89.4% and an F1 score of 0.93. Optimization was carried out using GridSearch, a method that exhaustively evaluates all combinations of specified hyperparameters to determine the optimal model configuration. This approach allows for an objective identification of the best settings within a relatively constrained parameter space, making it particularly suitable for such tasks [29]. Supporting literature confirms that LDA is effectively employed in similar contexts, offering clear interpretability while maintaining high predictive power [30,31]. Furthermore, the model coefficients provided valuable insights into feature importance, highlighting descriptors such as FractionCSP3 and AromaticProportion as critical for ERα binding [32,33].
Additionally, this study evaluates selected microbial metabolites, such as indole and various phenolic compounds, which are commonly found in food products. These metabolites were chosen based on their frequent occurrence in food matrices and their reported biological activity [34]. Although the current model is predictive and does not account for the complexity of actual food systems—where the food matrix may influence biological activity—our approach provides a useful preliminary screening tool. It emphasizes the potential for optimizing food production methods by modulating processing conditions (e.g., fermentation, thermal treatment, and storage parameters) to promote the formation or preservation of beneficial metabolite activity.
This study is not merely a demonstration of a new model; it is part of a broader methodology that leverages the potential of genomics and machine learning in preserving health and preventing the development of socially significant diseases through the modulation of food systems and management of human microbiota composition. It lies at the intersection of personalized nutrition and personalized medicine and their impact on public health.
The objective of this work is to elucidate the relationships between the complex compositional data and properties of a vast array of bioactive food molecules and the practical knowledge required to understand various physiological processes in the human body—specifically, to predict the biological activity of food metabolites toward estrogen receptor alpha (ERα). The extensive spectrum of metabolites involved in receptor activation and the transcriptional regulation of physiological processes remains largely unexplored.
Overall, this study not only broadens our understanding of the dynamics between receptors and metabolites but also lays the foundation for integrating predictive modeling into food technology. The results offer promising avenues for future experimental validation and further model development with the ultimate goal of creating healthier and more sustainable food products.
The remainder of this article is structured as follows. Section 2 details the materials and methods used in this work, including the set of molecular descriptors that reflect various physicochemical, topological, and electronic properties of the target molecules, as well as the factors for model construction and optimization. Section 3 describes the metrics for all optimized models and their interpretations. Section 4 presents the results and their implications for the food matrix and microbiome-related processes. Finally, Section 5 provides the conclusions and outlines directions for future research.

2. Materials and Methods

To develop a machine learning model capable of predicting the potential activity of gut microbiota metabolites against estrogen receptor alpha (ERα), a specialized dataset was constructed. This dataset integrated the structural information of molecules and data on their biological activity, which was crucial for training an accurate and informative model. The creation of this dataset involved several sequential steps aimed at ensuring data quality and integrity for subsequent analysis.
Initially, data on the biological activity of compounds interacting with ERα (target identifier: CHEMBL206) were collected from the authoritative ChEMBL database [11] via programmatic access. Queries to the database were configured to retrieve records where the standard activity type was IC50, i.e., the concentration of a substance at which 50% of maximal receptor inhibition is achieved. To ensure the statistical significance of the model and sufficient data volume, the maximum number of records available for analysis was selected (up to 1000).
IC50 was chosen as the activity metric because of its wide recognition and use in pharmacological research. IC50 enables quantitative comparisons of the efficacy of various inhibitors and the assessment of their potential therapeutic value [15]. This standardized parameter facilitates data comparability across different studies and simplifies the interpretation of results.
After collecting the biological activity data, preliminary data processing was carried out. At this stage, all records without an activity value (standard_value) were excluded from the dataset to avoid possible distortions in the results and to ensure data integrity. Furthermore, to simplify the dataset structure and focus on key variables, only the molecule identifiers (molecule_chembl_id) and their corresponding activity values were retained.
A binary variable, Activity, was introduced to transform the quantitative activity values into categorical labels. Compounds with IC50 ≤ 1000 nM were labeled as active (Activity = 1), whereas those with IC50 > 1000 nM were labeled as inactive (Activity = 0). The 1000 nM threshold was chosen based on widely accepted pharmacological criteria, according to which compounds with IC50 ≤ 1 µM are considered sufficiently active to be potential drug candidates [15]. This threshold provides a balance between the model’s sensitivity and specificity, allowing an effective distinction between active and inactive compounds.
The next important step involved retrieving the molecular structures for each unique molecule identifier. Using the ChEMBL database API, the structure of each molecule was obtained in the SMILES (Simplified Molecular Input Line Entry System) format [16]. SMILES provides a text-based representation of a molecule’s structure and is widely used for data storage and exchange in computational chemistry and bioinformatics. When a SMILES string was missing for a particular molecule, that record was excluded from further analysis. This ensured that all molecules in the dataset had complete structural descriptions necessary for calculating molecular descriptors.
By combining the biological data with the retrieved structural information, a complete dataset for analysis was formed. The integration was performed based on the molecule identifier (molecule_chembl_id), ensuring the correct correspondence between each molecule’s activity and structure. Records without structural information and duplicates were removed, leaving only the key variables—SMILES and Activity—in the final dataset. This approach improved the data quality, reduced the risk of errors in training and prediction, and ensured the statistical independence of the observations.
The resulting dataset was ready for use, containing text-based representations of compound structures (SMILES) and corresponding binary activity labels (Activity). This dataset served as the foundation for computing molecular descriptors, which were subsequently used as input features to train the machine learning model.
For reproducibility and convenience in further analyses, the compiled dataset was saved in CSV format. This enables other researchers to replicate the results, conduct additional analyses, or use the data for model validation. Storing data in a standardized format also simplifies integration with various data analysis tools and platforms.
The data collection and preparation process provided a reliable and high-quality foundation for training a machine learning model that can predict the activity of new metabolites with respect to ERα based on their structural characteristics. The use of authoritative data sources such as ChEMBL [11], combined with standardized preprocessing steps, ensured the model’s high quality and credibility. Transforming quantitative activity values into binary labels based on a well-founded threshold aligned with practical pharmacological standards [15] and gave the classification task a clear definition. Focusing on structural information and guaranteeing the reproducibility of the study enables other researchers to repeat the experiment and verify the results obtained, thereby advancing the field and supporting the model’s implementation in practical applications.
To quantitatively describe the molecular structures of metabolites and facilitate subsequent analysis, an extensive set of molecular descriptors was employed, reflecting various physicochemical, topological, and electronic properties of the molecules. The RDKit library was used to convert the metabolites’ SMILES strings into molecular objects and compute the corresponding descriptors [17]. This tool is widely used in computational chemistry and offers extensive functionality for analyzing molecular structures.
The calculated molecular descriptors were divided into several categories, each providing unique information about the molecules’ properties [25]. This approach ensures a comprehensive molecular characterization, which is critically important for building an accurate and robust machine learning model. These categories include physicochemical properties, structural properties, surface and volume characteristics, topological indices, and counts of specific atoms and functional groups.
1.
Physicochemical Properties
This category includes descriptors characterizing the basic physicochemical parameters that affect the behavior of molecules in biological systems:
  • MolWt (molecular weight): the total mass of the molecule, influencing pharmacokinetic parameters such as distribution and excretion;
  • ExactMolWt (exact molecular weight): a more precise mass value taking into account the isotopic composition of atoms, important for mass spectrometric analysis;
  • MolLogP: the logarithm of the octanol/water partition coefficient, reflecting the lipophilicity of the molecule and its ability to penetrate biological membranes;
  • MolMR (molar refractivity): a parameter related to the polarizability and volume of the molecule, influencing interactions with electromagnetic radiation;
  • TPSA (topological polar surface area): the total area of polar atoms and functional groups, correlating with cell membrane permeability and bioavailability.
2.
Structural Properties
These descriptors characterize structural features of the molecules:
  • HeavyAtomCount: the number of atoms excluding hydrogen, reflecting the molecule’s size and complexity;
  • NumValenceElectrons: the total number of valence electrons across all atoms, influencing the chemical reactivity of the molecule;
  • NumHAcceptors: the number of atoms (commonly oxygen and nitrogen) capable of accepting hydrogen bonds;
  • NumHDonors: the number of groups (usually –OH and –NH) capable of donating hydrogen bonds;
  • NumRotatableBonds: the number of single bonds not in rings, defining the molecule’s flexibility;
  • RingCount: the total number of cyclic structures in the molecule, influencing its rigidity and spatial configuration;
  • FractionCSP3: the proportion of sp3-hybridized carbon atoms, indicating the degree of saturation and three-dimensional character of the molecule;
  • AromaticProportion: the ratio of aromatic atoms to the total number of atoms, important for π–π interactions.
3.
Surface and Volume Properties
These descriptors evaluate the molecular surface and volume:
  • LabuteASA (Labute’s approximate surface area): an estimate of the molecule’s surface area accessible for solvent interaction, affecting solubility;
  • PEOE_VSA1–PEOE_VSA10: descriptors of surface area weighted by partial atomic charges, reflecting the distribution of electron density on the molecular surface;
  • SlogP_VSA1–SlogP_VSA10: descriptors weighted by the log of the partition coefficient (LogP), characterizing the molecule’s lipophilic and hydrophilic regions;
  • SMR_VSA1–SMR_VSA10: descriptors weighted by molar refractivity, reflecting the molecule’s volumetric and polarizable regions;
  • EState_VSA1–EState_VSA10: descriptors weighted by electron-topological states of atoms, accounting for electronic effects and molecular topology.
4.
Topological Indices
Topological indices characterize the molecular structure in terms of shape, size, and complexity:
  • Chi0 and Chi1: connectivity indices of the 0th and 1st orders, indicating the degree of branching;
  • Chi0n–Chi4n: normalized connectivity indices that account for variations in atomic properties and connectivity at different levels;
  • Chi0v–Chi4v: connectivity indices weighted by the valence of atoms, reflecting the molecule’s electronic structure;
  • Kappa1, Kappa2, and Kappa3 (Kier shape indices): parameters describing the shape and flexibility of a molecule based on its graph structure;
  • BalabanJ (Balaban index): a topological index incorporating information on both cyclicity and branching [26];
  • BertzCT (Bertz complexity index): a quantitative measure of molecular structural complexity;
  • Ipc (information content index): an information-based metric derived from molecular symmetry and bond diversity;
  • HallKierAlpha: a parameter related to the correction of atomic properties affecting hydrophobicity and molecular flexibility.
5.
Counts of Specific Atoms and Groups
This category includes descriptors that account for the presence of certain atoms and functional groups:
  • NHOHCount: the total number of hydroxyl (–OH) and amino (–NH) groups, influencing the molecule’s hydrophilicity and reactivity;
  • NOCount: the total number of nitrogen and oxygen atoms, reflecting the potential for hydrogen bonding.
6.
Target Variable
  • Activity: A binary variable indicating the known biological activity of a compound with respect to estrogen receptor alpha (ERα). It serves as the target variable for training the machine learning model.
The chosen set of descriptors provides a comprehensive description of metabolite molecules from multiple perspectives—physicochemical, structural, electronic, and geometric [25]. Physicochemical descriptors, such as MolWt and MolLogP, help elucidate how molecules behave in biological systems, including absorption and distribution processes. Topological indices and connectivity indices (Chi, Kappa, and BalabanJ) enable the assessment of structural features that may influence receptor interactions.
Surface descriptors (PEOE_VSA, SlogP_VSA, SMR_VSA, and EState_VSA) account for the distribution of molecular properties across the surface, which is crucial for understanding binding mechanisms at the molecular level. Counting specific atoms and groups (NumHAcceptors, NumHDonors, NHOHCount, and NOCount) provides information on the potential for forming hydrogen bonds and other targeted interactions.
Using such a diverse set of descriptors allows the machine learning model to more accurately predict the potential activity of metabolites with respect to ERα. This is achieved by capturing complex relationships between a molecule’s structure and its biological function, thereby improving both the accuracy and the reliability of the model when forecasting the activity of new compounds [25].
To develop a machine learning model capable of predicting the activity of metabolites with respect to estrogen receptor alpha (ERα), a final dataset was compiled containing both calculated molecular descriptors and the activity labels of the compounds. The data were separated into the following components:
  • Features (X): a set of molecular descriptors computed for each compound;
  • Labels (y): a binary variable (Activity) indicating whether a compound is active (1) or inactive (0).
Separating features and labels is a standard procedure in machine learning, enabling algorithms to learn from input data (features) to predict target values (labels) [27].
To evaluate the model’s ability to generalize to previously unseen data, the dataset was divided into training and test sets in an 80:20 ratio:
  • Training set (X_train, y_train): used for training and simultaneously optimizing all models;
  • Test set (X_test, y_test): used for the final assessment of the already-optimized models on “unseen” data.
This split enables an objective evaluation of algorithm performance and helps prevent overfitting, providing a more accurate assessment of the model’s ability to predict the activity of new compounds [28].
In developing an effective predictive system, a wide range of machine learning algorithms was considered, including models designed to handle class imbalance. Class imbalance arises when the number of active and inactive compounds differs substantially, causing the model to potentially become biased toward the majority class [32].
The list of models evaluated included the following:
  • Random forests: RandomForestClassifier (with and without class weighting), BalancedRandomForestClassifier;
  • Ensemble methods: AdaBoostClassifier, GradientBoostingClassifier, BaggingClassifier, EasyEnsembleClassifier;
  • Linear models: LogisticRegression (with and without class weighting), RidgeClassifier;
  • Support vector methods: SVC, LinearSVC;
  • Decision trees: DecisionTreeClassifier (with and without class weighting), ExtraTreeClassifier;
  • Nearest neighbors: KNeighborsClassifier;
  • Naive Bayes classifiers: GaussianNB, BernoulliNB;
  • Discriminant analysis: LinearDiscriminantAnalysis, QuadraticDiscriminantAnalysis;
  • Neural networks: MLPClassifier;
  • Other models: SGDClassifier, GaussianProcessClassifier, VotingClassifier, CalibratedClassifierCV;
  • Boosting methods: XGBoostClassifier, CatBoostClassifier (with and without class weighting).
Including such a diverse set of algorithms provides insight into which models perform best on the given classification task [33], with special attention paid to those that address the unequal ratio of active to inactive compounds [32].
All the listed algorithms were trained and optimized within a single process comprising the following main steps:
  • Hyperparameter Tuning
For each algorithm, a set of relevant parameters was specified (e.g., the number of trees for RandomForestClassifier, regularization coefficients for LogisticRegression, or LinearDiscriminantAnalysis, etc.);
2.
k-Fold Cross-Validation
Cross-validation (commonly 5- or 10-fold) was conducted on the training set (X_train, y_train), providing performance estimates for each hyperparameter combination;
3.
Search Methods
Depending on the specific model, GridSearchCV (exhaustive hyperparameter search) or RandomizedSearchCV (random search within specified ranges) was employed [31];
4.
Class Balance Adjustment
For algorithms supporting the class_weight parameter, suitable settings (e.g., ‘balanced’) were chosen to improve sensitivity to the minority class;
5.
Selecting Optimal Configurations
For each model, the hyperparameters yielding the best metric—Accuracy in this study—were identified via cross-validation.
After hyperparameter tuning, each model with its optimal configuration was retrained on the full training set (X_train, y_train). The performance of these retrained models was then evaluated on the test set (X_test, y_test), where the final metrics (e.g., Accuracy, Precision, Recall, and F1 Score) were calculated.

3. Results

Table 1 presents the final metrics for all the optimized models in predicting activity on the test set. Alongside Accuracy, metrics such as Precision, Recall, F1 Score, MCC, Cohen’s Kappa, Hamming Loss, and ROC AUC were also included, offering a comprehensive assessment of each algorithm’s strengths and weaknesses.
Metric Interpretation:
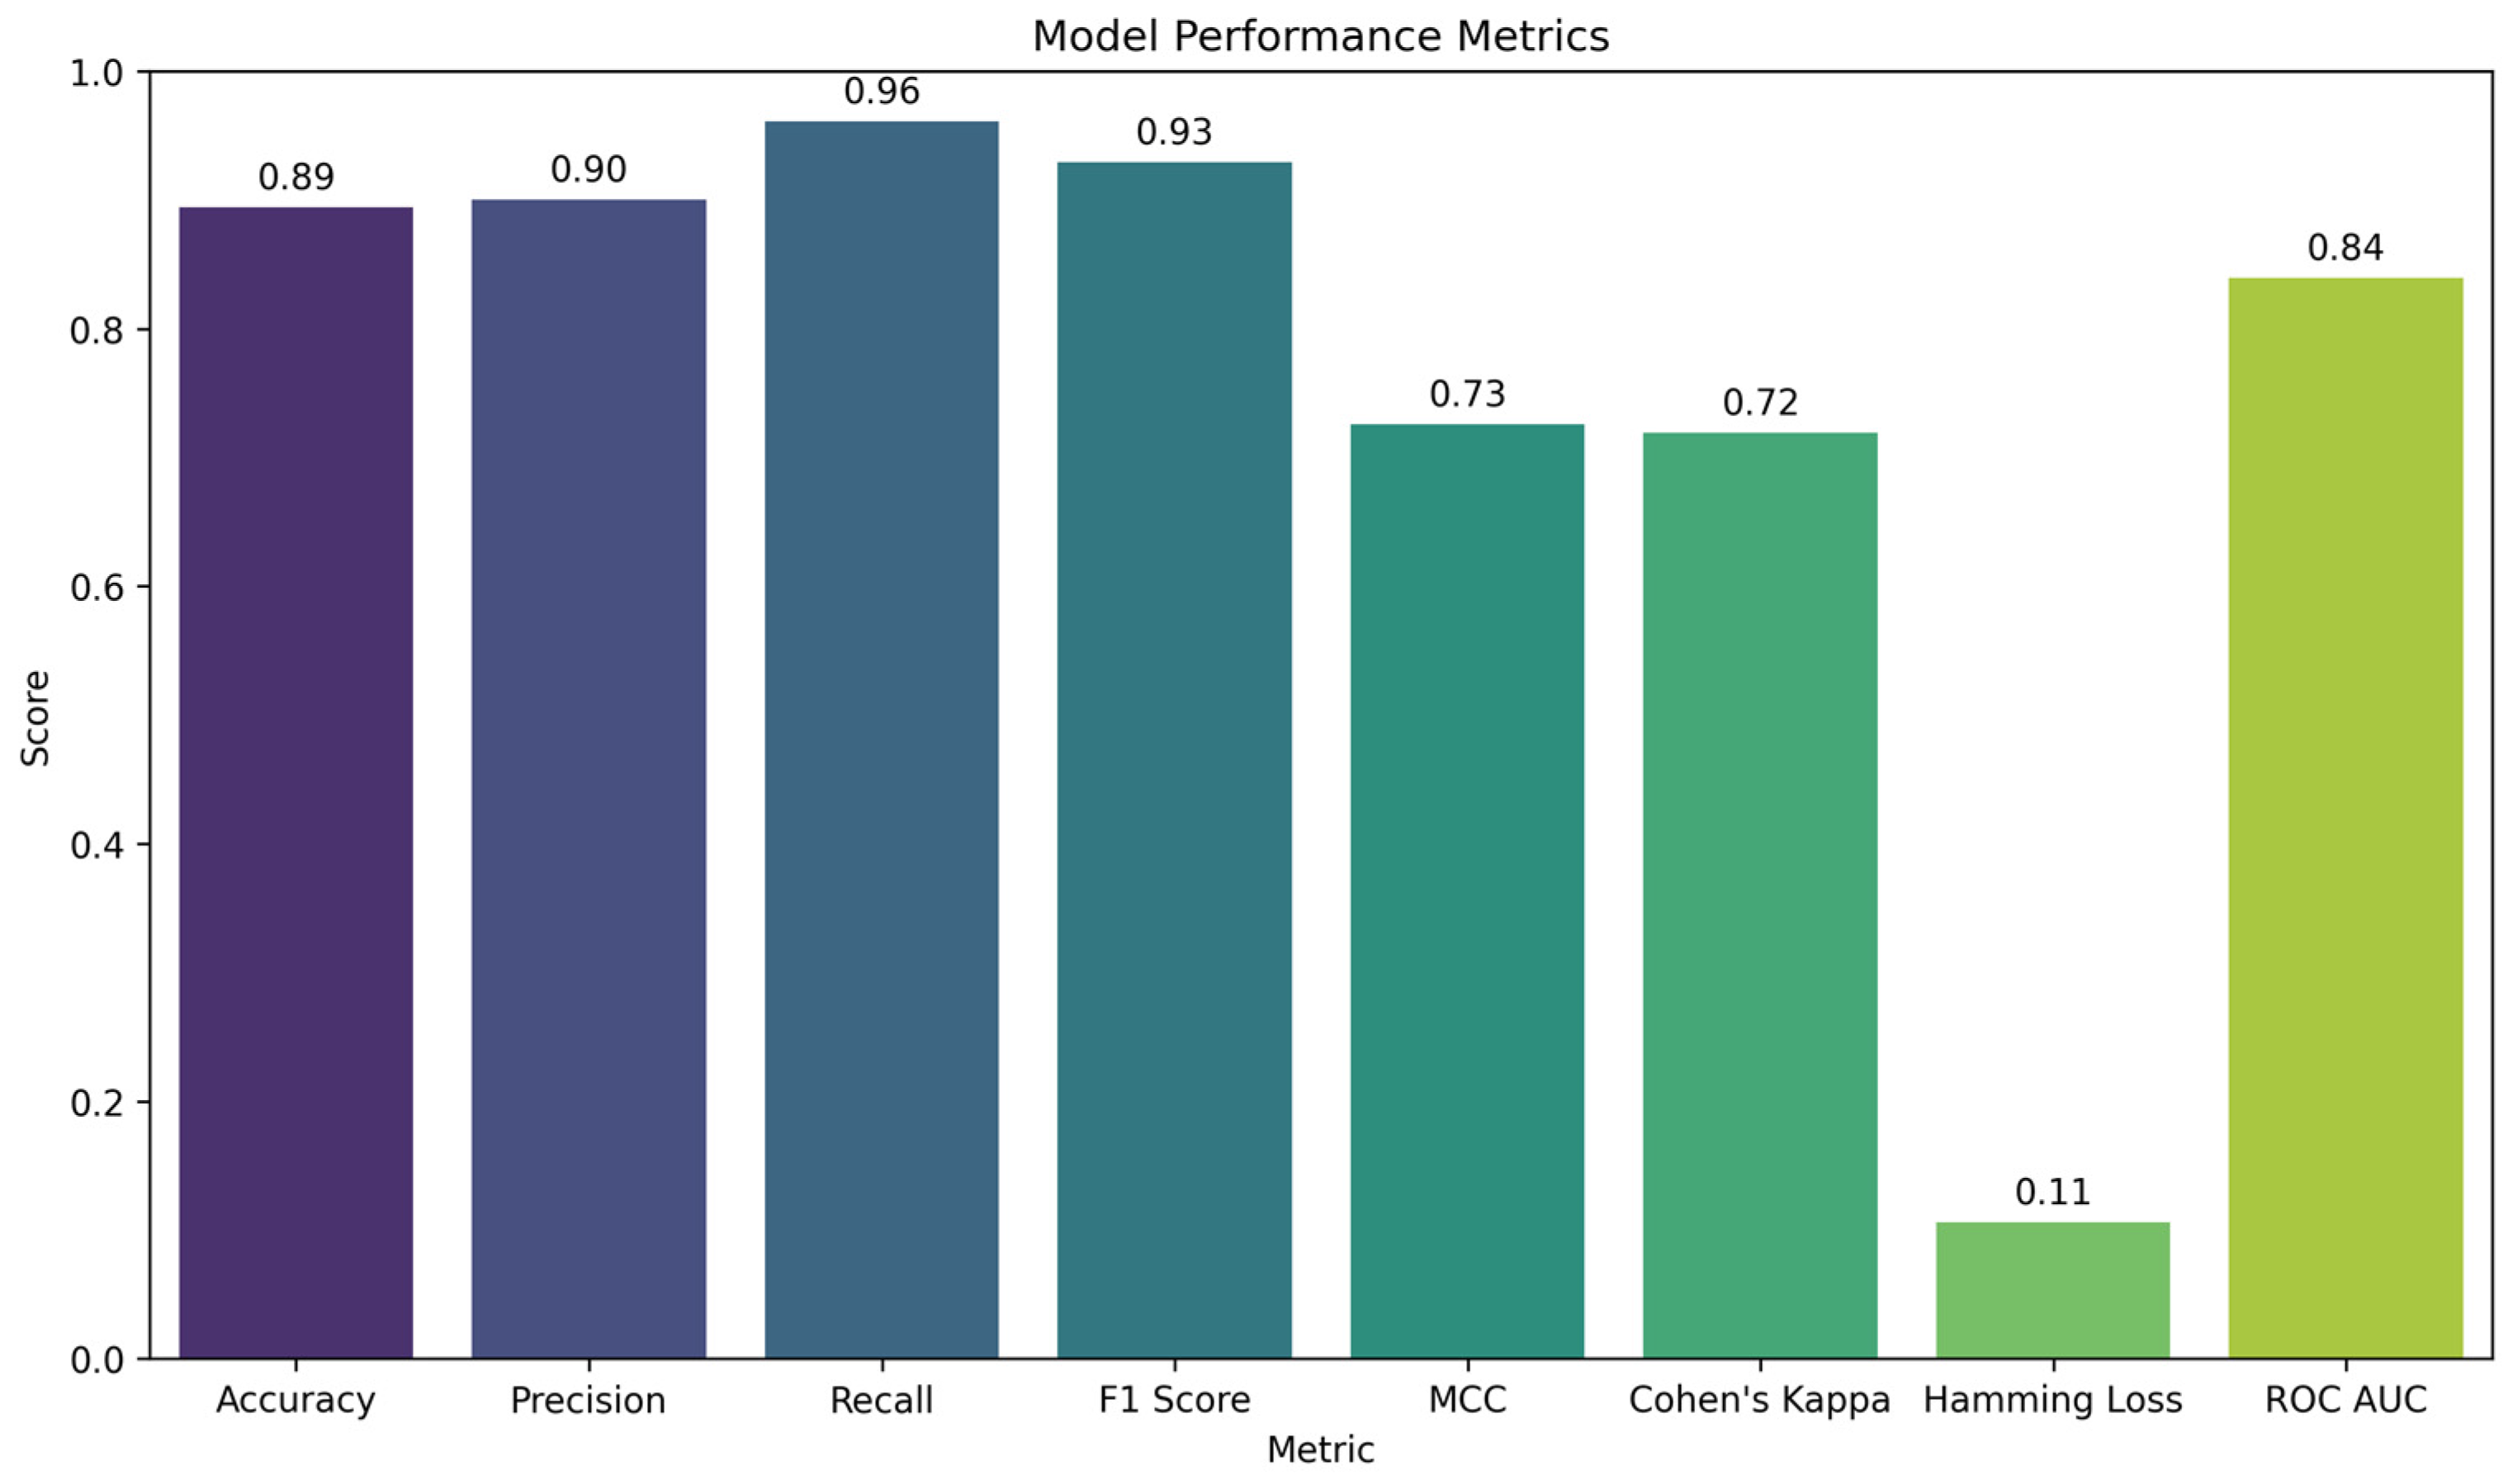
  • Accuracy: The proportion of correct predictions among all predictions. A value of 89.44% indicates high overall model accuracy;
  • Precision: The proportion of true positives among all predicted positives. A high value (90.00%) signifies a low rate of false positives;
  • Recall: The proportion of true positives among all actual positive instances. A value of 96.12% indicates that the model effectively detects active compounds;
  • F1 score: The harmonic mean of Precision and Recall. A value of 92.96% reflects a good balance between them;
  • MCC (Matthews correlation coefficient): The correlation between observed and predicted classes, accounting for true/false positives and negatives. A value of 0.73 points to a strong positive correlation;
  • Cohen’s kappa: A measure of agreement between the model’s predictions and the actual labels, adjusted for chance. A value of 0.72 indicates good agreement;
  • Hamming loss: The proportion of incorrect labels relative to the total number of labels. A low value of 0.11 indicates few classification errors;
  • ROC AUC score: The area under the receiver operating characteristic curve, shows the model’s ability to discriminate between classes. A value of 83.96% demonstrates a good discriminatory capacity.
Results Analysis:
  • LinearDiscriminantAnalysis (LDA) achieved the highest accuracy (≈0.8944). It also demonstrated high Recall (≈0.9612) and balanced Precision (≈0.9000), leading to an F1 Score of ≈0.9296. LDA further exhibited comparatively high MCC (≈0.7255) and Cohen’s Kappa (≈0.7192);
  • RidgeClassifier (Accuracy ≈ 0.8873) slightly lags behind LDA but also provides a high Recall (≈0.9515);
  • LogisticRegression offers a high Recall (≈0.9903), though its overall Accuracy (≈0.8662) is lower than that of the top models;
  • Ensemble methods (Bagging, BalancedRandomForest, GradientBoosting, etc.) generally yield Accuracy values in the 0.80–0.85 range, illustrating the benefits of combining multiple base models;
  • Models with adjusted class weights (BalancedRandomForest, CatBoost with class weighting) indeed handle the minority class more effectively, as demonstrated by their Precision/Recall values [32];
  • Certain algorithms (SGDClassifier, SVC, LinearSVC, MLPClassifier, etc.) converged on a “hard” boundary (Recall = 1.0 and Precision ≈ 0.725), indicating peculiarities in how they optimize given this dataset;
  • GaussianProcessClassifier (Accuracy ≈ 0.3732) displayed the lowest results, likely due to the specific characteristics of this algorithm and the complexity of the data structure.
Comparing all the optimized algorithms by Accuracy (and additional metrics, including Precision, Recall, and F1 Score) reveals that LinearDiscriminantAnalysis delivers the best performance. The primary arguments in favor of choosing LDA include the following:
  • High Accuracy (≈0.8944)—the top result among all the models tested;
  • Balanced Metrics (Precision ≈ 0.900, Recall ≈ 0.961)—LDA effectively predicts both active and inactive compounds;
  • High MCC (0.7255) and Cohen’s kappa (0.7192)—indicate strong agreement between predictions and actual labels, along with a low probability of random alignment.
These findings are visually summarized in Figure 1, which illustrates the performance metrics across all evaluated models.
Thus, Linear Discriminant Analysis (LDA) was identified as the most effective algorithm for predicting the activity of gut microbiota metabolites with respect to estrogen receptor alpha. Our conclusions regarding model construction and optimization are as follows:
  • By simultaneously tuning hyperparameters across all the models using cross-validation, we ensured an objective and comprehensive comparison of various machine learning algorithms;
  • LDA achieved the highest accuracy and exhibited balanced performance across additional metrics, confirming its suitability for this application;
  • Models incorporating class weighting demonstrated enhanced sensitivity to the minority class—a critical consideration when dealing with small but biologically significant groups of compounds [32];
  • The optimized LDA model is not only effective for screening novel metabolites but also holds promise as a tool for the early stages of drug development, where rapid and reliable evaluation of compound activity is essential.
Supporting literature has consistently highlighted the efficacy of LDA in similar predictive tasks, underscoring its robustness and interpretability [30,31].
After optimizing the linear discriminant analysis (LDA) model and evaluating its performance, a feature importance analysis was conducted to identify which molecular descriptors most significantly influence the prediction of a compound’s activity with respect to estrogen receptor alpha (ERα).
LDA model coefficients reflect each feature’s contribution to the linear discriminant function used to distinguish between classes. To evaluate feature importance, the absolute values of these coefficients were used, given that the sign indicates the direction of influence, whereas the magnitude indicates its extent [30].
These results are visually summarized in Figure 2.
Table 2 presents ten molecular descriptors with the largest absolute coefficients in the LDA model:
Interpretation of Significant Features:
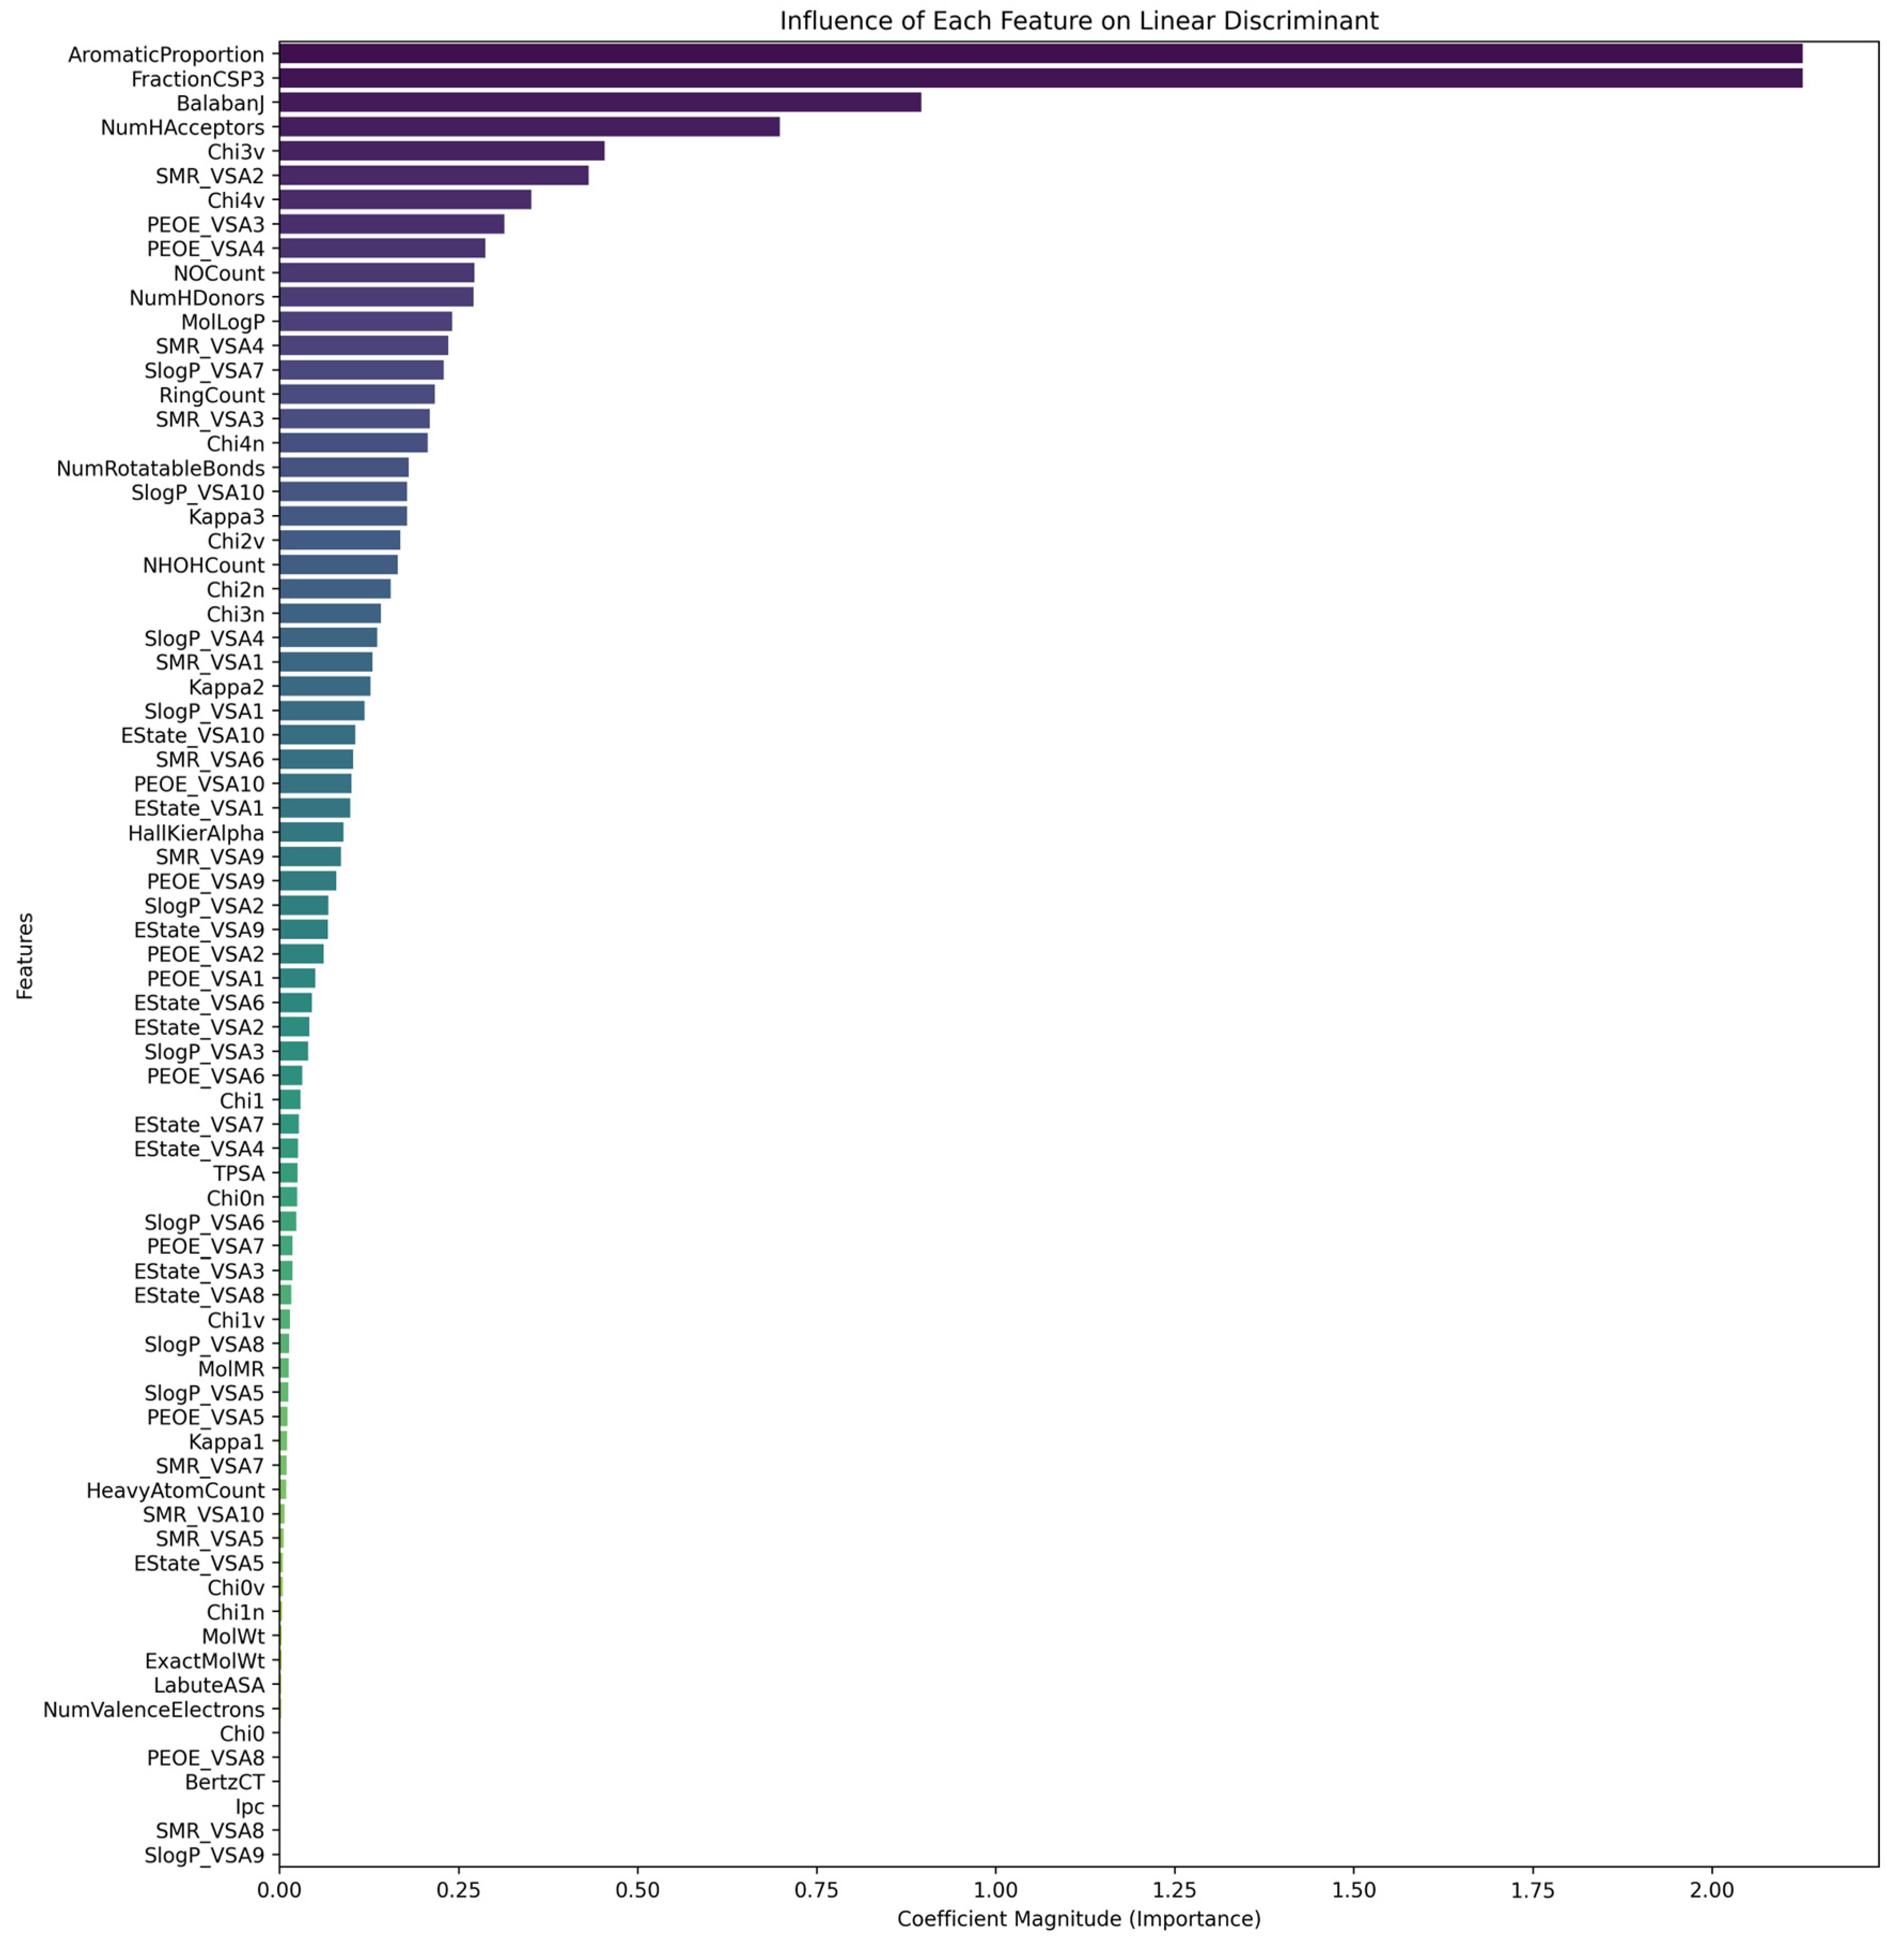
  • FractionCSP3 (Proportion of sp3-Hybridized Carbon Atoms)
Quantifies the fraction of sp3-hybridized carbon atoms relative to the total number of carbon atoms [35]. The high importance of this descriptor suggests that molecules with a larger proportion of sp3-hybridized carbons may exhibit greater ERα activity. This could be related to the impact of saturation on conformational flexibility and the three-dimensional molecular structure, which in turn affects receptor binding [36].
2.
AromaticProportion (Proportion of Aromatic Atoms)
Represents the ratio of aromatic atoms to the total number of atoms in a molecule. Its importance highlights the role of aromatic systems in interacting with ERα. Aromatic rings are known to participate in π–π and hydrophobic interactions with receptor binding sites, contributing to the stability of the ligand–receptor complex [37].
3.
BalabanJ (Balaban Index)
A topological index that integrates information about molecular cyclicity and branching [26]. High BalabanJ values indicate a more complex molecular topology, which can facilitate specific receptor interactions through unique spatial configurations.
4.
NumHAcceptors (Number of Hydrogen Bond Acceptors)
The number of atoms (commonly oxygen and nitrogen) capable of accepting hydrogen bonds. The capacity to form hydrogen bonds with the amino acid residues of ERα can be critical for receptor binding and activation [38].
5.
Chi3v and Chi4v (Valence-Weighted Connectivity Indices)
These indices reflect the complexity of the molecular structure while accounting for the valence of atoms and their connectivity at higher orders [39]. Their significance suggests that structural features—such as branching and cyclicity at the tertiary and quaternary levels—affect biological activity against ERα.
6.
SMR_VSA2 (Surface Area Descriptor Weighted by Molar Refractivity)
Characterizes the surface area of the molecule associated with a specific range of molar refractivity values [40]. This descriptor indicates that polarizability and volumetric properties play a role in the molecule’s interaction with the receptor.
7.
PEOE_VSA3 and PEOE_VSA4 (Surface Area Descriptors Weighted by Partial Charges)
Represent the distribution of molecular surface area according to partial atomic charges calculated using the Partial Equalization of Orbital Electronegativities (PEOE) method [41]. The importance of these descriptors implies that electrostatic interactions significantly contribute to ligand binding with ERα.
8.
NOCount (Total Number of Nitrogen and Oxygen Atoms)
The number of nitrogen and oxygen atoms in the molecule. These atoms can form hydrogen bonds and affect molecular polarity—factors that are crucial for interacting with hydrophilic receptor regions [39].
The feature importance analysis in the LDA model revealed that both topological and physicochemical descriptors substantially influence the prediction of a compound’s ERα activity. Key conclusions include the following:
  • Degree of saturation and aromaticity: the descriptors FractionCSP3 and AromaticProportion indicate that both saturated and aromatic structures are important for ERα interactions;
  • Topological complexity: the indices BalabanJ, Chi3v, and Chi4v underscore the importance of molecular complexity and unique structural configurations in receptor binding;
  • Hydrogen-bonding capacity: NumHAcceptors and NOCount emphasize the role of hydrogen bonding in stabilizing the ligand–receptor complex;
  • Electronic and surface properties: the PEOE_VSA and SMR_VSA descriptors highlight the effects of electron density distribution and surface polarizability on molecular interactions with ERα.
Identifying which molecular descriptors most significantly influence compound activity allows for the following:
  • Guidance in synthesizing new compounds—by focusing on structural features that enhance the likelihood of ERα binding, one can optimize the design of new ligands;
  • Improvement of predictive models—considering influential features during model training and potentially removing less informative descriptors can enhance predictive performance;
  • Advancement of mechanistic understanding—gaining deeper insight into the structural elements that promote biological activity supports the rational design of more effective therapeutic agents.
By identifying the key molecular descriptors that govern ERα activity, the LDA feature importance analysis underscores the need for a comprehensive approach—incorporating both topological and physicochemical properties—to successfully predict biological activity. Future studies can focus on a more detailed examination of these descriptors and on experimental validation of the predicted active compounds. Such efforts would not only improve predictive models but also contribute to the development of novel therapeutic agents targeting ERα.
To evaluate the ability of the developed machine learning model to predict the activity of new compounds with respect to ERα, specific gut microbiota metabolites were selected. These metabolites are of interest in the field of food technology and are present in various food products. The selection criteria included the following:
  • Presence in Food Products:
Metabolites are widely distributed in food or are produced during food processing and storage. Their presence can affect the quality, safety, and functional properties of food [8];
2.
Influence on Organoleptic Properties:
Many of these compounds are responsible for the taste, aroma, and texture of products—crucial for consumer perception and market competitiveness [9];
3.
Potential Biological Activity:
These metabolites can affect physiological processes upon consumption, which is important for developing functional foods and evaluating possible health risks [11].
For each selected metabolite, molecular descriptors analogous to those used during model training were calculated. The optimized LinearDiscriminantAnalysis model then predicted whether the metabolite is potentially active with respect to Erα. The predicted activities for the selected metabolites are summarized in Table 3. For additional details on the selected metabolites and their corresponding SMILES representations, please refer to Appendix A. The complete list is provided in Table A1.
These results demonstrate the potential applicability of the optimized LDA model for identifying compounds that may exhibit biological activity toward ERα. The predictions could serve as a foundation for further experimental validation and the design of novel compounds with desired properties.

4. Discussion

Predicting the activity of gut microbiota metabolites toward estrogen receptor alpha (ERα) is critical for food technology because ERα plays a key role in modulating metabolic and hormonal pathways that can influence both the nutritional quality and safety of food products. By understanding which active metabolites are present and controlling their formation during processes such as fermentation, thermal treatment, and storage, food technologists can optimize flavor profiles, enhance functional properties, and mitigate potential adverse health effects. This integrative approach not only supports the development of functional foods but also contributes to consumer safety by ensuring that food products meet high-quality standards [42].
Presence of Active Metabolites in Food Products:
  • Indole Compounds
  • Indole and skatole (3-methylindole)
These compounds frequently occur in fermented products such as soy sauce, kimchi, and certain cheeses. They are also present in meat products, particularly those that have undergone prolonged storage or inadequate processing [43]. Indole and skatole contribute to the aroma and flavor of foods, imparting distinctive notes. Their activity toward ERα may be significant for the development of functional foods that support hormonal balance [44];
  • Indole-3-acetic acid (IAA)
IAA is a plant hormone that may be found in fresh vegetables and fruits. During fermentation, gut microbiota can convert the amino acid tryptophan into IAA [45]. IAA can affect plant product ripening and storage processes, as well as microbiological processes during fermentation.
2.
Phenolic Compounds
  • 4-Cresol, o-cresol, 3-methylphenol (m-cresol), and phenol
These phenolic compounds are present in smoked foods, tea, coffee, and certain spices. They may form during thermal processing, such as smoking or roasting. Phenols contribute to food flavor and aroma while also exhibiting antioxidant properties. Their activity toward ERα makes them potentially important components of functional food products [46].
3.
Urolithins
  • Urolithin A and urolithin B
These are formed in the human gut from ellagitannins found in pomegranates, nuts, berries, and some other fruits. Although urolithins themselves are not directly found in foods, their precursors are widespread [47]. Urolithins possess antioxidant and anti-inflammatory properties, and their formation depends on gut microbiota composition, emphasizing the need to consume ellagitannin-rich foods [48].
4.
Trimethylamine (TMA) and Trimethylamine N-oxide (TMAO)
  • TMA and TMAO are found in seafood, especially fish and shellfish. TMAO acts as a natural osmolyte in marine organisms. TMA is responsible for the characteristic fishy odor, which is intensified in spoiled products due to the breakdown of TMAO into TMA. Their activity toward ERα may be relevant for food technologies involving seafood [49].
Controlling the formation of active metabolites is a key aspect of the food industry. First, processing methods and storage conditions play a major role in regulating the concentration of these compounds. Adjusting thermal processing parameters—such as temperature, duration, and humidity—allows for controlling the formation of phenolic and indole metabolites during smoking, frying, and other processes [50]. Moreover, some metabolites form under anaerobic conditions; thus, managing oxygen availability during fermentation and storage can influence their concentrations [51]. The formation of trimethylamine (TMA) is primarily driven by microbial activity, particularly the enzymatic reduction of trimethylamine N-oxide (TMAO) by spoilage bacteria. To control TMA formation, it is essential to limit the growth of these bacteria. This can be achieved by using antimicrobial agents and applying pasteurization or sterilization techniques, which significantly reduce the microbial load. Additionally, maintaining optimal storage conditions—such as low temperatures and controlled pH levels—can further inhibit the enzymatic conversion of TMAO to TMA, thereby enhancing food safety and quality [52].
Second, the use of starter cultures and probiotics is an effective method for influencing microbiota and metabolic processes. Employing specific starter cultures can promote the formation of desirable active metabolites (e.g., urolithins) while reducing unwanted compounds [53]. Introducing probiotics into products can modulate consumers’ gut microbiota, fostering the generation of beneficial metabolites from dietary precursors [54].
Third, fortifying foods with precursors that promote the formation of beneficial metabolites represents another viable strategy. For instance, incorporating ingredients rich in polyphenols and ellagitannins—key precursors for the formation of urolithins (notably urolithin A)—can enhance their subsequent production in the human body, thereby increasing the functional value of food [55]. Additionally, including dietary fiber, which serves as a substrate for gut microbiota, may further modulate the metabolic pathways leading to the synthesis of these active compounds [56].
Finally, controlling pH and redox potential (Eh) can significantly influence microbial processes. Many microbial activities depend on acidity; thus, regulating pH can affect the enzymes and microorganisms responsible for metabolite formation. Managing redox potential during processing and storage can either promote or inhibit the production of specific metabolites [57].
Practical Recommendations for the Food Industry:
  • Development of technical guidelines that account for processing parameters influencing the formation of active metabolites;
  • Use of predictive models, incorporating data on predicted metabolite activity in food quality and safety control systems;
  • Professional training of food technologists and quality specialists in microbiological process management and the impact of metabolites on food products.

5. Conclusions

This study demonstrates the potential of machine learning approaches for predicting the biological activity of food metabolites and gut microbiota-derived metabolites with respect to estrogen receptor alpha (ERα). By employing an optimized linear discriminant analysis (LDA) model based on a curated dataset of molecular descriptors, we achieved a predictive accuracy of 89.44%. This high level of performance confirms the viability of our computational approach for screening compounds that may interact with ERα.
A key finding of our research is the identification of critical molecular descriptors, such as FractionCSP3 and AromaticProportion, which significantly influence the interaction between metabolites and ERα. These results not only validate the application of LDA in this context but also provide valuable insights into the molecular features underlying receptor binding. The clarity provided by feature importance analysis further enhances the interpretability of the model, offering a robust foundation for subsequent experimental investigations.
From a practical perspective, the successful prediction of active metabolites—such as indole, skatole, and various phenolic compounds—has important implications for food technology and healthy nutrition. It is well established that these compounds influence the organoleptic properties and overall quality of food products. By understanding and controlling the formation of these active metabolites through the adjustment of processing parameters (e.g., fermentation, thermal treatment, and storage conditions), food technologists can devise strategies to improve taste, aroma, and nutritional value while ensuring product safety.
This study also highlights the inherent limitations of predictive modeling when applied to complex food systems. Although the model provides a reliable screening tool, it does not account for the multifaceted interactions within the food matrix that may alter metabolite activity. Therefore, our results should be interpreted as a preliminary step, emphasizing the need for further experimental validation and in-depth investigation into how real processing conditions affect metabolite behavior.
Looking forward, future research should focus on expanding the dataset with new experimental data and exploring additional machine learning methods to enhance predictive efficiency. Integrating the predictive model into quality monitoring and control systems could further support its practical application in food production. Such efforts will not only refine the model but also contribute to the development of innovative strategies for creating healthier and more sustainable food products.
In conclusion, our study confirms that machine learning—specifically LDA—is a valuable tool for predicting the biological activity of gut microbiota-derived metabolites in relation to ERα. By combining computational predictions with practical applications in food technology, we open new avenues for enhancing food quality and consumer health. This work lays the groundwork for future studies that will further integrate predictive modeling with experimental validation, ultimately advancing sustainable and innovative food production methods.

Author Contributions

Conceptualization, M.K. (Maksim Kuznetsov) and I.N.; methodology, M.K. (Maksim Kuznetsov); software, M.K. (Mikhail Kutuzov); validation, M.K. (Maksim Kuznetsov), O.C. and D.V.; formal analysis, M.K. (Mikhail Kutuzov), O.N. and D.V.; investigation, A.S. and D.M.; resources, D.V.; data curation, D.M.; writing—original draft preparation, M.K. (Maksim Kuznetsov) and M.K. (Mikhail Kutuzov); writing—review and editing, D.V., O.N., A.S. and D.M.; visualization, O.C. and A.S.; supervision, M.K. (Maksim Kuznetsov) and I.N.; project administration, I.N.; and funding acquisition, I.N. All authors have read and agreed to the published version of the manuscript.

Funding

This study was funded by a subsidy for the implementation of a state assignment from the Ministry of Science and Higher Education of the Russian Federation within the framework of research project No. FSSW-2025-0004.

Data Availability Statement

The dataset analyzed in this study is publicly available at https://github.com/4kumax/lda_model_era (accessed on 30 March 2025).

Conflicts of Interest

Author Mikhail Kutuzov was employed by the company Apq Control LLC. The remaining authors declare that the research was conducted in the absence of any commercial or financial relationships that could be construed as a potential conflict of interest.

Abbreviations

The following abbreviations are used in this manuscript:
LDALinear discriminant analysis
SVCSupport vector classification
ERαEstrogen receptor alpha
TMATrimethylamine
TMAOTrimethylamine N-oxide

Appendix A

Table A1. List of Selected Metabolites and Their SMILES.
No.MetabolitesSmiles
1IndoleC1=CC=C2C(=C1)C=CN2
2Skatole (3-methylindole)CC1=CNC2=CC=CC=C12
3Trimethylamine (TMA)CN(C)C
4Indole-3-acetic acid (IAA)C1=CC=C2C(=C1)C(=CN2)CC(=O)O
5Indole-3-lactateC1=CC=C2C(=C1)C(=CN2)C(CO)C(=O)O
6p-Cresol (4-cresol)CC1=CC=C(C=C1)O
7p-Cresol sulfateCC1=CC=C(C=C1)OS(=O)(=O)O
8Phenylacetic acidC1=CC=C(C=C1)CC(=O)O
9Phenyllactic acidC1=CC=C(C=C1)C(CO)C(=O)O
10o-CresolCC1=CC=CC=C1O
113-Methylphenol (m-cresol)CC1=CC(=CC=C1)O
12Deoxycholic acidC[C@H](CCC(=O)O)C1CCC2C(C1)CCC3C2CC(C4C3(CCC(C4)O)C)O
13Lithocholic acidC[C@H](CCC(=O)O)C1CCC2C(C1)CCC3C2CC=C4C3(CCC(C4)O)C
14Urolithin AC1=CC(=C2C(=C1)C(=O)C3=CC=CC=C3C2=O)O
15Urolithin BC1=CC(=C2C(=C1)C(=O)C3=CC=CC=C3C2=O)O
16AcetoinCC(C=O)O
172,3-ButanediolCC(CO)CO
18CadaverineC(CN)CCCN
19PutrescineC(CCN)CN
20Trimethylamine N-oxide (TMAO)C[N+](C)(C)[O-]
21PhenolC1=CC=C(C=C1)O

References

  1. Ma, H.; Gollahon, L.S. ERα Mediates Estrogen-Induced Expression of the Breast Cancer Metastasis Suppressor Gene BRMS1. Int. J. Mol. Sci. 2016, 17, 158. [Google Scholar] [CrossRef] [PubMed]
  2. Yang, M.; Lee, J.H.; Zhang, Z.; De La Rosa, R.; Bi, M.; Tan, Y.; Liao, Y.; Hong, J.; Du, B.; Wu, Y.; et al. Enhancer RNAs Mediate Estrogen-Induced Decommissioning of Selective Enhancers by Recruiting ERα and Its Cofactor. Cell Rep. 2020, 31, 107803. [Google Scholar] [CrossRef] [PubMed]
  3. Tang, Z.-R.; Zhang, R.; Lian, Z.-X.; Deng, S.-L.; Yu, K. Estrogen-Receptor Expression and Function in Female Reproductive Disease. Cells 2019, 8, 1123. [Google Scholar] [CrossRef]
  4. Della Torre, S.; Mitro, N.; Fontana, R.; Gomaraschi, M.; Favari, E.; Recordati, C.; Lolli, F.; Quagliarini, F.; Meda, C.; Ohlsson, C.; et al. An Essential Role for Liver ERα in Coupling Hepatic Metabolism to the Reproductive Cycle. Cell Rep. 2016, 15, 360–371. [Google Scholar] [CrossRef]
  5. Fu, Q.; Li, T.; Zhang, C.; Ma, X.; Meng, L.; Liu, L.; Shao, K.; Wu, G.; Zhu, X.; Zhao, X. Butyrate mitigates metabolic dysfunctions via the ERα-AMPK pathway in muscle in OVX mice with diet-induced obesity. Cell Commun. Signal. 2023, 21, 95. [Google Scholar] [CrossRef]
  6. Guo, M.; Cao, X.; Ji, D.; Xiong, H.; Zhang, T.; Wu, Y.; Suo, L.; Pan, M.; Brugger, D.; Chen, Y.; et al. Gut Microbiota and Acylcarnitine Metabolites Connect the Beneficial Association between Estrogen and Lipid Metabolism Disorders in Ovariectomized Mice. Microbiol. Spectr. 2023, 11, e00149-23. [Google Scholar] [CrossRef]
  7. Qi, X.; Zhao, Y.; Qi, Z.; Hou, S.; Chen, J. Machine Learning Empowering Drug Discovery: Applications, Opportunities and Challenges. Molecules 2024, 29, 903. [Google Scholar] [CrossRef]
  8. Björnström, L.; Sjöberg, M. Mechanisms of estrogen receptor signaling: Convergence of genomic and nongenomic actions on target genes. Mol. Endocrinol. 2005, 19, 833–842. [Google Scholar] [CrossRef]
  9. Thomas, C.; Gustafsson, J.Å. The different roles of ER subtypes in cancer biology and therapy. Nat. Rev. Cancer 2011, 11, 597–608. [Google Scholar] [CrossRef]
  10. Knowlton, A.; Lee, A. Estrogen and the cardiovascular system. Pharmacol. Ther. 2012, 135, 54–70. [Google Scholar] [CrossRef]
  11. Gaulton, A.; Bellis, L.J.; Bento, A.P.; Chambers, J.; Davies, M.; Hersey, A.; Light, Y.; McGlinchey, S.; Michalovich, D.; Al-Lazikani, B.; et al. ChEMBL: A large-scale bioactivity database for drug discovery. Nucleic Acids Res. 2012, 40, D1100–D1107. [Google Scholar] [CrossRef] [PubMed]
  12. Huggins, R.J.; Greene, G.L. ERα/PR crosstalk is altered in the context of the ERα Y537S mutation and contributes to endocrine therapy-resistant tumor proliferation. NPJ Breast Cancer 2023, 9, 96. [Google Scholar] [CrossRef] [PubMed]
  13. Scabia, V.; Ayyanan, A.; De Martino, F.; Agnoletto, A.; Battista, L.; Laszlo, C.; Treboux, A.; Zaman, K.; Stravodimou, A.; Jallut, D.; et al. Estrogen receptor positive breast cancers have patient specific hormone sensitivities and rely on progesterone receptor. Nat. Commun. 2022, 13, 3127. [Google Scholar] [CrossRef] [PubMed]
  14. Heath, H.; Mogol, A.N.; Casiano, A.S.; Zuo, Q.; Madak-Erdogan, Z. Targeting Systemic and Gut Microbial Metabolism in ER+ Breast Cancer. Trends Endocrinol. Metab. 2024, 35, 321–330. [Google Scholar] [CrossRef]
  15. Sebaugh, J.L. Guidelines for accurate EC50/IC50 estimation. Pharm. Stat. 2011, 10, 128–134. [Google Scholar] [CrossRef]
  16. Weininger, D. SMILES, a chemical language and information system. 1. Introduction to methodology and encoding rules. J. Chem. Inf. Comput. Sci. 1988, 28, 31–36. [Google Scholar] [CrossRef]
  17. RDKit: Open-Source Cheminformatics. Available online: https://www.rdkit.org (accessed on 1 October 2023).
  18. Ortega, M.A.; Alvarez-Mon, M.A.; García-Montero, C.; Fraile-Martinez, O.; Guijarro, L.G.; Lahera, G.; Monserrat, J.; Valls, P.; Mora, F.; Rodríguez-Jiménez, R.; et al. Gut Microbiota Metabolites in Major Depressive Disorder—Deep Insights into Their Pathophysiological Role and Potential Translational Applications. Metabolites 2022, 12, 50. [Google Scholar] [CrossRef]
  19. Ma, Z.; Zuo, T.; Frey, N.; Rangrez, A.Y. A systematic framework for understanding the microbiome in human health and disease: From basic principles to clinical translation. Sig. Transduct. Target Ther. 2024, 9, 237. [Google Scholar] [CrossRef]
  20. Aggarwal, N.; Kitano, S.; Puah, G.R.Y.; Kittelmann, S.; Hwang, I.Y.; Chang, M.W. Microbiome and Human Health: Current Understanding, Engineering, and Enabling Technologies. Chem. Rev. 2023, 123, 31–72. [Google Scholar] [CrossRef]
  21. Hou, K.; Wu, Z.X.; Chen, X.Y.; Wang, J.-Q.; Zhang, D.; Xiao, C.; Zhu, D.; Koya, J.B.; Wei, L.; Li, J.; et al. Microbiota in health and diseases. Sig. Transduct. Target Ther. 2022, 7, 135. [Google Scholar] [CrossRef]
  22. Marino, M.; Pellegrini, M.; La Rosa, P.; Acconcia, F. Susceptibility of Estrogen Receptor Rapid Responses to Xenoestrogens: Physiological Outcomes. Steroids 2012, 77, 910–917. [Google Scholar] [CrossRef] [PubMed]
  23. Zhao, S.; Zhang, B.; Yang, J.; Zhou, J.; Xu, Y. Linear discriminant analysis. Nat. Rev. Methods Primers 2024, 4, 70. [Google Scholar] [CrossRef]
  24. Zeng, J.; Guo, Y.; Han, Y.; Li, Z.; Yang, Z.; Chai, Q.; Wang, W.; Zhang, Y.; Fu, C. A Review of the Discriminant Analysis Methods for Food Quality Based on Near-Infrared Spectroscopy and Pattern Recognition. Molecules 2021, 26, 749. [Google Scholar] [CrossRef]
  25. Todeschini, R.; Consonni, V. Handbook of Molecular Descriptors; Wiley-VCH: Weinheim, Germany, 2000. [Google Scholar] [CrossRef]
  26. Balaban, A.T. Highly discriminating distance-based topological index. Chem. Phys. Lett. 1982, 89, 399–404. [Google Scholar] [CrossRef]
  27. Bishop, C.M. Pattern Recognition and Machine Learning; Springer: New York, NY, USA, 2006. [Google Scholar] [CrossRef]
  28. Hastie, T.; Tibshirani, R.; Friedman, J. The Elements of Statistical Learning: Data Mining, Inference, and Prediction; Springer: New York, NY, USA, 2009. [Google Scholar] [CrossRef]
  29. Radzi, S.F.M.; Karim, M.K.A.; Saripan, M.I.; Rahman, M.A.A.; Isa, I.N.C.; Ibahim, M.J. Hyperparameter Tuning and Pipeline Optimization via Grid Search Method and Tree-Based AutoML in Breast Cancer Prediction. J. Pers. Med. 2021, 11, 978. [Google Scholar] [CrossRef]
  30. McLachlan, G.J. Discriminant Analysis and Statistical Pattern Recognition; Wiley-Interscience: Hoboken, NJ, USA, 2004. [Google Scholar] [CrossRef]
  31. Bergstra, J.; Bengio, Y. Random Search for Hyper-Parameter Optimization. J. Mach. Learn. Res. 2012, 13, 281–305. [Google Scholar]
  32. He, H.; Garcia, E.A. Learning from Imbalanced Data. IEEE Trans. Knowl. Data Eng. 2009, 21, 1263–1284. [Google Scholar]
  33. Kuhn, M.; Johnson, K. Applied Predictive Modeling; Springer: New York, NY, USA, 2013. [Google Scholar] [CrossRef]
  34. Cohen, J. A Coefficient of Agreement for Nominal Scales. Educ. Psychol. Meas. 1960, 20, 37–46. [Google Scholar] [CrossRef]
  35. Wang, M.; Yu, F.; Zhang, Y.; Chang, W.; Zhou, M. The Effects and Mechanisms of Flavonoids on Cancer Prevention and Therapy: Focus on Gut Microbiota. Int. J. Biol. Sci. 2022, 18, 1451–1475. [Google Scholar] [CrossRef]
  36. Keserü, G.M.; Makara, G.M. The influence of lead discovery strategies on the properties of drug candidates. Nat. Rev. Drug Discov. 2009, 8, 203–212. [Google Scholar] [CrossRef]
  37. Brylinski, M. Aromatic interactions at the ligand–protein interface: Implications for the development of docking scoring functions. Chem. Biol. Drug Des. 2018, 91, 380–390. [Google Scholar] [CrossRef] [PubMed]
  38. Jeffrey, G.A. An Introduction to Hydrogen Bonding; Oxford University Press: New York, NY, USA, 1997. [Google Scholar]
  39. Kier, L.B.; Hall, L.H. Molecular Connectivity in Structure-Activity Analysis; Research Studies Press: Letchworth, UK, 1986. [Google Scholar]
  40. Labute, P. A widely applicable set of descriptors. J. Mol. Graph. Model. 2000, 18, 464–477. [Google Scholar] [CrossRef] [PubMed]
  41. Gasteiger, J.; Marsili, M. Iterative partial equalization of orbital electronegativity—A rapid access to atomic charges. Tetrahedron 1980, 36, 3219–3228. [Google Scholar] [CrossRef]
  42. Nicholson, J.K.; Wilson, I.D. Opinion: Understanding ‘global’ systems biology: Metabonomics and the continuum of metabolism. Nat. Rev. Drug Discov. 2003, 2, 668–676. [Google Scholar] [CrossRef]
  43. Steinkraus, K.H. Handbook of Indigenous Fermented Foods; Marcel Dekker Inc.: New York, NY, USA, 1996; ISBN 9780824793524. [Google Scholar]
  44. Negi, A.; Kesari, K.K.; Voisin-Chiret, A.S. Estrogen Receptor-α Targeting: PROTACs, SNIPERs, Peptide-PROTACs, Antibody Conjugated PROTACs and SNIPERs. Pharmaceutics 2022, 14, 2523. [Google Scholar] [CrossRef]
  45. Spaepen, S.; Vanderleyden, J.; Remans, R. Indole-3-acetic acid in microbial and microorganism–plant signaling. FEMS Microbiol. Rev. 2007, 31, 425–448. [Google Scholar] [CrossRef]
  46. Parr, A.J.; Bolwell, G.P. Phenols in the plant and in man. The potential for possible nutritional enhancement of the diet by modifying the phenols content or profile. J. Sci. Food Agric. 2000, 80, 985–1012. [Google Scholar] [CrossRef]
  47. Piwowarski, J.P.; Stanisławska, I.; Granica, S.; Stefańska, J.; Kiss, A.K. Phase II conjugates of urolithins isolated from human urine and potential role of β-glucuronidases in their disposition. Drug Metab. Dispos. 2017, 45, 657–665. [Google Scholar] [CrossRef]
  48. Selma, M.V.; Espín, J.C.; Tomás-Barberán, F.A. Interaction between phenolics and gut microbiota: Role in human health. J. Agric. Food Chem. 2009, 57, 6485–6501. [Google Scholar] [CrossRef]
  49. Zhang, A.Q.; Mitchell, S.C.; Smith, R.L. Dietary precursors of trimethylamine in man: A pilot study. Food Chem. Toxicol. 1999, 37, 515–520. [Google Scholar] [CrossRef]
  50. Toldrá, F. The role of muscle enzymes in dry-cured meat products with different drying conditions. Trends Food Sci. Technol. 2006, 17, 164–168. [Google Scholar] [CrossRef]
  51. Jay, J.M.; Loessner, M.J.; Golden, D.A. Modern Food Microbiology; Springer Science & Business Media: New York, NY, USA, 2005; ISBN 9780387231808. [Google Scholar]
  52. Davidson, P.M.; Sofos, J.N.; Branen, A.L. Antimicrobials in Food; CRC Press: Boca Raton, FL, USA, 2005; ISBN 9780824753337. [Google Scholar]
  53. Leroy, F.; De Vuyst, L. Lactic acid bacteria as functional starter cultures for the food fermentation industry. Trends Food Sci. Technol. 2004, 15, 67–78. [Google Scholar] [CrossRef]
  54. Hill, C.; Guarner, F.; Reid, G.; Gibson, G.R.; Merenstein, D.J.; Pot, B.; Morelli, L.; Canani, R.B.; Flint, H.J.; Salminen, S.; et al. Expert consensus document: The International Scientific Association for Probiotics and Prebiotics consensus statement on the scope and appropriate use of the term probiotic. Nat. Rev. Gastroenterol. Hepatol. 2014, 11, 506–514. [Google Scholar] [CrossRef] [PubMed]
  55. Gill, S.K.; Panda, S.H.; Singh, A.; Meena, D.K. Polyphenols in human health and disease: Current knowledge and future directions. J. Pharmacogn. Phytochem. 2015, 4, 17–27. [Google Scholar]
  56. Slavin, J. Fiber and prebiotics: Mechanisms and health benefits. Nutrients 2013, 5, 1417–1435. [Google Scholar] [CrossRef]
  57. Adams, M.R.; Hall, C.J. Growth inhibition of food-borne pathogens by lactic and acetic acids and their mixtures. Int. J. Food Sci. Technol. 1988, 23, 287–292. [Google Scholar] [CrossRef]
Figure 1. Model Performance Metrics.
Bdcc 09 00086 g001
Figure 2. Influence of Each Feature on Linear Discriminant.
Bdcc 09 00086 g002
Table 1. Model Evaluation Results.
ModelAccuracyPrecisionRecallF1 ScoreMCCCohen’s KappaHamming LossROC AUC
LinearDiscriminantAnalysis0.89440.90000.96120.92960.72550.71920.10560.8396
RidgeClassifier0.88730.89910.95150.92450.70740.70300.11270.8347
LogisticRegression0.86620.85000.99030.91480.65220.61160.13380.7644
Bagging0.84510.87160.92230.89620.59530.59160.15490.7817
Bagging (DecisionTree)0.84510.87160.92230.89620.59530.59160.15490.7817
BalancedRandomForest0.82390.95350.79610.86770.63340.61080.17610.8468
CalibratedClassifierCV (Logistic)0.82390.82500.96120.88790.52140.48890.17610.7114
AdaBoost0.81690.82350.95150.88290.50030.47330.18310.7065
GradientBoosting0.81690.84680.91260.87850.51510.50920.18310.7384
CatBoost0.81690.85320.90290.87740.52060.51740.18310.7463
XGBoost0.80990.84550.90290.87320.49890.49460.19010.7335
RandomForest0.80280.83190.91260.87040.47100.46230.19720.7127
QuadraticDiscriminantAnalysis0.80280.88660.83500.86000.53040.52770.19720.7765
EasyEnsemble0.78170.92860.75730.83420.54790.52410.21830.8017
Voting0.78170.79510.94170.86220.38590.35440.21830.6504
ExtraTree0.76760.80700.89320.84790.36920.36070.23240.6646
KNeighbors0.76060.80000.89320.84400.34520.33550.23940.6517
Bagging (KNeighbors)0.74650.76800.93200.84210.25910.22850.25350.5942
DecisionTree0.73240.79820.84470.82080.29650.29460.26760.6403
SGDClassifier0.72540.72541.00000.84080.00000.00000.27460.5000
LinearSVC0.72540.72541.00000.84080.00000.00000.27460.5000
SVC0.72540.72541.00000.84080.00000.00000.27460.5000
MLPClassifier0.72540.72541.00000.84080.00000.00000.27460.5000
CalibratedClassifierCV (SVC)0.72540.72541.00000.84080.00000.00000.27460.5000
BernoulliNB0.71830.76030.89320.82140.18810.17470.28170.5748
GaussianNB0.60561.00000.45630.62670.43280.31550.39440.7282
GaussianProcess0.37320.85000.16500.27640.11310.05300.62680.5441
Table 2. Top 10 Most Significant Features.
No.FeatureImportance
1FractionCSP32.126618
2AromaticProportion2.126618
3BalabanJ0.895716
4NumHAcceptors0.698623
5Chi3v0.453634
6SMR_VSA20.431287
7Chi4v0.351189
8PEOE_VSA30.313827
9PEOE_VSA40.287226
10NOCount0.272061
Table 3. Predicted Activity of Metabolites.
MetabolitePredicted Activity
IndoleActive
Skatole (3-methylindole)Active
Trimethylamine (TMA)Active
Indole-3-acetic acid (IAA)Active
Indole-3-lactateInactive
4-Cresol (p-cresol)Active
p-Cresol sulfateInactive
Phenylacetic acidInactive
Phenyllactic acidActive
o-CresolActive
3-Methylphenol (m-cresol)Active
Deoxycholic acidInactive
Lithocholic acidInactive
Urolithin AActive
Urolithin BActive
AcetoinInactive
2,3-ButanediolInactive
CadaverineInactive
PutrescineInactive
Trimethylamine N-oxide (TMAO)Active
PhenolActive
Disclaimer/Publisher’s Note: The statements, opinions and data contained in all publications are solely those of the individual author(s) and contributor(s) and not of MDPI and/or the editor(s). MDPI and/or the editor(s) disclaim responsibility for any injury to people or property resulting from any ideas, methods, instructions or products referred to in the content.

