Article

COVID-19 Severity Classification Using Hybrid Feature Extraction: Integrating Persistent Homology, Convolutional Neural Networks and Vision Transformers

by
Redet Assefa
1,†,
Adane Mamuye
2,*,† and
Marco Piangerelli
2,3,*,†
1
Computer Science Department, College of Informatics, Tewodros Campus University of Gondar, Gondar 6200, Ethiopia
2
School of IT and Engineering, College of Technology and Built Environment, Addis Ababa University, 5 Killo Campus, Addis Ababa 18869, Ethiopia
3
Computer Science Division, School of Science and Technology, University of Camerino, 62017 Camerino, Italy
*
Authors to whom correspondence should be addressed.
These authors contributed equally to this work.
Big Data Cogn. Comput. 2025, 9(4), 83; https://doi.org/10.3390/bdcc9040083
Submission received: 11 February 2025 / Revised: 20 March 2025 / Accepted: 26 March 2025 / Published: 31 March 2025

Abstract

:
This paper introduces a model that automates the diagnosis of a patient’s condition, reducing reliance on highly trained professionals, particularly in resource-constrained settings. To ensure data consistency, the dataset was preprocessed for uniformity in size, format, and color channels. Image quality was further enhanced using histogram equalization to improve the dynamic range. Lung regions were isolated using segmentation techniques, which also eliminated extraneous areas from the images. A modified segmentation-based cropping technique was employed to define an optimal cropping rectangle. Feature extraction was performed using persistent homology, deep learning, and hybrid methodologies. Persistent homology captured topological features across multiple scales, while the deep learning model leveraged convolutional transition equivariance, input-adaptive weighting, and the global receptive field provided by Vision Transformers. By integrating features from both methods, the classification model effectively predicted severity levels (mild, moderate, severe). The segmentation-based cropping method showed a modest improvement, achieving 80% accuracy, while stand-alone persistent homology features reached 66% accuracy. Notably, the hybrid model outperformed existing approaches, including SVM, ResNet50, and VGG16, achieving an accuracy of 82%.

1. Introduction

The COVID-19 pandemic has presented unprecedented challenges to healthcare systems worldwide, necessitating rapid and accurate methods for diagnosis and severity assessment. Since late 2019, COVID-19 has caused more than 7 million deaths and infected more than 704.7 million people globally as of Aug, 2024 [1]. Although RT-PCR remains the primary method for identifying current infections, imaging techniques such as chest X-rays have proven valuable for both diagnosis and severity classification [2,3,4].
Chest X-rays are preferred over CT scans for COVID-19 assessment due to their lower cost, reduced risk of cross-infection, and wider availability [3,5]. However, the visual interpretation of chest X-rays is subject to inter-observer variability and can be time-consuming, especially during periods of high patient influx. This has led to increased interest in developing automated methods for COVID-19 severity classification using chest X-rays.
The bias towards severe cases in both COVID-19 severity classification and binary diagnosis models developed to date poses a challenge to accurately assess the full spectrum of COVID-19 cases. The high accuracy of binary COVID-19 diagnostic models is due to the abundance of training examples of healthy individuals without pneumonia indications, as well as images from critical care settings [6,7,8]. In the case of COVID-19 severity classification, the model’s classification accuracy in classifying the extreme cases was greater than in classifying the mild cases [9], which shows that the model was biased toward severe conditions. The true medical value of a machine model lies in its capacity to detect situations that fall somewhere between the extremes. In addition, identifying the severity level can be useful in monitoring the progression of the disease.
Grading the severity of COVID-19 positive cases can assist in reducing the problem that arises due to the unusable clinical value of the classification models [9]. Most of the classification models in this area focus on identifying whether a patient is COVID-19 positive or not. Binary classification is essential as it could help us do the initial screening and quarantining. However, this use could be overshadowed if the model is fitted on a dataset that is highly discriminated between negative cases and infected severe cases. That might be the case with several studies [6,7,8,10,11] on chest X-ray binary classification, as they have claimed an accuracy greater than 90%.
Severity classification methods have utilized convolutional neural networks (CNNs) such as ResNet50 and DenseNet-based approaches for computer vision tasks. Although CNNs have dominated the field since the introduction of AlexNet [12], Vision Transformers (ViT [13]) have recently shown satisfactory performance on large datasets. However, ViT has an issue with translation equivariance and requires a large dataset to learn object translation [14]. In contrast, CNNs lack the global receptive field and adaptive input weighting properties of self-attention found in ViT. These properties allow ViT to see the input at a single glance and understand complex correlations between input data [14].
Persistent homology excels in capturing robust and scale-invariant global topological characteristics of medical images, such as connected components and holes. Unlike CNNs and Transformers, PH can reliably encode structural relationships that are less sensitive to variations in orientation, illumination, or minor spatial perturbations. This provides stable descriptors that are particularly valuable in medical imaging tasks where anatomical structures or pathological abnormalities manifest distinct topological patterns [15,16].
CNNs inherently capture critical local features and textures in medical images, enabling effective extraction of spatial patterns crucial for disease classification. Their inherent translation equivariance ensures that local anatomical variations or lesion locations across images do not degrade the classification performance significantly, providing stable and generalized representations critical in clinical diagnosis [17,18].
Vision Transformers provide the essential ability to model global dependencies and adaptive attention across the entire image. This global contextualization capability allows for the accurate modeling of clinical features dispersed throughout an image, overcoming CNN limitations related to restricted receptive fields. Thus, Transformers significantly enhance the model’s sensitivity to subtle but clinically important relationships across distant regions within chest X-rays or other medical imaging modalities [13,19].
This hybrid approach is justified over single or simpler combinations.
  • Persistent homology alone struggles with instability issues related to minor data variations, requiring stabilization or complementary features for reliable clinical applications [16].
  • CNN-only models lack a global receptive field and might overlook globally dispersed pathological features, limiting clinical utility where comprehensive context is crucial [18].
  • Transformer-only architectures, despite their global contextual understanding, require substantial data and may struggle to accurately capture nuanced local textures essential for detailed diagnosis without CNN-like inductive biases [19].
This study aims to identify indicators of COVID-19 by locating opacity changes and abnormalities by integrating these three methods. The proposed hybrid approach leverages their respective strengths to achieve robust, globally aware, and locally sensitive feature extraction suitable for highly reliable and clinically meaningful diagnosis, clearly outperforming simpler or individual methodologies. Two research questions were undertaken: one to ask how topological feature extraction techniques improve the performance of the COVID-19 severity classification model, and the second is to see how the proposed model performs compared with ResNet-50, VGG16, and SVM.
The main contributions of this study are as follows:
  • Development of a hybrid feature extraction technique that integrates topological data analysis with state-of-the-art deep learning methods.
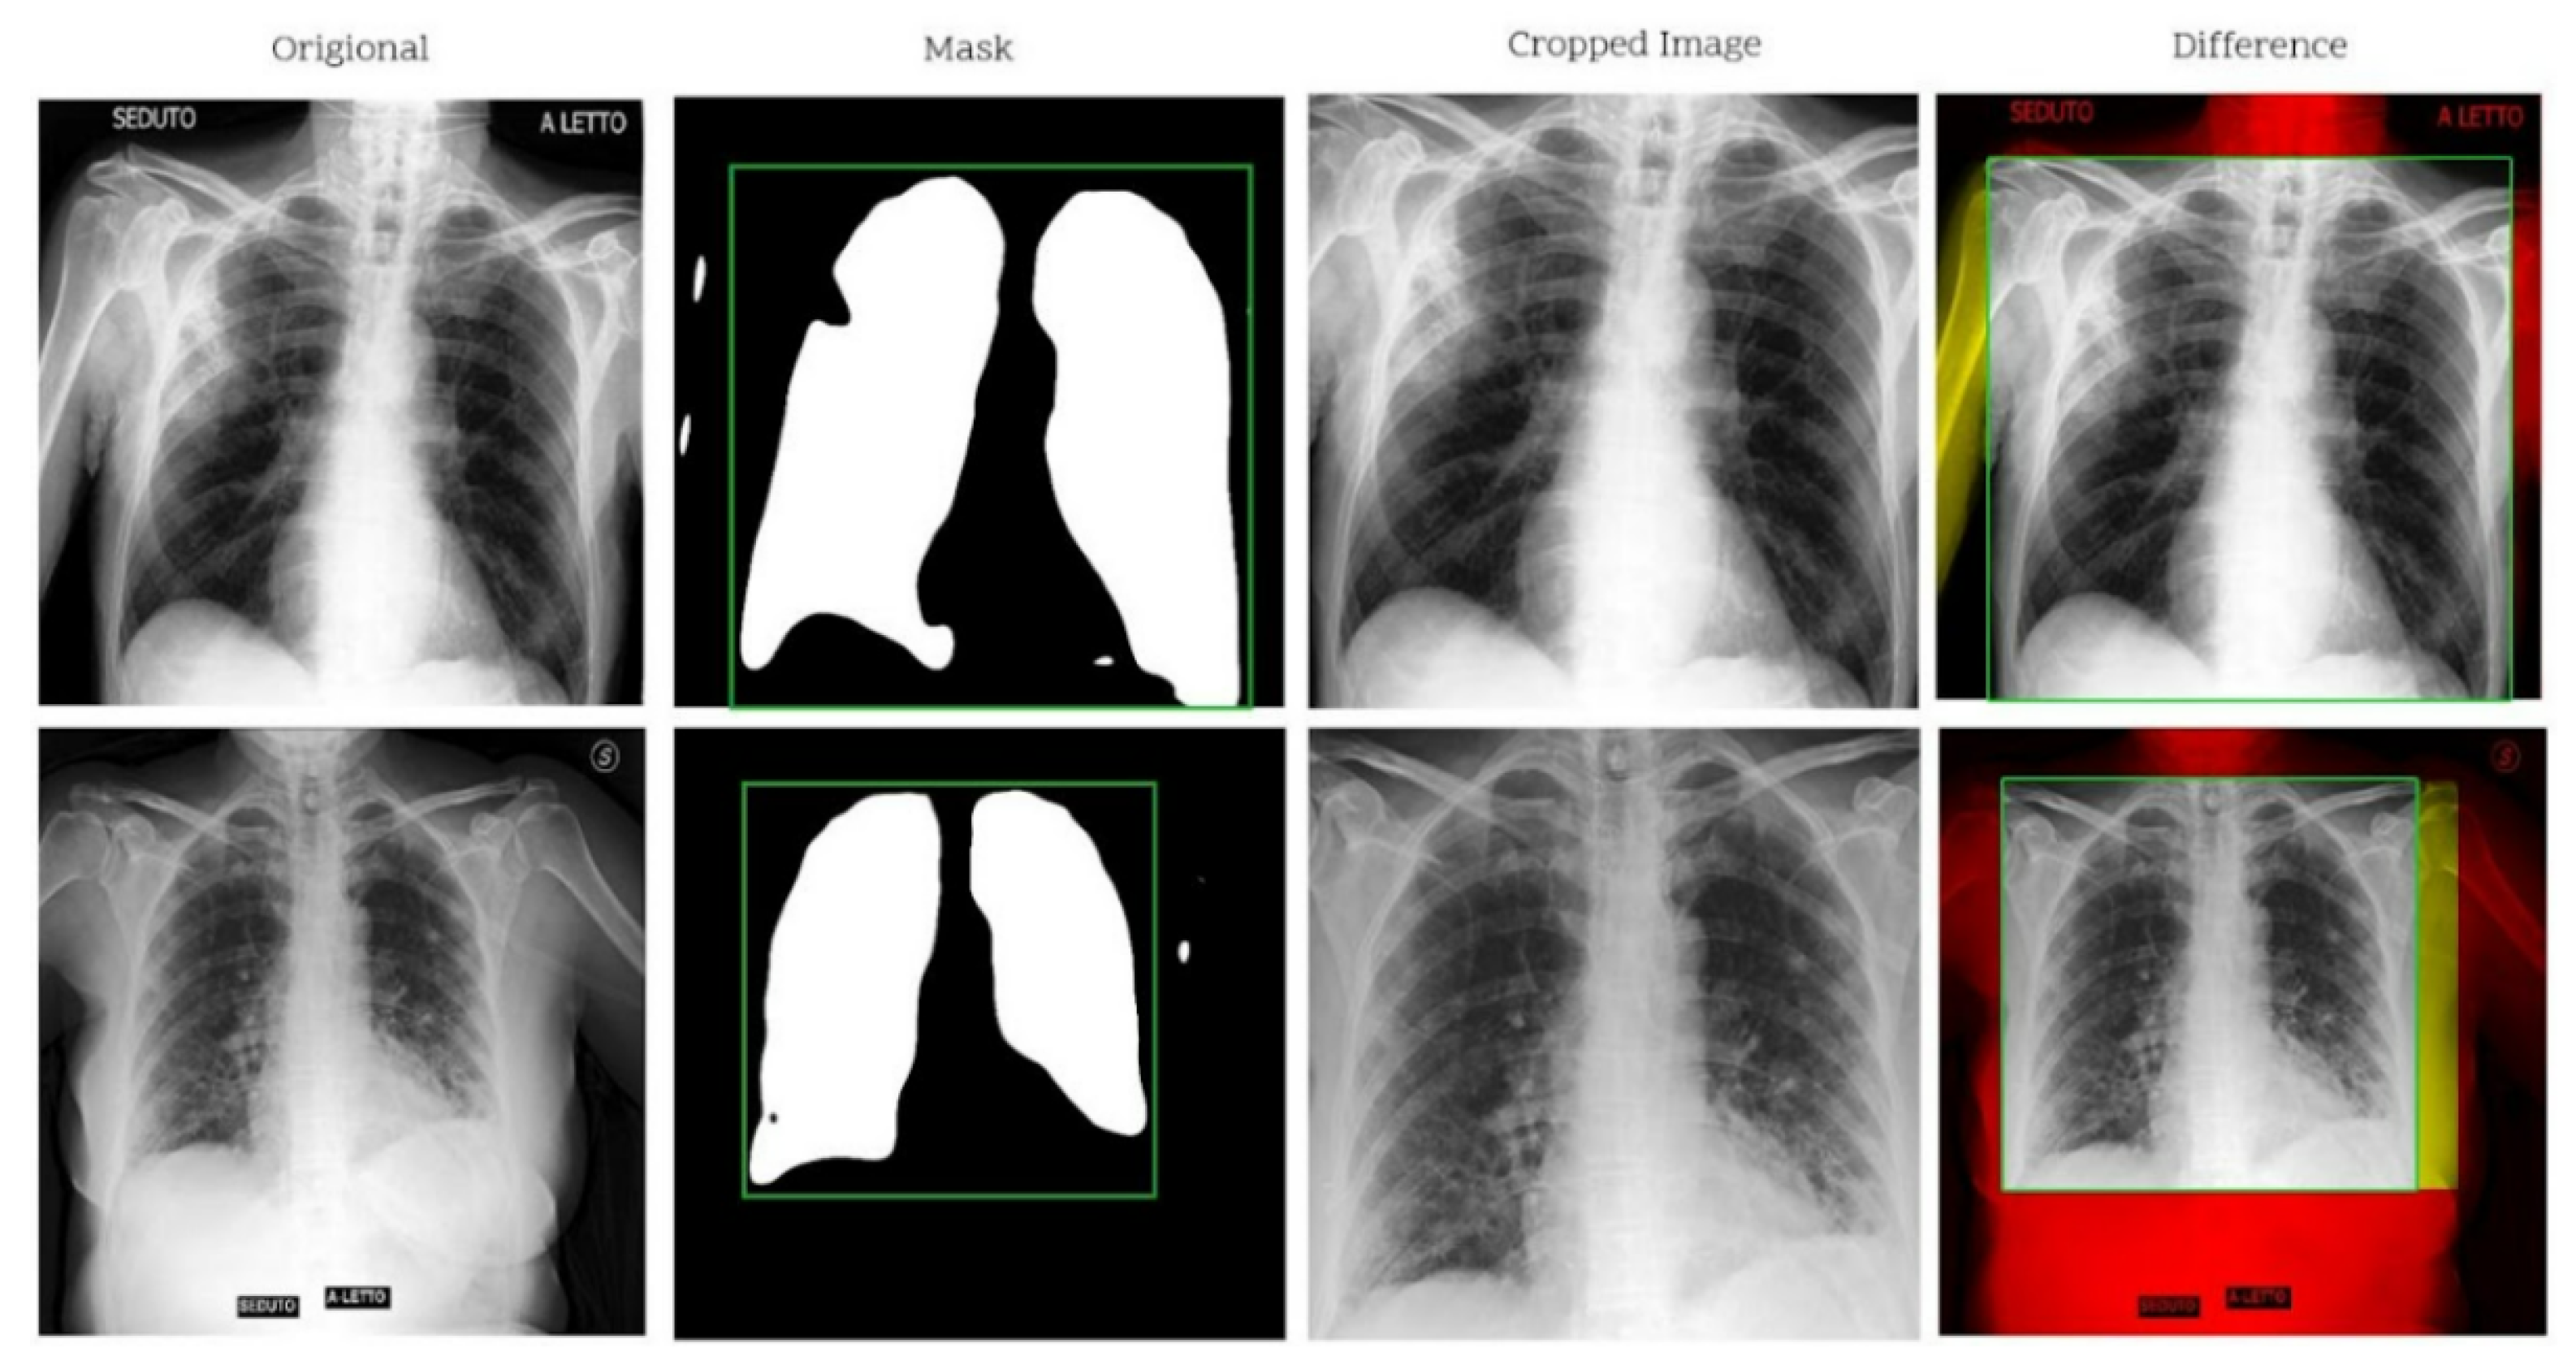
  • Introduction of a modified segmentation-based cropping technique that improves lung region isolation.
  • Comprehensive comparison of the proposed method with existing approaches, demonstrating improved accuracy and reduced bias across severity levels.
  • Analysis of the contribution of persistent homology features to the overall classification performance.
The rest of this paper is organized as follows: Section 2 reviews related work in COVID-19 severity classification. Section 3 describes the proposed methodology in detail. Section 4 presents the experimental setup and results. Section 5 discusses the findings and their implications. Finally, Section 6 concludes the paper and suggests directions for future research.

2. Related Works

Most of the works carried out involve the detection of COVID-19 by using datasets containing a few hundred images and/or by transfer learning existing models to differentially diagnose COVID-19 from other types of pneumonia. The clinical utility of a chest X-ray is clearer in disease progression monitoring and severity assessment than in differential diagnosis [20].
In [21], a private dataset is produced by labeling nine publicly available datasets using two radiologists with 10 years of experience. Four classes that are mild, moderate, critical, and severe with 1000, 950, 600, 710 chest X-ray images were scored using a modified RALE score having opacity score, and lung involvement score. An end-to-end CNN classifier with 16 layers was trained after the hyperparameters were determined using grid search optimization. The authors compared the trained model with VGG16, AlexNet, ResNet-34, and ResNet-101 and found out that it outperformed all of them with 95% accuracy.
Although the authors of [21] claimed to have adopted the RALE score, they have failed to clearly state the ranges in which the classes are to fit. Furthermore, despite the fact that the dataset was built from publicly available data, it has not yet been released to the public. The training has followed validation phases where they verified the model’s performance on unseen data. However, the dataset could have been balanced and segmented to have the lung region only to prevent overfitting.
In [9], the need for a new dataset where the images come from the same machine having similar acquisition parameters was justified. Using the RALE scoring technique, 426 chest X-ray images were labeled as Normal, Mild, Moderate, and Severe by four radiologists. The authors applied the U-net segmentation model to crop out unwanted regions of the lung. Once the lung region was masked out, the maximum (and minimum) values of the lung plus 2.5% of the length/width were used to calculate the cropping rectangle. Synthetic augmentation (using class-inherent transformation network) was applied to expand the dataset. ResNet50 classifier was used to score an accuracy of 76.18%.
In [22], 65 chest X-ray images from 48 patients were labeled by two radiologists with five and seven years of experience. Alveolar opacity patterns, which are circle-shaped opacities, and interstitial opacity patterns, which are linear opacities extending from the hilum to the lung parenchyma, are scored independently from 0 to 3 depending on the size and region of the involvement. A modified U-Net segmentation model (with EfficientNet as a base model) trained on 1048 publicly available images was used to specify the region of interest. Densenet121 pretrained on the ImageNet dataset was fine-tuned to classify the newly constructed dataset. The authors reported the models’ accuracy to be 78.5% in classifying alveolar opacities and 90.7% in classifying interstitial opacities.
In [20], a much larger dataset of 5000 Chest X-ray images was used to predict the Brixia score. The authors used a modified U-Net to segment the lung. This was followed by an alignment procedure that rotates, centers, and crops the lung into an upright lung position. The score prediction was performed by feeding the aligned image into a sequence of convolution, feature pyramid network, and finally, global average pooling, followed by SoftMax activation layers. It was able to predict the scores with a correlation coefficient of 0.86.
While significant progress has been made in automated COVID-19 chest X-ray analysis, addressing dataset bias, improving generalization, and standardizing severity assessment methods remain critical challenges. Future work should focus on developing more robust, clinically relevant models that can reliably assist in patient care across diverse healthcare settings.

3. Materials and Methods

This study presents a comprehensive approach to automated COVID-19 severity assessment using chest X-ray images. By leveraging two substantial datasets—the Brixia and COVID-GDR-1.0—totaling 5121 images, the research explores various techniques in image processing, segmentation, and machine learning. The methodology encompasses advanced segmentation techniques, innovative feature extraction methods including persistent homology, and the application of a modified CoatNet architecture for classification. This multifaceted approach aims to overcome common challenges in medical image analysis, such as dataset imbalance and the need for robust, generalizable models, while striving to provide accurate and clinically relevant severity assessments for COVID-19 patients. Figure 1 illustrates the comprehensive architecture of the classification methods employed.

3.1. Study Design and Data Collection

Data

This study involved a retrospective analysis of two datasets (i.e., Brixia and covid-GDR-1.0), totaling 5121 chest X-ray images taken for use in real medical scenarios. The Brixia dataset was taken between March 4th and April 4th, 2020, at ASST Spedali Civili di Brescia Hospital in Italy. From the hospital’s PIS-PACS system, a total of 4695 CXR images of COVID-19 patients were labeled by a radiologist with a wide range of years of experience. All the images are in 12-bit grayscale Digital Imaging and Communications in Medicine (DICOM) file format [20]. The COVID-19-GDR-1.0 dataset was labeled by four radiologists from Universitario San Cecilio Hospital in Granada (Spain). From a total of 852 chest X-ray images, 426 of the positive cases were labeled into four classes, namely, normal, mild, moderate, and severe [9]. Table 1 shows the distribution of the dataset.

3.2. Labeling and Data Processing

A COVID-19 severity score is a number assigned to a chest X-ray image of a COVID-19 patient to indicate the severity and progression of COVID-19 pneumonia. The severity score aims to minimize the subjective nature of human radiologists’ assessments. Three main scales, Brixia, Toussie, and the RALE, were recently established for COVID-19. Although each of the scales has a distinct value range, a possible correspondence could be made between them [20]. The score is measured by stratifying the chest X-ray image into regions. The number of regions that show the signature is counted, and a severity score is assigned. X-ray images were converted into a uniform format with the same file, dimension, and color format to prevent these variations from affecting the classification output. Histogram equalization is also utilized to improve the visual quality.

3.3. Segmentation

Thresholding-based, deep learning, and segmentation-based cropping are techniques that have been compared as segmentation techniques. The adaptive thresholding-based segmentation technique proposed involves converting the image into a binary image via the Sauvola [23] thresholding technique. Then, the noise is removed via an average filter followed by morphological erosion, and successive dilation is applied. Finally, the properties of connected components are analyzed, and the most likely lung regions are selected as a mask to segment the original image. U-Net is a neural network architecture that is designed for biomedical image segmentation. It allows for the creation of a highly detailed segmentation map without the need for a large training set. This is crucial, as properly annotated medical images are mostly limited [24]. Another similar method, proposed by [9], is the segmentation-based cropping technique. There are often areas that are incorrectly segmented, especially in severe cases where the boundary between the lungs and other regions is unclear. The segmentation-based cropping technique addresses this issue by using the maximum and minimum points of the segmented lung mask to create a rectangle that includes both the lungs and the space between them. To ensure sufficient coverage, the rectangle is expanded by 2.5% of the pixels in all directions. Finally, the original image region of interest is cropped via this rectangle. Figure 2 shows the steps involved in using a segmentation mask to produce a cropped image. The original image is shown on the left, the segmentation mask is shown in the middle, and the final cropped image is shown on the right. We modified this technique by analyzing the connected component of the resulting mask from the model. Appendix A.6 shows how this modification works.

3.4. Feature Extraction and Network Design

In addition to automatically extracting features, we propose the use of persistent homology features, which is a type of topological data analysis. Persistent homology extracts homological features that persist throughout a filtration function. Grayscale images can naturally be filtered using the intensity values under which all the pixel values are considered for homological features. Two features, 0-HP and 1-HP, are homological features extracted in the form of a Betti curve. 0-HP is the zero-dimensional persistent homology feature, it refers to the time of connected components across the filtration parameter. 1-HP, on the other hand, is the one-dimensional persistent homology feature referring to the lifetime of holes or loops. The persistence graph shows at what filtration parameter these features are detected (x-axis) and vanish (y-axis). To generate the Betti curves, all 256 samples are taken across the filtration parameter, and the quantity of 0-HP and 1-HP features observed at each sample is counted. Figure 3 shows how the feature is represented and converted from a persistence graph to Betti curves.
We used a modified CoatNet [14] as the main classifier network. It is a hybrid network that takes advantage of these convolutional and transformer networks. The CNN has transition equivariance, meaning that it does not need to be trained on a translated version of the dataset to generalize translation. On the other hand, vision transformers have input adaptive weighting and global receptive field properties of self-attention. Combining the strengths of the convolutional and transformer networks, we utilized a modified CoatNet [14] as our primary classifier network, harnessing the transition equivariance of CNNs and the input adaptive weighting and global receptive field properties of vision transformers.
Hyperparameter tuning is the process by which the optimal values of the parameters that maximize model performance are determined. We used a Bayesian search, which builds a relationship between hyperparameters and model performance via the Gaussian process. Using the information already known, the most likely parameters are selected [26]. The batch size, dropout, epoch learning rate, and choice of optimizer were considered hyperparameter values. Appendix A.4 describes the Bayesian hyperparameter search, while Appendix A.5 shows the hyperparameter configuration.
To address the imbalance in the dataset, we prioritized weight balancing to mitigate bias toward the dominant class without altering the original data distribution. While data-level strategies like oversampling the minority class or undersampling the majority class can artificially balance classes, such methods risk discarding critical clinical information or introducing synthetic samples that may misrepresent true biological patterns [27]. Additionally, Resampling methods like SMOTE or ADASYN can distort model calibration, leading to overestimated probabilities for minority-class predictions [28]. It is generally preferable to retain as much data as possible in medical classification [29]. Weight balancing addresses this challenge by adjusting the loss function to assign higher penalties to misclassifications of minority-class samples, thereby incentivizing the model to learn from underrepresented groups without resampling. This approach aligns with clinical priorities—ensuring robust learning from all available data while minimizing bias—and avoids the pitfalls of overfitting or data loss inherent in resampling techniques.
The performance of the different classifiers is compared via a statistical measure of accuracy. Accuracy is the number of instances that are correctly classified divided by the number of instances.
A c c u r a c y = #   of   correctly   classified #   of   total   samples = T P + T N N + P
In addition to accuracy, sensitivity is another metric used to evaluate and compare different classification models. The sensitivity (also called the true positive rate) measures the model’s ability to detect positive cases. It is defined in the following formula.
S e n s i t i v i t y = #   of   correctly   classified #   of   positively   classified = T P T P + F N

4. Results

We evaluate and compare various approaches in image segmentation, feature extraction, and classification to determine the most effective methods for accurate severity prediction. The experiments cover a range of techniques, including different segmentation methods, topological feature classification, automatic feature extraction using deep learning models, and a novel hybrid approach combining persistent homology features with advanced neural network architectures. Through these comparisons, we aim to demonstrate the effectiveness of our proposed methodology in improving the accuracy and reliability of COVID-19 severity assessment, addressing common challenges in medical image analysis such as dataset imbalance and the need for robust, interpretable models.

4.1. Comparison of Segmentation Methods

Thresholding-based, deep learning-based segmentation, and segmentation-based cropping techniques must be empirically compared. To identify which segmentation technique is better or whether segmentation is required at all, a proper comparison is necessary. A comparison of segmentation techniques usually involves measuring the similarity or distance between the ground truth segmentation and the predicted segmentation mask. Intersection over union and the Dice coefficient are two of the most widely used metrics for such comparisons. In this experiment, however, we need to reconsider the problem according to the end goal of the experiment. The best segmentation technique in this sense is the one that maximizes the final classification score. Therefore, a comparison model is trained on each of the segmentation techniques. Table 2 shows the results of the experiment.
The results support our claim that applying segmentation contributes to performance improvement. This is because segmentation removes unwanted variations that could have confused the subsequent model development steps [9]. We observed a 1.66% improvement when segmentation was used. In terms of the difference in the segmentation results, the proposed methods outperform the other methods. There is also a similar result between thresholding and deep learning-based segmentation techniques. We can see from the segmentation-based cropping technique that our claim that there are missing lung regions that could have contributed to the model’s performance is correct. The results also show that the modification we made to the segmentation-based cropping technique is effective at reducing noise. This result aligns with the improvement made by applying similar postprocessing modifications to improve lung segmentations in [30,31].

4.2. Classification of Topological Features

The classifier for persistent histological features is a few dense layers followed by a SoftMax activation layer. To determine how many of these layers to use and other parameters, a Bayesian-based hyperparameter search was used. The result of the hyperparameter search can be found in Appendix A.1. For comparison, an SVM-based classifier was used. Table 3 shows the results of this comparison.
Both persistent homology features, that is, the connected component (H0) and holes (H1), are considered in this experiment. To determine which feature is better, we perform separate training on each of the features on the same number of layers. The results (shown in Table 3) suggest that both features are important, as the results are close to the combined feature results. However, connected-component (H0) features are slightly more important (by 2.12%). This is because the more complex the homology feature is, the higher/more complex the network is that is required to train it [32].
In all of the iterations, we can clearly see that this topological feature is not enough to properly fit to classify the COVID-19 severity of a chest X-ray. This could be partially explained by the fact that the Betti curve representation of persistent features is unstable [33]. Moreover, the use of dense layers as classifiers seems to be a better option than the SVM. The stability problem might have affected the class margin of separation, resulting in poor SVM performance.

4.3. Classification on Automatic Feature Extraction

In this sense, automatic feature extraction is the feature extraction performed via the convolution and pooling layers. In this experiment, a hybrid transformer and convolution-based network (CoatNet) is tested on the dataset. Although the state-of-the-art CoatNet architecture uses more layers, only a handful of layers are used to prevent overfitting.
To assess the network’s performance, we compared it to the preestablished network. We chose a ResNet-based network, as it was used as the main network block in previous studies [9,20]. Additionally, VGG-16 has shown good performance in detecting COVID-19 [8,34]. Therefore, the CoatNet, VGG-16, and ResNet50 networks are candidates for comparison.
The results of the experiment show that a hybrid transformer-convolution network (CoatNet) performs better than a convolution-based ResNet50 network. Table 4 shows the detailed results of the experiment. CoatNet, which is a hybrid of topological features and automatically extracted features, is selected for the next classification.

4.4. Classification Using Hybrid Features

The models that performed better in the previous two experiments, CoatNet and the feed forward network, are combined to form a single classifier shown in Appendix A.2. Fitting the model on the integrated arrangement is relatively challenging, as it requires looking for a hyperparameter that satisfies both of the network blocks. Pretrained weights were loaded for the network blocks. Loading pretrained weights may not necessarily improve the final classification accuracy. However, it helps speed up convergence [35,36]. Table 5 shows a detailed summary of the overall results. We can see that segmentation has improved classification accuracy as the classifier focuses on the important section of the image. Among the CNN-based models, ResNet50 has shown a very small improvement over VGG16. Unlike ResNet50, VGG-16 does not have skip connections that are crucial in solving the vanishing and exploding gradient problems [37]. However, this could not explain the insignificant difference observed here. We can also see from the table that CoatNet outperformed the CNN-based models. This suggests that the model makes use of the self-attention and convolution layers and is built on [14]. Additionally, CoatNet is designed with skip connections to reduce the effect of vanishing and exploding gradients. Previously, we reported that topological features were not enough to properly classify the severity level of a COVID-19 patient’s chest X-ray. In this experiment, however, we revealed that supplementing CoatNet with a topological feature improved the overall accuracy. The training history can be found in Appendix A.3.
We also analyzed the sensitivity, precision, F1-score, and AUC of the proposed model. Table 6 shows the hybrid model sensitivity results for each of the classes. Additionally, the ROC curve can be found in Appendix A.7. In previous studies, the models were biased toward severe cases, so the models were not able to reliably distinguish between mild and severe cases [12]. The results show that our model has achieved a significant improvement in avoiding this problem. Applying a proper weight-balancing procedure could have contributed to this improvement, as an imbalanced dataset is known to favor one class over the other [38].

5. Discussion

The development of a severity classification system for patients with COVID-19 via chest X-ray was the focus of this study. To improve the classification performance, we introduced a hybrid of convolution, self-attention, and persistent homology feature extraction techniques.
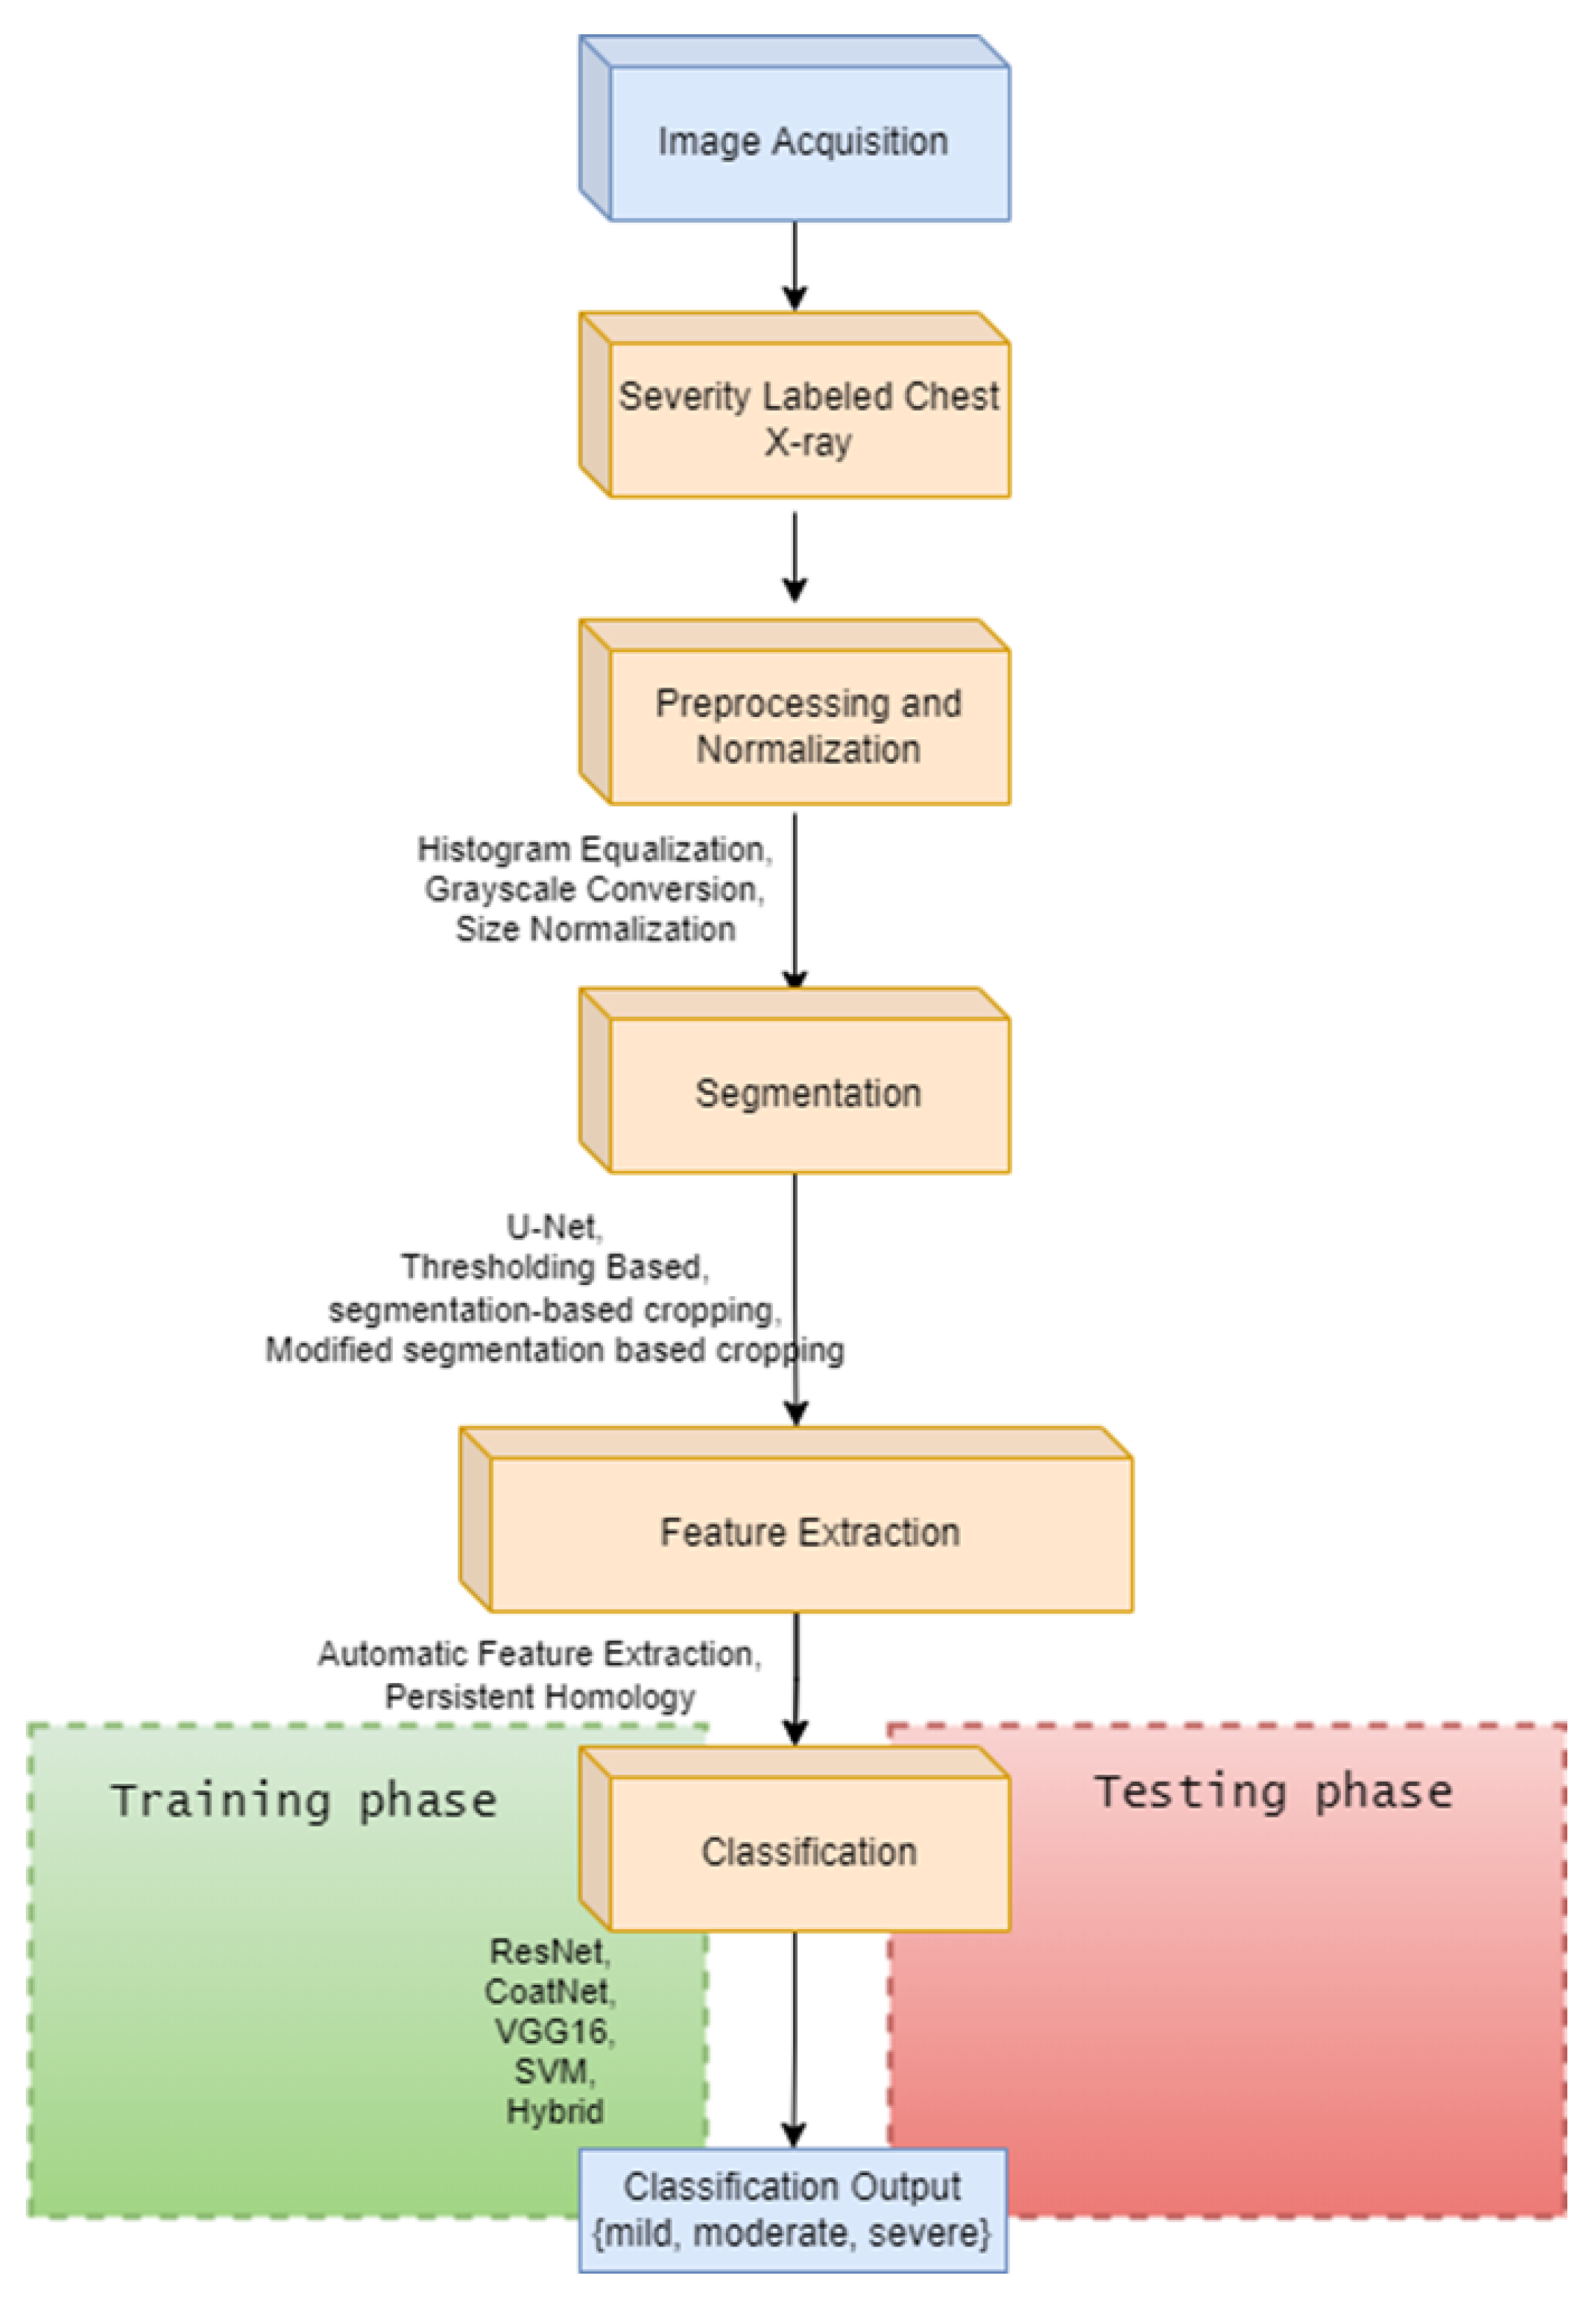
Histogram equalization is applied to enhance the quality of the images. The dataset was then normalized to have an identical size, color, and storage format. Thresholding, deep learning, and segmentation-based cropping techniques were compared. Next, the automatic feature extraction techniques ResNet-50, VGG-16, and CoatNet are studied along with the persistent feature extraction technique. A hybrid of persistent homology and the best automatic feature extractor was studied.
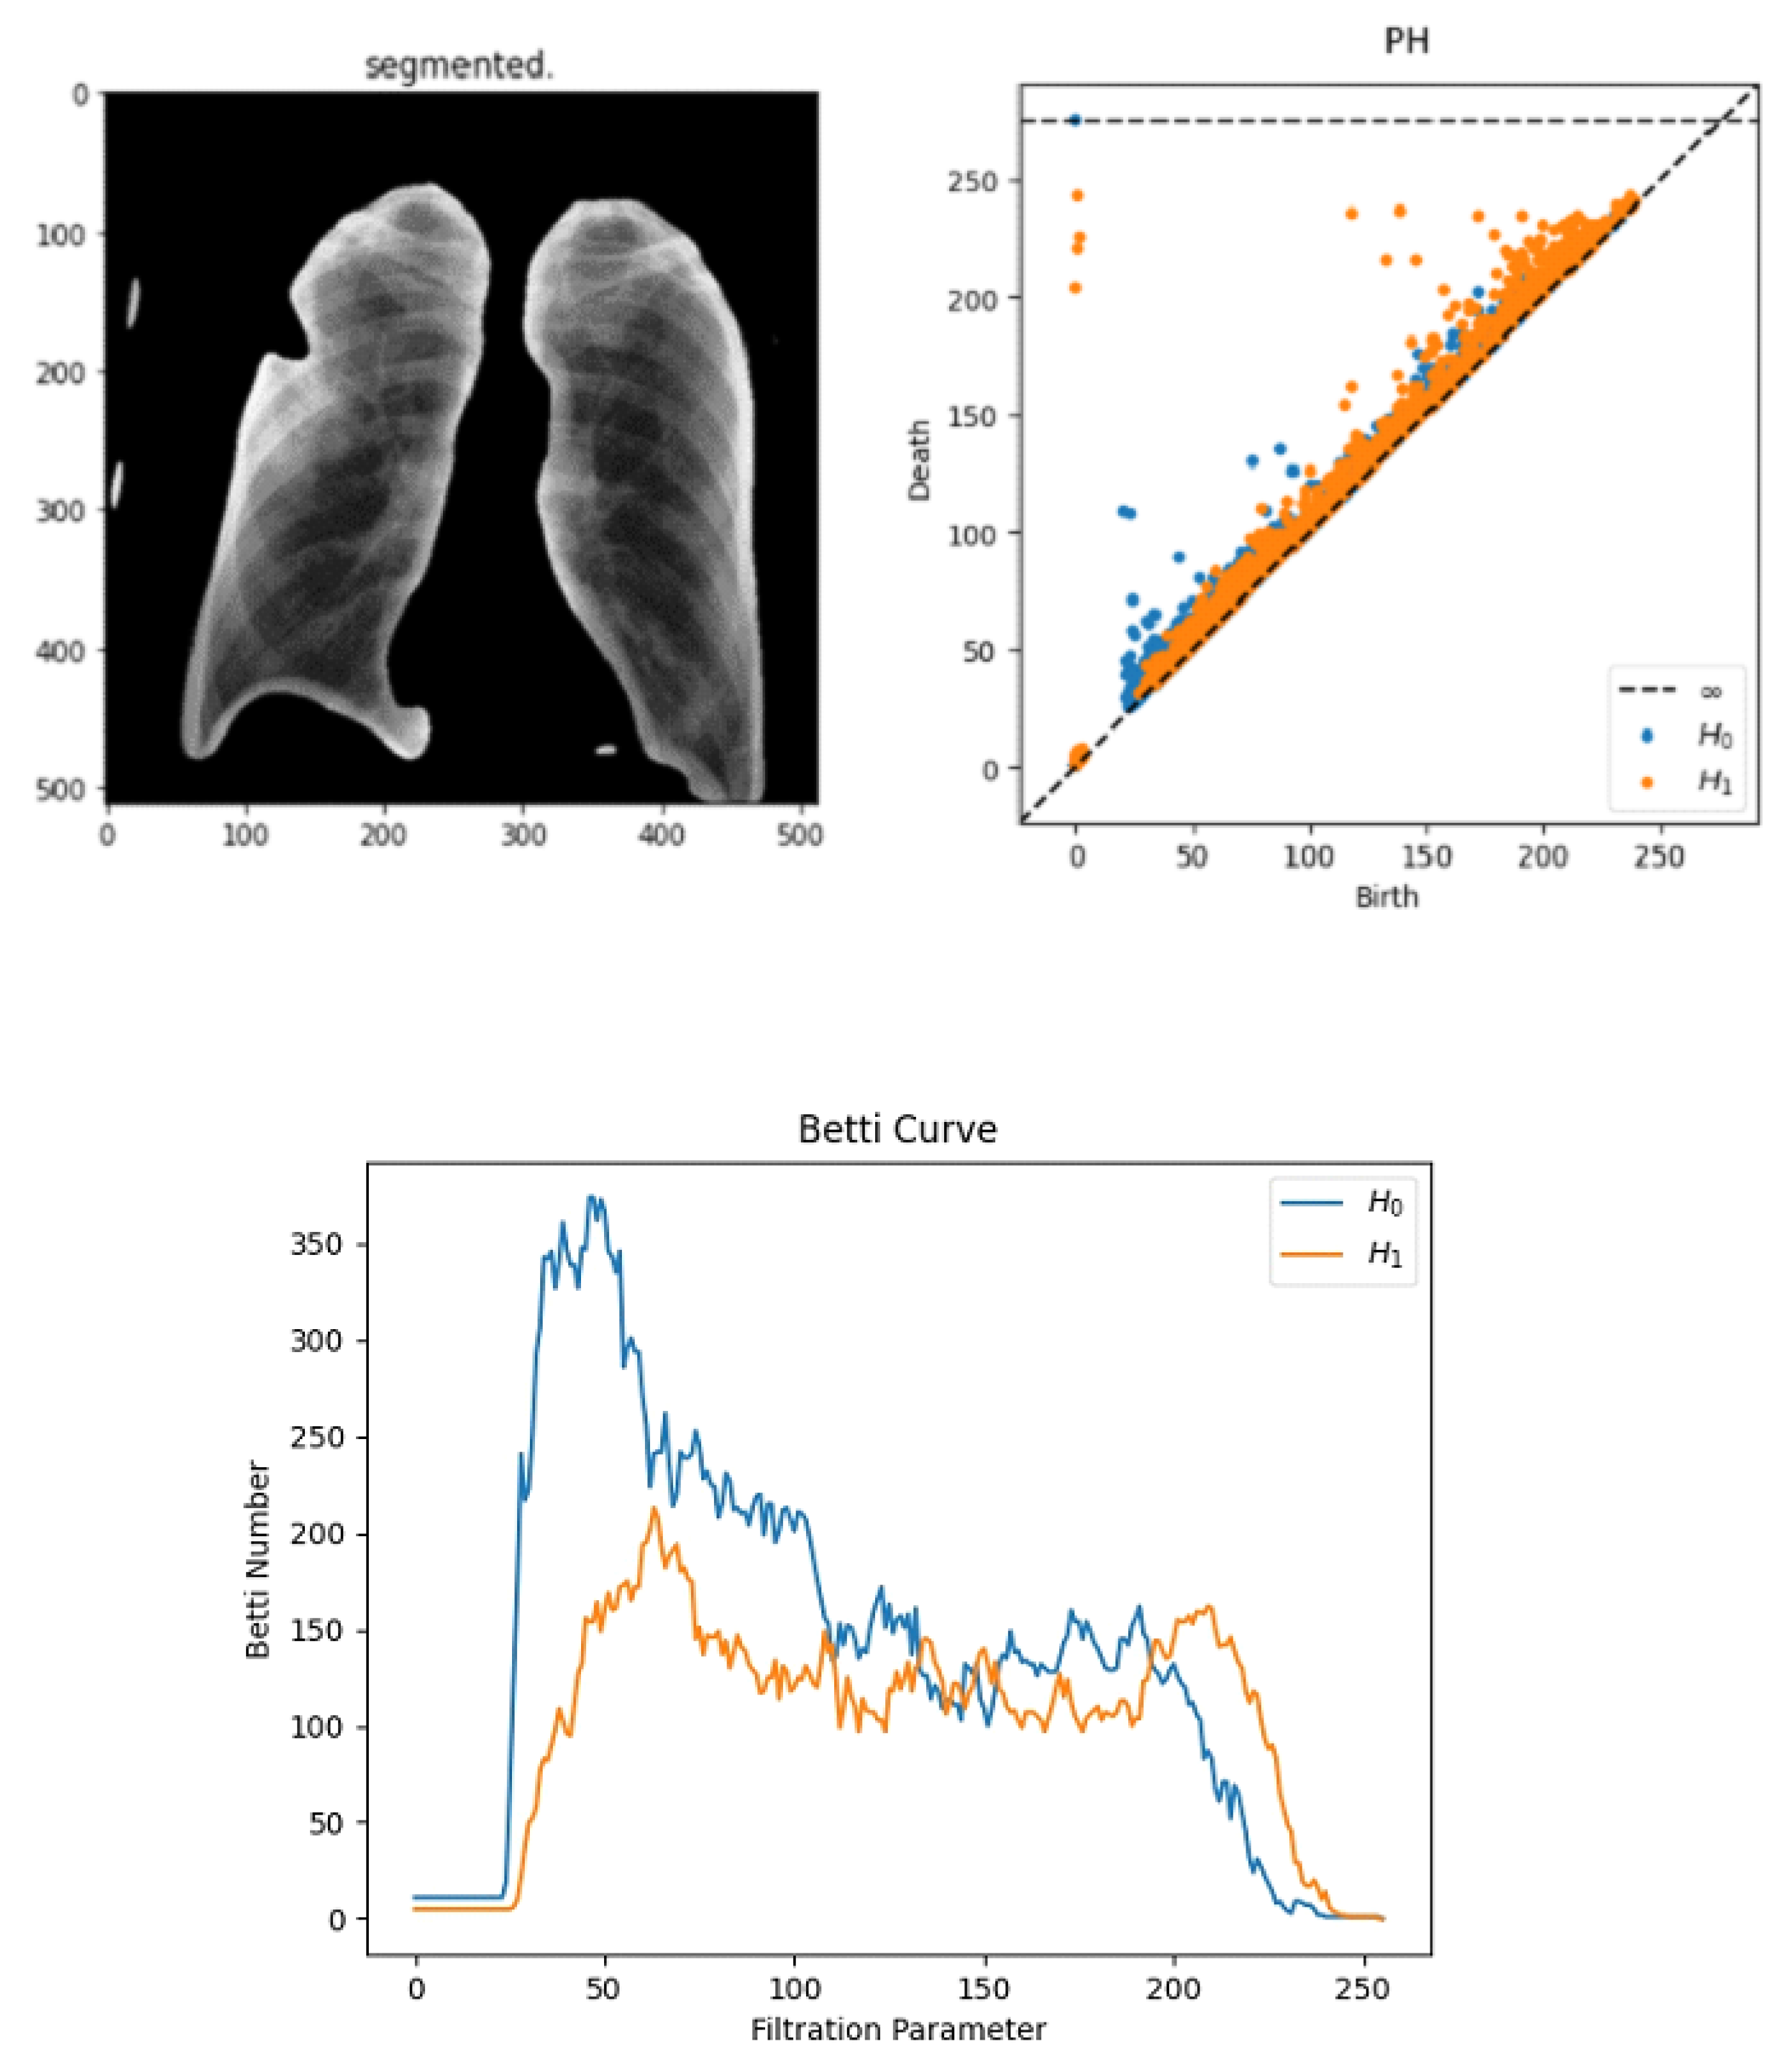
We find that using the modified segmentation-based cropping technique does a good job of containing the lung regions while eliminating unnecessary regions. From the feature extraction technique, we find that persistent homology vectorized as Betti curve features contributes to the overall accuracy. However, the amount of improvement is not large. The reason for this could be that the Betti number (curve) representation of persistent homology is unstable. The proposed model outperforms previously used CNN models (ResNet-50 and VGG16) as well as the final SVM classifier. This is because the proposed model takes advantage of the complementary strengths of each component:
  • Local Spatial Feature Extraction and Translation Equivariance: CNNs excel in extracting local spatial features and textures, crucial for identifying anatomical landmarks and texture anomalies in medical images. Their translation equivariance allows for effective generalization across varying anatomical positions, a common challenge in medical applications [37].
  • Global Context and Long-range Dependencies: Vision Transformers, through self-attention mechanisms, capture global contextual relationships within images, effectively modeling correlations between distant regions. This capability is particularly beneficial for detecting disease signs that may be spread across different parts of the lungs, which can be challenging for purely CNN-based methods [13].
  • Topological Feature Extraction: Persistent homology provides the ability to capture global structural and topological characteristics, including connectivity, holes, and voids, which are not adequately addressed by CNNs or transformers alone. These topological features offer robust descriptors that remain informative despite variations in local pixel intensity or minor spatial perturbations, enhancing discriminative power in clinical imaging tasks [15,39].
In contrast to other architectures, such as attention-gated CNNs and transformer-only architectures, our hybrid approach offers a more comprehensive analysis. Attention-gated CNNs primarily focus on local attention within convolutional feature maps, which may limit their ability to capture global relational information compared with transformers [40]. Transformer-only architectures, while proficient at global context modeling, may struggle with local image structure and require substantial training data to effectively learn localized features [41]. Our approach compensates for these limitations by integrating convolutional layers that efficiently handle local features, thereby creating a robust framework that leverages the strengths of each component.
The severity classification of COVID-19-infected lungs is different from the diagnosis problem, as there is no ground truth for verifying the class. In the case of diagnosis, there are verifiable ground truth tests such as RT–PCR (Reverse Transcription Polymerase Chain Reaction). The lack of such reliable tests makes developing a reliable dataset difficult. For severity classification, human radiologists must label chest X-rays manually. The problem with this approach is the fact that human radiologists subjectively declare the severity of cases. Subjective assessments by radiologists are known to have lower sensitivity because of the difficulty of visual interpretation of signs of disease on chest X-ray [
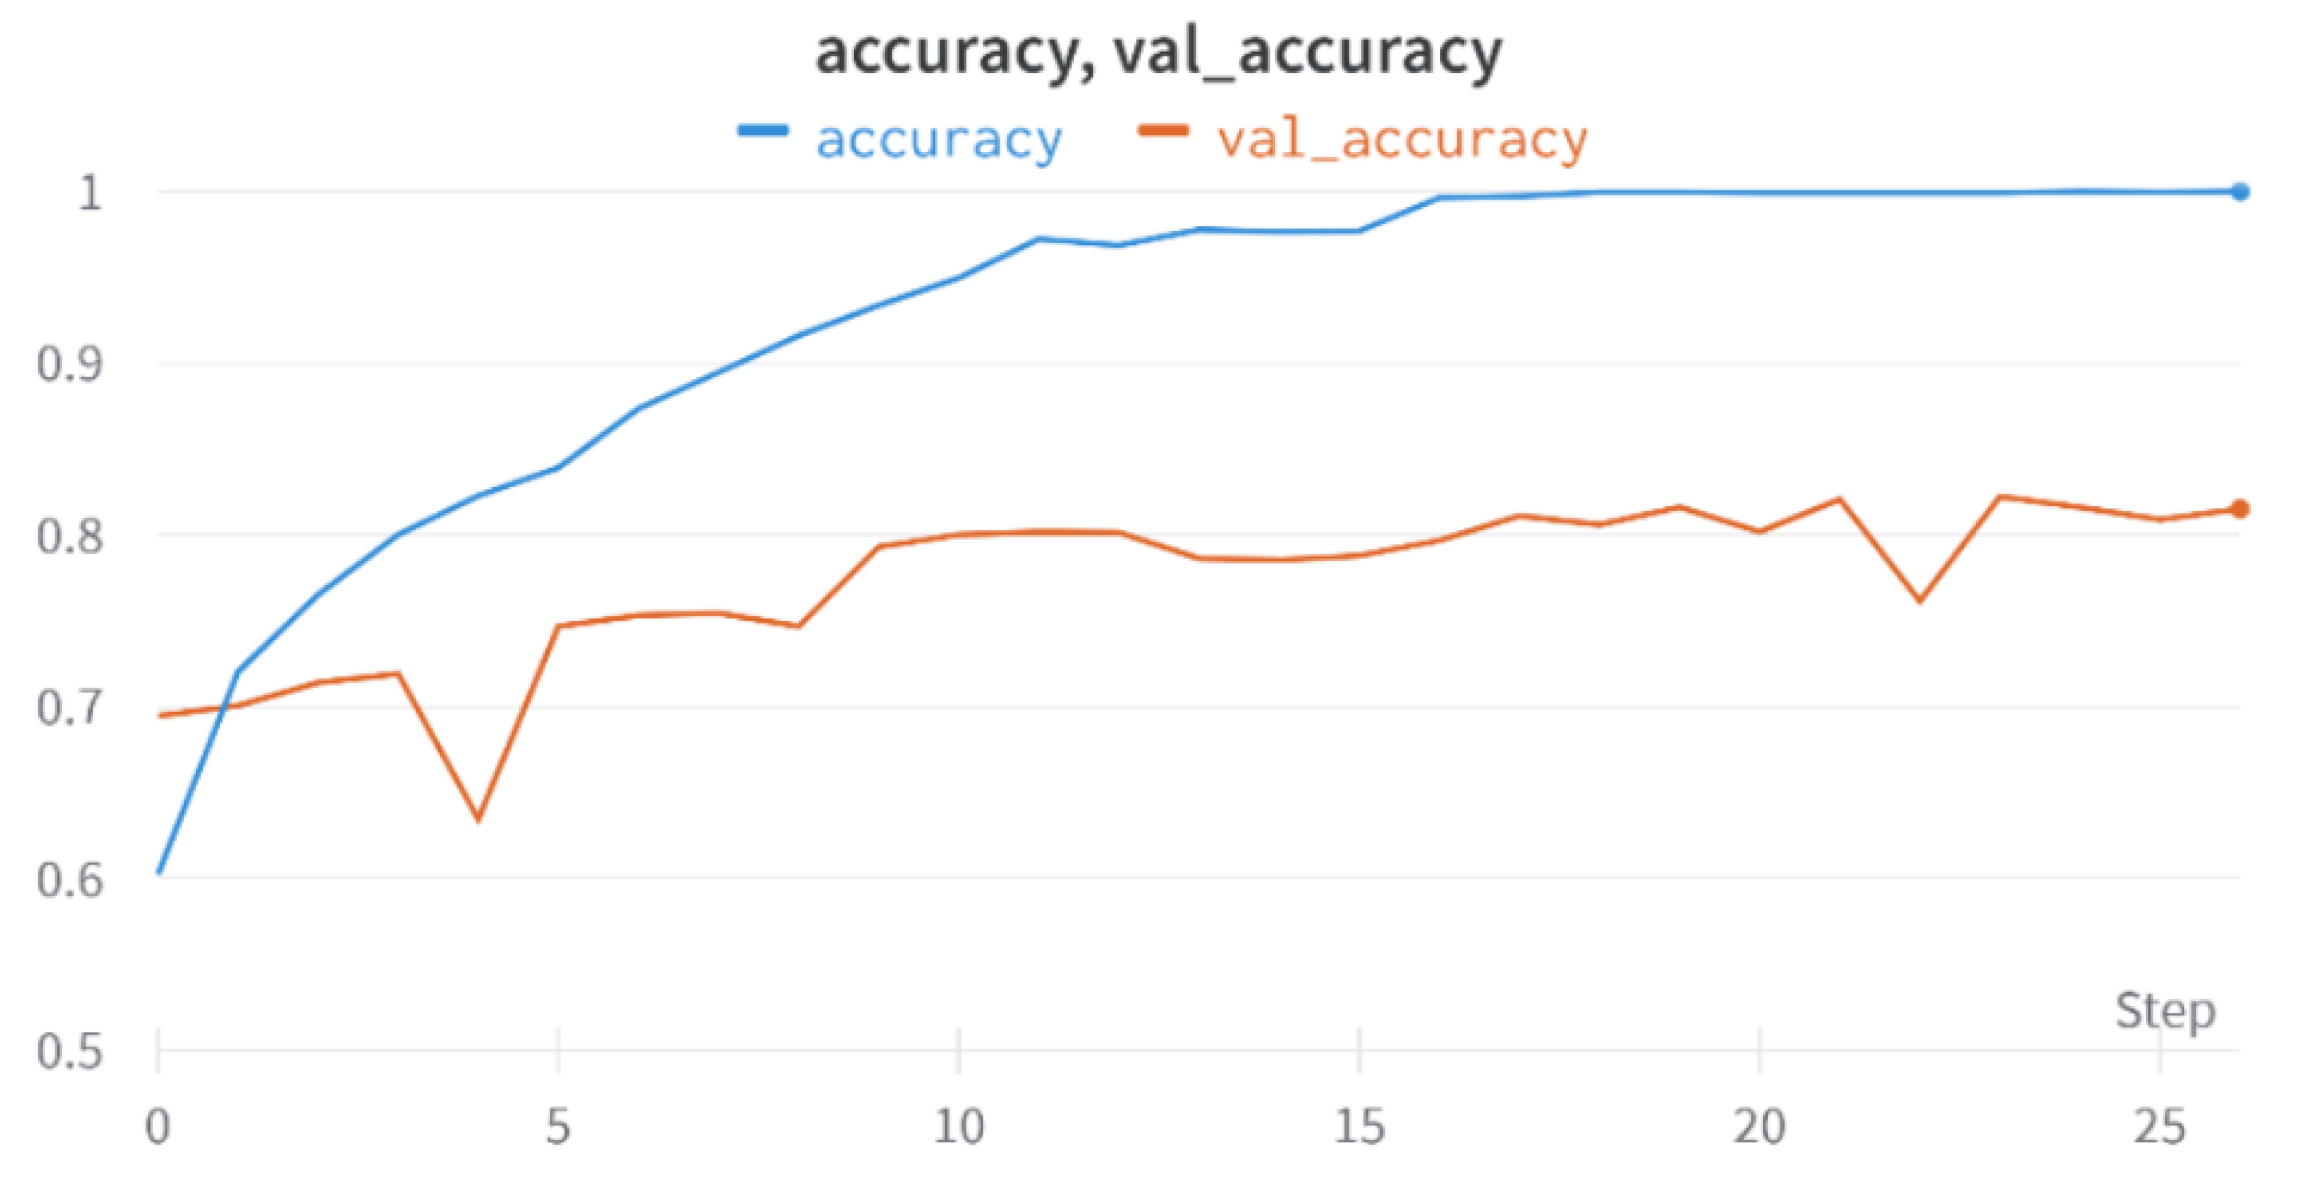
42]. This explains why the performance of the model is not significantly higher (than 83%). However, an improvement could still be made by choosing a more stable representation of homology features with the addition of qualitative information about the features as well (orientation and location, for example). Additional improvements could have been made by including other clinical information in addition to the chest X-ray images.
While our hybrid approach demonstrates significant advantages in classifying COVID-19 severity, it is essential to acknowledge certain limitations and potential areas for further improvement.
Segmentation Techniques: Each segmentation method evaluated presents distinct limitations. Thresholding-based segmentation methods are notably sensitive to image contrast and lighting variations, potentially affecting accuracy in images with severe pathological changes or varying imaging conditions [23]. Conversely, deep learning-based approaches such as U-Net, despite offering detailed segmentation maps, rely heavily on large amounts of precisely annotated training data and may perform suboptimally when encountering previously unseen pathological manifestations [24]. To enhance robustness, integrating ensemble or adaptive segmentation methods that dynamically adapt to different image conditions could be beneficial [30].
Persistent Homology (Topological Features): The use of Betti curves in persistent homology presents inherent instability, particularly under slight variations in data, posing challenges to reliable clinical implementation [33]. To address this, alternative stable representations such as persistence landscapes or persistence images have been proposed and validated in the literature, offering robustness to minor data perturbations and potentially enhancing classification reliability [16]. Future research should explore these stable topological representations to further improve model performance.
Deep Learning Classifiers (CNNs and Vision Transformers): Convolutional neural networks (CNNs), while powerful in extracting local spatial patterns, inherently lack extensive global contextual understanding due to their limited receptive fields [18]. Vision Transformers (ViTs), although capable of modeling global interactions effectively, require substantial datasets and might not capture detailed local patterns adequately [13]. Combining CNNs and ViTs within hybrid architectures like CoatNet leverages the strengths of both local and global feature extraction, yet introduces complexity and computational overhead. Future studies should incorporate detailed interpretability analyses, employing methods such as SHAP and Grad-CAM, to elucidate clearly the specific contributions of CNN-based and Transformer-based features [43,44].
Hybrid Model Considerations: Our proposed hybrid model, combining convolutional, self-attention, and topological methods, naturally faces interpretability challenges due to its complexity. To address this, detailed interpretability frameworks and rigorous sensitivity analyses should be integrated into future research to validate the model’s clinical applicability comprehensively. Moreover, comparative studies against simpler fusion architectures, such as attention-gated CNNs or purely transformer-based models, are recommended to highlight clearly the incremental advantages of our proposed method.
Behavior Under Different Conditions: The model’s effectiveness could vary significantly under different imaging conditions and levels of severity. In particular, severe cases or lower-quality images may pose challenges due to indistinct pathological boundaries. Future work could explore model performance across varying image qualities and acquisition settings to ensure robustness and generalizability in real-world clinical scenarios.

6. Conclusions

In conclusion, effective testing and patient monitoring are crucial in the fight against the pandemic, and imaging techniques such as X-ray and CT scans of the lungs play a vital role in diagnosing and assessing the severity of patients. X-ray imagery is faster, more cost-effective, and widely available, making it an important tool. Machine learning models based on chest X-ray images can assist medical professionals in quickly evaluating the severity of COVID-19 cases. Previous attempts using convolutional neural networks (CNNs) have limitations, but Vision Transformer networks offer improved capabilities for accurately analyzing input images. Topological data analysis techniques can extract important features from chest X-ray images. In this work, a combined network incorporating convolution, self-attention, and persistent homology (TDA) was trained and tested on a labeled dataset. The proposed method outperformed previous approaches, with an accuracy of 82.23% and an average sensitivity of 94.65%. Compared with other segmentation techniques, the cropping technique for lung segmentation yielded better results. Further analysis revealed slight advancements, and applying any segmentation technique improved the classification accuracy by 1.66%. The hybrid model, which incorporates topological features, achieved an additional 1.73% improvement. Future work could explore more stable persistent homology techniques and ensemble models with CNNs. Providing additional input data, such as vital signs, could enhance clarity and reduce subjectivity in the classification of X-ray images.

Author Contributions

Conceptualization, R.A., A.M. and M.P.; methodology, R.A.; software, R.A.; validation, R.A., A.M. and M.P.; formal analysis, R.A.; investigation, R.A.; resources, R.A.; data curation, R.A. and M.P.; writing—original draft preparation, R.A.; writing—review and editing, A.M. and M.P.; visualization, R.A.; supervision, A.M.; project administration, A.M. All authors have read and agreed to the published version of the manuscript.

Funding

This research received no external funding.

Institutional Review Board Statement

Ethical review and approval were waived for this study because it involved the development and evaluation of a machine learning model using a pre-existing, de-identified dataset of chest X-ray images. This study did not involve direct interaction with human subjects, collection of new patient data, or animal testing. The dataset used in the study was obtained from publicly available sources or through collaborations with institutions that had already obtained the necessary ethical approvals for data collection.

Informed Consent Statement

Not applicable.

Data Availability Statement

The study utilized two datasets: the Brixia COVID-19 dataset, available at https://brixia.github.io/ (accessed 30 March 2025), and the COVIDGR-1.0 dataset, accessible at https://github.com/ari-dasci/OD-covidgr (accessed 30 March 2025). The source code for the research, including all the methods and model implementations, is available at https://github.com/redet-G/covid-19-severity-classification (accessed 30 March 2025).

Acknowledgments

We express our sincere gratitude to Asteway Gashaw and Tarekegn Woletaw for their invaluable clinical insights on chest radiography and COVID-19. Their expertise in interpreting chest X-ray images and assessing COVID-19 severity was crucial in validating the model’s results and ensuring the clinical relevance of our research. Their comments and feedback made an immense contribution to this work.

Conflicts of Interest

The authors declare no conflicts of interest.

Abbreviations

The following abbreviations are used in this manuscript:
PHPersistent Homology
COVID-19Coronavirus Disease 2019
TDATopological Data Analysis
CTComputed Tomography
CXRChest X-ray
FFNFeed Forward Network
CNNConvolutional Neural Network
ViTVision Transformer
SVMSupport Vector Machine
RALERadiographic Assessment of Lung Edema

Appendix A

Appendix A.1

Figure A1 shows hyperparameter search results for dense classifiers trained without lung-segmented data. As one can see, the parameters batch size, epochs, learning rate, number of layers, and optimizer have the respective values of 176, 131, 0.0006367, 8, and Adam performs better than the other iterations.
Figure A1. Hyperparameter search for dense classifier.
Bdcc 09 00083 g0a1

Appendix A.2

Figure A2 shows how the two networks are integrated. From the 224 × 224 input image, a topological feature of size 256 × 2 is extracted. The feature is fed into an input layer of the same size, followed by eight 256 × 1 fully connected layers. Finally, the output from the global pooling layer is concatenated with the output of the last layer of the topological feature to be fed into the last fully connected layer.
Figure A2. Architecture of combined classifier.
Bdcc 09 00083 g0a2

Appendix A.3

Figure A3 shows the training history of an iteration with a batch size of 8, a learning rate of 0.000623, and a Stochastic Gradient Descent (SGD) optimizer. The validation accuracy started to cool off its rate of growth around epoch 11. At its highest point (that is, at epoch 23), 82.23% validation accuracy was recorded.
Figure A3. A graph showing the training history of the hybrid model.
Bdcc 09 00083 g0a3

Appendix A.4

Bayesian hyperparameter tuning follows a structured approach based on Bayesian principles. First, a combination of hyperparameter values is selected as an initial belief, and the machine learning model is trained using these values. After training, the model’s performance is evaluated, providing evidence in the form of a score. This evidence is then used to update the belief, refining the selection of hyperparameters in a way that is likely to improve the model’s performance. The process continues iteratively, balancing exploration and exploitation, until a predefined stopping criterion is met—typically when a loss function is minimized or classification accuracy is maximized. Formula (A1) shows the formula for calculating the probability [45].
P ( metric | hyperparameter combination ) = P ( hyperparameter combination | metric ) · P ( metric ) P ( hyperparameter combination )
where the following are used:
  • P ( hyperparameter combination | metric ) represents the likelihood of selecting a particular set of hyperparameters given an observed performance metric.
  • P ( metric | hyperparameter combination ) denotes the posterior probability of achieving a certain performance metric given a specific set of hyperparameters.
  • P ( hyperparameter combination ) is the prior probability of selecting a specific hyperparameter combination.
  • P ( metric ) is the prior probability of achieving that performance metric.

Appendix A.5

Figure A4 shows the hyperparameters used in the experiments.
Figure A4. Hyperparameters utilized in the experiments.
Bdcc 09 00083 g0a4

Appendix A.6

Segmentation-based cropping technique does perform well in making sure no information is lost by the segmentation mask. However, we have noticed that an artifact in the segmentation mask does force the cropping to include unwanted regions of the chest X-ray. In Figure A5, for example, two white spots on the left of the first mask expanded the cropping rectangle, causing it to include the Humerus bone of the right arm. Additionally, in the second image, another artifact on the right side caused it to unnecessarily expand to the right. To overcome this problem, we modified the cropping algorithm to drop needless spots on the mask.
Figure A5. Result of segmentation-based cropping. All images used are part of the dataset.
Bdcc 09 00083 g0a5
The modified segmentation cropping calculates the segmentation rectangle by taking the maximum of the two larger connected components of the segmentation mask to address the issues of unwanted areas being included in the mask by small artifacts. Figure A6 shows that the white spots no longer affect the cropping rectangle. The different regions are colored red and yellow to show how cropping differs between both the original and segmentation-based cropping techniques.
Figure A6. Result of modified segmentation-based cropping. All images used are part of the dataset.
Bdcc 09 00083 g0a6

Appendix A.7

The ROC curve of the hybrid model is shown in Figure A7.
Figure A7. ROC curve of the hybrid model.
Bdcc 09 00083 g0a7

References

  1. Worldometer. COVID-19 Coronavirus Pandemic. 2024. Available online: https://www.worldometers.info/coronavirus/ (accessed on 6 August 2024).
  2. Fang, Y.; Zhang, H.; Xie, J.; Lin, M.; Ying, L.; Pang, P.; Ji, W. Sensitivity of chest CT for COVID-19: Comparison to RT-PCR. Radiology 2020, 296, E115–E117. [Google Scholar] [PubMed]
  3. Jacobi, A.; Chung, M.; Bernheim, A.; Eber, C. Portable chest X-ray in coronavirus disease-19 (COVID-19): A pictorial review. Clin. Imaging 2020, 64, 35–42. [Google Scholar]
  4. Desai, S.B.; Pareek, A.; Lungren, M.P. Deep learning and its role in COVID-19 medical imaging. Intell.-Based Med. 2020, 3, 100013. [Google Scholar] [CrossRef]
  5. Ahuja, S.; Panigrahi, B.K.; Dey, N.; Rajinikanth, V.; Gandhi, T.K. Deep transfer learning-based automated detection of COVID-19 from lung CT scan slices. Appl. Intell. 2021, 51, 571–585. [Google Scholar]
  6. Tuncer, T.; Dogan, S.; Ozyurt, F. An automated Residual Exemplar Local Binary Pattern and iterative ReliefF based COVID-19 detection method using chest X-ray image. Chemom. Intell. Lab. Syst. 2020, 203, 104054. [Google Scholar]
  7. Qi, X.; Brown, L.G.; Foran, D.J.; Nosher, J.; Hacihaliloglu, I. Chest X-ray image phase features for improved diagnosis of COVID-19 using convolutional neural network. Int. J. Comput. Assist. Radiol. Surg. 2021, 16, 197–206. [Google Scholar]
  8. Heidari, M.; Mirniaharikandehei, S.; Khuzani, A.Z.; Danala, G.; Qiu, Y.; Zheng, B. Improving the performance of CNN to predict the likelihood of COVID-19 using chest X-ray images with preprocessing algorithms. Int. J. Med. Inform. 2020, 144, 104284. [Google Scholar]
  9. Tabik, S.; Gómez-Ríos, A.; Martín-Rodríguez, J.L.; Sevillano-García, I.; Rey-Area, M.; Charte, D.; Guirado, E.; Suárez, J.L.; Luengo, J.; Valero-González, M.; et al. COVIDGR dataset and COVID-SDNet methodology for predicting COVID-19 based on chest X-ray images. IEEE J. Biomed. Health Inform. 2020, 24, 3595–3605. [Google Scholar] [CrossRef]
  10. Ismael, A.M.; Şengür, A. Deep learning approaches for COVID-19 detection based on chest X-ray images. Expert Syst. Appl. 2021, 164, 114054. [Google Scholar] [CrossRef]
  11. Saiz, F.; Barandiaran, I. COVID-19 detection in chest X-ray images using a deep learning approach. Int. J. Interact. Multimed. Artif. Intell. 2020, 6, 11–14. [Google Scholar]
  12. Krizhevsky, A.; Sutskever, I.; Hinton, G.E. Imagenet classification with deep convolutional neural networks. Adv. Neural Inf. Process. Syst. 2012, 25. [Google Scholar] [CrossRef]
  13. Dosovitskiy, A.; Beyer, L.; Kolesnikov, A.; Weissenborn, D.; Zhai, X.; Unterthiner, T.; Dehghani, M.; Minderer, M.; Heigold, G.; Gelly, S. An Image is Worth 16x16 Words: Transformers for Image Recognition at Scale. In Proceedings of the International Conference on Learning Representations, Virtual, 3–7 May 2021. [Google Scholar]
  14. Dai, Z.; Liu, H.; Le, Q.V.; Tan, M. Coatnet: Marrying convolution and attention for all data sizes. Adv. Neural Inf. Process. Syst. 2021, 34, 3965–3977. [Google Scholar]
  15. Edelsbrunner, H.; Harer, J. Computational Topology: An Introduction; American Mathematical Society: Providence, RI, USA, 2010. [Google Scholar]
  16. Pun, C.S.; Lee, S.X.; Xia, K. Persistent-homology-based machine learning: A survey and a comparative study. Artif. Intell. Rev. 2022, 55, 5169–5213. [Google Scholar] [CrossRef]
  17. Anwar, S.M.; Majid, M.; Qayyum, A.; Awais, M.; Alnowami, M.; Khan, M.K. Medical image analysis using convolutional neural networks: A review. J. Med. Syst. 2018, 42, 226. [Google Scholar] [CrossRef]
  18. Litjens, G.; Kooi, T.; Bejnordi, B.E.; Setio, A.A.A.; Ciompi, F.; Ghafoorian, M.; Van Der Laak, J.A.; Van Ginneken, B.; Sánchez, C.I. A survey on deep learning in medical image analysis. Med. Image Anal. 2017, 42, 60–88. [Google Scholar] [CrossRef]
  19. Fang, Z.; Lai, K.W.; van Zijl, P.; Li, X.; Sulam, J. Deepsti: Towards tensor reconstruction using fewer orientations in susceptibility tensor imaging. Med. Image Anal. 2023, 87, 102829. [Google Scholar] [CrossRef]
  20. Signoroni, A.; Savardi, M.; Benini, S.; Adami, N.; Leonardi, R.; Gibellini, P.; Vaccher, F.; Ravanelli, M.; Borghesi, A.; Maroldi, R.; et al. BS-Net: Learning COVID-19 pneumonia severity on a large chest X-ray dataset. Med. Image Anal. 2021, 71, 102046. [Google Scholar] [CrossRef]
  21. Irmak, E. COVID-19 disease severity assessment using CNN model. IET Image Process. 2021, 15, 1814–1824. [Google Scholar] [CrossRef]
  22. Blain, M.; Kassin, M.T.; Varble, N.; Wang, X.; Xu, Z.; Xu, D.; Carrafiello, G.; Vespro, V.; Stellato, E.; Ierardi, A.M.; et al. Determination of disease severity in COVID-19 patients using deep learning in chest X-ray images. Diagn. Interv. Radiol. 2021, 27, 20. [Google Scholar] [CrossRef]
  23. Sauvola, J.; Pietikäinen, M. Adaptive document image binarization. Pattern Recognit. 2000, 33, 225–236. [Google Scholar] [CrossRef]
  24. Siddique, N.; Paheding, S.; Elkin, C.P.; Devabhaktuni, V. U-net and its variants for medical image segmentation: A review of theory and applications. IEEE Access 2021, 9, 82031–82057. [Google Scholar]
  25. Ziapour, B.; Haji, H.S. “Anterior convergent” chest probing in rapid ultrasound transducer positioning versus formal chest ultrasonography to detect pneumothorax during the primary survey of hospital trauma patients: A diagnostic accuracy study. J. Trauma Manag. Outcomes 2015, 9, 1–10. [Google Scholar]
  26. Wu, J.; Chen, X.Y.; Zhang, H.; Xiong, L.D.; Lei, H.; Deng, S.H. Hyperparameter optimization for machine learning models based on Bayesian optimization. J. Electron. Sci. Technol. 2019, 17, 26–40. [Google Scholar]
  27. Alkhawaldeh, I.M.; Albalkhi, I.; Naswhan, A.J. Challenges and limitations of synthetic minority oversampling techniques in machine learning. World J. Methodol. 2023, 13, 373. [Google Scholar]
  28. Welvaars, K.; Oosterhoff, J.H.; van den Bekerom, M.P.; Doornberg, J.N.; van Haarst, E.P.; OLVG Urology Consortium, and the Machine Learning Consortium. Implications of resampling data to address the class imbalance problem (IRCIP): An evaluation of impact on performance between classification algorithms in medical data. JAMIA Open 2023, 6, ooad033. [Google Scholar] [CrossRef]
  29. Zhu, M.; Xia, J.; Jin, X.; Yan, M.; Cai, G.; Yan, J.; Ning, G. Class weights random forest algorithm for processing class imbalanced medical data. IEEE Access 2018, 6, 4641–4652. [Google Scholar]
  30. Frid-Adar, M.; Ben-Cohen, A.; Amer, R.; Greenspan, H. Improving the segmentation of anatomical structures in chest radiographs using u-net with an imagenet pre-trained encoder. In Proceedings of the Image Analysis for Moving Organ, Breast, and Thoracic Images: Third International Workshop, RAMBO 2018, Fourth International Workshop, BIA 2018, and First International Workshop, TIA 2018, Conjunction with MICCAI 2018, Granada, Spain, 16–20 September 2018; Proceedings 3. Springer: Berlin/Heidelberg, Germany, 2018; pp. 159–168. [Google Scholar]
  31. Rahman, M.F.; Tseng, T.L.B.; Pokojovy, M.; Qian, W.; Totada, B.; Xu, H. An automatic approach to lung region segmentation in chest X-ray images using adapted U-Net architecture. Proc. SPIE 2021, 11595, 894–901. [Google Scholar]
  32. Alhelfi, L.M.; Ali, H.M. Using Persistence Barcode to Show the Impact of Data Complexity on the Neural Network Architecture. Iraqi J. Sci. 2022, 63, 2262–2278. [Google Scholar]
  33. Johnson, M.; Jung, J.H. Instability of the betti sequence for persistent homology and a stabilized version of the betti sequence. arXiv 2021, arXiv:2109.09218. [Google Scholar]
  34. Waheed, A.; Goyal, M.; Gupta, D.; Khanna, A.; Al-Turjman, F.; Pinheiro, P.R. Covidgan: Data augmentation using auxiliary classifier gan for improved covid-19 detection. IEEE Access 2020, 8, 91916–91923. [Google Scholar]
  35. He, K.; Girshick, R.; Dollár, P. Rethinking imagenet pre-training. In Proceedings of the IEEE/CVF International Conference on Computer Vision, Seoul, Republic of Korea, 27 October–2 November 2019; pp. 4918–4927. [Google Scholar]
  36. Hendrycks, D.; Lee, K.; Mazeika, M. Using pre-training can improve model robustness and uncertainty. In Proceedings of the International Conference on Machine Learning. PMLR, Long Beach, CA, USA, 9–15 June 2019; pp. 2712–2721. [Google Scholar]
  37. He, K.; Zhang, X.; Ren, S.; Sun, J. Deep residual learning for image recognition. In Proceedings of the IEEE Conference on Computer Vision and Pattern Recognition, Las Vegas, NV, USA, 27–30 June 2016; pp. 770–778. [Google Scholar]
  38. Huang, W.; Song, G.; Li, M.; Hu, W.; Xie, K. Adaptive weight optimization for classification of imbalanced data. In Proceedings of the International Conference on Intelligent Science and Big Data Engineering, Beijing, China, 31 July–2 August 2013; pp. 546–553. [Google Scholar]
  39. Dunaeva, O.; Edelsbrunner, H.; Lukyanov, A.; Machin, M.; Malkova, D.; Kuvaev, R.; Kashin, S. The classification of endoscopy images with persistent homology. Pattern Recognit. Lett. 2016, 83, 13–22. [Google Scholar]
  40. Schlemper, J.; Oktay, O.; Schaap, M.; Heinrich, M.; Kainz, B.; Glocker, B.; Rueckert, D. Attention gated networks: Learning to leverage salient regions in medical images. Med. Image Anal. 2019, 53, 197–207. [Google Scholar] [PubMed]
  41. Khan, S.; Naseer, M.; Hayat, M.; Zamir, S.W.; Khan, F.S.; Shah, M. Transformers in vision: A survey. ACM Comput. Surv. CSUR 2022, 54, 1–41. [Google Scholar]
  42. Castiglioni, I.; Ippolito, D.; Interlenghi, M.; Monti, C.B.; Salvatore, C.; Schiaffino, S.; Polidori, A.; Gandola, D.; Messa, C.; Sardanelli, F. Artificial intelligence applied on chest X-ray can aid in the diagnosis of COVID-19 infection: A first experience from Lombardy, Italy. medRxiv 2020. [Google Scholar] [CrossRef]
  43. Lundberg, S.M.; Lee, S.I. A unified approach to interpreting model predictions. Adv. Neural Inf. Process. Syst. 2017, 30, 4768–4777. [Google Scholar]
  44. Selvaraju, R.R.; Cogswell, M.; Das, A.; Vedantam, R.; Parikh, D.; Batra, D. Grad-cam: Visual explanations from deep networks via gradient-based localization. In Proceedings of the IEEE International Conference on Computer Vision, Venice, Italy, 22–29 October 2017; pp. 618–626. [Google Scholar]
  45. Weights & Biases. What Is Bayesian Hyperparameter Optimization? 2024. Available online: https://wandb.ai/wandb_fc/articles/reports/What-Is-Bayesian-Hyperparameter-Optimization-With-Tutorial---Vmlldzo1NDQyNzcw (accessed on 13 March 2025).
Figure 1. Architecture of COVID-19 severity classification methods.
Bdcc 09 00083 g001
Figure 2. Segmentation-based cropping technique. Illustration adapted, with permission, from [25] (accessed on 9 February 2025).
Bdcc 09 00083 g002
Figure 3. The upper right images show the persistence diagram of the image on the left. On the bottom Betti curve, feature representations of the image. Chest X-ray used in the diagram is from the Brixia dataset (Image ID: 733475991908007.dcm).
Bdcc 09 00083 g003
Table 1. Dataset distribution.
DatasetMaleFemaleTotalSeverity Distribution
NormalMildModerateSevere
Brixia327314224695103513851679596
Covid-GDR-1.01902364267610017179
Total5121111114851850675
Table 2. Results of the Segmentation Methods.
Segmentation MethodTraining AccuracyTesting Accuracy
No segmentation0.96300.7849
Thresholding-based segmentation0.99110.7966
Deep learning-based segmentation0.95700.7959
Segmentation-based cropping0.99950.8000
Proposed segmentation-based cropping0.98410.8015
Table 3. Results of classification performance on topological features.
No.FeatureClassifierTraining AccuracyTesting Accuracy
1.Betti curve (H0 + H1)FFN0.73450.6573
2.Betti curve (H0 + H1)SVM0.66260.6586
3.Betti curve (H0)FFN0.69280.6239
4.Betti curve (H1)FFN0.74430.6027
Table 4. Experimental results for the CoatNet and ResNet50 classifiers on 224 × 224 input images.
No.ClassifierTraining AccuracyTesting AccuracySensitivity
MildModerateSevere
1.CoatNet10.80500.92890.92130.8734
2.ResNet500.96430.80170.95260.97050.9494
3.VGG-160.98410.80150.96050.93800.8382
Table 5. Summary of All Experimental Results.
Method/FeatureTraining AccuracyTesting Accuracy
Segmentation Methods
No segmentation0.96300.7849
Thresholding-based segmentation0.99110.7966
Deep learning-based segmentation0.95700.7959
Segmentation-based cropping0.99950.8000
Proposed segmentation-based cropping0.98410.8015
Classification on Topological Features
Betti curve (H0 + H1) - FFN0.73450.6573
Betti curve (H0 + H1) - SVM0.66260.6586
Betti curve (H0) - FFN0.69280.6239
Betti curve (H1) - FFN0.74430.6027
Deep Learning Classifiers (224 × 224 Images)
CoatNet1.00000.8050
ResNet500.96430.8017
VGG160.98410.8015
Overall Experimental Results
Hybrid (Betti curve + CoatNet)0.99990.8223
Hybrid (Betti curve + CoatNet) - SVM0.95820.7912
Table 6. Results of hybrid model evaluation by severity level.
No.Severity LevelSensitivityPrecisionF1-ScoreAUC
1.Mild0.96920.870.870.96
2.Moderate0.94600.710.790.90
3.Severe0.92430.960.820.98
ROC AUC (One-vs-Rest):0.9431
Disclaimer/Publisher’s Note: The statements, opinions and data contained in all publications are solely those of the individual author(s) and contributor(s) and not of MDPI and/or the editor(s). MDPI and/or the editor(s) disclaim responsibility for any injury to people or property resulting from any ideas, methods, instructions or products referred to in the content.

