1. Introduction
Governments all around the globe have established climate change policies and regulations to minimize the human footprint on the planet, such as those in Europe [
1]. These general frameworks and directives directly translate into country-specific measures: for instance, in Spain, this results in specific regulations for the electricity market [
2]. These regulations put the focus on all of us as individual citizens, so that we become active participants in the energy transition [
3], taking advantage of new technologies to reduce our bills and actively participating in the market. At the same time, governments pay special attention to protecting vulnerable consumers.
With electrical energy prices on the rise, we try to minimize our electric bills, either by opting for the most advantageous tariffs on the market or (and) by installing renewable-energy-based home systems intended for self-consumption, either as a complement to grid electricity or as the sole energy supply mechanism. In this research, we do not consider the latter, since its use is still marginal around the world and in Europe, even in Spain (with many daily sun hours), where barely 0.1% of residential properties benefit from them [
4] (we may note, however, that some authors suggest this situation may change in the near future [
5,
6], despite the challenges to overcome [
7]). Instead, we focus exclusively on electrical grid energy, as it statistically accounts for most of the energy used in residential settings.
While all tariffs of countries belonging to the European Union (EU) must comply with EU regulations, and despite significant efforts in market integration and regulatory harmonization, electrical supply regulation still varies depending on each country to adapt to its energy generation particularities and the climate and weather impact on them, resulting in different prices for consumers [
8,
9]. In this regard, the EU periodically publishes statistics on electricity prices for household consumers in Europe (for instance, see [
10] for the first half of 2023) and general reports on European electricity markets [
11] (also see [
12] for Q4 2022). Given the above, we focus on Spanish regulation, which is almost identical to Portugal’s.
In Spain, there are free and regulated market tariffs. For both markets, the government sets the base rate for the electricity supply, which is either directly paid by the user in the regulated case or baked into the company’s expenses offering free market tariffs. While specific analysis of the market, individual households and consumption habits is necessary, opting for the regulated market and directly paying for the government rate, intended to protect the most vulnerable consumers and users, is usually the cheapest alternative for household electricity use, even if eventual offers look attractive in the short term. As of November 2023, the name for this regulated tariff is Precio Voluntario para el Pequeño Consumidor 2.0 TD (voluntary price for the small consumer; PVPC from now on). It is a market-linked and, since June 2021, hour-dependent tariff that accounts for the amount of variable energy consumed during each billing period (usually one to two months). It was introduced in 2013, and, since April 2014, Red Eléctrica (the national electricity grid operator) calculates these prices for the next day and publishes them daily on its website at around 20:15 [
13]. Several alternative websites can be used to gather this very same information, such as Tarifaluzhora [
14] or Energía Gurú [
15]. As we previously stated, this tariff is often the most economical alternative even if the user does not restrict all their electrical consumption to the cheapest hours of the day and has no incentive if most energy usage is concentrated in these periods, which is not always easy, since those periods usually encompass night and early morning hours.
In this study, we present a fully functional prototype capable of managing and supplying electricity for home use at its minimum daily cost. Our system scrapes hourly tariff prices for the next day directly from the official channel (Red Eléctrica website in the case of Spain), charging a battery system only during the cheapest hours for that day and supplying electricity to the home energy system from the cheapest hourly source, either the battery or the main grid. The battery system is designed to have enough capacity and power output to supply energy for a whole day of use. We also establish a comparison between our prototype and a simpler scheduler to operate and charge the battery system.
2. Materials and Methods
Our smart electrical system has two main functionalities: storing electrical energy at its cheapest daily rate and allowing the user to use electricity at its lowest instant price, either from the energy stored in the battery or directly from the grid.
It may seem surprising that drawing energy directly from the battery, which is charged at the cheapest daily rate, can be more expensive than obtaining it directly from the grid. However, there are three scenarios in which this can occur (we elaborate on these further in the System Architecture section):
When the battery is charging: During battery charging time slots (where a slot is equivalent to one hour), electricity is already at its minimum price; therefore, it is more efficient to cover any instant demand directly from the grid.
When efficiency losses offset the energy price difference: Even if the instant energy cost from the grid is theoretically higher than when the battery is charging, not all energy stored in the battery can be retrieved. This results in a higher actual cost for battery-stored energy. The percentage of energy stored in a battery that can later be recovered is known as round-trip efficiency.
When the battery energy cost offsets the grid energy cost: Batteries have a limited life (they lose capacity over time), which is typically measured in charge cycles (a full cycle meaning discharging from 100% to 0% and then recharging to 100%). Therefore, using energy from the battery (and consuming part of its life) may turn out to be more expensive than drawing energy from the grid.
These are the reasons why a system like ours is necessary to make this proposal financially viable, as a simpler solution, like a regular programmable scheduler for off-peak charging and free on-demand use (similar to the ones used with a hybrid inverter charger in backup-only or time-based control modes [
16,
17,
18]), would not suffice.
2.1. System Architecture
Our system encompasses several key subsystems: the system core (called SRC, consisting of three AC smart relays and a network-enabled electronic microcontroller), a (usually pre-existing) local network with internet access and an AC-coupled battery energy storage system (BESS).
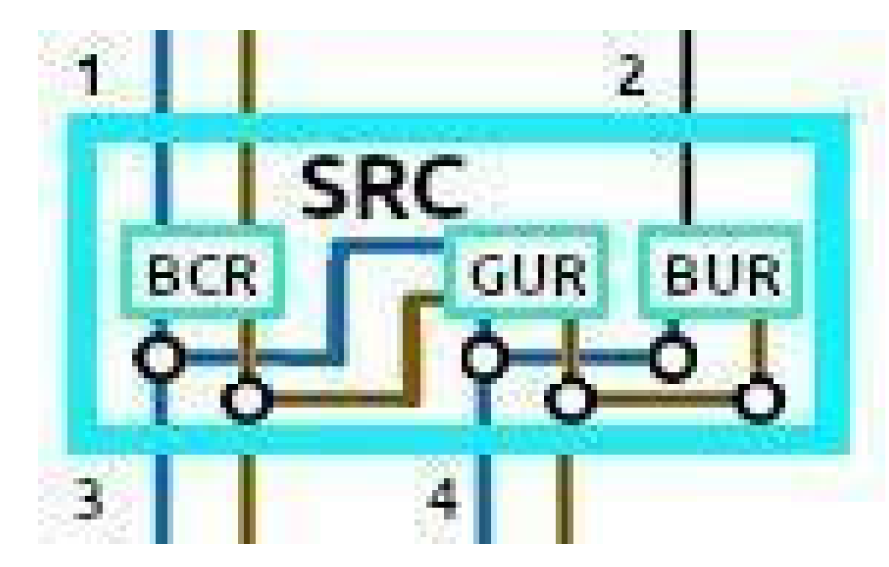
Smart relays are electronic switches that allow energy to flow from the electrical grid into the storage system (for battery charging), from the storage system to the household electrical system (for battery energy use) and from the city grid to the household electrical system (for grid energy use). We call them the battery charging relay (BCR), battery use relay (BUR) and grid use relay (GUR). The term “relay” could also be substituted with “contactor”, since we are working with high loads (above 15 A).
To ensure the reliability of the system, we can use relays rated for up to 100,000 electrical cycles at full load [
24,
25], which exceed the operational requirements of the system. Features such as arc suppression are implemented to minimize contact wear and optimize longevity.
The electronic controller directly operates all three relays, and the main innovation of our system lies precisely in how it does so: On the one hand, to allow for battery charging, it closes the BCR during the n-cheapest hours and keeps it open for the rest of the day. The value of n can be set up, allowing us to balance savings from obtaining the cheapest prices (lower n value) with the costs of more peak power needed (the shorter the charging period, the more power is required to fully charge the battery).
On the other hand, to allow for stored energy usage, the controller closes the BUR only when using stored electricity is truly cheaper than taking it directly from the grid. To do so, the controller uses the grid’s hourly energy cost, its corrected efficiency cost and the battery energy cost (see the System Costs section for definitions). If this condition is not met, the BUR remains open, and the GUR is closed to allow for direct grid energy use.
Table 2 summarizes the logic states of the relays.
The electronic controller obtains the cheapest energy rates for the day from the website of the national energy provider (there are also third-party websites that publish this information in case the former is unavailable for any reason) [
14,
15,
26]. It then performs calculations to establish BCR, BUR and GUR scheduling for that day:
BCR is closed (energy can flow from the grid to the battery, charging it up; note that the battery will only charge if its current capacity is lower than its maximum capacity) during the n cheapest energy hours. n is the number of time slots (each slot equals one hour) required to fully charge the battery from 0 to 100%. It depends on the battery pack and can be set by the user. We elaborate on this further in the following sections, as several aspects need to be considered (economic benefit, peak power, impact on battery life, etc.). BCR remains open (energy flow from the grid to the battery is interrupted) during all other time slots.
BUR is closed (energy can be recovered from the batteries and converted back to AC for home use) during time slots (remember, 1 slot = 1 h) when the corrected efficiency cost plus battery energy cost are lower (cheaper) than the current energy price. The corrected efficiency cost is the official energy cost for that time slot (as obtained from the energy authority website) adjusted (increased) to account for losses due to the process of storing and retrieving energy to/from the batteries. The battery energy cost is the cost to battery life incurred during this store/retrieve process. Both costs are added together and must be lower than the current grid energy cost for that slot (otherwise, we would be losing money). BUR remains open (energy flow from the battery to the home electrical system is interrupted) if this condition is not met.
GUR is mutually exclusive with BUR (logically and electrically): It is closed (energy flows from the city grid to the home energy system) when the BUR closing condition is not met, that is, when the corrected efficiency cost plus battery energy cost are higher (more expensive) than the current energy price. It is also closed when battery reserves are insufficient, regardless of energy cost. It is open otherwise. See the System Costs and System Benefits sections for more details regarding the logic behind the BUR and GUR relays.
To ensure uninterrupted electricity supply, the system will prioritize direct grid usage when battery reserves fall below a predefined threshold or during battery charging, as outlined in
Table 2.
BCR, BUR, GUR and the controller are encapsulated in a single device that we call Smart Relays and Controller (SRC) and form the core of our system (note: SRC also stands for “source”, hence the wordplay in the manuscript’s title). SRC is connected to the grid and to both the input and output of the BESS. The AC-coupled BESS system is not directly connected to our household grid, as SRC now properly regulates energy flow.
Figure 1 shows a simple internal wiring diagram of SRC and its relays. Other components, including the controller, power electronics and their connections, are not depicted. All connections shown are AC: 1 goes to Hybrid inverter AC in, 2 comes from inverter AC out, 3 connects to the city grid, and 4 connects to home electrical systems. Please note that GUR and BUR cannot be closed at the same time, as they control different power sources for the house wiring.
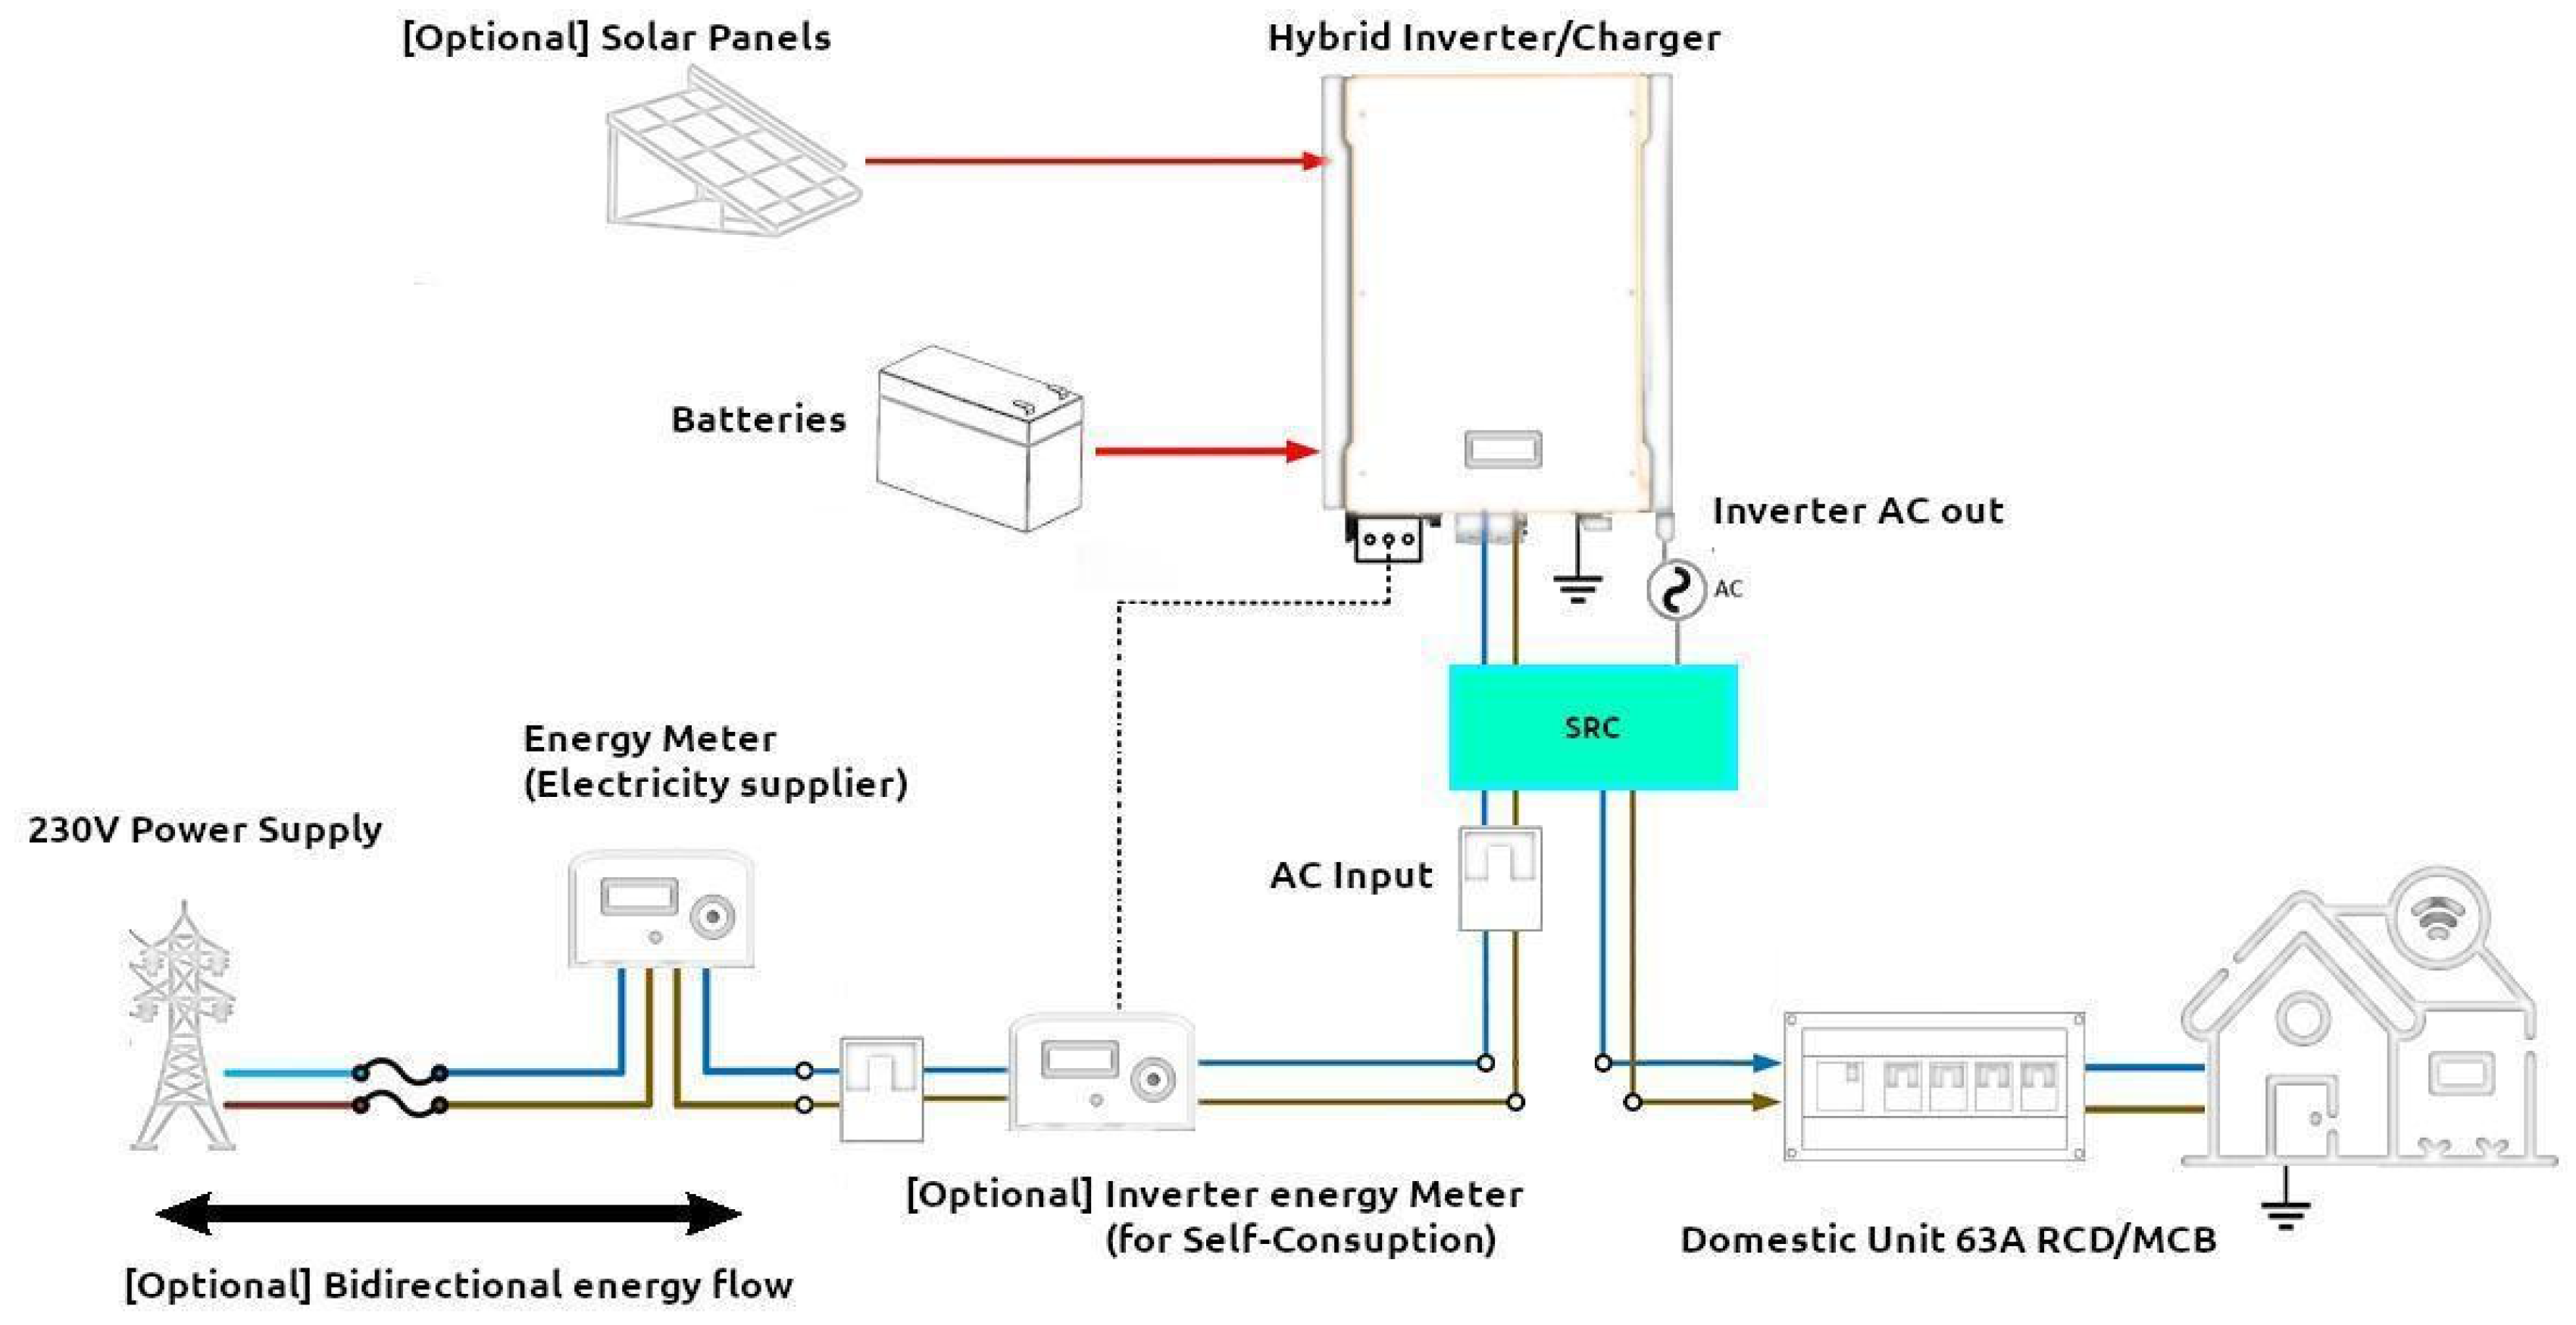
Figure 2 depicts the integration of our proposal with the typical home wiring (solar panels are optional). SRC is ready for installation by a qualified electrician without modification of any other component of the electrical system.
2.2. Implementation
We implemented the controller using an ESP32 board equipped with a Wi-Fi module to connect to a local network with internet access, but other boards or manufacturers (such as Raspberry Pi) would suffice. Since the rates are published once a day and are valid for the entire following day, only one connection per day is necessary to obtain this information.
BCR, BUR and GUR are dry-contact, high-power (63 A), latching smart relays. Their communication with the controller is established via the I2C wire protocol, and the controller connects to the user’s local network via ethernet or Wi-Fi (we discarded other low-power, short-range connectivity protocols like Bluetooth to minimize connection range issues). An internet connection is mandatory for the system to function, as it must download the electricity prices to operate properly.
Local network credentials and the URL for obtaining daily electrical rates can be set up using our app. They can also be manually configured by editing the main .xml configuration file if the user has technical knowledge, but this is not recommended.
The AC-coupled BESS is the last component of our system. A BESS consists of battery cells arranged in modules that form a battery pack and an energy center encompassing a charger module (with a step-down converter, a rectifier and other components) to convert AC to DC, along with a charge controller to charge the batteries and a DC-AC inverter to make stored energy usable again through the home electrical network. The term “AC-coupled” refers to the fact that the BESS is ready for use with an existing AC infrastructure, meaning it has AC inputs/outputs and works as a “plug-and-play” solution for the existing home AC network.
The BESS must be properly sized to provide enough electric power for a whole day of average use. This makes it dependent on each user’s particular situation. From an economic point of view, this is the key component of the system, as it is the most expensive part, and its high price has been the reason why systems like ours have never been profitable in the long run—until now.
The BESS can also be used to benefit from renewable energies (e.g., solar panels) if available, although this is not the focus of our research. In fact, both the BESS and the network infrastructure may already be part of the user’s home infrastructure, in which case the SRC unit would be the only necessary component for integration.
2.3. System Costs
To assess the economic feasibility of our system, the AC-coupled BESS (which includes the batteries and the required energy center with the electric and electronic devices needed to make it usable) is the key element due to its high cost (the cost of all other components is negligible in comparison and is amortized even during the first few months of using our solution). Additionally, most of the cost comes from the battery pack itself, which is also the component most likely to fail first (with a specified number of charging cycles under warranty and a 25+ years life expectancy). As previously mentioned, the BESS must be properly sized to provide enough electric power for a full day of average use.
Current advances, especially due to the electric car and renewable energy use, have flooded the market with several viable solutions [
27]. Any technology for energy storage is valid as long as it has no memory effect (which would heavily degrade battery life due to partial charging cycles like those experienced in a home-use setting).
To assess BESS technical specifications and cost, we must first establish what we consider the standard home electricity requirements to be—that is, how much electric power we use during the day and the maximum peak power needed [
28,
29,
30]. We set these values as the required amount to cover all daily electrical needs of a 90 sqm home with an electric water heater, electric cooker and oven, where 3 adults or 2 adults and 2 children live together. After performing calculations using several online tools offered by electrical energy providers and other third parties [
31,
32,
33,
34], we concluded that we would need a maximum of 4526 kWh/year, or 12.4 kWh/day. For peak power, according to those same tools, a value between 4.6 kW and 5.75 kW is recommended; therefore, we took 4.7 kW, which is already on the lower end of the interval.
Table 3 and
Table 4 show details of several off-the-shelf AC-coupled BESSs that meet these requirements, including their warranty and cost (data are split into two tables for readability) [
35,
36,
37,
38]. We originally obtained these data after performing quick Google searches in June 2022, but we updated the prices to reflect the current market value (which is around 20% higher than what we originally found). Please note that this list is not exhaustive; the tables contain just a selection of BESS solutions that fit our requirements based on the first few pages of results that Google offered when searching for “battery system for home”.
Once we know we have several BESS options to choose from, and in order to properly assess and analyze our system costs, we must consider efficiency losses and battery life.
Regarding efficiency losses, energy is lost when charging the batteries—specifically when converting AC to DC (charging efficiency), when retrieving energy from the batteries (round-trip efficiency; not all stored energy can be retrieved) and when converting retrieved DC energy back to usable AC energy (inverter efficiency) [
39].
According to product vendors, all the presented (and most commercial high-end) BESSs offer a total round-trip efficiency slightly above 90% and charging and inverter efficiency above 97.5%. These values are Euro Efficiency, an average operating efficiency over a yearly power distribution corresponding to a middle-European climate, and are the referenced value on almost any inverter/hybrid inverter datasheet. It is considered a more useful metric than peak efficiency [
40].
While these values have been verified to be realistic in several studies [
41,
42,
43,
44], we propose to follow a “worst-case scenario” approach to analyze the economic viability of our system. As such, we are considering values lower than those: 96% for battery round-trip efficiency, 97% for both charging and inverter efficiency, and thus a total system efficiency of 90%.
Regarding battery life, it is well known that battery capacity degrades with each charge cycle, and degradation is accelerated with fast charging or when charging/discharging the battery beyond certain thresholds. Conversely, slow and partial charging can significantly extend battery life [
45,
46,
47].
Battery life is measured by the maximum capacity retained after n cycles (one cycle being a full discharge and a full charge). Vendors provide these values in their product datasheets and offer warranties (i.e., a replacement for the failing battery pack) if any of these values are not met under normal usage conditions, which are also specified in the warranty (usually limited to one cycle per day).
By applying our worst-case policy, we strictly follow the vendor’s warranty regarding battery life and assess our system’s validity (i.e., the battery retains enough capacity) and profitability assuming the battery pack fails right after the warranty period expires. Furthermore, we do not consider any optimization techniques (other than those already implemented by the vendor and considered when offering their warranties). This approach ensures that if the battery fails during the warranty period, we are fully covered, and if it fails afterward, our system will have already (at least) paid for itself. Any extra time the battery lasts for while retaining sufficient capacity, or any additional battery life optimization techniques we use, will only increase the profitability of the system.
To achieve this, we define a battery cycle cost (EUR/cycle) as the total cost of the battery pack (EUR) divided by the number of cycles covered by the vendor’s warranty. This value allows us to establish a metric called the battery energy cost, measured in EUR/kWh, which is calculated by dividing the battery cycle cost (EUR/cycle) by the battery’s maximum usable capacity (kWh). Costs related to electrical installation or the acquisition of a hybrid inverter are not included in our calculations, as, unlike batteries, these should be a one-time payment due to their significantly higher life expectancy [
16].
Table 4 shows the warranty details for each BESS depicted in
Table 3 and calculates these metrics for each of them.
We are also not considering any European or national subsidies or incentives to reduce BESS acquisition and installation costs [
48,
49,
50,
51], as these are usually tied to photovoltaic or concentrated solar power (CSP) installations [
52,
53]. However, we mention them, as their existence could make our proposal even more attractive in such situations, as costs could be reduced by 30–40% in some cases [
54,
55].
Additionally, we do not account for any potential discounts from the manufacturer when purchasing several battery modules for a BESS. This could be a very interesting option for a building of apartments, where the roof could be equipped with solar panels, and the whole community could benefit from a hybrid solar–grid electricity supply.
In the next section, we establish a comparison between the battery energy costs and the energy savings offered by our proposal over time (in years) to assess the validity of the system. We also compare our system’s economic performance with that of a simple scheduler (timer) used with a hybrid inverter charger.
2.4. System Benefits
The most straightforward benefit of our system is economic: if we can gather cheap energy from the grid and use it when energy is more expensive, we will (or should) be saving money. There are also several side benefits, such as keeping us green (off-peak energy comes mostly from renewable sources that have minimal environmental cost compared to fossil fuels or nuclear energy) or increasing the electrical resilience of our system (offering increased protection against short circuits, overloading or supply interruption).
The economic benefit is the most relevant for our research; therefore, we must prove that our system is really economically viable. We have to consider both energy and power as described for the PVPC tariff [
26].
2.4.1. Energy
The main objective of our system is being able to store cheaper and greener energy from the grid during the cheapest off-peak time slots (one slot equals one hour) to later use it during peak (more expensive) time slots. Most (if not all) benefits of our proposal will come from this feature alone, but implementing it is not as straightforward as it seems.
PVPC establishes three time frames for energy prices: peak (most expensive, 8 h a day Monday to Friday, from 10:00 to 14:00 and from 18:00 to 22:00), flat (8 h a day Monday to Friday, from 8:00 to 10:00, from 14:00 to 18:00 and from 22:00 to 0:00) and valley (cheaper, Monday to Friday, from 0:00 to 8:00, and every hour of weekends and public holidays) [
26]. For a given day, the peak hourly energy prices in EUR/kWh are always higher than flat prices, and flat prices are higher than valley prices.
However, we must consider several pitfalls:
There can be a wide difference between prices within each of these time frames for a given day (e.g., electricity can cost EUR 0.05/kWh at 3:00 and twice that amount at 4:00—or the other way around—even if both slots belong to the valley period).
Cheaper energy prices occur at different times depending on the day (e.g., electricity may be cheapest at 5:00 a.m. on a given Saturday and at 18:00 the following one).
Electricity prices can vary a lot from day to day, both within a period (i.e., peak prices for one day can be much cheaper or more expensive than peak prices for the previous day) and between periods (i.e., peak prices for one day can actually be lower than off-peak prices for the previous day).
Additionally, it is important to consider that off-peak energy stored in batteries and subsequently recovered does not necessarily have to be cheaper than peak energy costs, as explained in the previous section: we incur losses when converting energy from AC to DC for storage (charger), losses when recovering energy from the battery (round-trip) and losses when converting DC back to AC (inverter). This means that we cannot simply compare off-peak and peak prices directly; we have to account for these losses, which is what our system does.
These are the reasons why a regular timer or scheduler (store energy in batteries at valley slots, use it until drained during peak and flat slots) may not suffice and the reason why we include calculations for it in our experiments to establish a comparison with our system.
2.4.2. Power
In Spain, users must pay a fixed amount depending on the maximum power they are able to instantly draw from the grid during a billing period. In the PVPC tariff, the user chooses (and pays) for peak power during two different periods: off-peak periods (Monday to Friday from 0:00 to 8:00 and all hours during weekends and public holidays) and peak periods (the rest of the time). The more power they want or need, the more they pay [
26].
We can save money by properly adjusting peak and off-peak power to meet our actual needs. To do so, we must first understand that instant maximum power is not really an instantaneous (say, milliseconds) measurement of the power used but the average power during a given time frame. The current smart meters follow Spanish UNE 20.317 [
56], which establishes by how much time the user can exceed their maximum power before supply is interrupted. For instance, power can be 1.5 times higher for an interval of 10 s to almost 2 min (depending on the company), and it can be 1.15 times higher even for hours. On top of that, companies also check for maximum quarter-hourly power, which is the average maximum power in 15 min intervals, starting at 0:00. There will be no additional interruptions as long as this value is not above the maximum power. Users can check the maximum power they really used during a given billing period (this is included in the monthly bill) and try to manually adjust (lower) the maximum power they pay for.
In our experiments, we will consider all of these factors to optimize maximum power during both peak and off-peak periods. We can empirically obtain the real maximum peak and off-peak power for a relevant period of time (more than two years) and adjust the maximum power we pay for accordingly. This directly translates into our system needing lower peak power (since we optimize it to real values) and much higher off-peak power (which we need to top up batteries, but it is much cheaper than peak power). The possible losses or savings in this regard will be much lower than those of energy, but they must be accounted for nonetheless.
2.5. Experiments
To properly assess the validity of our proposal, we compared the real costs and savings of our system with those of the PVPC tariff for as long as it has been in place (from June 2021 to September 2023). To do so, the first thing we needed was real and accurate historical hourly data for both prices and demand from the electricity market.
For the price, we obtained the historical hourly PVPC 2.0 TD tariff (in EUR/kWh) for this period of time from the eSios website [
57] (eSios is Red Eléctrica’s system that performs information and process management tasks specifically related to the electricity market in Spain).
Regarding demand, this website also offers hourly data for real electrical energy demand (in MWh) along with its associated PVPC cost, but it does so for the entire Spanish electricity market with regulated prices, and we are interested in consumption patterns just for the average home user with the PVPC 2.0 TD tariff. While it is impossible to establish a universal hourly electric demand for homes in Spain due to their heterogeneity, we can greatly benefit from the way Red Eléctrica estimates next-day prices by using electricity consumption profiles.
Such consumption profiles represent the percentage of total (yearly) energy consumed for the average tariff user in a reference time slot (one hour) and are used to estimate the hourly electricity demand of consumers of a certain type (we are interested in data for PVPC 2.0 TD exclusively) based on non-hourly measurement records (daily, monthly or yearly readings). This information is published in the Publicación de los perfiles finales de consumo (PERFF) files and is freely available for consultation and download at [
58]. The explanation, method of calculation and market value for these metrics are beyond the scope of this publication but are detailed in [
44].
After downloading these files for the studied period, obtaining detailed hourly demand using this method was as straightforward as multiplying the hourly profile values by the total yearly electricity demand of the user [
44], which we established to be 4526 kWh/year (see the System Costs section for details).
To account for the savings of our proposal, we calculated the real cost of both the PVPC 2.0 tariff and that of our proposal from the detailed price and demand data we gathered. In both cases, we considered energy and power-related costs, and for our system, its real operational logic was taken into account (i.e., comparing prices to establish energy consumption and relay operation patterns for battery charge/use). We also calculated the cost of using a regular programmable scheduler for off-peak charging and free on-demand use during the rest of the time.
To account for the costs of our proposal and those of the scheduler, we considered the BESSs presented in the System Costs section. Specifically, we used the battery cycle cost (EUR/cycle) and the battery energy cost (EUR/kWh) metrics applied to the energy usage data we obtained from the savings calculations for our system.
In order for our system to be economically viable, the costs must be lower than savings. Since, as previously mentioned, we always considered the worst-case scenario (battery failing as soon as the warranty expires) when obtaining these costs, our proposal’s validity will be assured. From that point on, we could even make it more profitable if battery packs from BESSs last longer than their warranted life (i.e., we can increase the lifetime of current commercial batteries if the optimization charge/discharge patterns are implemented [
59,
60,
61], although that is not part of our research).
2.6. Optimization Problem Formulation and Solution
In this section, we formally define the optimization problem that governs the operation of the SRC system. The objective is to minimize the total electricity cost by optimally deciding whether to consume energy from the battery or the grid in each time slot while accounting for battery efficiency losses and recharging and degradation costs.
2.6.1. Decision Variables
: Total household energy demand at hour t (kWh).
: Electricity price at hour t (EUR/kWh).
: Energy drawn from the grid at hour t (kWh).
: Energy drawn from the battery at hour t (kWh).
: Battery state of charge at hour t (kWh).
: Battery efficiency (
) set at 0.90, as per
Table 4 (worst-case battery scenario).
: Maximum battery capacity (kWh).
: Battery cycle cost, calculated as the total battery pack cost divided by the number of cycles covered under the vendor’s warranty (EUR/cycle).
: Battery energy cost, divided by (EUR/kWh).
: Average of the three lowest electricity prices of the day (EUR/kWh).
: Cost per unit of energy drawn from the battery at hour t (EUR/kWh), considering acquisition and degradation costs () and recharging costs.
: Optimization time horizon (24 h).
2.6.2. Objective Function
The goal is to minimize the total cost of electricity consumption over a 24 h period:
where
is 0.0534 EUR/kWh, the fixed battery energy cost (taken from
Table 4).
is the average of the three lowest hourly electricity prices for the day.
2.6.3. Constraints
I. Energy balance equation
This ensures that the battery charge is updated correctly based on the energy drawn from the grid and used from the battery.
II. Battery charge limits
This guarantees that the battery’s state of charge never exceeds its maximum capacity.
III. Battery discharge constraint
This ensures that the battery never discharges more energy than it has stored.
IV. Energy demand satisfaction
This ensures that the household energy demand dtd_tdt is always met.
V. Optimal energy source selection
This guarantees that the battery is only discharged when its energy cost is lower than the grid price.
2.6.4. Solution Approach
We solved this optimization using linear programming (LP) with the HiGHS solver, ensuring an optimal allocation of grid and battery energy over a 24 h period. The results demonstrate that the system correctly selects the most cost-effective energy source at each hour of the day, balancing between grid electricity and stored battery power. The total optimized daily cost is EUR 4.72/day compared to EUR 5.13/day without the system, representing an approximate 8% cost reduction. Future research could integrate stochastic programming techniques, such as Markov decision processes (MDPs) or Monte Carlo simulations, to further refine the optimization strategy under uncertain price scenarios.
Given the significant variability in electricity prices (as shown by their large standard deviation), a deterministic LP approach only provides a theoretical baseline for decision making. In practice, the achieved cost savings could be significantly higher, particularly on days with extreme price fluctuations. Because our system dynamically adjusts energy usage in real time based on market conditions, it inherently benefits from market volatility. This makes it more effective when price disparities between peak and off-peak hours are larger. This suggests that, under real-world conditions, the system’s impact may extend beyond the estimated savings obtained theoretically.
For real-world application, instead of relying solely on static optimization, the system employs a real-time rule-based control strategy, dynamically adjusting energy consumption based on updated electricity prices (see
Section 2.1 and
Section 2.5 for details on system operation). This approach ensures that the system remains adaptable to market fluctuations and maximizes energy savings on a daily basis while also reducing the reliance on long-term forecasts.
Our methodology aligns with established rule-based control strategies in energy management systems, where decision making is guided by predefined cost thresholds and updated in real time. The implemented strategy effectively integrates theoretical optimization with practical system constraints, ensuring both cost effectiveness and operational feasibility.
All the information we gathered and the calculations performed on it are included as
Supplementary Information for this research. In the following sections, we present our results, conclusions and recommendations.
3. Results
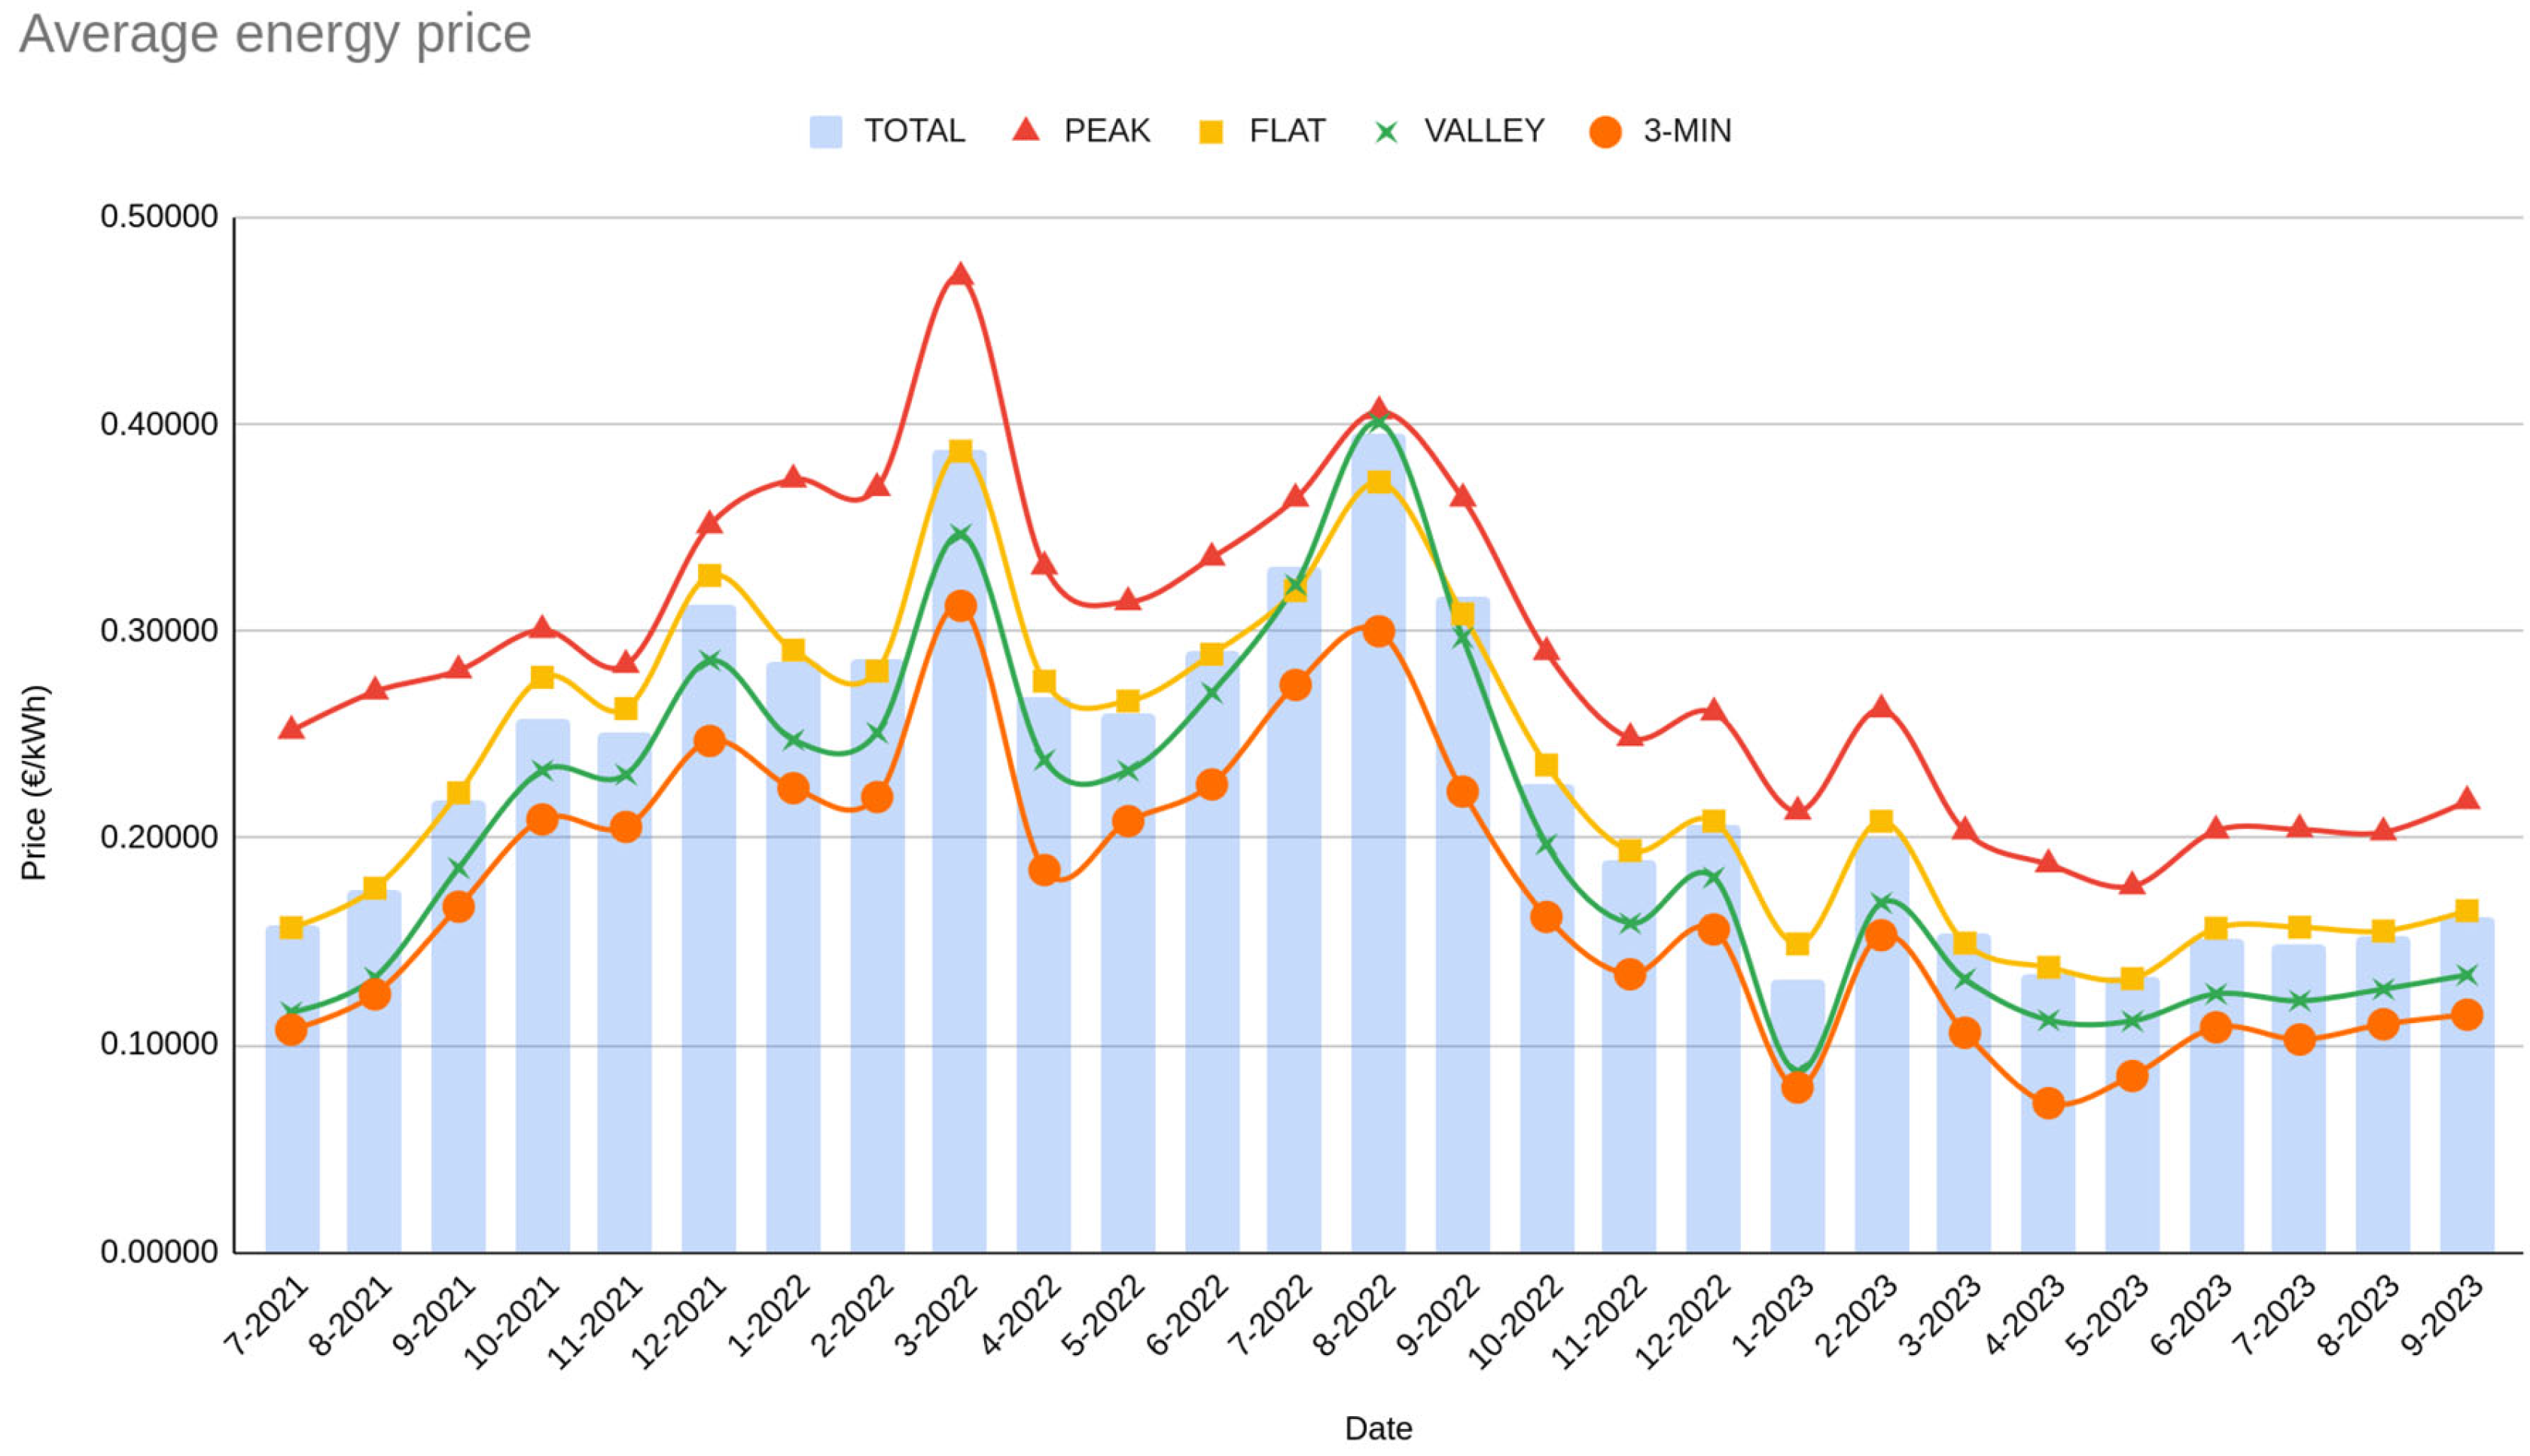
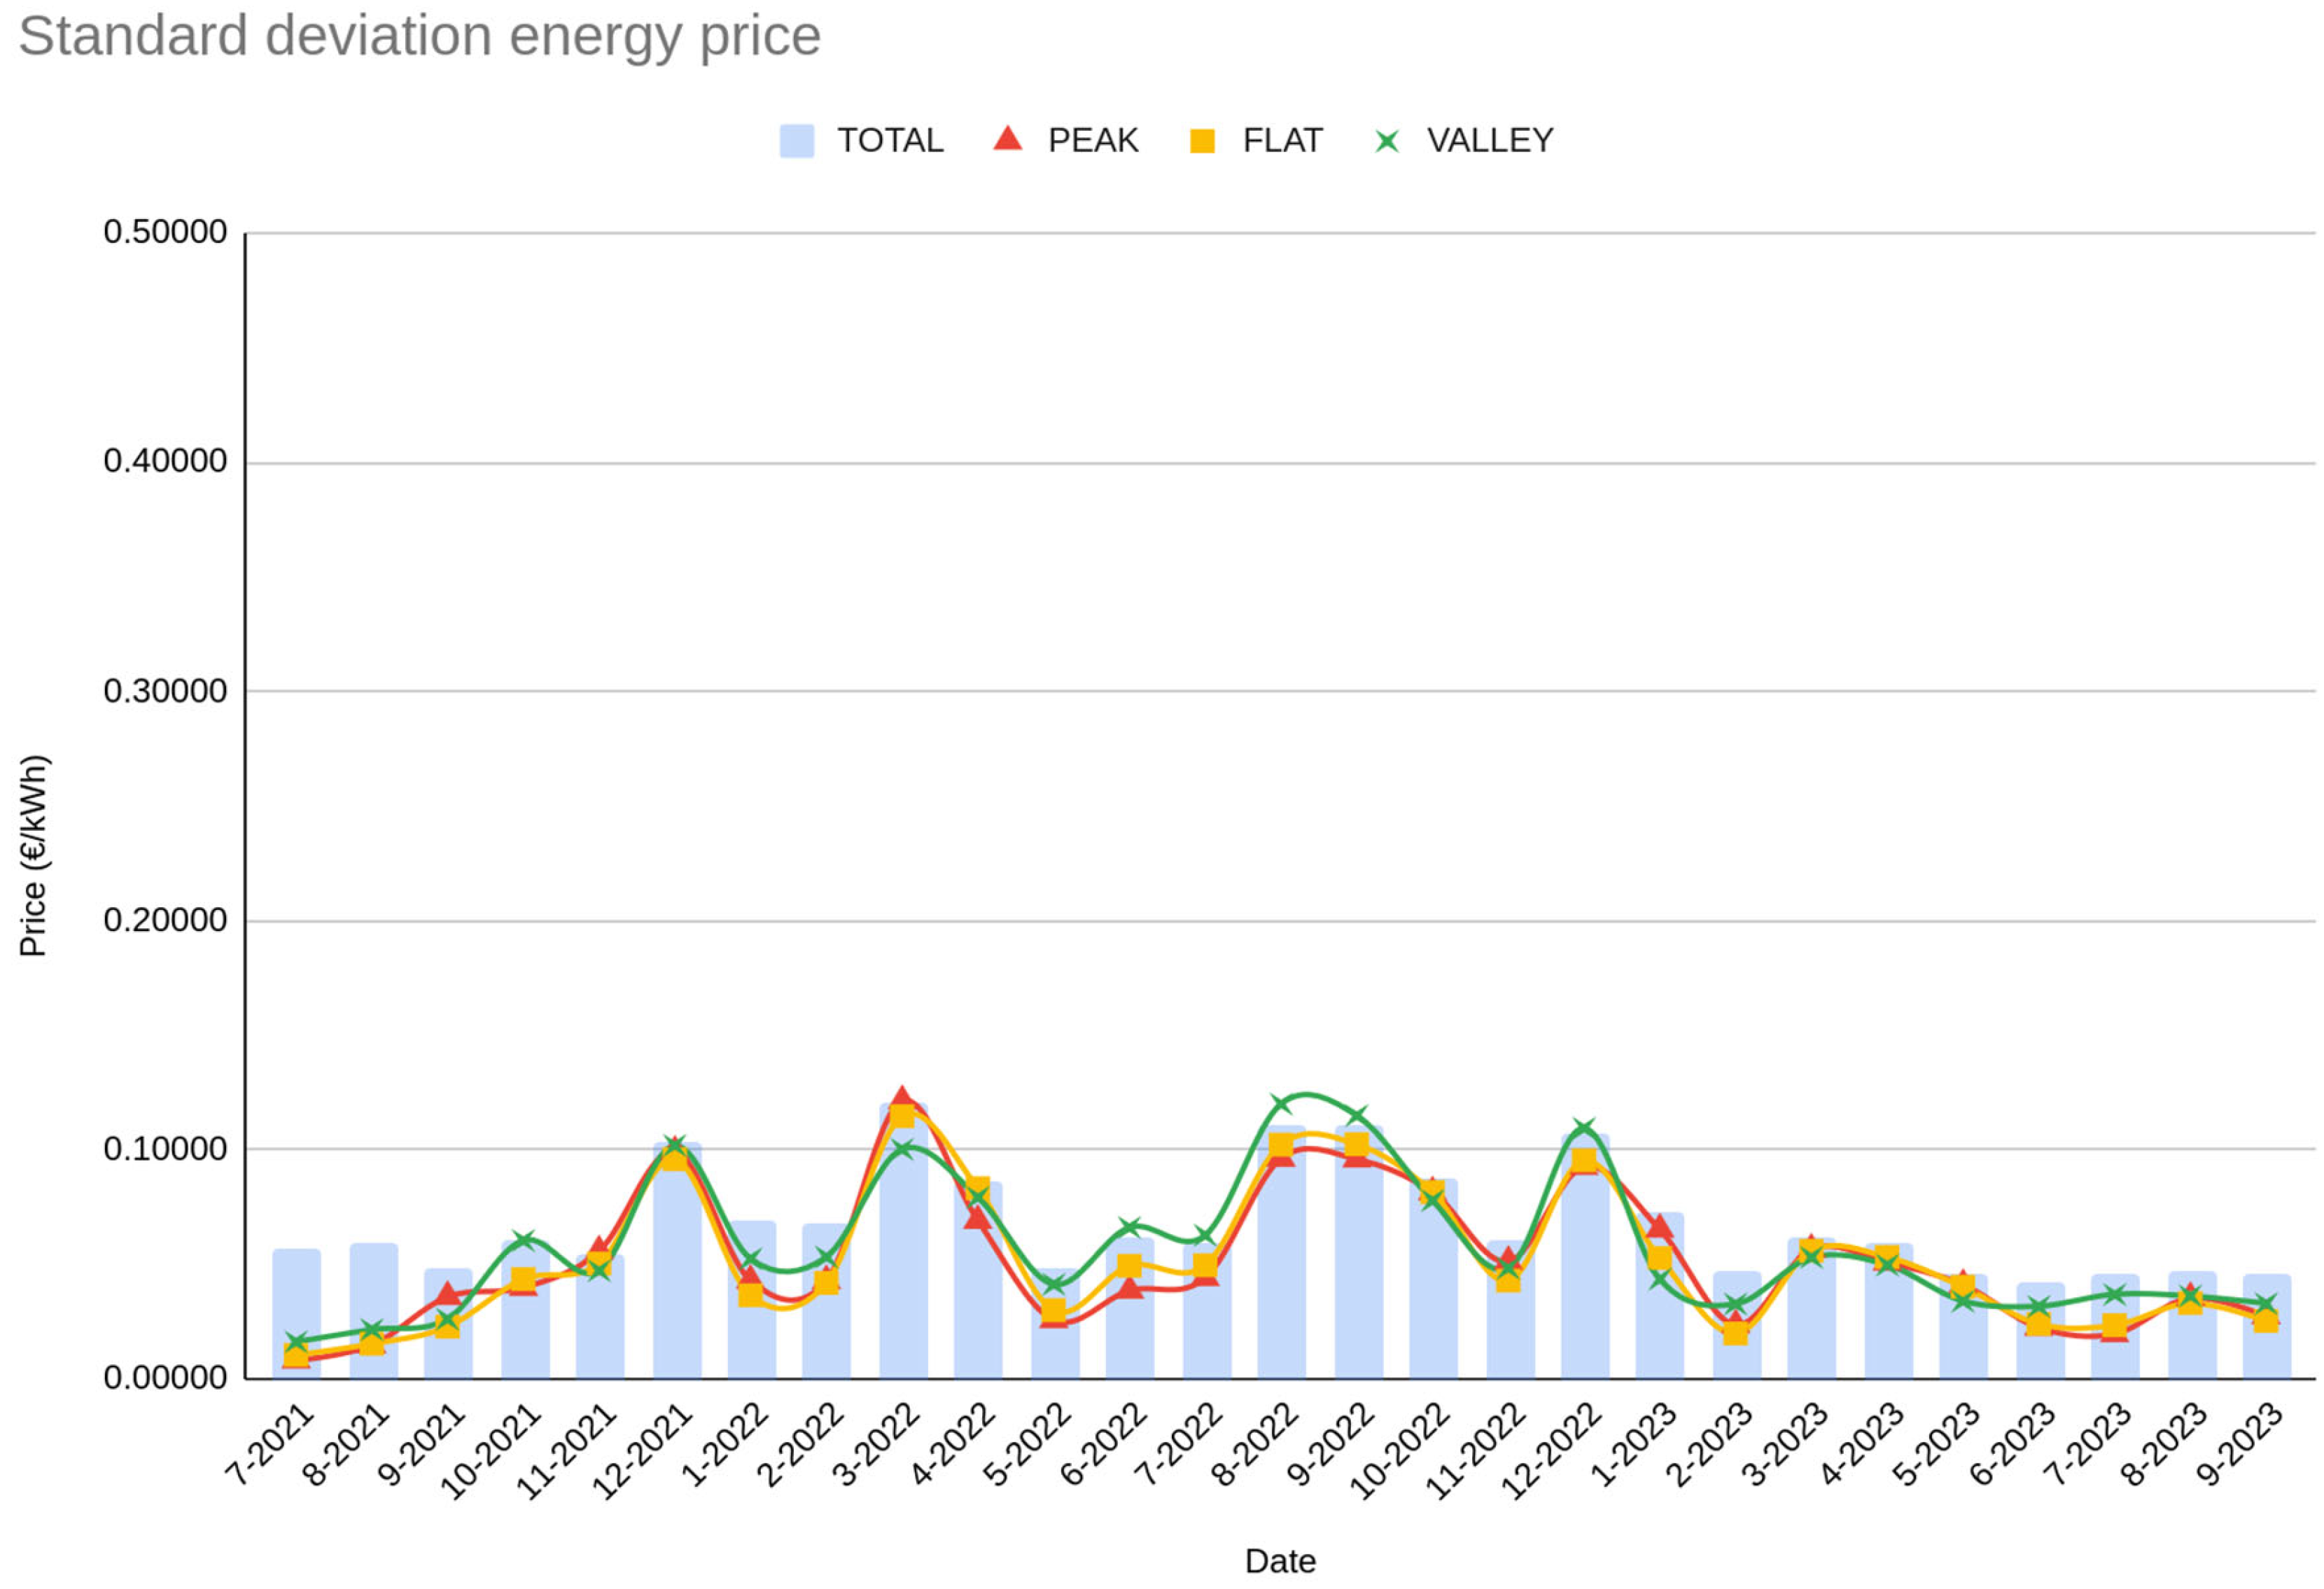
Figure 3 and
Figure 4 show the average and standard deviation of electricity prices (PVPC 2.0 TD) for the studied period, respectively. As previously mentioned, peak prices will always be higher than flat and valley prices, and flat prices will always be higher than valley prices for a given day. However, variations can occur between days. This is why the average valley price in July, August and September 2022 is so close to the average flat price and even higher in July and August: electricity prices on all-valley days (weekends) were very high during those months, causing the average valley price to surpass the average flat prices.
Figure 3 also includes the average of the three minimum daily prices to give a visual clue about the kind of savings we are striving for when using our proposal.
Figure 4 makes it clear that valley prices are also the ones presenting a higher degree of monthly variation (monthly as per the data shown, but also daily upon inspecting all data presented in
S1), especially for the aforementioned months. Our system can dynamically adapt to price changes and use the battery system only when economically beneficial; therefore, this situation does not affect it. However, this will make the regular scheduler solution even detrimental, as we will explain further in this section.
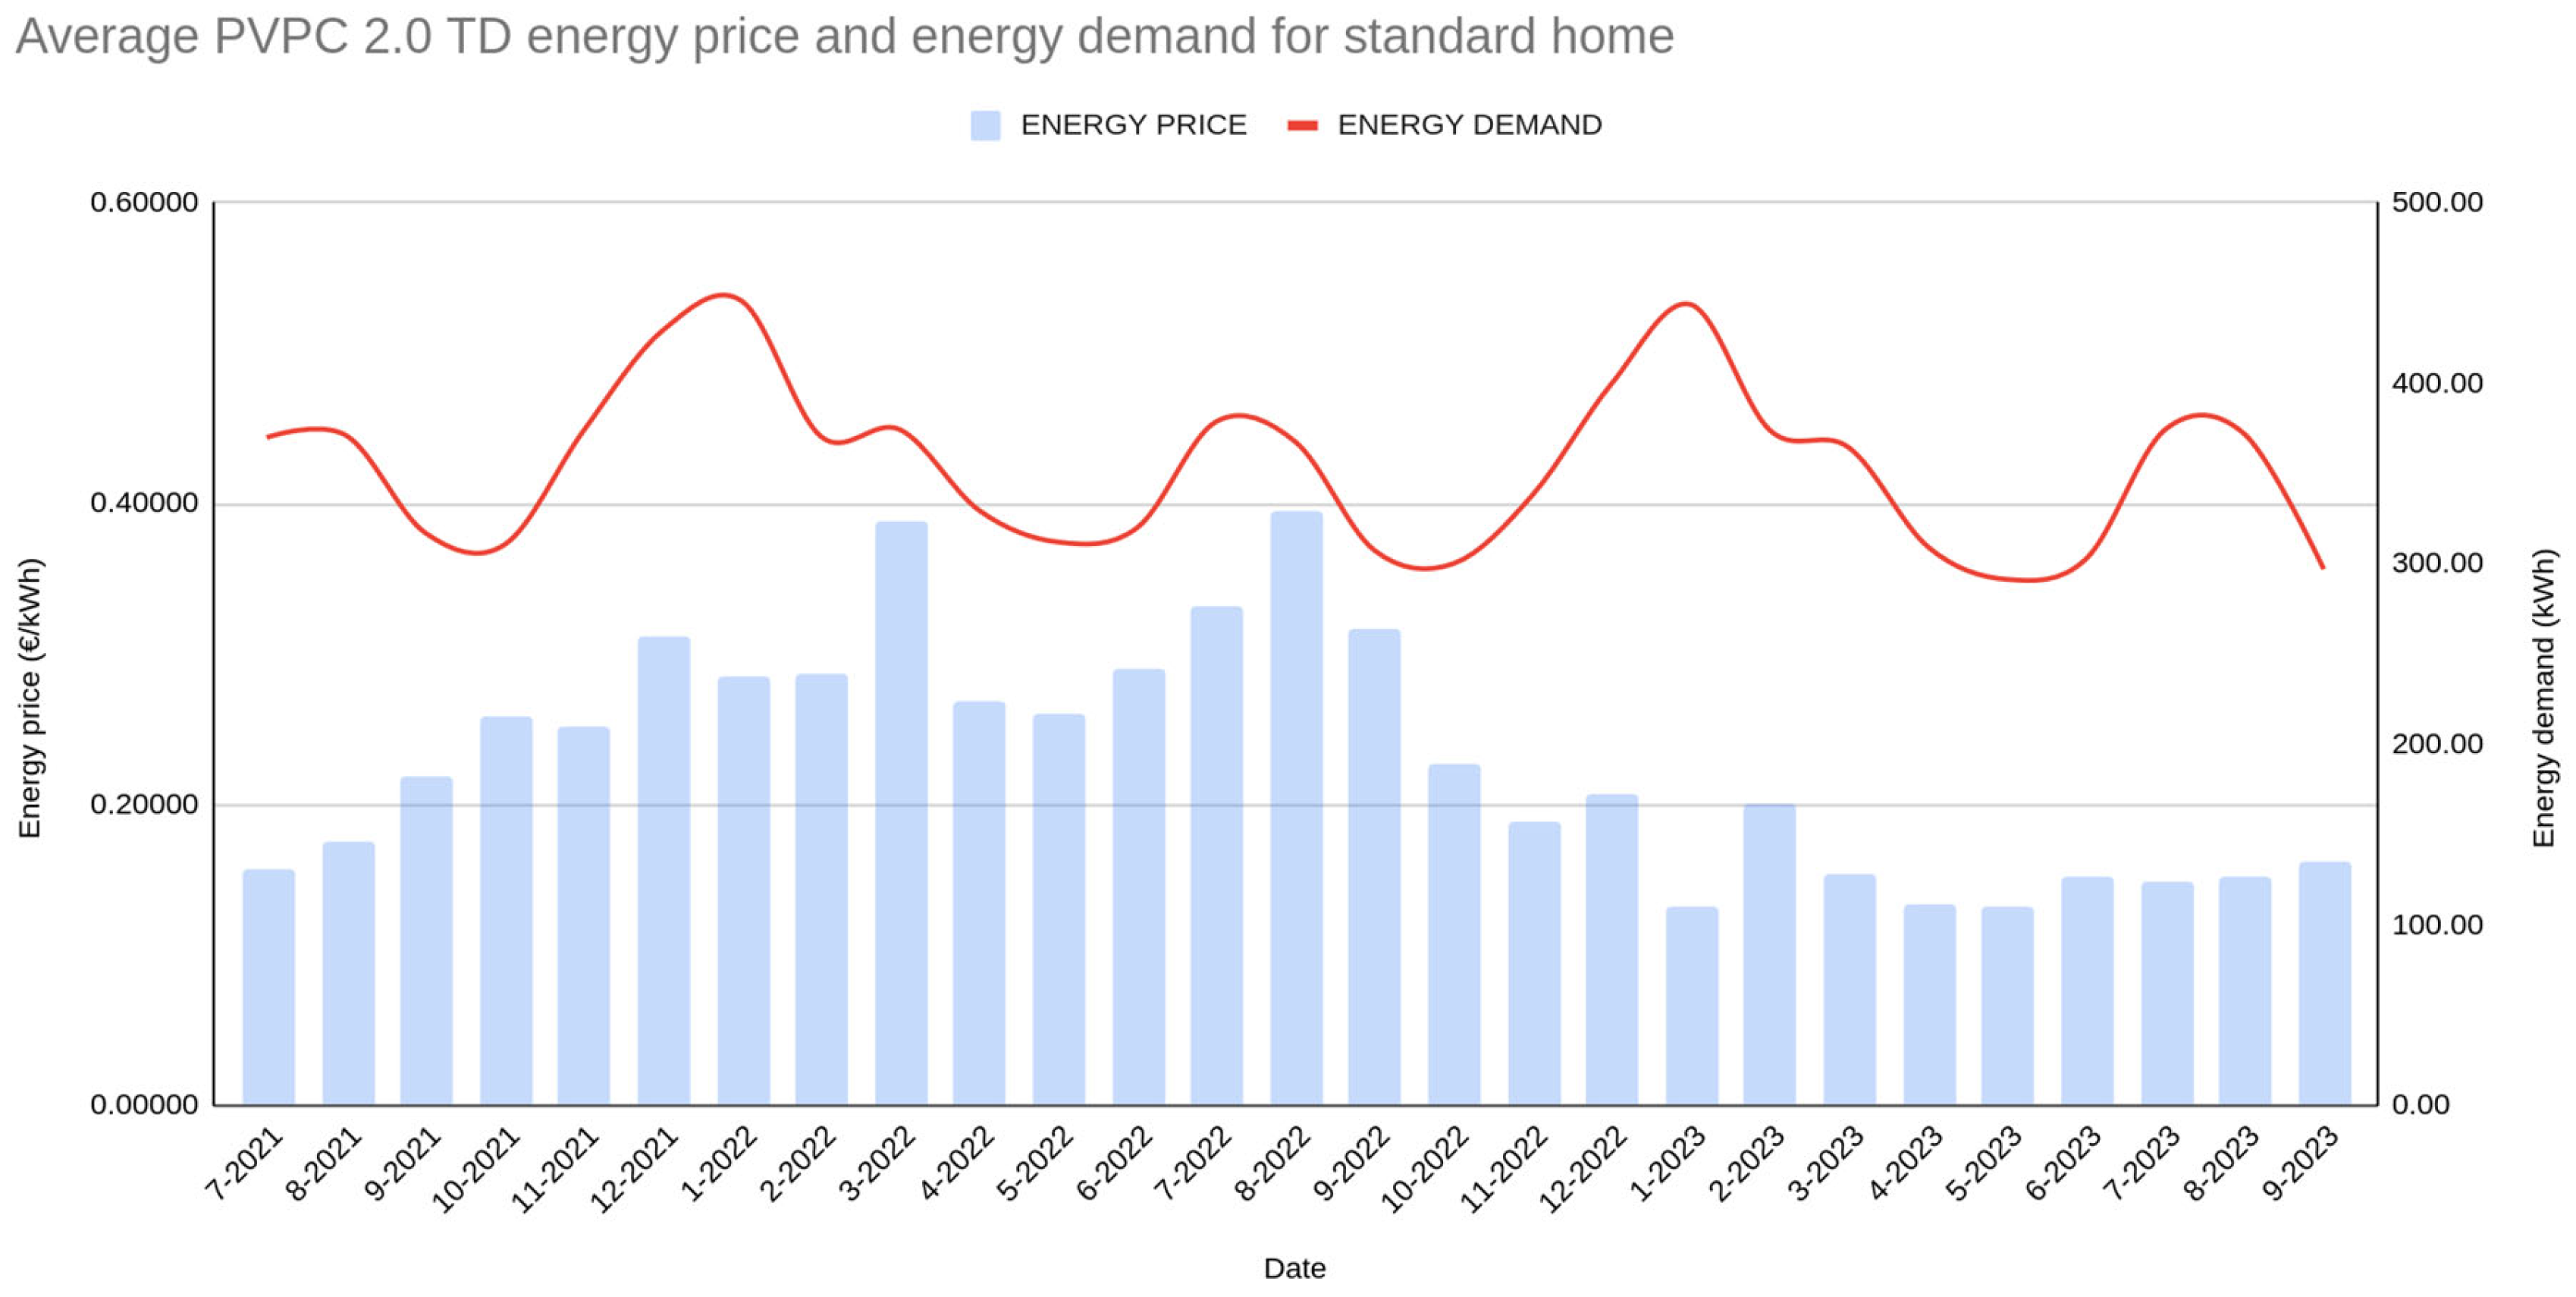
Figure 5 shows the average energy price and the energy demand for the standard home (as presented in the System Costs section) over the analyzed time frame. Even though demand affects energy prices, they do not fluctuate following the same pattern (e.g., winter 2022 energy demand increases while energy price drops), as demand is not the only factor to consider.
Table 5 summarizes the results for the real maximum (quarter-hourly) energy demands for the different PVPC periods over the analyzed time frame, as well as the peak and valley power required during those periods.
Table 6 shows the peak and off-peak power from
Table 5, corrected to account for the 15 kWh battery when working with n-charging slots (one charging slot means we charge the battery in one hour). Peak power is actually lowered, considering the smart meter peculiarities explained in the previous section, and off-peak power takes into account simultaneous real demand plus battery charging requirements.
As expected, off-peak power is high to accommodate for battery charging (especially if we want to achieve faster and thus cheaper charging), but peak power can be optimized compared to the PVPC tariff (4.7 kW), as introduced in the System Costs section. We do not consider battery usage during peak time frames (and thus, its beneficial effect in lowering peak power), since we are following a worst-case scenario policy (i.e., it may not be economically feasible to use the battery on a given day, as the battery energy cost may be even higher than peak grid electricity for that day). The PVPC 2.0 TD tariff allows for a maximum power of 10 kW [
26]; therefore, the one-slot charging option is not valid for us, as it requires almost 15 kW of power.
Given that all these calculations are based exclusively on real data analysis and are not dynamic (our system does not vary the power depending on any future published data regarding energy costs or based on energy use other than past data), we will consider them as valid for both our proposal (SRC system) and a regular scheduler. Therefore, there would be no economic difference between them regarding power costs and savings compared to PVPC.
After we establish the power requirements for every n-charging slot configuration, we can calculate the total cost of our system, which is the sum of power costs and energy costs, as explained in the System Benefits section. The fewer the charging slots, the less we pay for energy (since we can charge the battery in fewer slots and thus at cheaper prices), and the more we pay for power (more maximum power is needed to charge the battery in a narrower time span). Since the energy cost weighs more than the power cost for a regular home using the PVPC tariff, the total cost of our system is lower the fewer slots we need to top up our batteries, with two being the minimum we can use with the PVPC tariff.
Table 7 summarizes our results for the entire studied time frame, from June 2021 to September 2023.
In the remainder of this section, we also take battery life into consideration and compare our proposal with both PVPC and a regular scheduler. All the presented data correspond to the three-slot charging results (batteries are charged for a maximum of 3 h using the three minimum electricity prices for that day), since this was the most profitable setup we could afford, taking into account the power limitations of both the studied batteries and the PVPC tariff. However, all configurations (1, 2, 3, 4, 6 and 8 charging slots) were studied, and all of them were profitable (cheaper than PVPC, with total savings above the battery energy cost). The full study and tables with detailed hourly granularity are not directly included in the paper due to their length and are instead attached as
Supplementary Material.
Figure 6 shows the daily total cost (power and energy) of SRC (blue) compared to PVPC (red) for the studied period (please see
S1 for a more readable version, as it requires zooming in to properly appreciate the labels). For PVPC, the minimums in energy cost occur on all-valley energy cost days (weekends and public holidays). For SRC, they correspond to the first regular day after an all-valley day (i.e., a Monday): on that day, the energy cost for our system is very low, since the battery is full (it was likely not used the previous all-valley day and does not start recharging until the next day). For SRC, we always observed large spikes compared to PVPC at regular intervals; these correspond to the days preceding all-valley days (i.e., Saturday), since on those days, the energy use includes both battery charging and almost 100% energy usage directly from the grid (since it is cheaper).
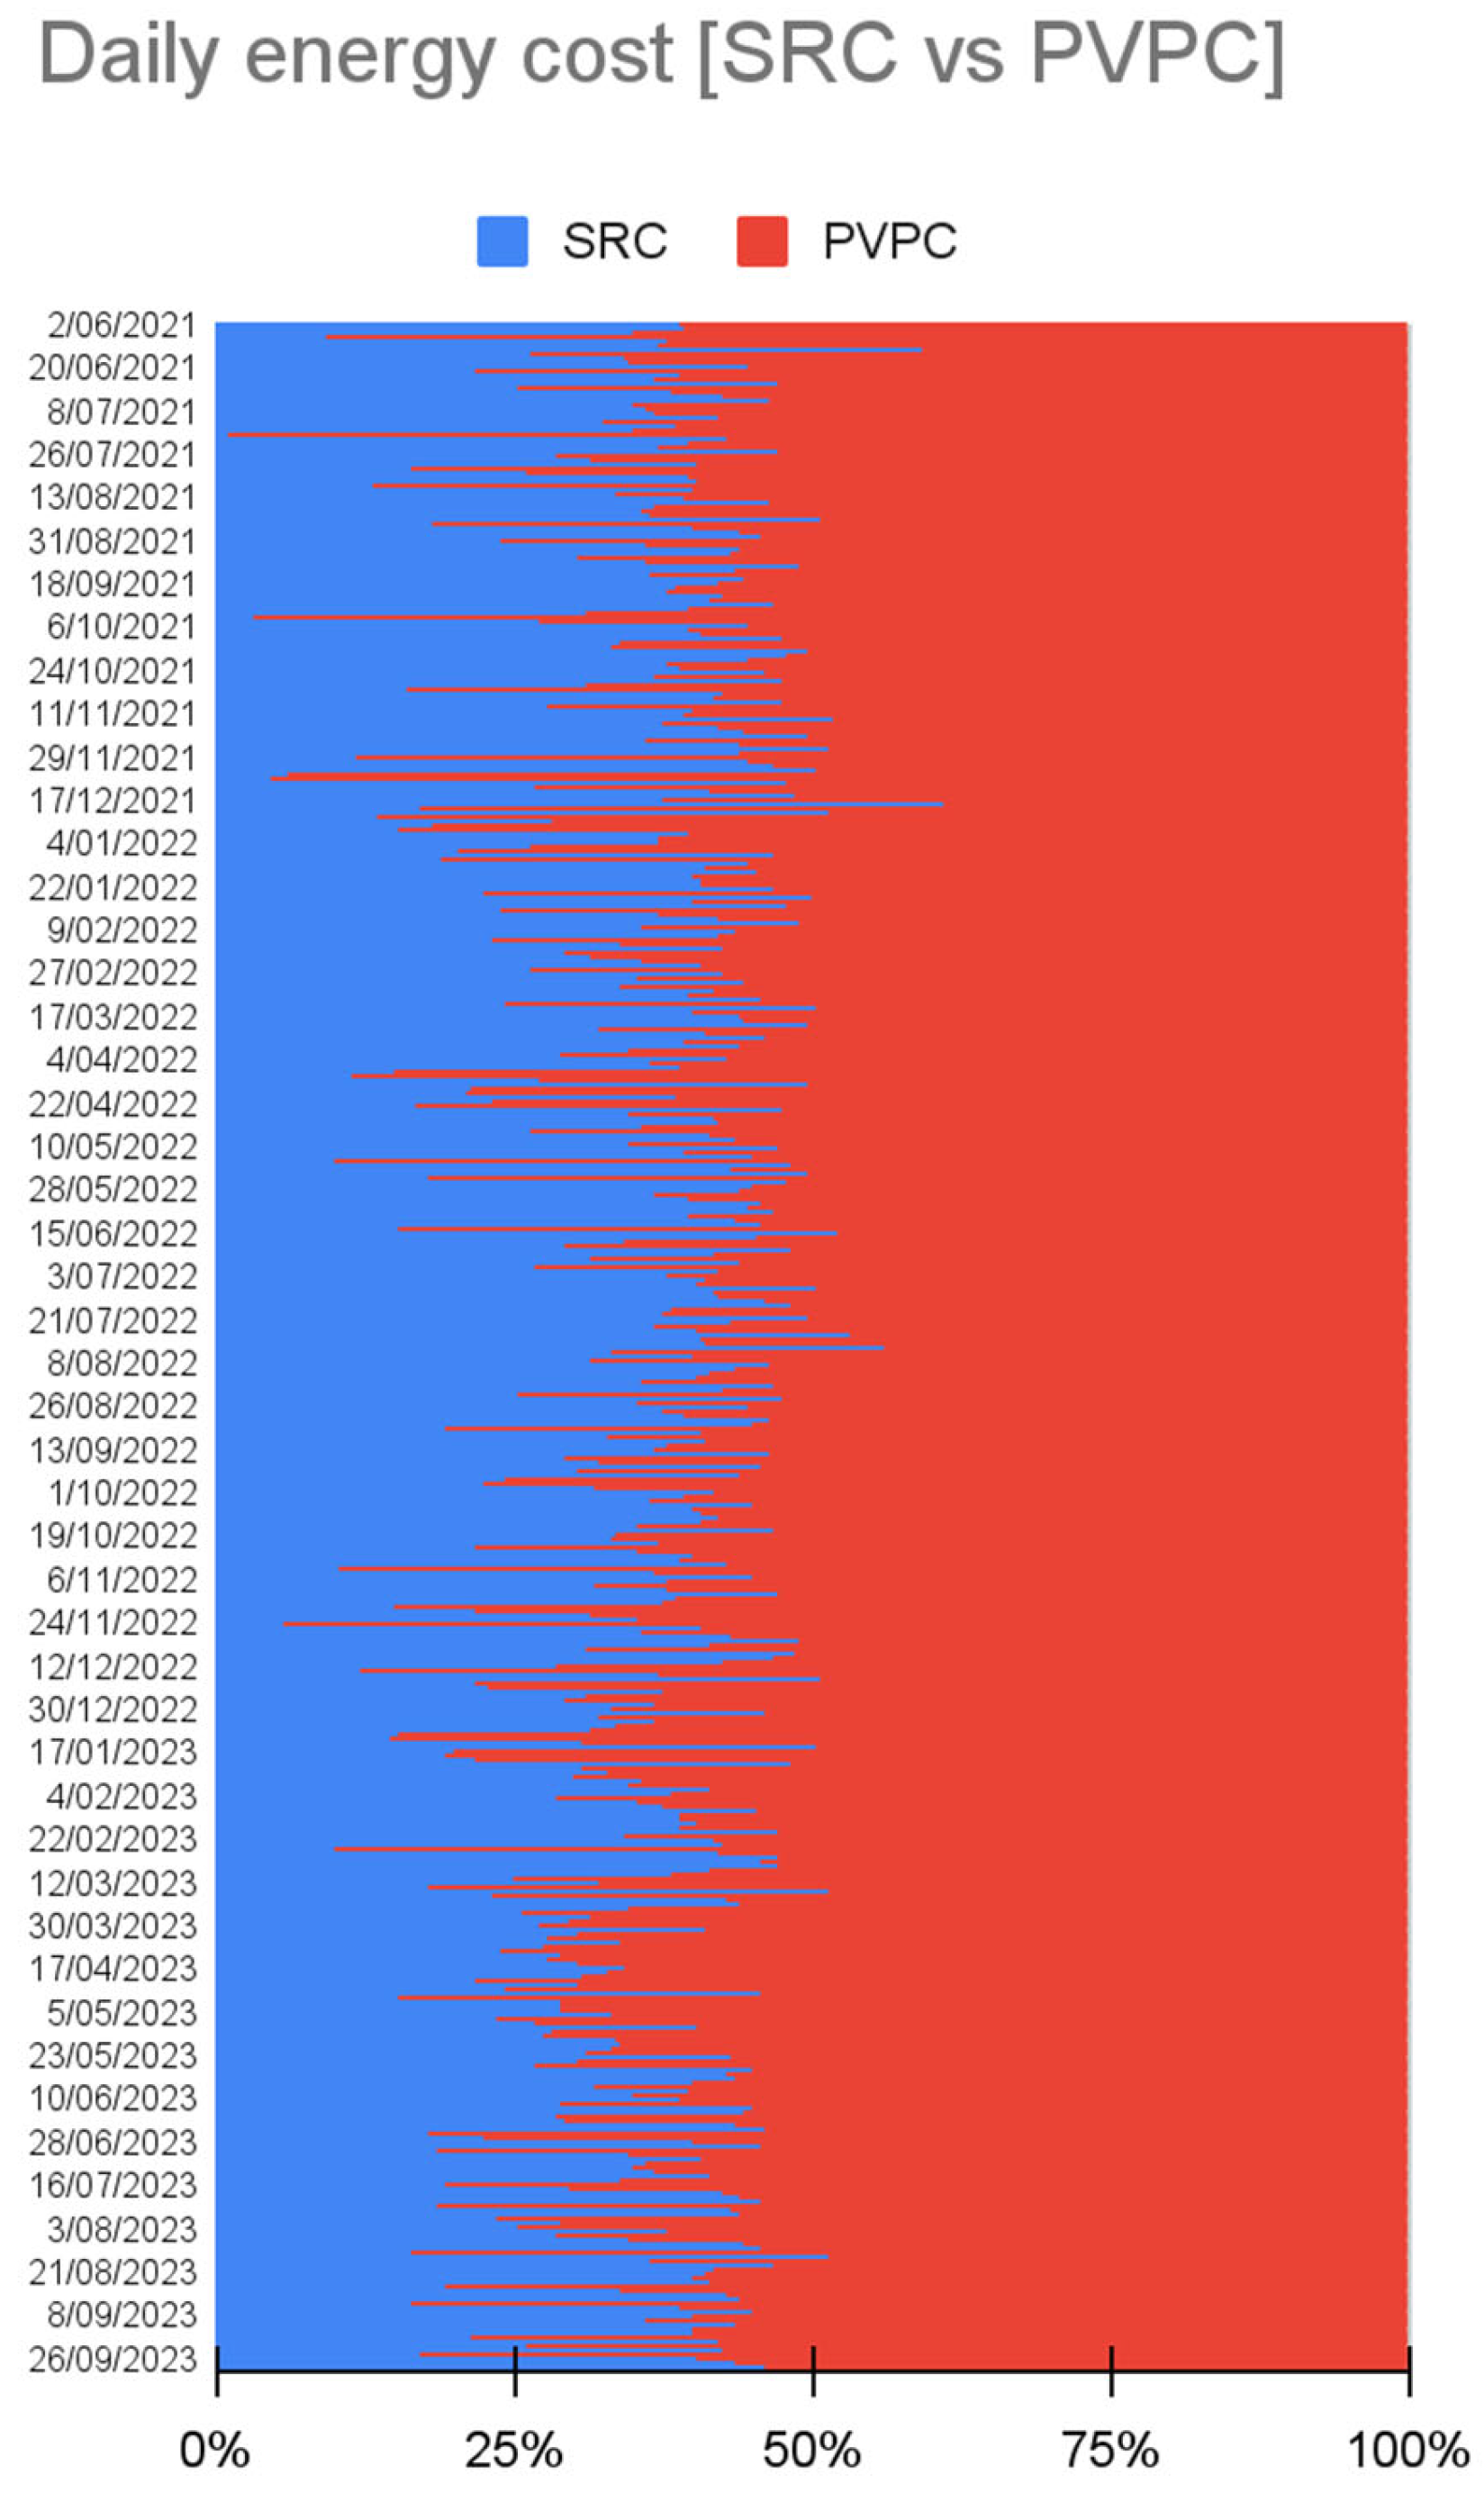
Figure 7 shows the same data but in stacked format, which makes it more straightforward to appreciate. Both figures are intended to be studied at high resolution due to the amount of information they contain. Upon inspection, it is clear that PVPC is more costly than our proposal: PVPC is only better (cheaper) on the days before all-valley days (that is, Fridays).
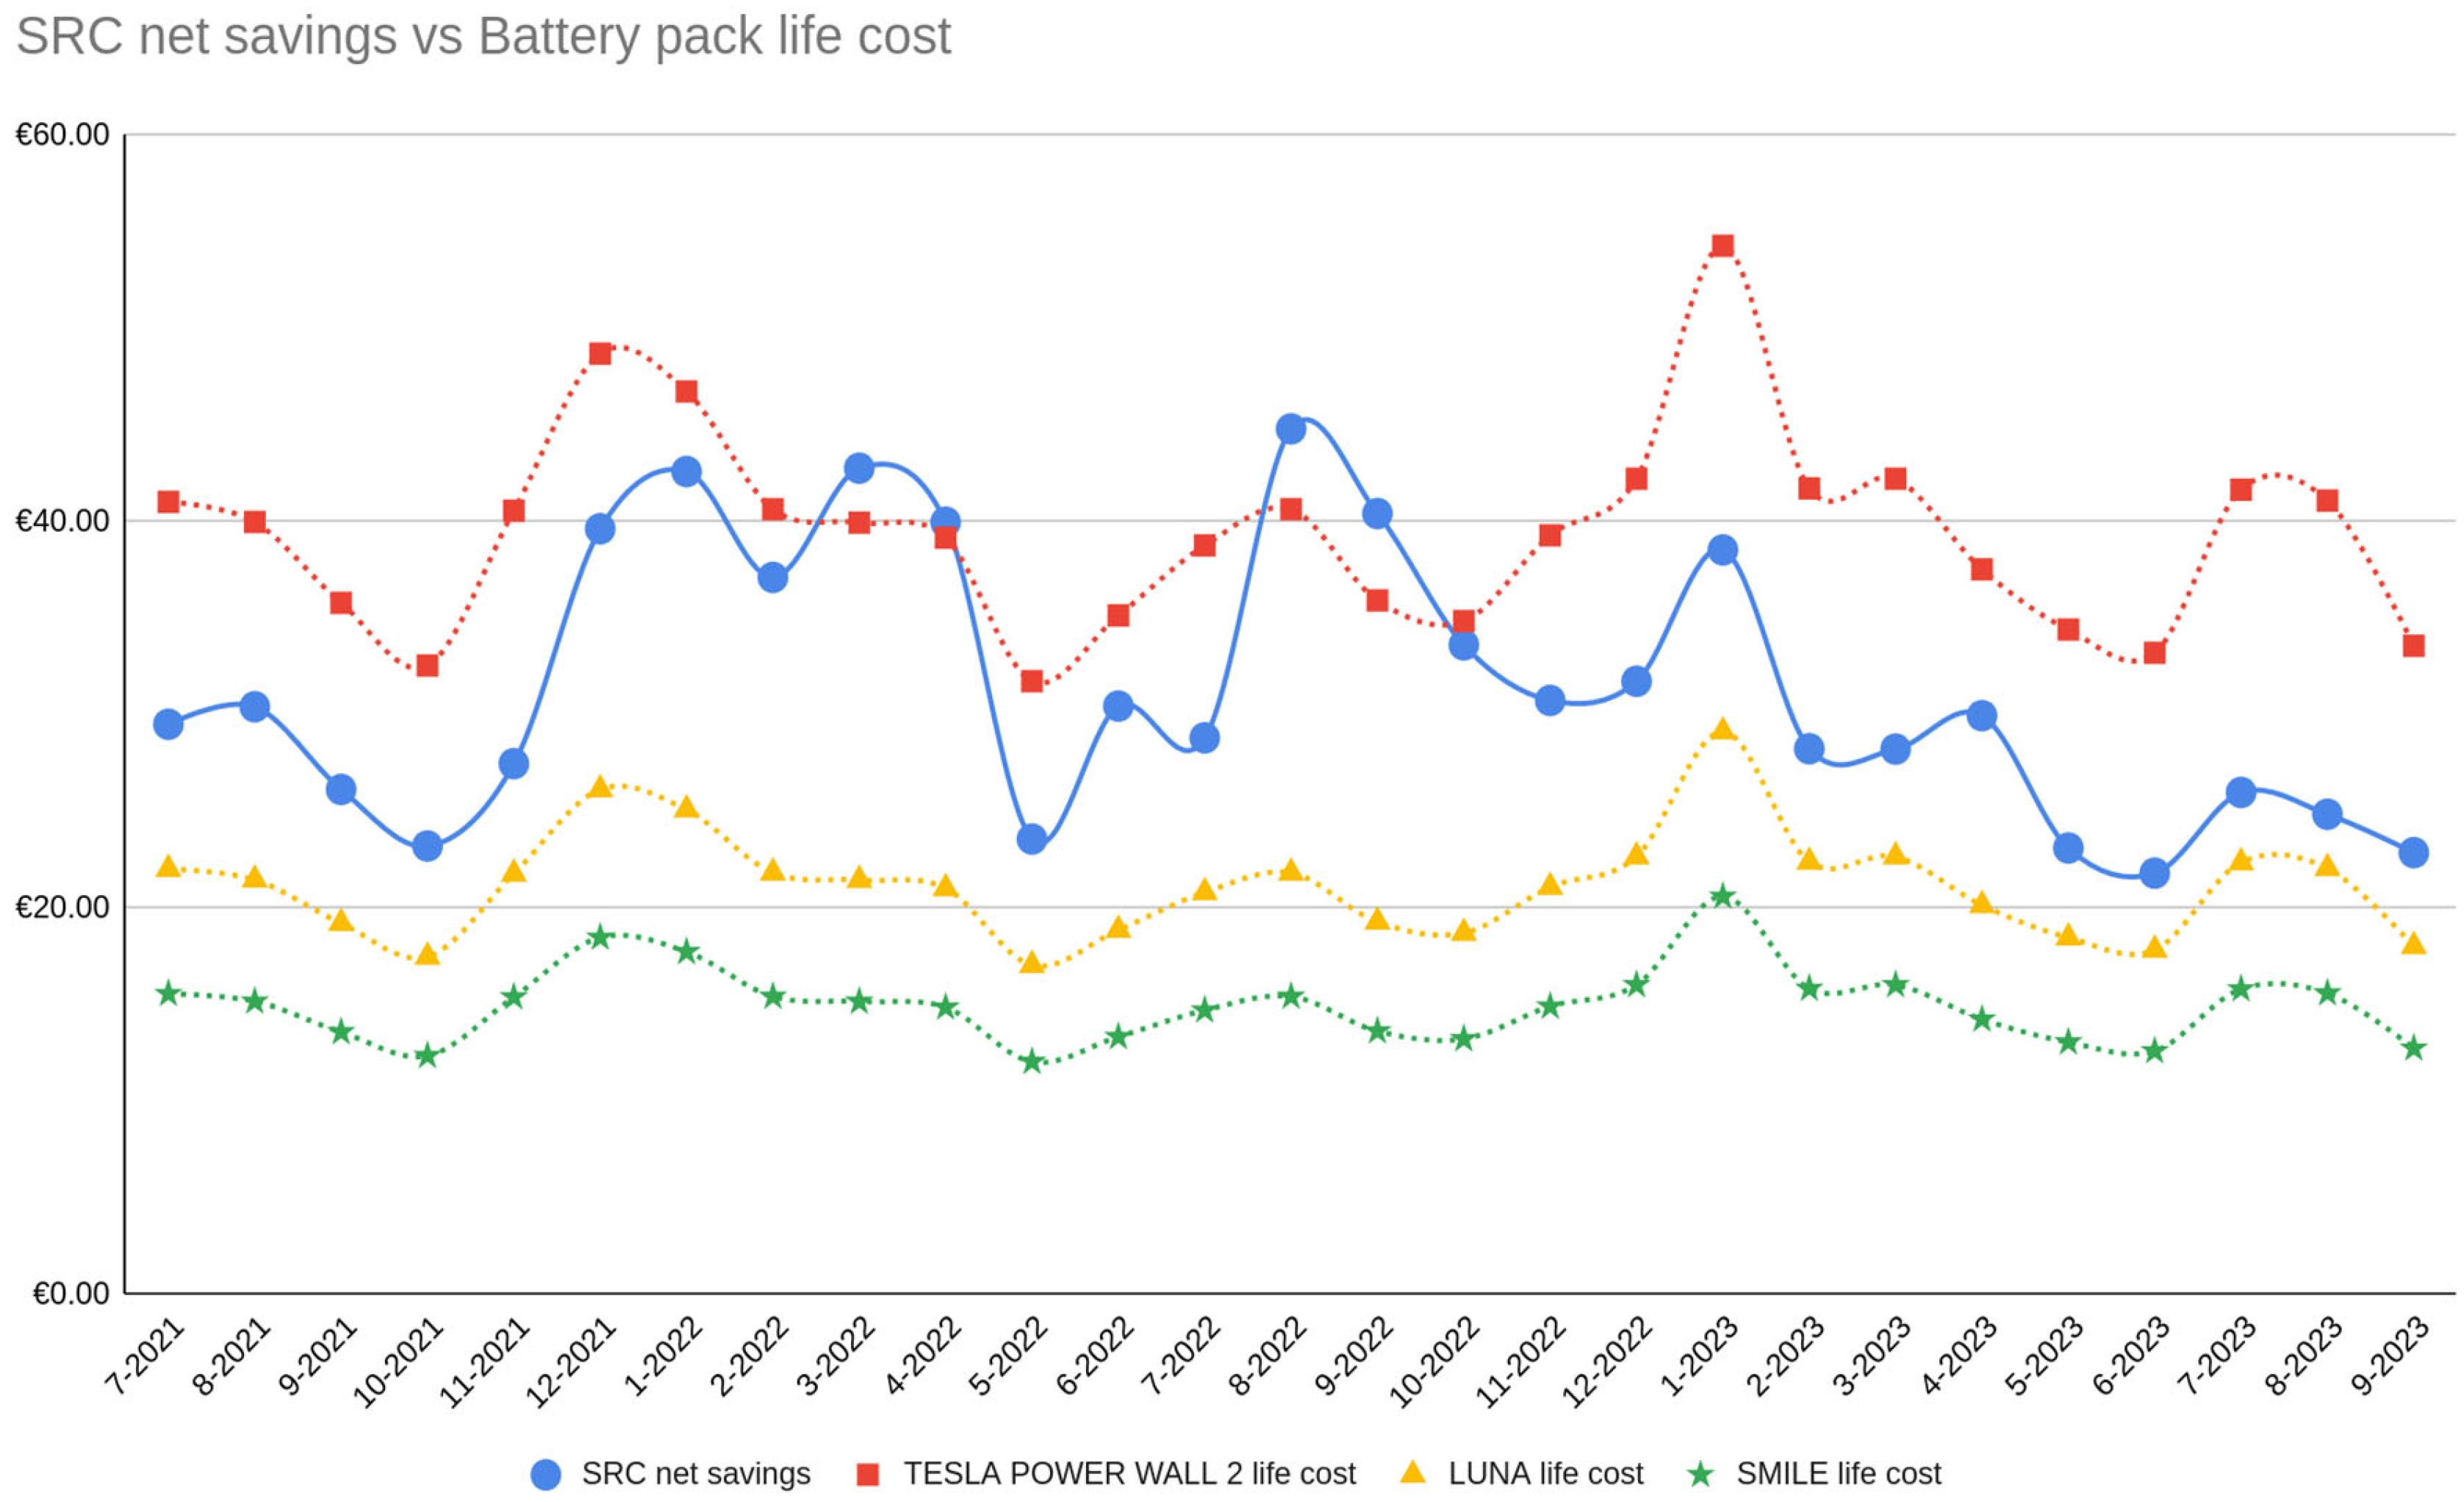
Figure 8 depicts the monthly savings achieved by SRC compared to PVPC (the monthly SRC cost minus the monthly PVPC cost; in blue) during the studied time frame and the battery energy cost (as described in Materials and Methods) for all the proposed BESS alternatives. Our system is thus economically viable (savings are greater than the battery energy cost) in all months for all batteries, except for the Tesla Power Wall 2. As expected, the greater the difference between minimum and maximum electricity prices, the more beneficial our system becomes (i.e., during the end of summer–autumn 2022).
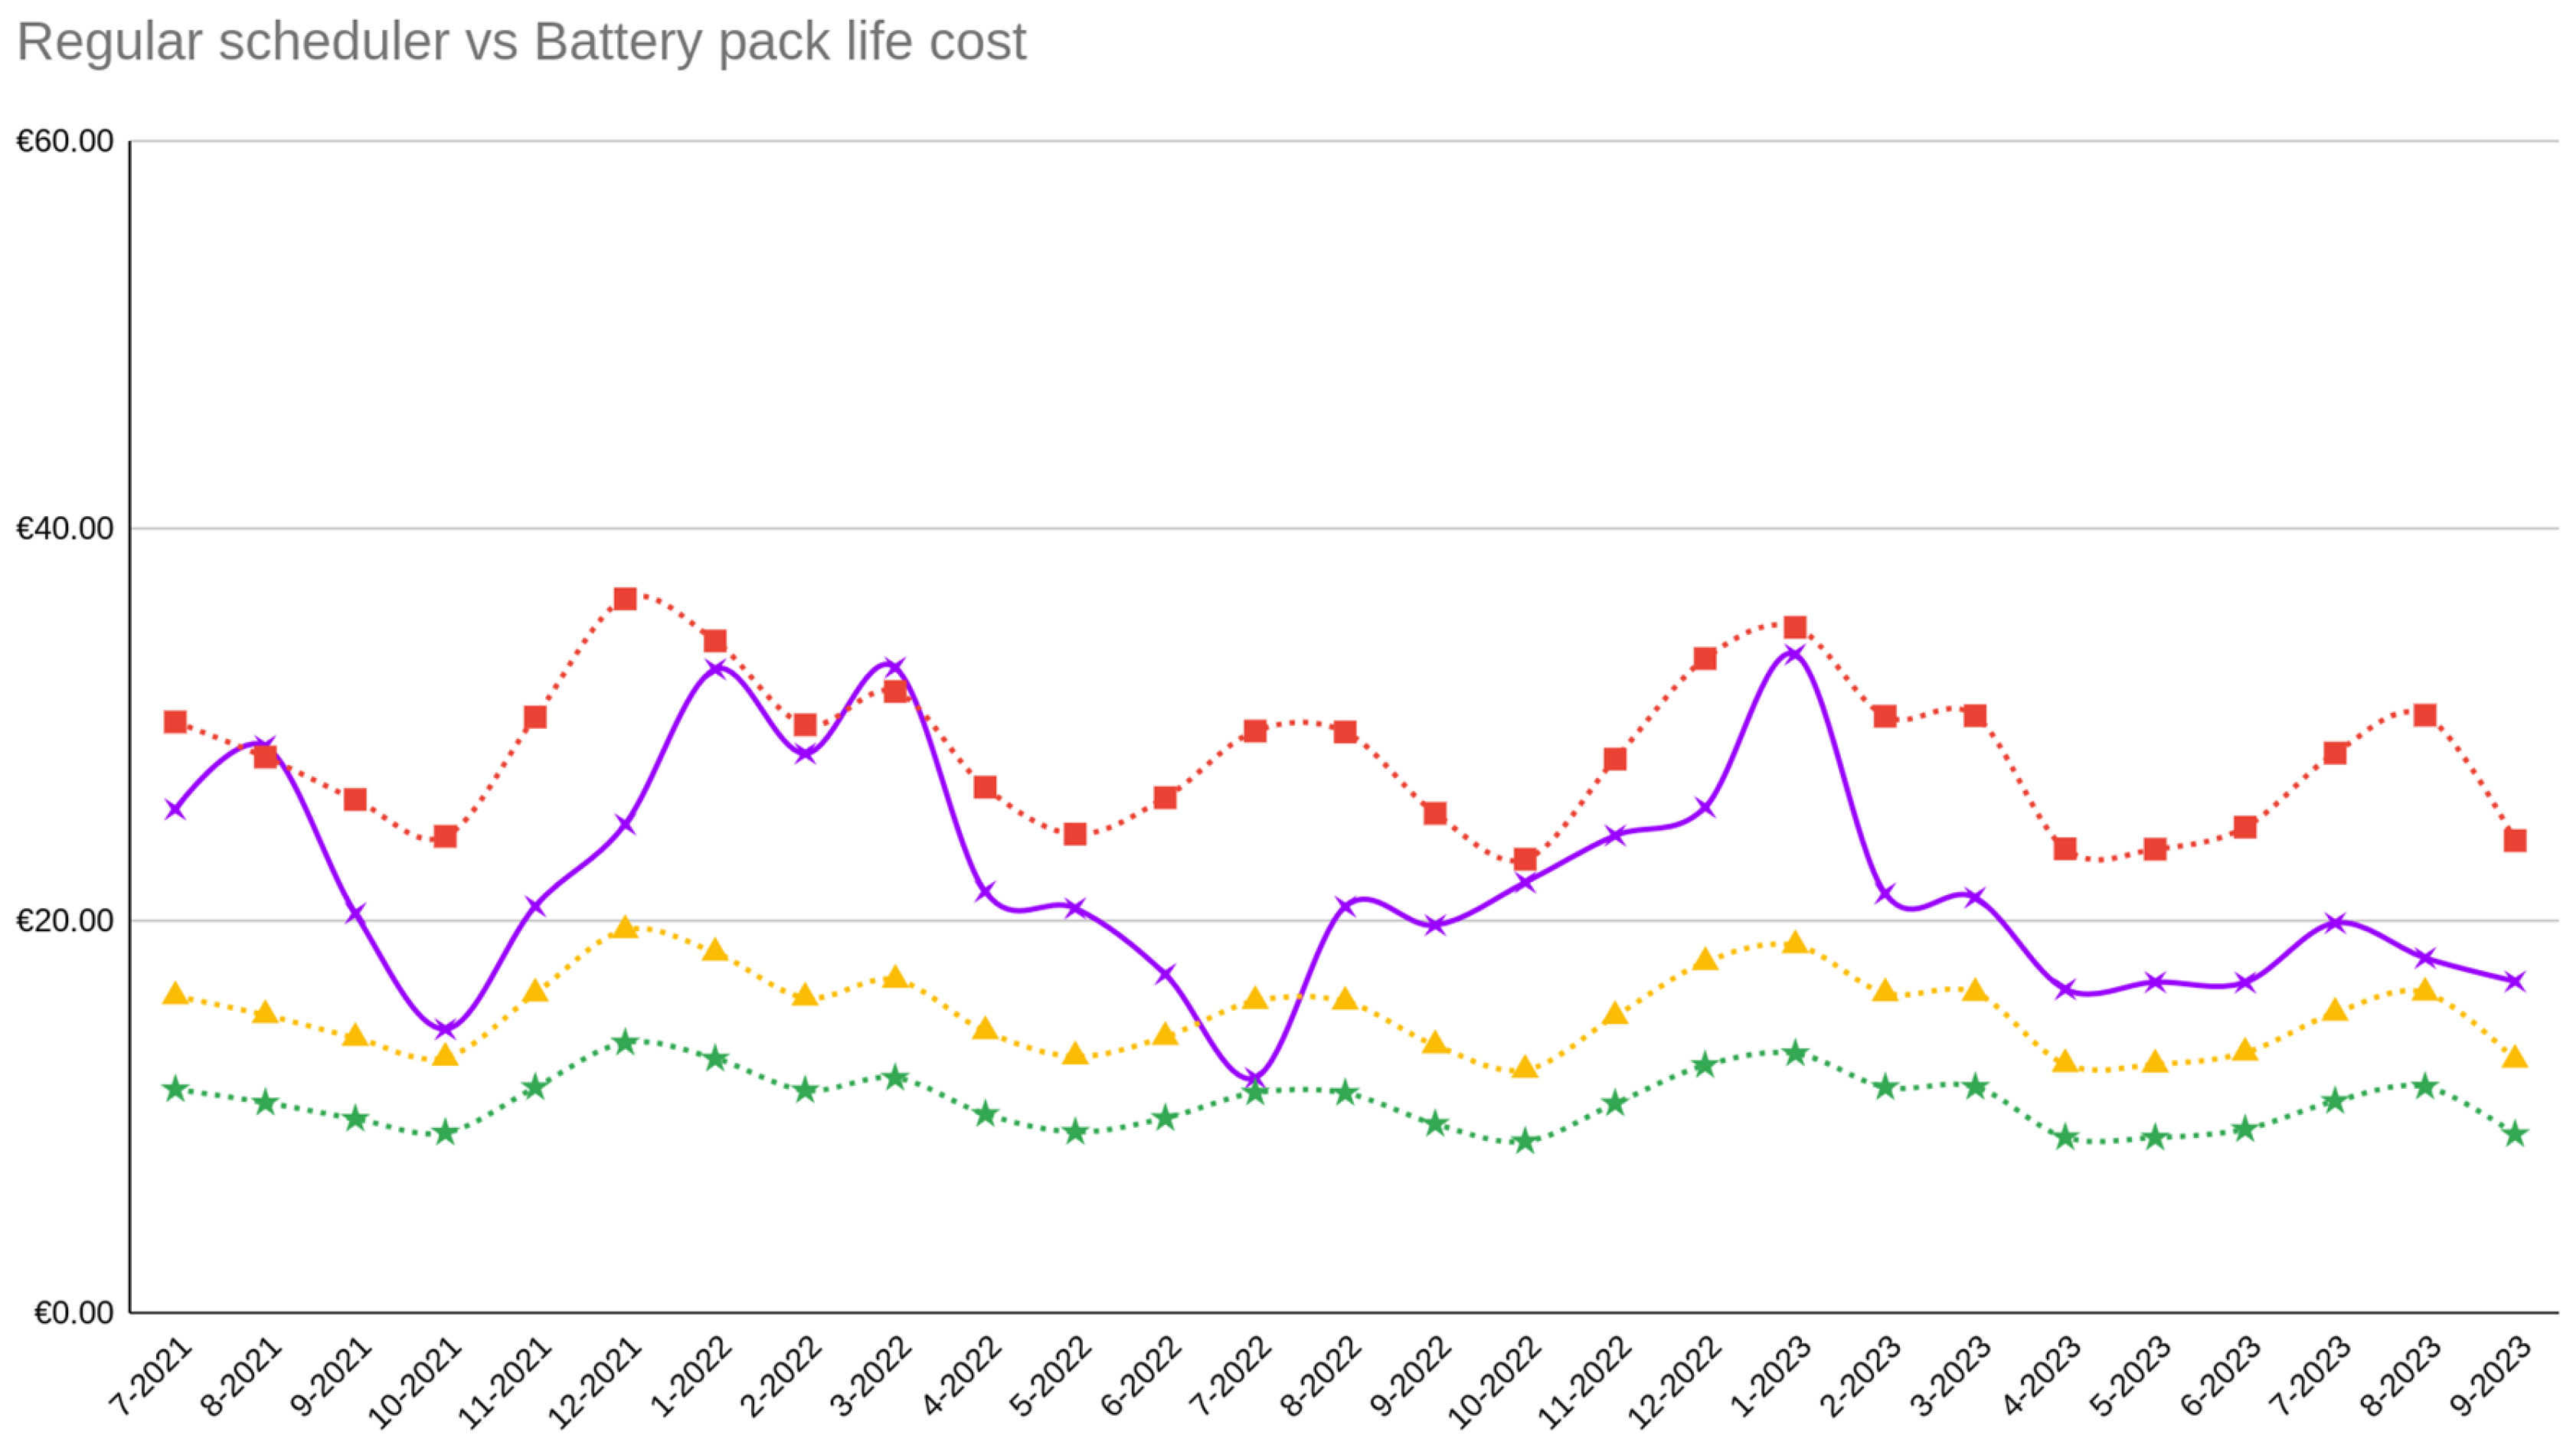
Figure 9 shows the same results (net balance compared to PVPC) for the regular scheduler. It can be appreciated that we can also obtain benefits with it, but they are always lower than those of SRC. Additionally, there are several months in which the system is, in fact, not viable (the balance is positive compared to PVPC alone, but savings are lower than the battery energy cost, meaning we are losing money).
Figure 10 and
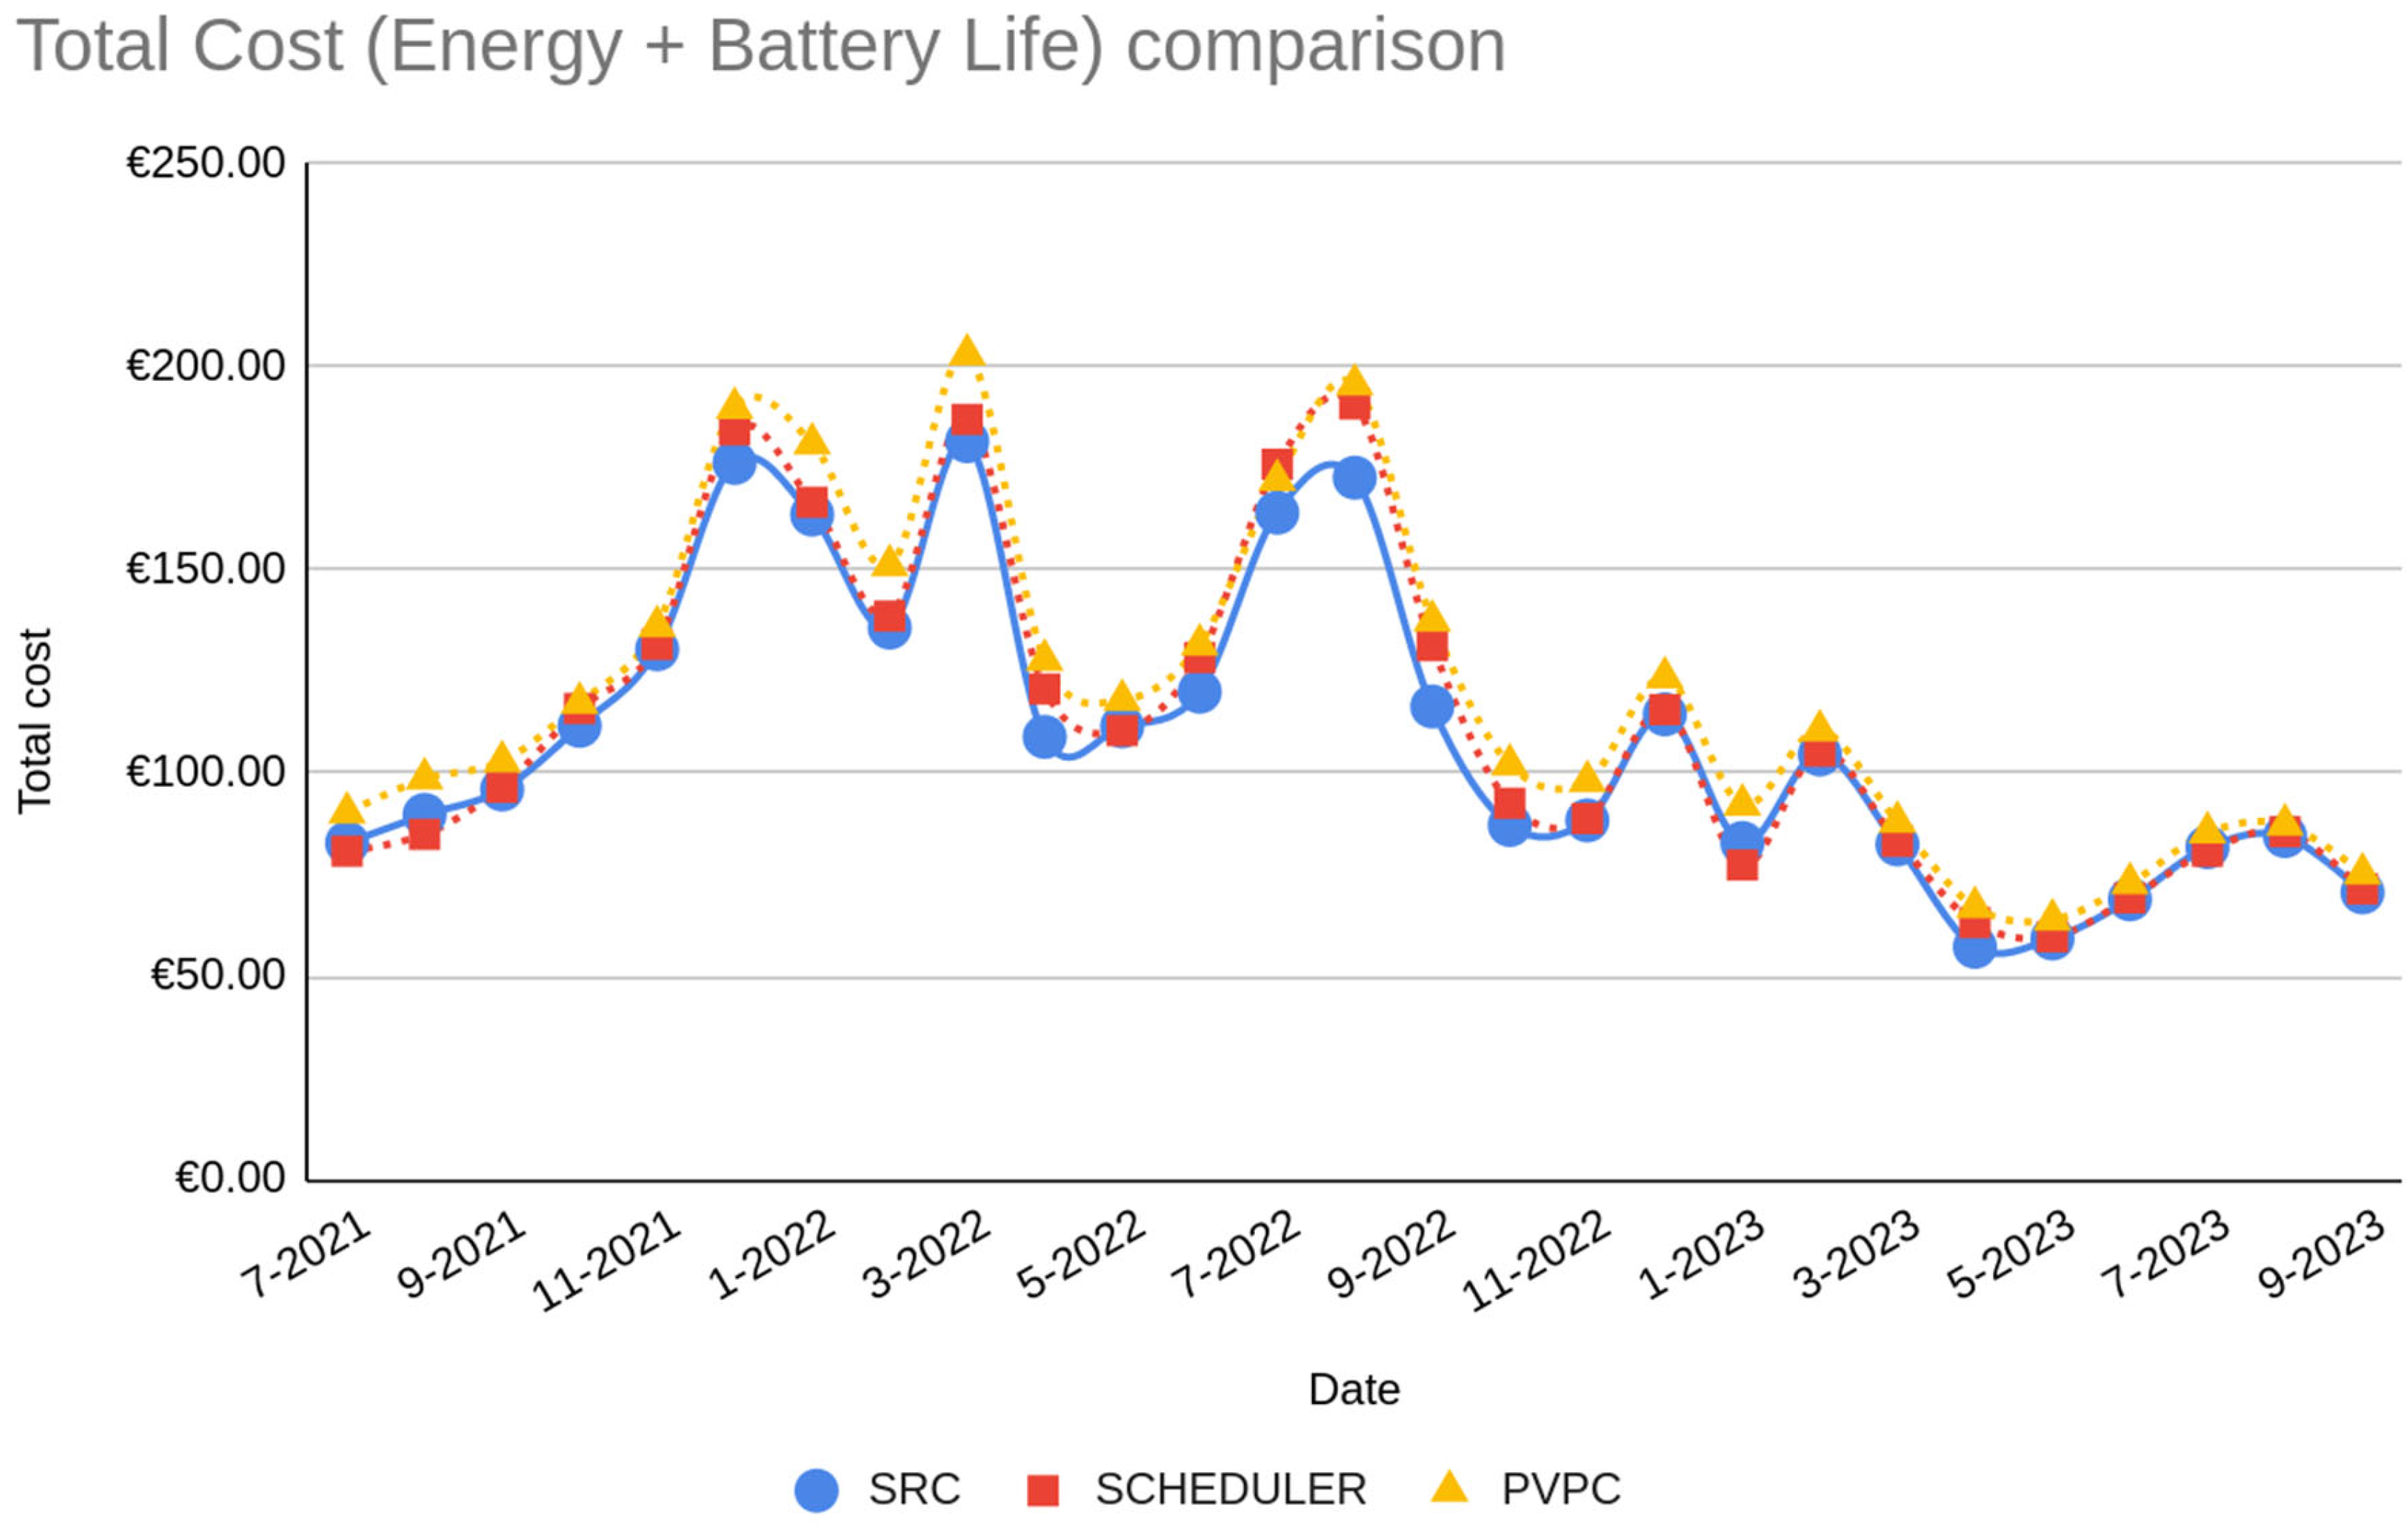
Figure 11 show the costs for PVPC, SRC and the regular scheduler.
Figure 10 only shows the energy costs, while
Figure 11 represents the final cost of the system: total energy cost plus battery energy cost when using the best battery pack according to our calculations, the SMILE-BAT-13.3P + ESS SMILE 5 5000W HYBRID I/C BESS.
Finally,
Table 8 numerically summarizes the previous figures: our proposal (SRC) allows for a 44.24% higher economic benefit (net gains after subtracting the battery energy cost) and would pay for the battery pack 30.67% faster than a scheduler used with a hybrid inverter charger. It would also be economically viable in all months for the BESS included in it.
Statistical Significance
Upon statistical analysis of all our results, we can conclude that both our solution and a regular scheduler offer an economically viable (cheaper average daily and monthly prices) solution over PVPC (paired T.T.; p < 0.001; monthly costs, including battery degradation: M_src = EUR 101.47, s_src = EUR 36.18; M_sch = EUR 106.49, s_sch = EUR 39.61; M_pvpc = EUR 117.84, s_pvpc = EUR 40.29; respectively) for the average home (4526.00 kWh/year electricity consumed, average 90 sqm home with electric water heater, electric cooker and oven, where three adults or two adults and two children live together) during the studied period (from June 2021 to September 2023). We can also state that our system (SRC) is better than the regular scheduler when analyzing both hourly costs and final monthly costs (billing period; paired T.T.; p < 0.001).
Considering the studied period, using our proposal, we achieved an average monthly savings of 13.89% over PVPC (EUR 16.37 +/−EUR 5.99), while using a regular scheduler, the savings were 9.63% (EUR 11.35 +/−EUR 4.85), which makes our solution 44.24% better than a regular scheduler. If we only consider raw energy savings (monthly bills) and disregard battery life hidden costs, our solution would offer a 36.16% average discount over PVPC (average monthly saving of EUR 31.30 +/−EUR 6.80), while a regular scheduler would be limited to 23.17% (average monthly saving of EUR 22.17 +/−EUR 5.60).
We also calculated the 99.9% confidence intervals for our key results. For SRC’s total monthly savings over PVPC, the interval was [EUR 12.19, EUR 20.55], while for the scheduler, it was [EUR 7.97, EUR 14.74]. Similarly, the interval for SRC’s raw energy cost savings was [EUR 26.56, EUR 36.03], and for the scheduler, it was [EUR 18.26, EUR 26.08]. These intervals further reinforce the statistical significance and reliability of our conclusions, demonstrating that the observed savings are consistent and not merely a result of random fluctuations. The chosen 99.9% confidence level aligns with the rigorous thresholds used in our hypothesis testing (p < 0.001), ensuring the robustness of our findings.
In addition to confidence intervals, we conducted an uncertainty analysis to enhance the robustness of our results. Uncertainty was estimated using the standard error of the mean (SEM). For the raw energy cost savings, the uncertainty for SRC was EUR +/−1.29, while for the scheduler, it was EUR +/−1.06. For SRC’s total monthly savings over PVPC, the propagated uncertainty was estimated to be EUR +/−1.13, and for the scheduler, it was EUR +/−0.92. These values provide further insight into the variability of the results and reinforce the robustness of our conclusions, confirming that the observed savings are not only statistically significant but also robust to variations in input factors. Future studies could extend this analysis by incorporating Monte Carlo simulations to explore scenarios with even greater variability in inputs and market dynamics, providing further confidence in the scalability and robustness of our approach.
As previously mentioned, the costs related to electrical installation or hybrid inverter acquisition are not included in our calculations, since, unlike batteries, these should be a one-time payment, given their much higher life expectancy. However, even if we include the hybrid inverter acquisition cost as part of the battery energy cost, both the scheduler and our solution would still be superior to PVPC when using the best BESS (paired T.T.; p < 0.001; monthly costs, including battery degradation: M_src = EUR 107.49, s_src = EUR 36.40; M_sch = EUR 110.86, s_sch = EUR 39.88; respectively). In this case, the average monthly savings over PVPC would drop down to 8.78% (EUR 10.35 +/−EUR 5.81) and 5.92% (EUR 6.99 +/−EUR 4.63), respectively. Also, SRC would still be a better option than the regular scheduler for all studied BESSs.
It is also worth noting that, even if the regular scheduler was statistically better than PVPC overall, there were some months in which this solution was detrimental (the monthly bill was actually higher; see
Figure 9), while this never occurred with our proposal for any of the considered scenarios. This is a direct result of our software’s ability to calculate real profits by factoring in both grid energy and battery life costs.
4. Discussion
In this research, we presented Smart Relays and Controller (SRC), an automated IT system capable of managing and supplying electricity for home use at its minimum daily costs. Our system scrapes hourly tariff prices for the next day directly from the official channel (the Red Eléctrica website), charging a battery energy storage system (BESS) only during the cheapest hours for that day and supplying electricity to the home energy system from the cheapest hourly source, either the battery or the main grid.
To validate our system, we established a three-way comparison between it, a regular programmable scheduler (both of them coupled with a hybrid inverter charger to operate and charge a battery system) and the regular PVPC tariff. We studied the energy cost we would incur with all of them when applied to the average home (4526.00 kWh/year electricity consumed, 90 sqm home with electric water heater, electric cooker and oven, where three adults or two adults and two children live together) over a 27-month period from June 2021 to September 2023. The electricity demand and prices were taken from the eSios website (Red Eléctrica’s system that performs information and process management tasks specifically related to the electricity market in Spain).
We found that our system (SRC) is economically better than both the regular scheduler and the PVPC tariff, with the regular scheduler performing worse than SRC but also better than PVPC (paired T.T., p < 0.001; monthly costs, including battery degradation: M_src = EUR 101.47, s_src = EUR 36.18; M_sch = EUR 106.49, s_sch = EUR 39.61; M_pvpc = EUR 117.84, s_pvpc = EUR 40.29; respectively).
For the studied period, our solution would have saved us EUR 876.29 compared to PVPC, which accounts for an average 36.16% discount on PVPC electricity bills and 13.89% when factoring in battery life costs. Savings can be expected to be 44.24% higher with our solution than with a regular scheduler.
Although the system faced a period of unusually high electricity prices, it performed well despite the unfavorable conditions. This demonstrates the resilience of the system in scenarios that deviate from typical market conditions.
Our prototype also optimizes battery use (and thus battery life) to always be covered by the manufacturer’s warranty. We obtained these results without considering any European or national subsidies or incentives to potentially reduce BESS acquisition and installation costs.
Since the battery specifications, energy hourly demand and its price are based on real data, as published by battery manufacturers and eSios, respectively, and as we always followed a worst-case scenario approach, we can assure that our system would have been economically reliable and warranty-covered for the whole time frame studied for the aforementioned BESS. We also did not consider inflation, which would make our proposal even more reliable.
The validation of the SRC system relies on a detailed analysis using real-world data, including historical electricity prices and household energy demand. A prototype of the SRC system was developed as a proof of concept, demonstrating the system’s logical and electrical feasibility.
Future Work
Regarding energy price fluctuations (past or future), the maximum and minimum energy costs, in absolute terms, are not important for the system; we are only affected by the difference between them, since we only need to calculate how much money we can save on a daily basis to cover the costs of construction and deployment of our system. Future work will explore the scalability of the system in multi-user scenarios, considering how the adoption of the technology could impact energy prices and market dynamics.
We also plan to explore the system’s adaptability to future policy changes, particularly in relation to electricity pricing policies, including potential regulatory shifts that may alter the cost structure and economic feasibility of the system.
Considering that our system is economically feasible only if a combination of circumstances is maintained for long enough, and keeping in mind the volatile nature of the electricity market, it may be risky to advise the installation of a whole system like ours if one’s current home does not have a working BESS. However, for renewable–grid hybrid systems that already include a BESS (since batteries are an essential part of these systems), our solution could offer significant savings as long as the user opts for PVPC-like tariffs.
Regarding the future viability of our proposal, after years of price drops, the lithium-ion battery pack has remained stable over the last three years (2021–2023), currently sitting at around USD 152/kWh [
62]. However, it is expected to continue dropping in the long term, reaching as low as USD 62/kWh by 2030 [
63,
64], which will further reduce BESS prices, making our solution even more viable.
The European and national regulations for the electric market and the existence of market-linked and hour-dependent tariffs should remain in place until at least 2030 [
1,
2,
3,
48]; therefore, our proposal should be valid until at least that year. Some changes to the PVPC tariff for 2024 have already been approved to protect consumers from rare but extreme market volatility, but the hourly discrimination remains [
50]; its effect on the price difference between peak and off-peak energy costs and how this affects our prototype is part of our future work.


 ,
, 