1. Introduction
National Basketball Association (NBA) games are fast-paced, with four quarters that test players’ skills, stamina, and adaptability. Traditional stats like points, rebounds, and assists measure performance but do not always capture the way events happen during a game. As the league embraces real-time data, advanced analytics, and machine learning (ML), it is clear that not all quarters are the same.
Over the last 20 years, NBA competition has gotten tougher, with a faster pace, rule changes favoring offense, and new types of players redefining positions [
1]. Stephen Curry changed the game with his three-point shooting [
2], while big men like Nikola Jokić mix scoring and playmaking in ways that did not exist before. These shifts show how the league is always evolving, making it important to track how performance changes throughout a game. Key moments can happen early when a fast offense builds a big lead or late when defenses lock-in. Looking at each quarter separately, instead of as one long game, can help analysts spot hidden patterns that influence a team’s strategy and success.
NBA games are full of momentum swings. A player might come out strong but fade in the second half, or coaches might adjust matchups late to slow down star scorers. Traditional box scores blur these shifts by averaging all four quarters together. Breaking the game down by quarter helps spot changes in offensive efficiency, defensive pressure, ball control, and pace that might otherwise go unnoticed.
Clutch moments are not just about the final minutes. A team that goes on a big run in the second quarter to build a double-digit halftime lead might already determine the game, even if the final score looks close. Likewise, star players who dominate early can set the tone, controlling the pace and forcing opponents to adjust. That is why coaches need a clear view of who performs best during each quarter, helping them make smarter rotations and strategic play calls [
3].
Basketball analytics has moved beyond basic statistics, like points per game, to more advanced metrics that measure overall offensive and defensive impact. For instance, Offensive Rating (OffRtg) estimates the number of points a player produces per 100 possessions. On the other hand, Defensive Rating (DefRtg) tracks how many points a player’s team allows while that player is on the court. Metrics like Effective Field Goal Percentage (eFG%) and True Shooting Percentage (TS%) help analysts adjust for the extra value of three-point shots and free throws, respectively [
4,
5].
Other metrics look beyond scoring. Usage Percentage (USG%) measures how many offensive possessions a player “uses” via shot attempts, free throws, or turnovers. Player Impact Estimate (PIE) tracks a player’s complete contributions (shooting, assists, rebounds, steals, and more) in relation to overall team stats [
5]. Understanding when these advanced statistics spike or decline across quarters can help teams plan matchups. For example, a high-usage guard in the early periods might wear down and become turnover-prone in the fourth quarter. This type of insight only comes through analyzing data by quarters.
Regular season and playoff games are different. The pace and defensive strategies in October do not match the intensity and urgency of April and May. Playoff defenses tighten, referees allow more physical play, and rotations get shorter [
6]. This makes quarter-by-quarter analysis important, as every possession matters. Late-game moments can decide whether a team moves on or goes home. Comparing advanced statistics across quarters in both settings reveals which players thrive under pressure and which ones struggle.
Teams that succeed in the playoffs often rely on strong fourth-quarter defense or smart bench rotations early to keep their stars fresh for crunch time [
7]. Quarter-specific stats can help explain why a player like LeBron James can sustain elite performance throughout a game, while certain specialists excel only in the opening or closing minutes.
Professional basketball is a mix of athleticism, skill, and strategy. Analyzing performance by quarter will help make the strategy side clearer for coaches, analysts, and team executives. Coaches can spot mismatches in specific quarters and adjust rotations on the fly. Front offices looking at trades or free agents might see more value in a specialist who has a high net rating in short stretches, even if their overall statistics do not stand out.
Sports betting markets also consult advanced analytics [
8]. Quarter-based performance predictions can influence live betting lines, especially for micro-wagers on quarter outcomes. Media coverage benefits from narratives that explain how a team overcame a second-quarter deficit or how a star regularly dominates the final 12 min.
Background
Sports analytics has evolved into a dynamic field, combining stats and technology to better understand player performance and game strategy [
9]. While baseball and soccer often get the most attention, basketball has quietly become one of the most data-driven sports.
The rise of sports analytics is commonly traced back to baseball. This analytical approach gained recognition with the publication of
Moneyball in 2003 [
10], which discussed how the Oakland Athletics used data to build a competitive team on a limited budget, changing the sport’s strategic approach. Other sports, including tennis and soccer, soon adopted data-driven methods, such as Hawk-Eye tracking in tennis [
11] and advanced metrics like Expected Goals (xG) in soccer [
12]. Initial successes like these proved that sports analytics can help teams.
The integration of analytics into basketball took off with Dean Oliver’s work,
Basketball on Paper, which is credited as the start of modern basketball analytics. Published in 2004, the book introduced metrics like Offensive Rating (ORtg) and Defensive Rating (DRtg). Oliver’s concept of measuring how many points a player’s team scores or allows per 100 possessions changed how coaches and analysts viewed efficiency [
13,
14].
Following Oliver, the NBA introduced official “advanced” box scores that track eFG%, TS%, Pace, Usage Percentage, and more. Although these metrics produced intriguing results, they still represented the entire game as a single average [
4,
5].
In 2016, Ruano et al. [
15] analyzed NBA game dynamics during the fourth quarter of close games. Their study highlighted that situational and technical/tactical variables, such as starting quarter score, shot selection, defensive pressure, and ball possession success, significantly impact game outcomes in high-pressure situations. Later, in 2024, Sarlis et al. [
16] introduced the Estimation of Clutch Competency (EoCC), a metric that combines offensive output, defensive performance, and playmaking to measure a player’s impact in the final minutes of tight contests. Research on “clutch time” in the last five minutes revealed that certain players excel in creating decisive shots and delivering tight defense. This detailed analysis of situational performance has led NBA front offices to weigh not only overall skill but also performance in critical game moments when drafting and signing players.
ML algorithms, from regression-based models to neural networks, have long been used to predict game outcomes based on season-long stats. For example, in 2024, Papageorgiou et al. [
17] compared 14 ML models and found that tree-based models provided strong predictions. However, interpreting their results can be difficult, as a random forest or deep neural network may achieve high accuracy without clearly explaining why or when specific performance metrics matter.
Association Rule Mining (ARM), by contrast, is effective in finding specific patterns [
18], such as, “If a player has a high Net Rating in the second quarter, then the team is more likely to win”. This explicit if/then logic suits coaches who want direct insights they can apply. While ARM is common in retail analysis, where items frequently purchased together are identified, it also works in sports by turning performance metrics into “items”. For example, a quarter might yield “high eFG%, low Defensive Rating, medium USG%”, and these patterns can be linked to a final result.
However, ARM is not commonly used in basketball analytics. A notable exception is Sarlis et al. [
19], who, in 2024, leveraged ARM to examine the relationships between player salaries, recovery times, and team financial losses. Their findings revealed that lower-salaried players tend to have shorter recovery times and are often associated with higher team losses, while high-cost players with prolonged recovery times impose significant financial burdens on teams. Our study demonstrates the potential of ARM beyond retail and how it can uncover both performance-driven patterns and strategic insights in basketball.
Beyond basketball, ARM has been successfully applied in various sports to extract performance patterns and tactical insights. Lee et al. [
20] leveraged weighted ARM to analyze soccer formations, identify player synergies, and predict tactical setups by integrating player rating data into a traditional ARM. In volleyball, Wenninger et al. [
21] used sequential ARM to analyze over 400 elite beach volleyball matches, uncovering rally patterns influencing serve effectiveness, defensive positioning, and attack success. Those studies validate the versatility of ARM in modeling game dynamics across different sports.
2. Data and Methods
Introducing the core elements of our study, we outline how we investigated quarter-by-quarter NBA performance over two decades (2004–2005 to 2023–2024). Our approach comprises four parts: Aims and Objectives, Methodology, and Data Mining. These components detail the steps from research goals to the extraction of association rules, emphasizing the factors that influence game outcomes and player performance.
2.1. Aims and Objectives
The aim of this work is to establish if NBA players’ advanced metrics vary over different quarters and whether these quarter-specific metrics drive regular season and playoff results. This research attempts to achieve the following research objectives:
Pinpoint which advanced statistics have the greatest impact on winning in each quarter. We seek to determine if certain metrics spike in importance during the second quarter, for instance, or in the final minutes of the fourth.
- 2.
Compare Regular Season and Playoffs
Examine how these quarter-by-quarter trends differ in the postseason, where higher intensity, smaller rotations, and strategic shifts can alter a player’s on-court role. We aim to show which metrics become more (or less) pivotal under playoff pressure.
- 3.
Generate Actionable Insights
Present association rules and descriptive findings to guide coaching decisions, roster management, and player development. By identifying quarter-specific strengths and weaknesses, teams can optimize lineups, manage fatigue, and apply strategic adjustments more effectively.
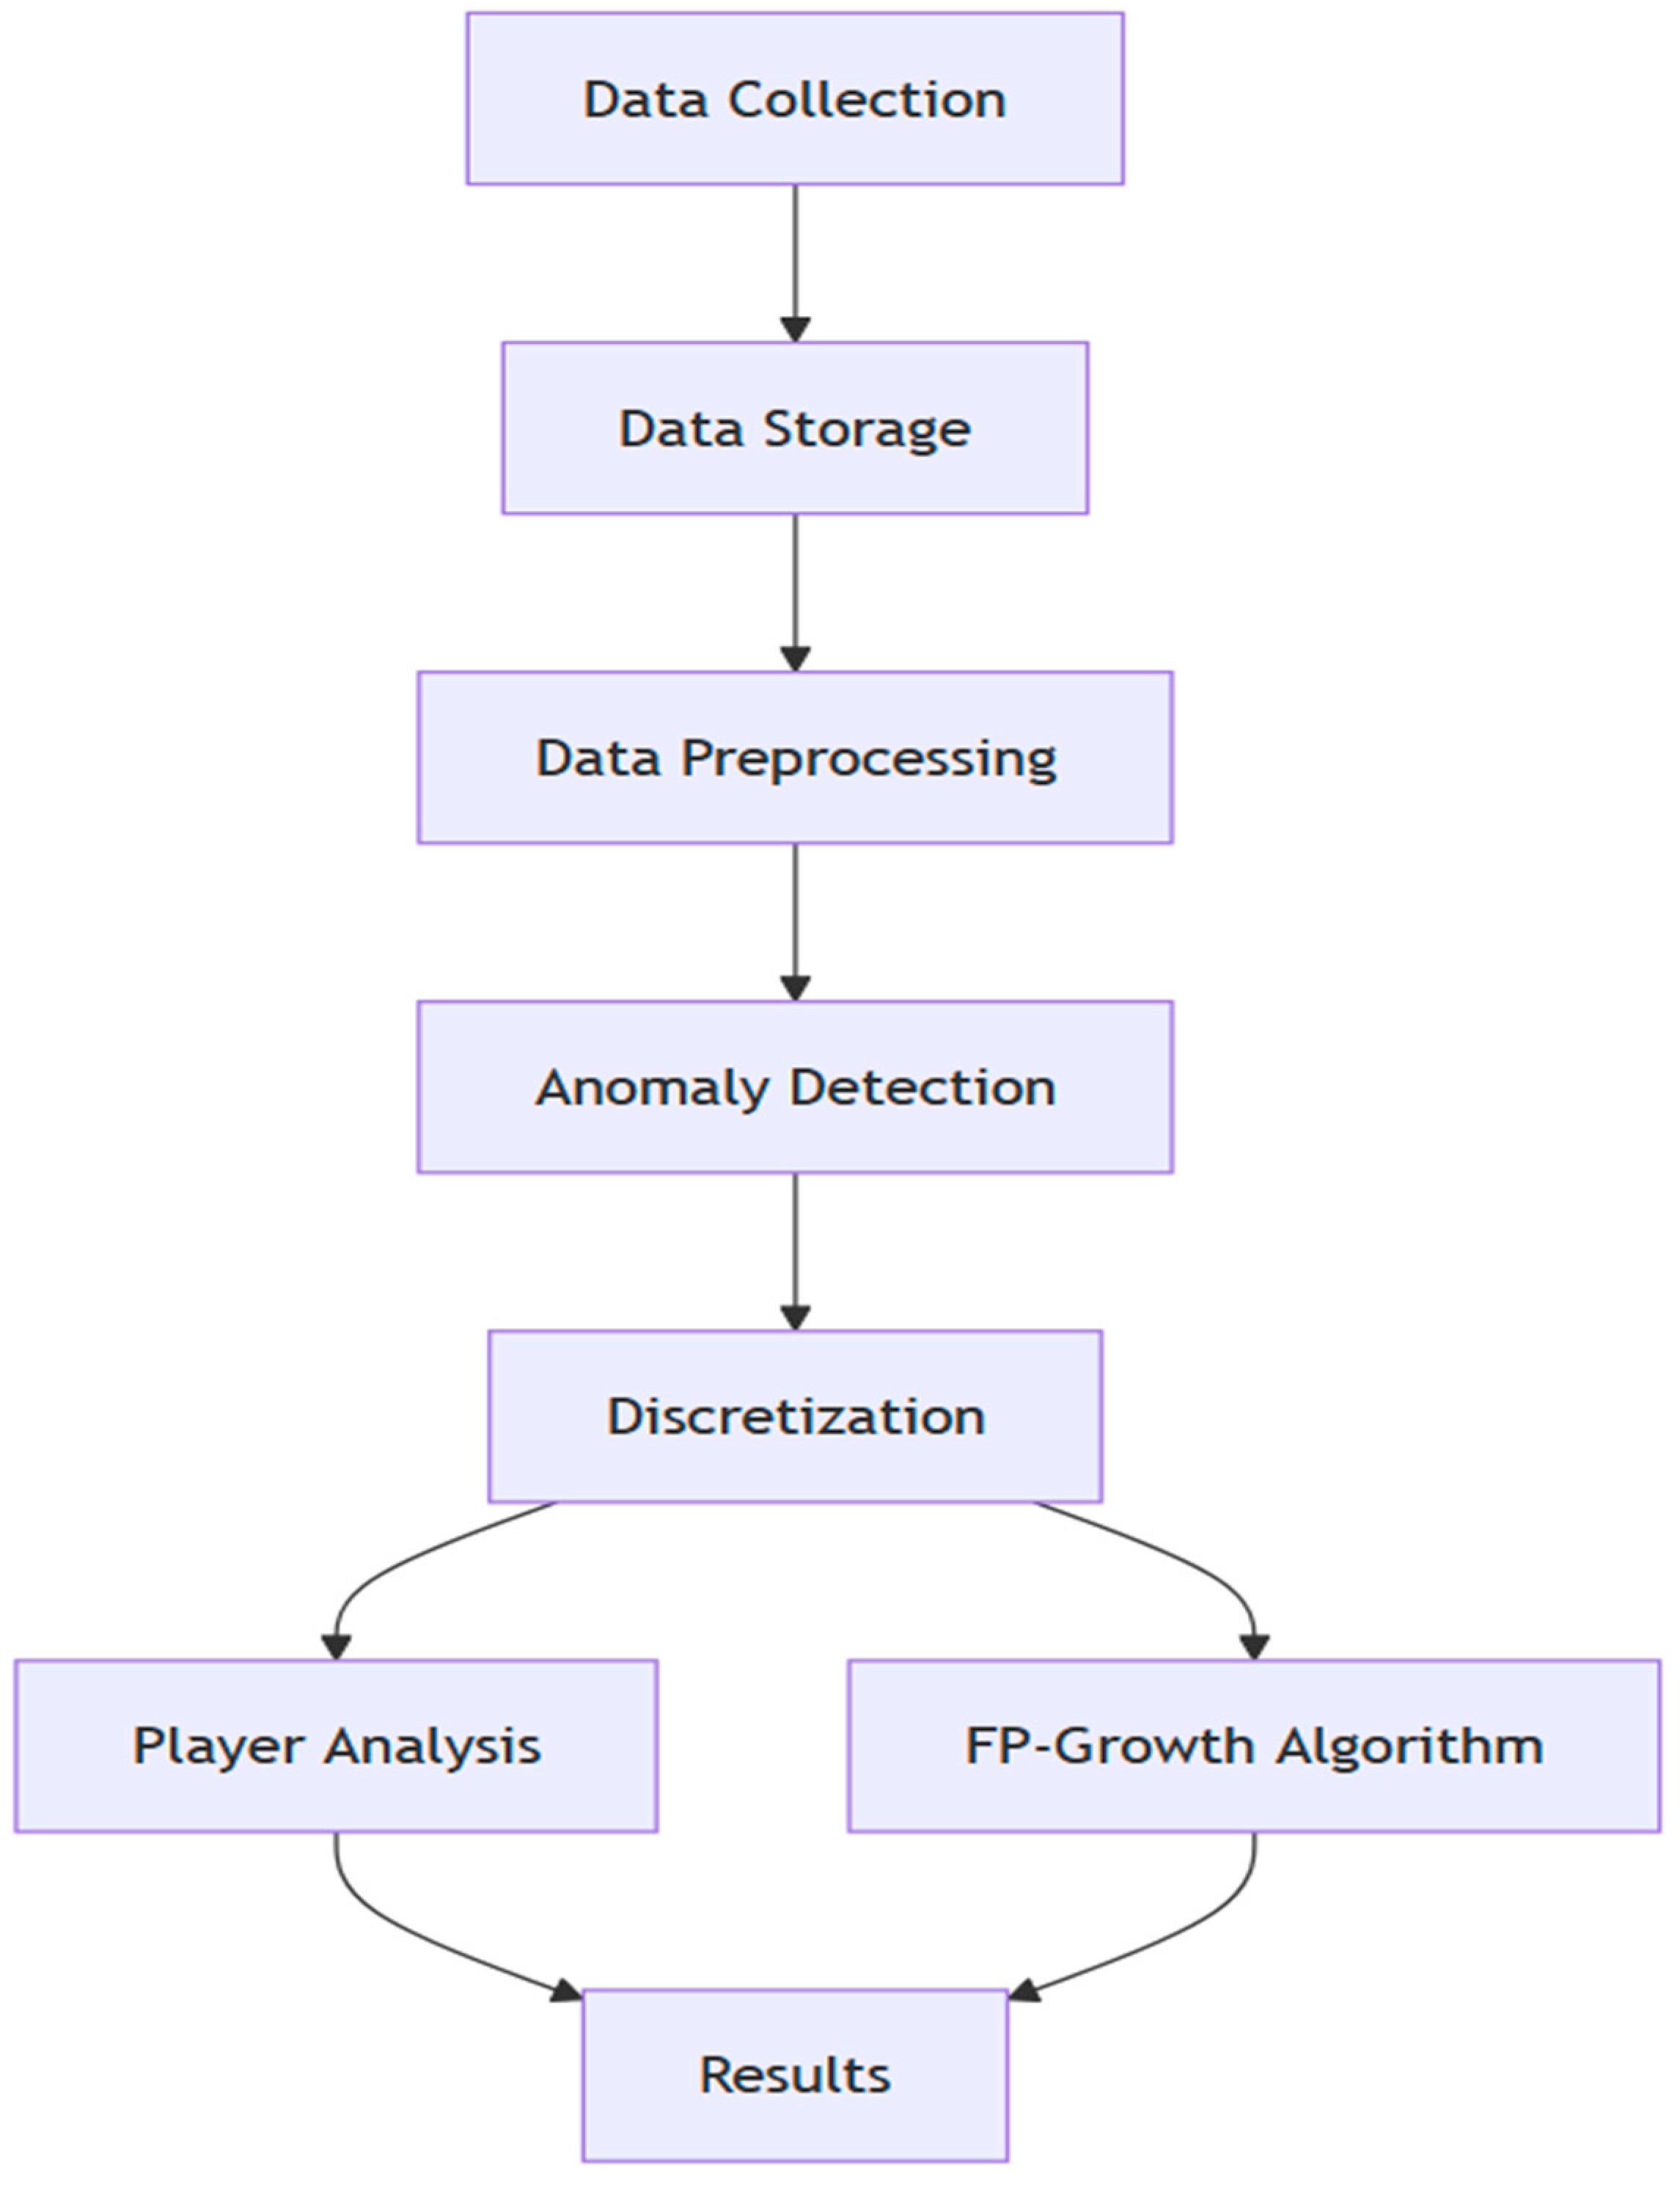
2.2. Methodology
Our methodological framework, shown in
Figure 1, hinges on collecting reliable NBA data, cleaning and consolidating them, and then applying data mining to reveal quarter-level performance patterns.
2.2.1. Data Collection and Aggregation
We retrieved data using NBA’s official API via Python 3.11.11 scripts. Endpoints included commonallplayers [
22] (to identify active players), leaguegamelog [
23] (to verify participation), playergamelog [
24], and boxscoreadvancedv3 [
25] (to retrieve quarter-level advanced metrics). The data were segmented by quarter (Periods 1–4), with overtime periods (5+) flagged separately. We collected game logs and advanced metrics (e.g., Offensive Rating, Defensive Rating, Effective Field Goal Percentage, Usage Percentage) for both regular seasons and playoffs from 2004–2005 to 2023–2024. Each player’s metrics were stored by quarter for each game ID, and game outcomes (win/loss) were assigned via a new column, Result, aligned with the relevant team identifier. Multiple CSV files from all 20 seasons were combined into separate datasets for the regular season and playoffs.
Figure 1.
Data preprocessing steps and applied methods.
Figure 1.
Data preprocessing steps and applied methods.
2.2.2. Missing Values and Consistency
The next step after the data collection involved removing duplicate rows in each CSV. We then examined each column for missing values, which appeared in the “position” field. To fix those, we used the commonplayerinfo endpoint, retrieving each player’s position based on their unique ID. In cases where a player’s position was labeled inconsistently across games, we reassigned the most frequent position. Finally, we saved the updated data in the CSV files, ensuring all records were complete and consistent for further analysis across the dataset.
2.2.3. Filtering
To focus on players with significant impact, we filtered out cases of sporadic or minimal participation. In the regular season, only players who participated in at least 20% of their team’s games were retained. For each game, we further filtered out players who did not play for more than 20% of the total game time. This ensures that each record represents meaningful on-court participation. The same criteria were applied to the playoffs dataset.
2.2.4. Anomaly Detection
Anomalies can skew analysis, so after we standardized the data to maintain uniform numeric scales, we used four techniques to detect outliers in our features. In this study, we selected a combination of Z-Score, Interquartile Range (IQR), Isolation Forest, and DBSCAN methods due to their complementary strengths and suitability for the diverse characteristics of our dataset.
The Z-Score method [
26] flagged data points beyond three standard deviations from the mean, aligning with the empirical rule that this covers around 99.7% of normally distributed data. The Interquartile Range (IQR) method [
26] then identified values lying more than 1.5 times the IQR below the first quartile or above the third quartile, making it useful for skewed distributions. We applied Isolation Forest [
27] with a 5% contamination level, which isolates anomalies based on how few random splits are needed to separate them from the rest of the data. Finally, we used DBSCAN [
28] with an epsilon of 0.5 and a minimum sample size of 5 to detect points outside dense clusters [
28]. By combining these four algorithms, we leveraged their distinct capabilities, creating a comprehensive and robust anomaly detection framework. Retaining only records marked as outliers by at least three of these methods minimized the risk of removing valid data and increased the reliability of our anomaly detection process. This consensus-based approach ensured thoroughness in identifying genuine outliers whilst preserving data integrity.
Table 1 displays the final dataset size and the number of unique players analyzed.
2.2.5. Discretization
For ARM, we converted continuous metrics into categorical bins labeled “low”, “medium”, and “high”. We experimented with several methods to achieve this conversion. Equal Width Binning [
18,
29] divides the range of each metric into equal intervals, though it may be less effective if the data are skewed. Equal Frequency Binning [
18,
29] creates bins with an equal number of observations, which helps manage skewed data but can be influenced by outliers. For metrics highly skewed towards zero [
18], like Assist Percentage and Assist-to-Turnover Ratio, we used Manual Binning with custom thresholds based on domain knowledge. We examined each metric’s distribution and counts to find natural breakpoints for low, medium, and high ranges, guided by typical performance levels (e.g., an Assist Percentage below 10% often indicates limited playmaking). For example, in Assist Percentage, bins were set at 0.10 and 0.30, so values below 10% were ‘low’, 10–30% were ‘medium’, and above 30% were ‘high’.
K-Means Clustering [
29] was used with three clusters, repeated 10 times, and a random state of 42. These settings made sure the results were stable across runs while revealing distinct groupings in the data. After generating clusters for each feature, we compared their bin distributions with the results from our other discretization methods. We looked for a balanced split among “low”, “medium”, and “high” categories, checking how many data points landed in each bin and how well each cluster captured a meaningful range of values. Finally, we chose the binning approach that provided the most interpretable and balanced distribution for each metric. This manual review ensured that the discretized outcomes were both statistically reasonable and practical for analysis.
2.2.6. Category-Based Datasets
Data processing took place on Google Collaboratory [
30], which provided a TPU and 334 GB of RAM. Even with these resources, running the FP-Growth on all features at once caused memory issues and failed to execute. To manage this, we grouped metrics into five distinct categories. The Offense category includes metrics such as Offensive Rating, eFG%, TS%, Usage Percentage, and Offensive Rebound%. The Defense category contains Defensive Rating and Defensive Rebound%, while the Ball Handling category covers Assist Percentage, Assist Ratio, Turnover Ratio, and Assist-to-Turnover Ratio. The Overall Impact category encompasses PIE, Net Rating, and Rebound Percentage, and the Tempo category includes Pace and Possessions. This categorization streamlines the ARM process by allowing analysis to focus on related performance aspects.
2.3. Data Mining
In the data mining section, we used both ARM and descriptive statistics to reveal quarter-specific patterns linked to game outcomes. ARM highlighted which metric combinations correlated with wins or losses, while descriptive scores ranked players in each performance category.
2.3.1. Association Rule Mining (ARM)
The decision to use ARM in this study is based on its strength in identifying and interpreting complex relationships within large datasets. Unlike other ML approaches, ARM algorithms, such as FP-Growth, are particularly effective at discovering frequent itemsets and generating clear, interpretable rules. This capability aligns well with our research goals, which involve uncovering specific quarter-by-quarter performance patterns and their associations with NBA game outcomes. ARM also enables setting precise thresholds for support, confidence, and lift, ensuring that generated rules are meaningful, reliable, and practically actionable [
31,
32].
Our analytical tool was FP-Growth [
33], chosen for its efficiency in large datasets. Each player/game/quarter combination was treated as a “transaction”, with itemsets comprising that quarter’s binned metrics (e.g., “low_defensiveRating_Period3” or “high_trueShootingPercentage_Period4”) along with the final game result (“W_Result” or “L_Result”). To manage computational constraints, we initially set the minimum support at 0.005, confidence at 0.7, and lift at 1.2. However, due to memory limitations, we iteratively lowered the confidence threshold to 0.6 and lift to 1.1 while ensuring that the retained associations remained meaningful.
Filtering and analysis were conducted by retaining only those rules where the consequent indicated a win (W_Result) or loss (L_Result). We sorted the rules by quarter, which allowed us to identify which metric combinations correlated with outcomes in Periods 1, 2, 3, or 4 (and overtime for Period 5+), and we performed separate runs for the regular season and the playoffs.
2.3.2. Descriptive Statistics and Composite Scores
Alongside ARM, we computed descriptive scores to rank players in each category. Metrics in each category were weighted (for example, Usage % accounts for 30% of the Offensive Composite). To maintain a consistent scoring logic, we inverted metrics where lower values indicate better performance (e.g., defensive rating, turnover ratio). For composite calculation, we first mapped binned metrics numerically (assigning 1 for low, 2 for medium, and 3 for high). Then, for each category (Offense, Defense, etc.), we computed a weighted average of the numeric values using the assigned category weights. The final composite score per category aided in ranking players and identifying quarter-specific standouts.
Quarter-by-quarter summaries were generated by plotting the average lifts from ARM rules across each period. Tables showcased how player performances evolved from the first to the 5+ quarter, providing a clear visual representation of the trends observed in our analysis.
3. Results
We present here the quarter-by-quarter findings for the five performance categories, analyzing regular season and playoff data from 2004–2005 to 2023–2024. We started by examining shifts in category importance across quarters, then highlighted position-based differences, and concluded with the season’s top association rules.
In
Figure 2,
Figure 3,
Figure 4,
Figure 5 and
Figure 6, the horizontal axis (
X-axis) shows the game period, while the vertical axis (
Y-axis) shows the average lift from the FP-Growth analysis. Lift compares the observed association between quarter-specific performance metrics (antecedents) and game outcomes (consequent wins or losses) to their expected association if independent. A lift greater than 1 indicates a strong, non-random relationship. Each figure illustrates how strongly each category’s metrics correlate with game results across quarters.
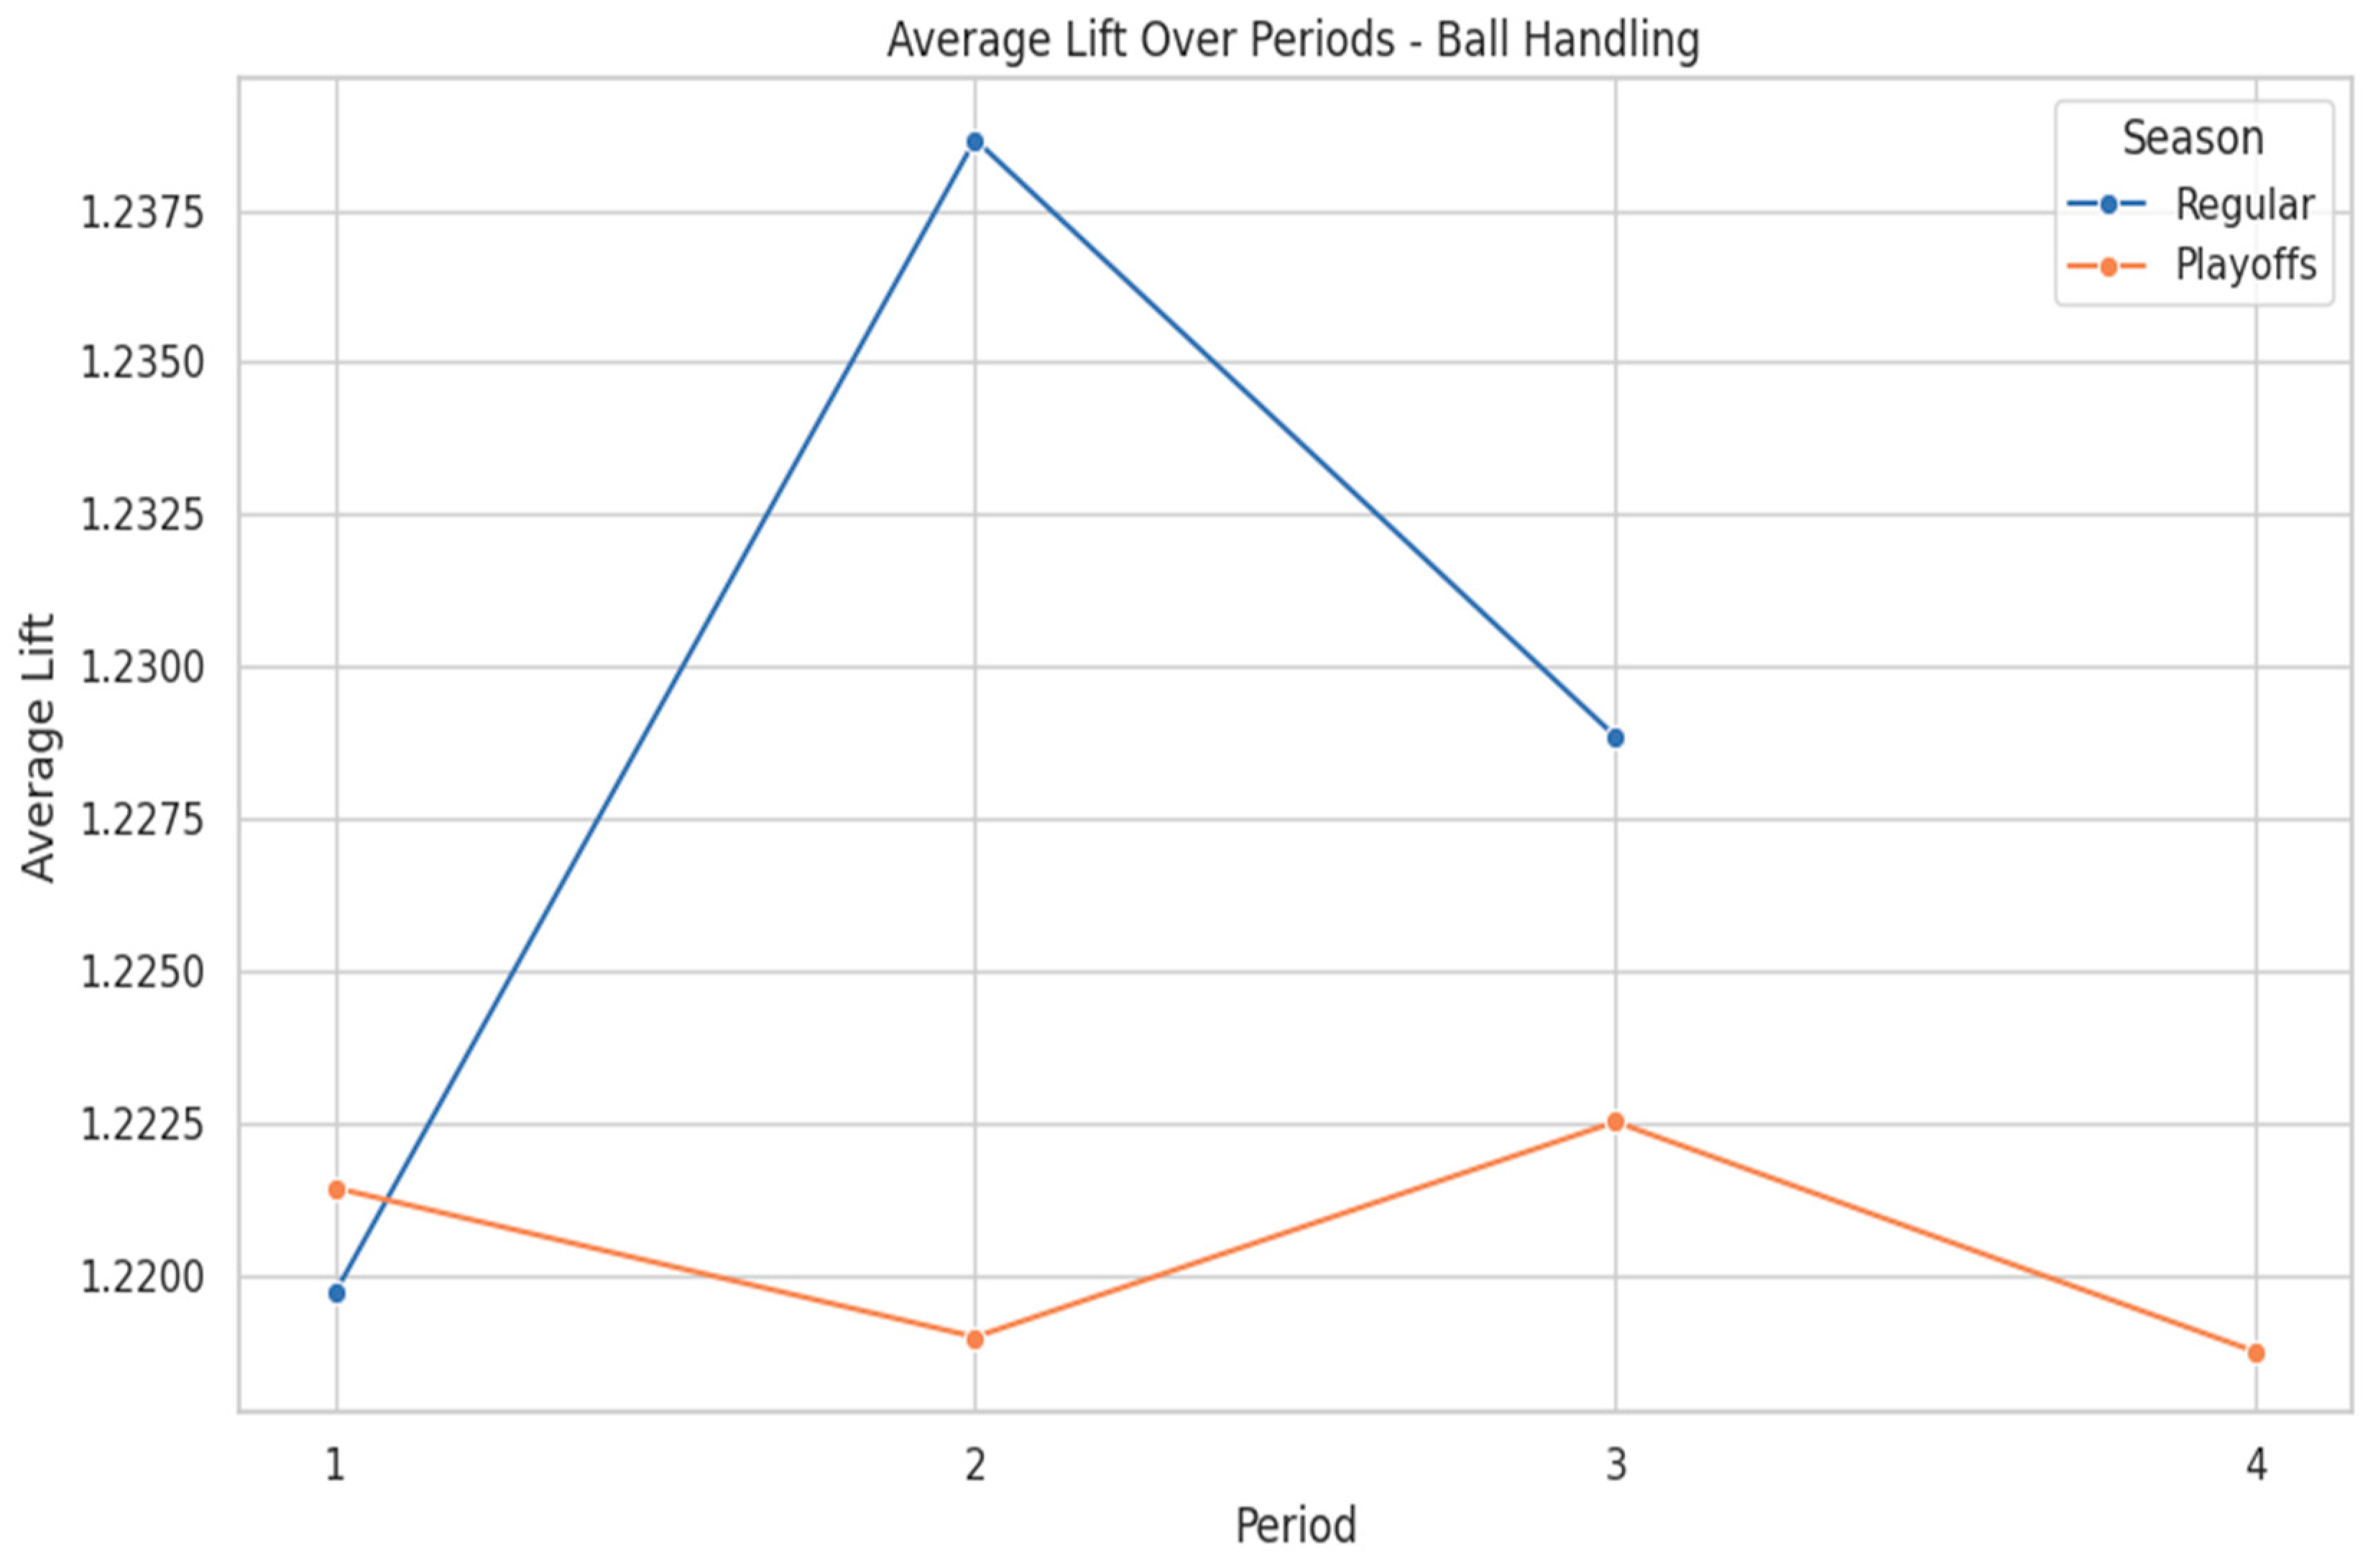
3.1. Ball Handling
Figure 2 presents the average lift for Ball Handling metrics across quarters in both the regular season and playoffs. During the regular season, lift values peak sharply in the second quarter, reaching a maximum of approximately 1.238, before gradually declining in the second half. This suggests that limiting turnover and distributing the ball effectively before halftime can impact momentum. In contrast, playoff lift values remain more stable, fluctuating between 1.220 and 1.225 across all quarters, reflecting consistent ball security under heightened defensive pressure.
Figure 2.
Ball Handling Lift by Quarter and Season.
Figure 2.
Ball Handling Lift by Quarter and Season.
In the regular season, players who excel at ball control and facilitating offense become particularly valuable in the second quarter, where assist-related metrics peak.
Table 2 shows the top 5 ball-handling players in the playoffs’ second quarter. Steve Nash leads this period with a Composite Ball Handling score of 2.162, an assist percentage of 2.495, and an assist ratio of 2.267 over 457 quarters. Cells highlighted in red indicate the top 20% (best) values in each respective column, showcasing the strongest performances among the listed players.
Table 3 shows the top 5 ball-handling players in the playoffs’ fourth quarter. Rajon Rondo excels as a key playmaker, recording a Composite Ball Handling score of 2.074 over 86 quarters. With an assist percentage of 2.360 and an assist ratio of 2.395, he leads under pressure, adapts to extended game situations, and supports his team’s offensive success. Cells highlighted in red indicate the top 20% (best) values in each respective column, showcasing the strongest performances among the listed players.
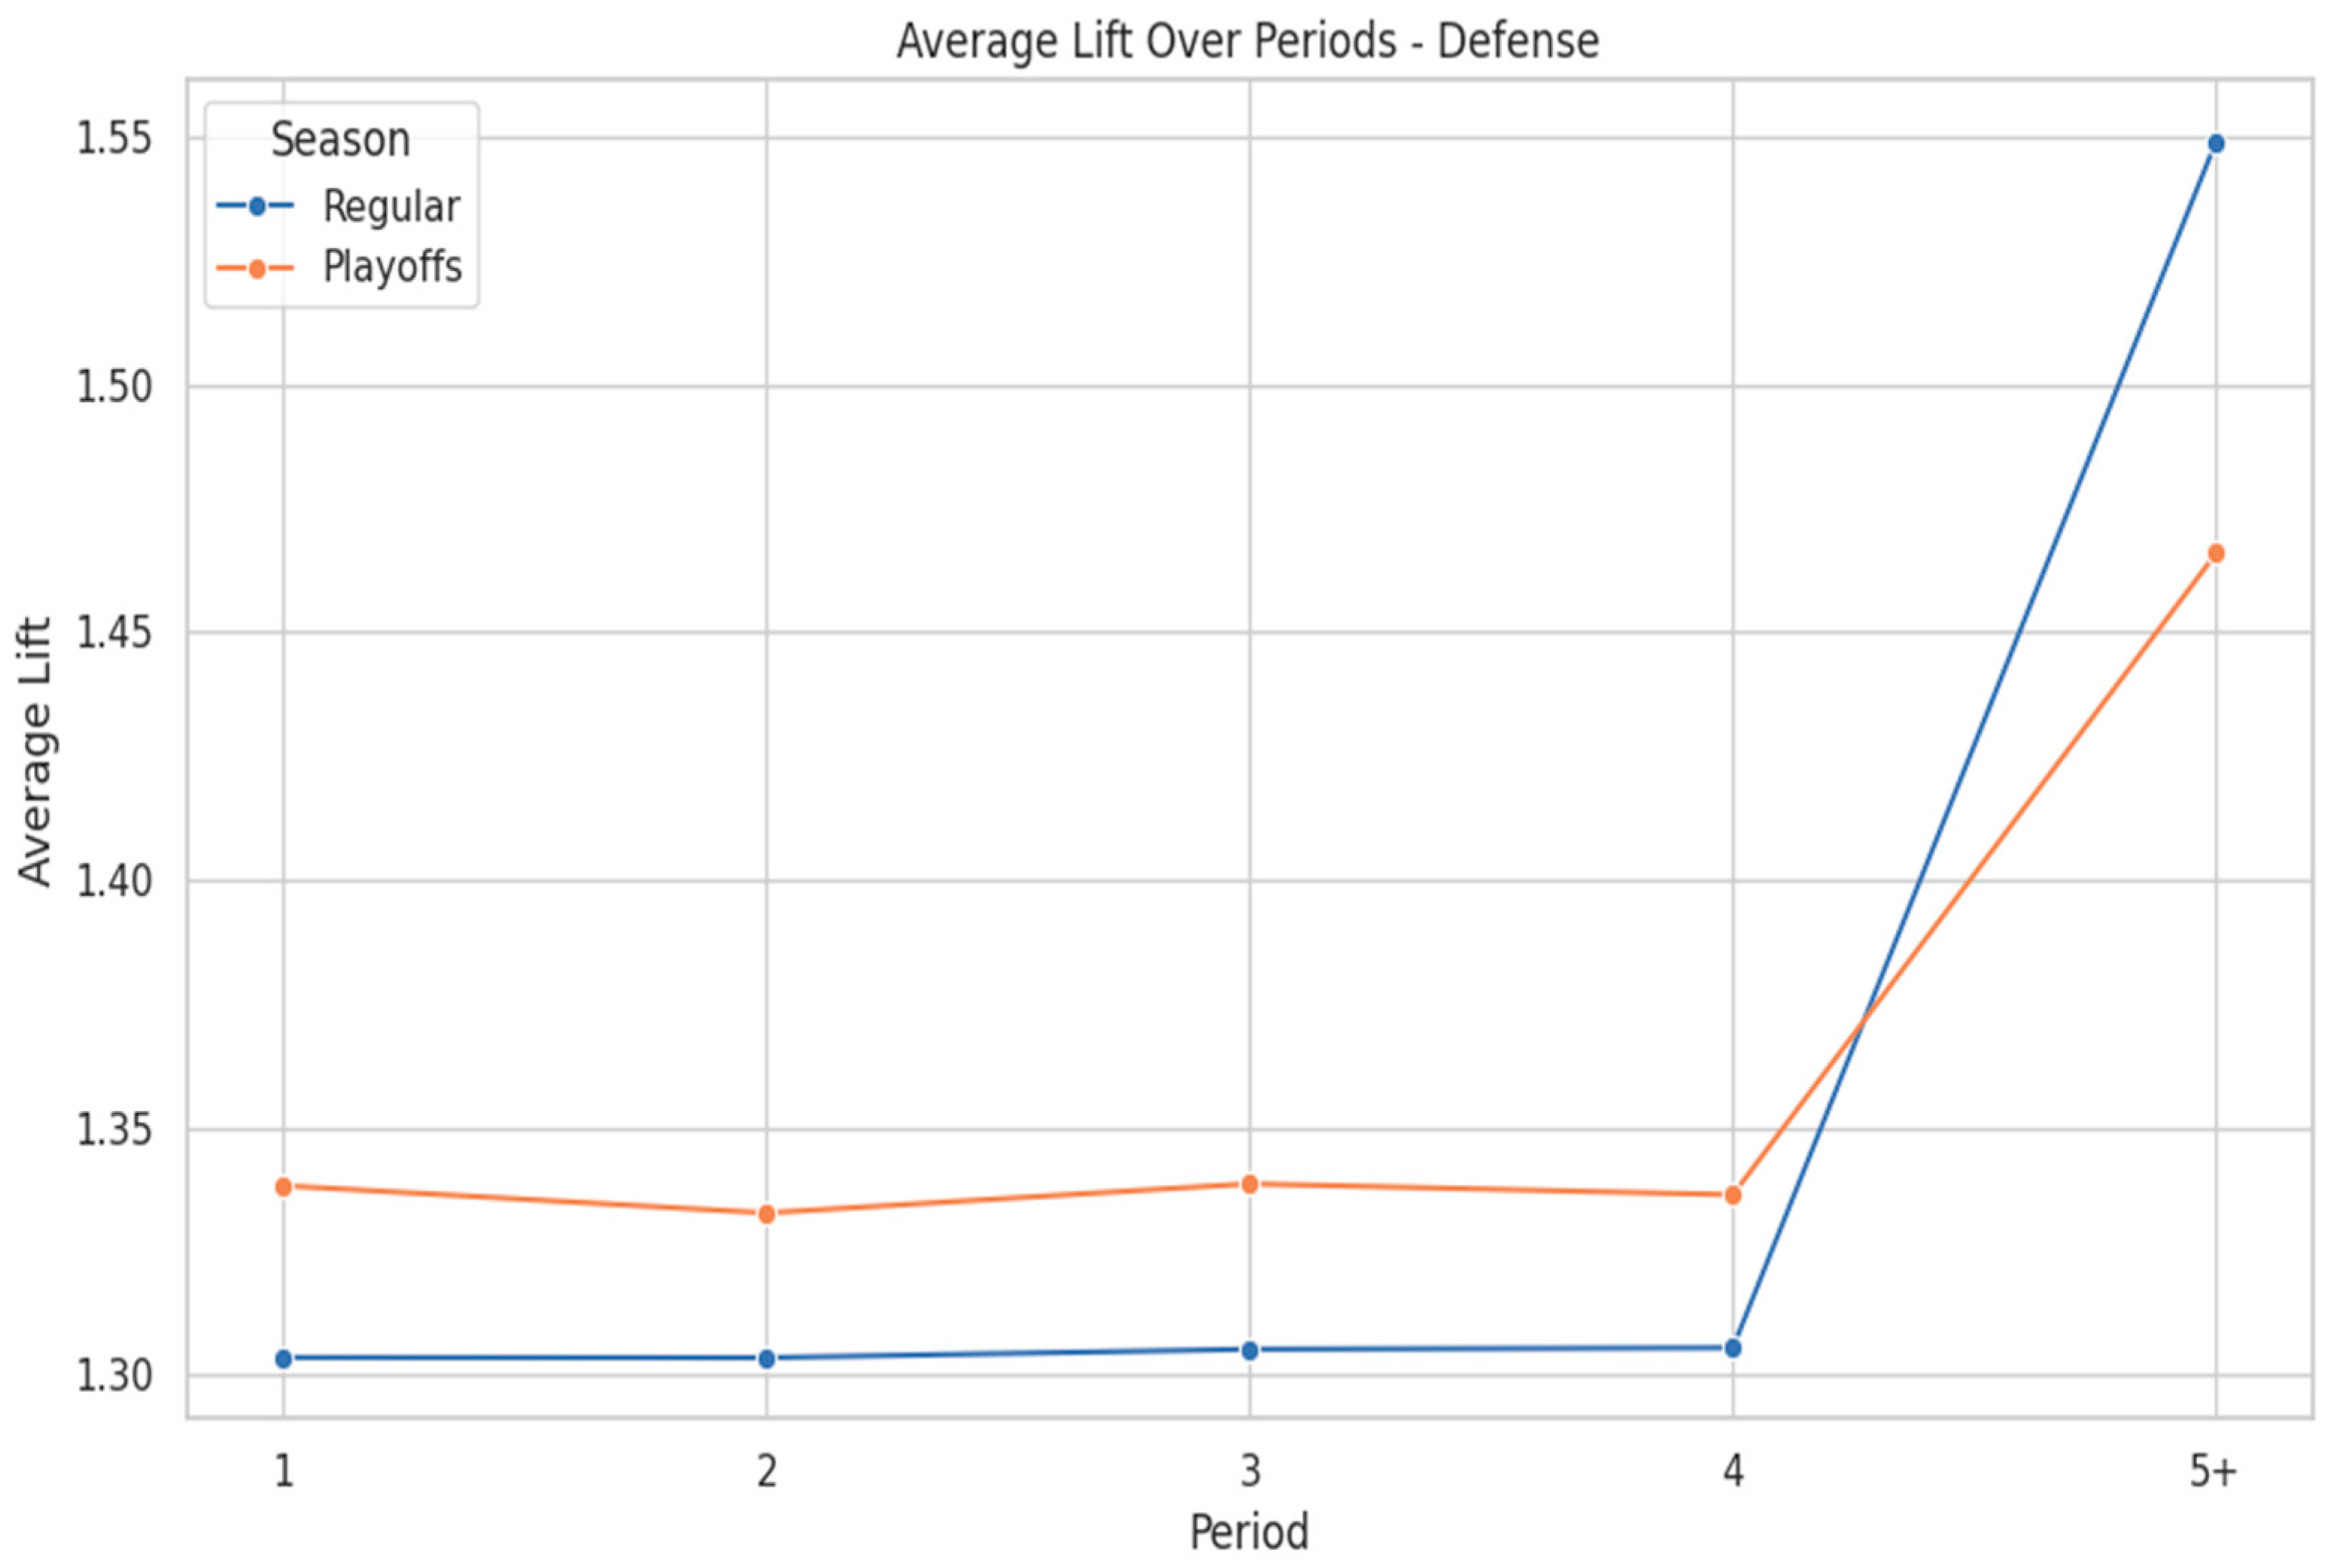
3.2. Defense
Figure 3 presents that defensive rules gain higher importance in the fourth quarter and overtime (5+), with the average lift starting from 1.30 in Q4 and peaking at 1.55 in 5+ periods during the regular season, and 1.34 in Q4, reaching 1.46 in 5+ periods in the playoffs. This trend highlights the growing impact of defense late in games, where fatigue and pressure amplify its influence on outcomes. Notably, the maximum lift for Defense rules reaches 1.65 in Q4 in the regular season, while in the playoffs, it peaks at 1.75 in Q4. This indicates that some defensive factors exhibit even stronger associations with winning in overtime and late-game situations.
Tim Duncan, in
Table 4, exemplifies this effect in the regular season, contributing defensive rebounds and paint control in critical moments, reflected in a high individual defensive score of 2.167 in the fourth quarter. Similarly, in the playoffs, Dwight Howard’s elite rim protection and rebounding efficiency stand out, with a defensive score of 2.265, reinforcing the value of a dominant defensive presence in crunch time. These individual performances align with the observed increase in defensive rule strength. Cells highlighted in red indicate the top 20% (best) values in each respective column, showcasing the strongest performances among the listed players.
Figure 3.
Defense Lift by Quarter and Season.
Figure 3.
Defense Lift by Quarter and Season.
3.3. Offense
Figure 4 shows that offensive rules gain increasing importance in the fourth quarter and overtime (5+), with the average lift rising to 1.55 in 5+ periods during the regular season and 1.45 in 5+ periods in the playoffs.
This trend reflects how offensive execution becomes more crucial late in games when teams rely on key scorers to close out matchups. The maximum lift observed for offensive rules reaches 1.70 in Q4 during the regular season, while in the playoffs, it peaks at 1.78 in Q4, emphasizing the significance of offensive metrics in the postseason.
In the playoffs, as we see in
Table 5, Nikola Jokić leads fourth-quarter offensive impact, posting a composite score of 2.410, fueled by elite effective field goal percentage (eFG%) and true shooting percentage (TS%) in clutch possessions. Similarly, Stephen Curry and Kevin Durant showcase high-stakes offensive efficiency, recording composite scores of 2.325 and 2.338, respectively. Durant’s high usage rate and shooting accuracy make him a game-changer in closing minutes. Cells highlighted in red indicate the top 20% (best) values in each respective column, showcasing the strongest performances among the listed players.
Figure 4.
Offense Lift by Quarter and Season.
Figure 4.
Offense Lift by Quarter and Season.
In overtime,
Table 6 shows that Damian Lillard demonstrates his signature late-game scoring ability with a composite score of 2.264, while LeBron James ranks highest at 2.480, pairing high usage with efficient scoring to dominate extended play. Cells highlighted in red indicate the top 20% (best) values in each respective column, showcasing the strongest performances among the listed players.
3.4. Overall Impact
Figure 5 shows that Overall Impact metrics, such as Net Rating and Player Impact Estimate (PIE), increase in importance throughout the game, peaking sharply in overtime. In the regular season, the average lift rises gradually, reaching 1.38 by the fourth quarter before peaking at 1.78 in overtime (Period 5+). This pattern suggests that all-around contributions in scoring, defense, and rebounding become decisive in extended games, where fatigue and execution play a crucial role. In the playoffs, we see a similarly strong impact, with an average lift of 1.42, peaking at 1.70 in overtime, emphasizing the need for high-impact players in closing out postseason matchups.
During these moments, standout performances often define outcomes.
Table 7 shows that LeBron James and Kawhi Leonard exemplify this trend, consistently ranking among the top in overall impact. LeBron posts a PIE of 2.520 and a Net Rating of 2.142, reflecting his ability to control late-game situations. Similarly, Kawhi Leonard leads with a Net Rating of 2.250 across 100 analyzed playoff quarters, showcasing his two-way dominance in crunch time. The data suggest that players with strong overall impact become even more valuable in late-game and overtime settings, particularly in the playoffs, when efficiency and composure under pressure determine success. Cells highlighted in red indicate the top 20% (best) values in each respective column, showcasing the strongest performances among the listed players.
Figure 5.
Overall Impact Lift by Quarter and Season.
Figure 5.
Overall Impact Lift by Quarter and Season.
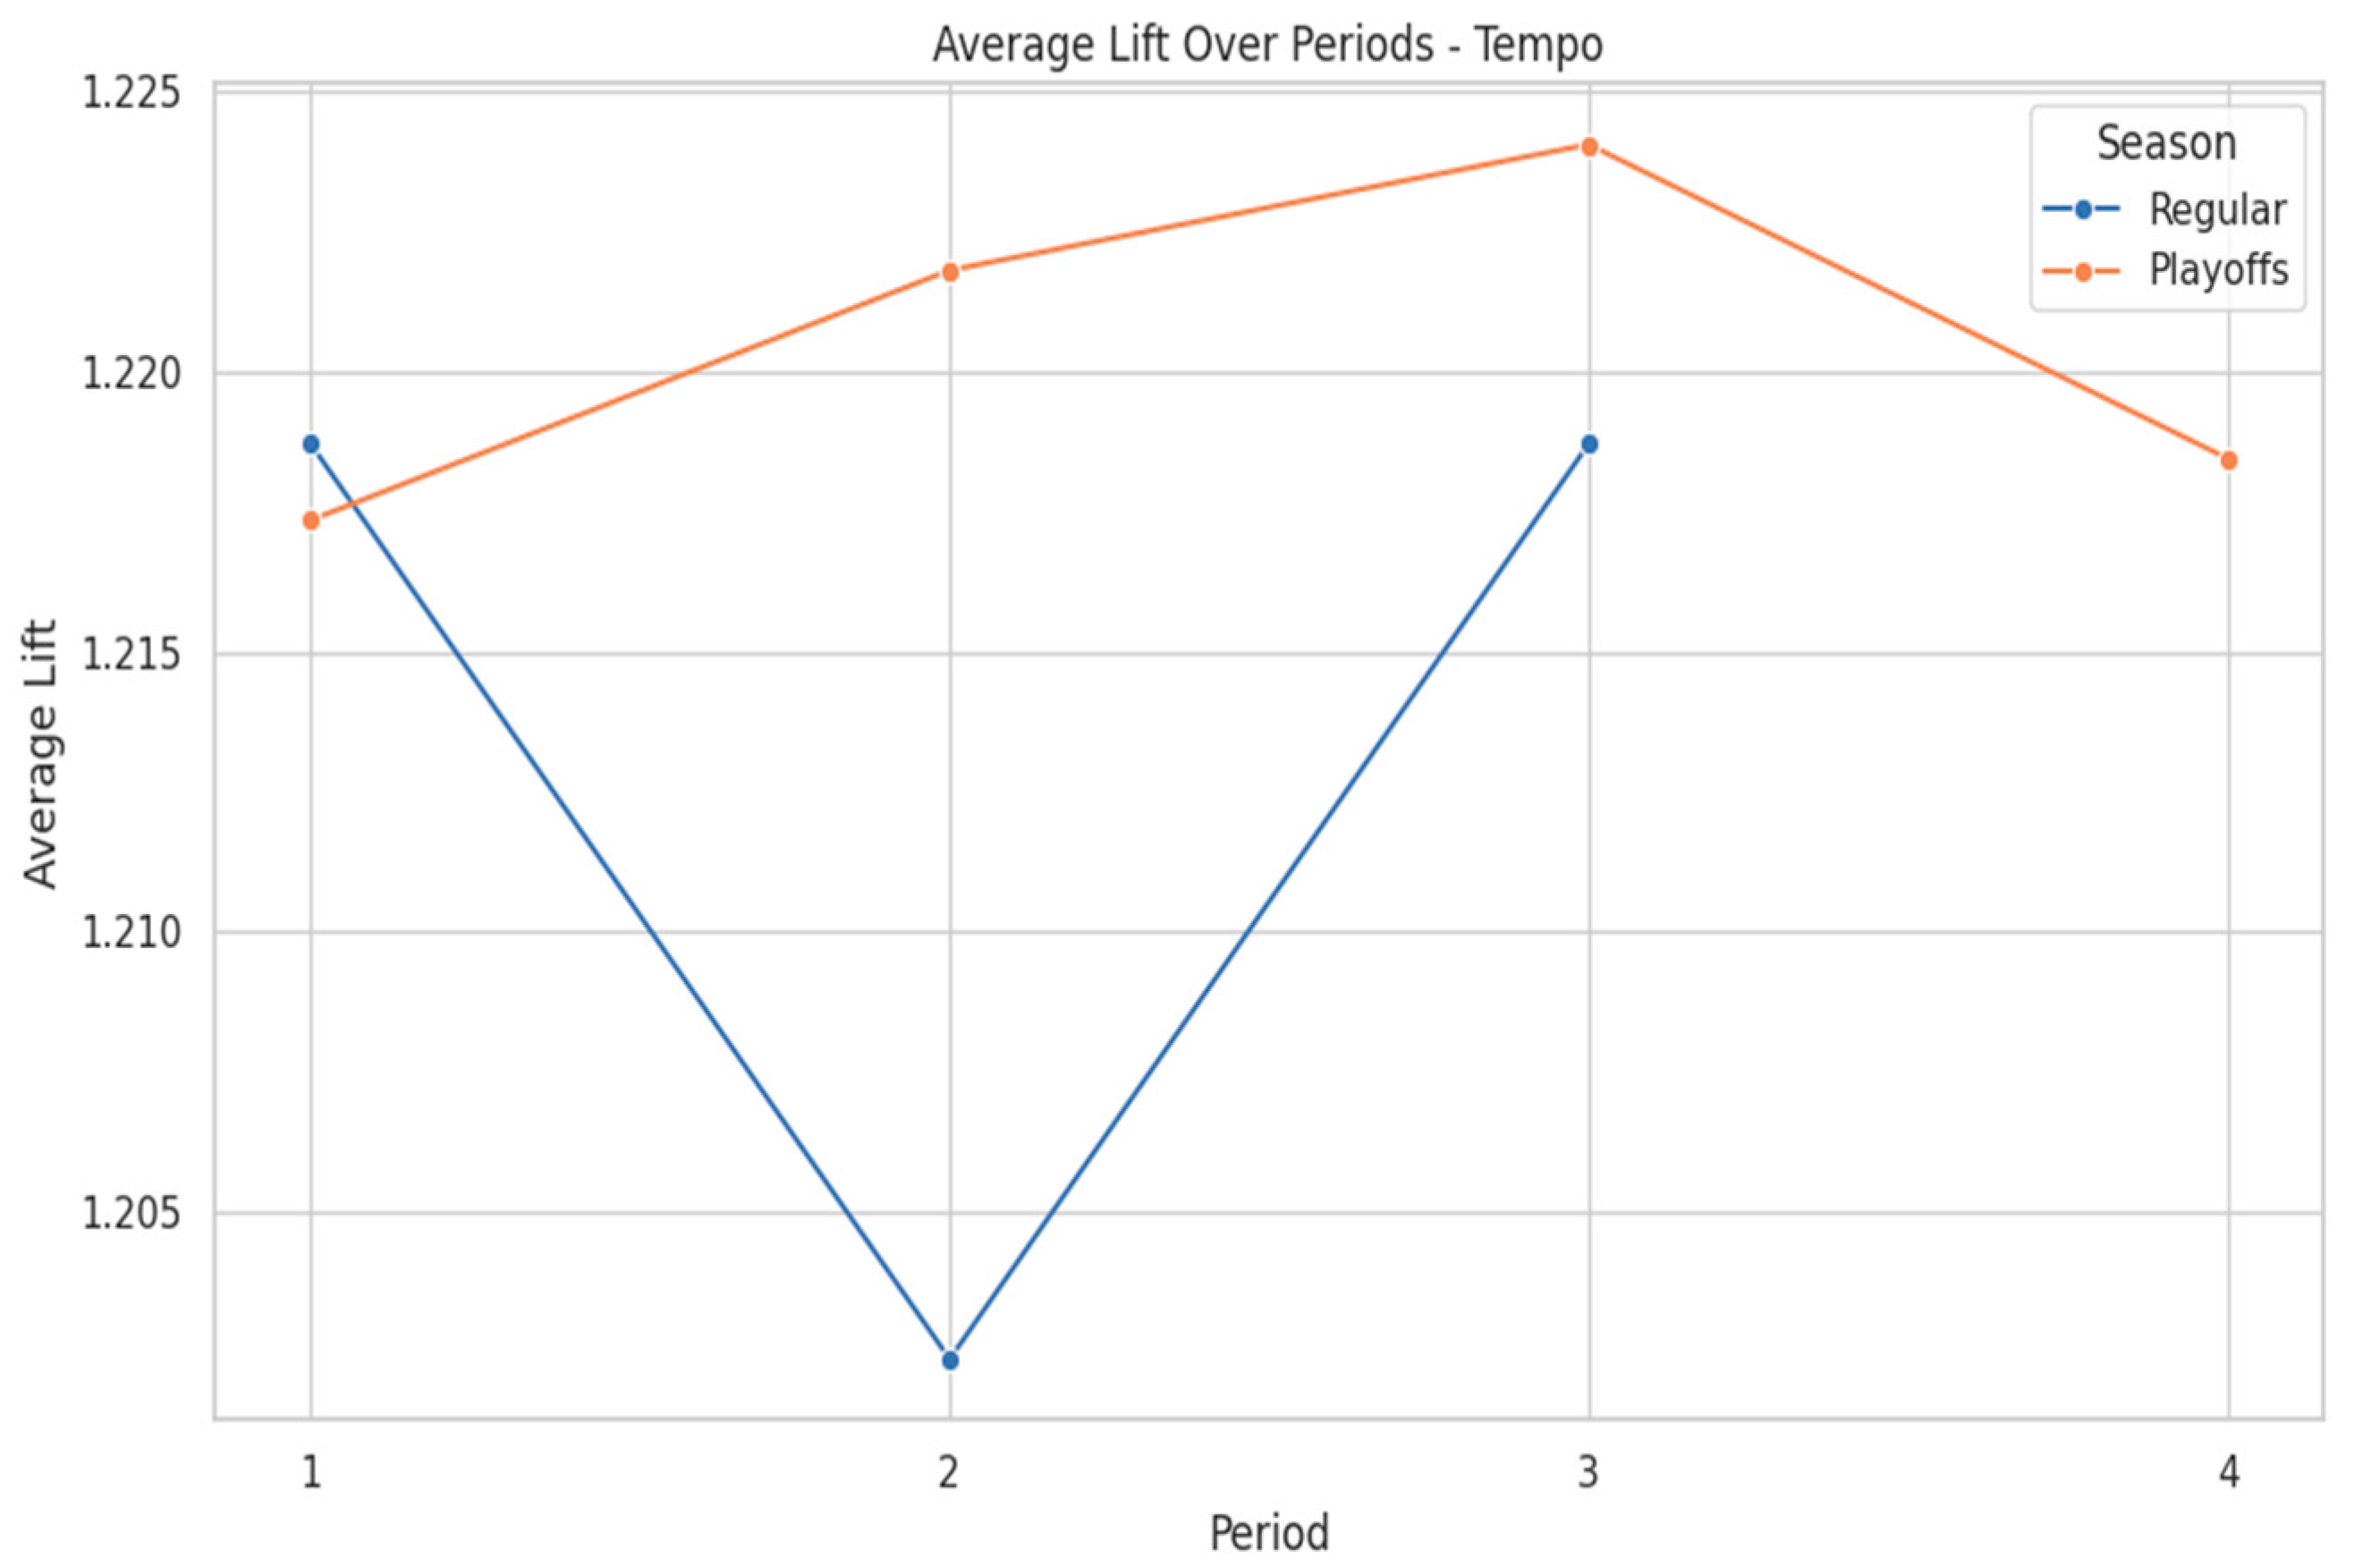
3.5. Tempo
Figure 6 reveals varying influences of pace and possessions across different quarters. In the regular season, Tempo dips sharply in the second quarter, reaching its lowest lift value of approximately 1.205 due to the increased presence of bench units and strategic timeouts. The maximum lift observed in regular season games occurs in the third quarter at approximately 1.22, suggesting a return to higher-paced play after halftime adjustments. Quick-paced teams, such as those led by Trae Young and Stephen Curry, often build large first-quarter margins and then manage leads efficiently throughout the game. Both players share the highest composite Tempo scores at 2.630, orchestrating fast-paced offenses early to put opponents on the defensive.
In the playoffs, tempo lift values gradually rise through the first three quarters before declining in the fourth, indicating that controlling possessions in the middle quarters can wear down opponents or build sustainable leads. The peak playoff lift occurs in the third quarter at approximately 1.225, reinforcing the strategic emphasis on pace before defenses fully adjust.
Table 8 and
Table 9 show that Stephen Curry and Klay Thompson excel at setting an aggressive tempo in the first half, forcing defenses to react and adapt later in the game. This aligns with the observed trend, where playoff teams push the pace early before shifting focus to half-court execution in closing moments. Cells highlighted in red indicate the top 20% (best) values in each respective column, showcasing the strongest performances among the listed players.
Figure 6.
Tempo Lift by Quarter and Season.
Figure 6.
Tempo Lift by Quarter and Season.
3.6. Position-Based Breakdown
Our analysis also considered how Guards, Centers, and Forwards contribute to game outcomes in each category. For Guards in the regular season, high offensive ratings in early quarters drive wins, while high defensive ratings in Periods 1–3 often signal losses. In the playoffs, the medium assist percentages in the first quarter, combined with high assist ratios for the third quarter, correlate with wins.
For Centers in the regular season, those with high offensive ratings in Periods 1 and 3 often anchor successful starts, whereas subpar early offensive ratings are linked to losses. In playoffs, strong rebound percentages and net ratings in early quarters prove essential, highlighting that controlling the glass and overall impact leads to postseason success. For Forwards during the regular season, high early offensive ratings align with winning, while high early defensive ratings correlate with losses. In the playoffs, low turnovers paired with high assist ratios in early periods drive wins, implying that multi-faceted forwards who pass well and avoid mistakes can shift playoff outcomes.
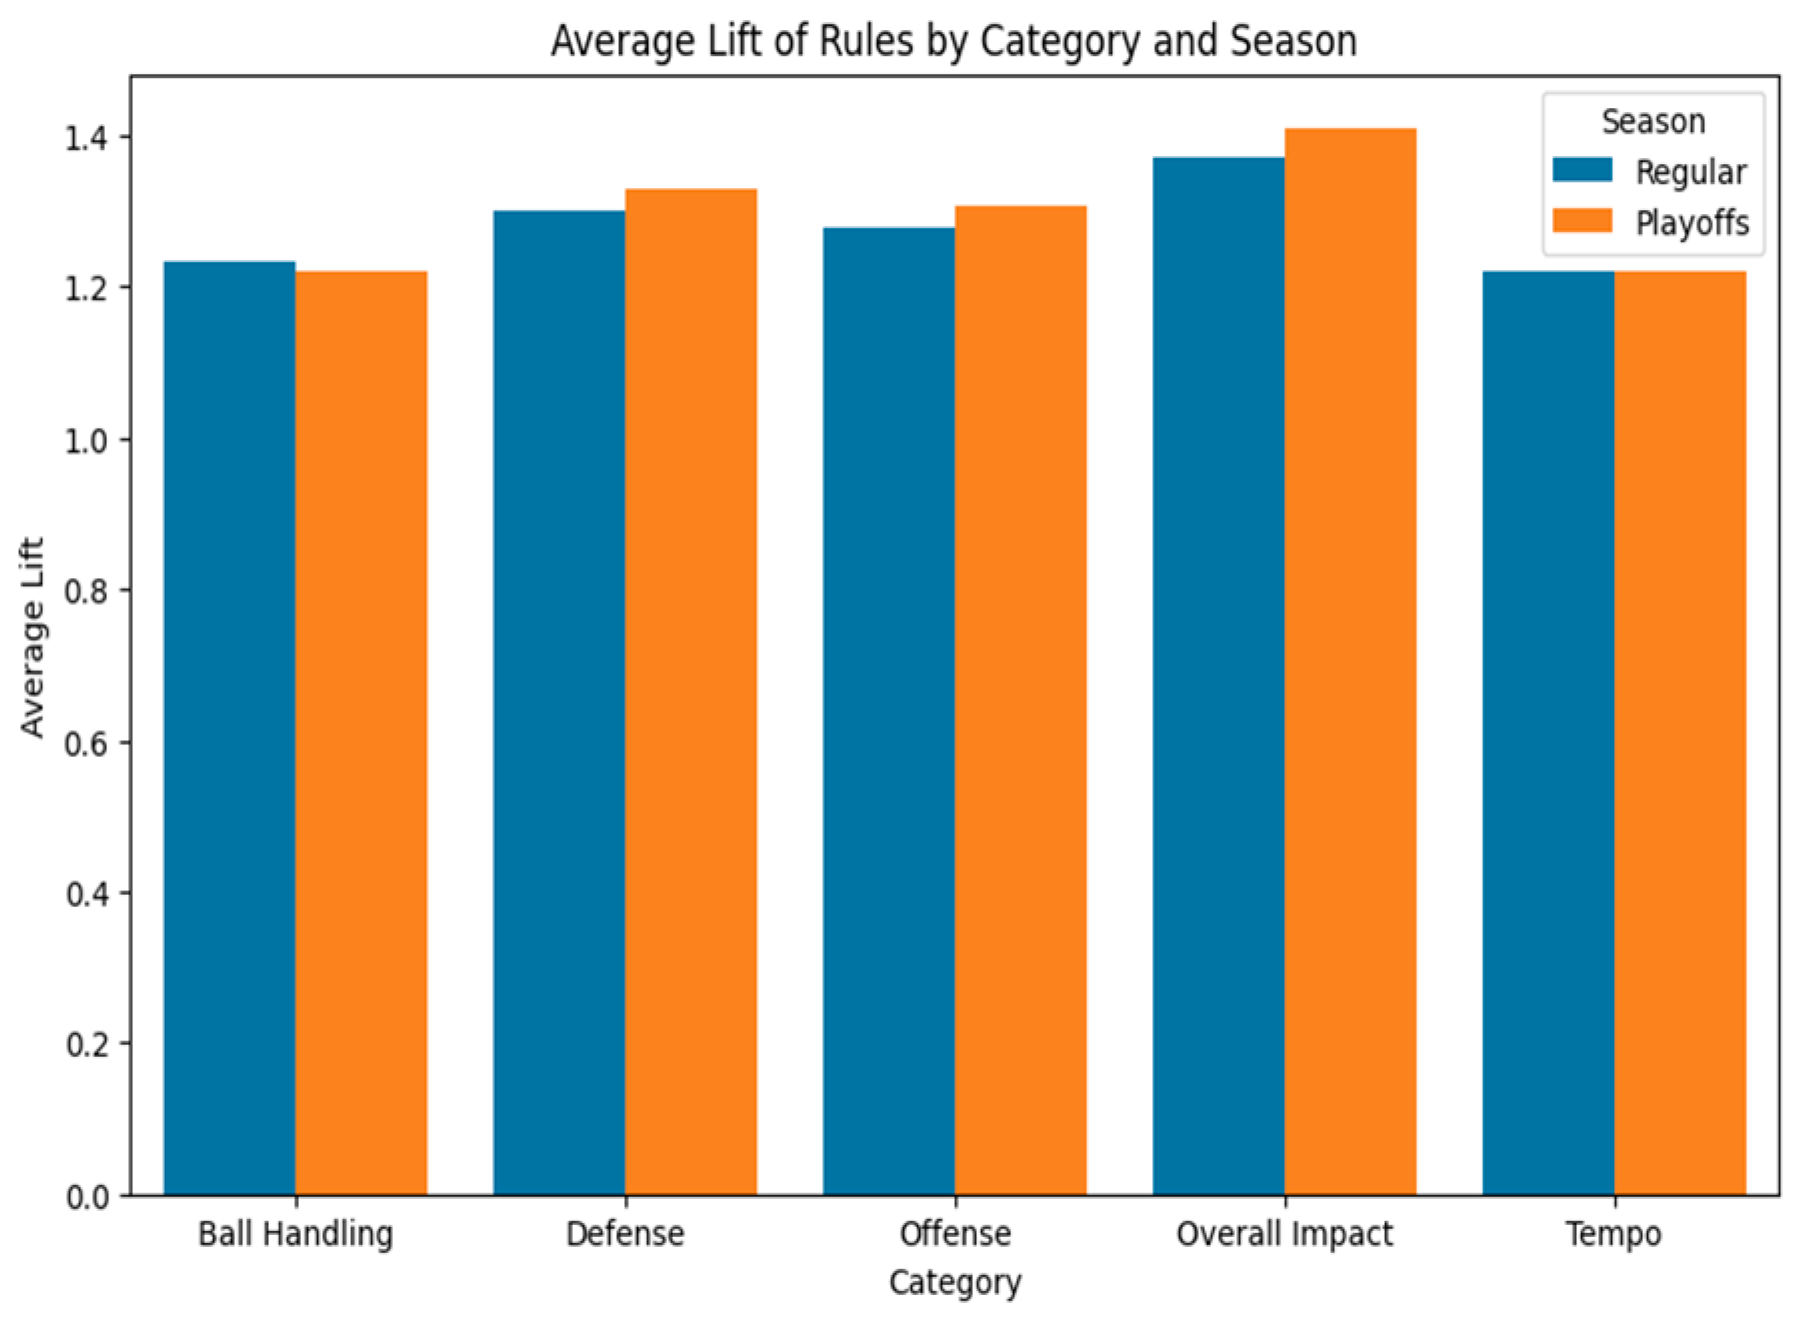
3.7. Average Lift Values Across Categories
Figure 7 compares the average lift across the five categories for both the regular season and playoffs. We see that Overall Impact leads in both contexts, with an average lift of approximately 1.35 in the regular season and 1.40 in the playoffs, displaying the effect of well-rounded play. Defense slightly outperforms Offense on average, with lifts of 1.29 versus 1.27 in the regular season and 1.32 versus 1.30 in the playoffs, showing how consistent defensive efforts make a difference. Meanwhile, Ball Handling and Tempo remain lower in average lift at around 1.22, suggesting that although these factors are important, they are overshadowed by the other categories when it comes to final outcomes.
3.8. Top Overall Rule per Season
We extracted the single highest lift rule per season for both the regular season and playoffs to determine which patterns dominate overall. In the playoffs, the top rule is “high_PIE_Period1, high_netRating_Period1, high_netRating_Period2, high_PIE_Period2, high_netRating_Period3 → W_Result” with a confidence of 0.9932 and a lift of 1.9892. This rule suggests that maintaining a strong PIE and net rating during the first three quarters directly correlates with playoff wins. For the regular season, the top rule is “high_netRating_Period5+, high_PIE_Period5+ → W_Result”, which has a confidence of 0.9749 and a lift of 1.9497, indicating that an elite net rating and PIE in overtime (period 5+) strongly correlate with securing late-season victories in closely contested matchups.
4. Discussion
By combining composite scores with ARM, the study revealed how late-game defense and offense spiked in importance while overall impact metrics consistently correlated with winning outcomes. Here, we interpret these findings in the context of real-world basketball, highlighting strategic takeaways, player trends, and implications for team success.
4.1. Quarter-Specific Shifts and Their Strategic Implications
The results show that defensive performance grows more impactful as games progress, peaking in the fourth quarter and overtime. This trend holds true in both the regular season and playoffs, but the effect is magnified in postseason play (lift ~1.75). Players like Tim Duncan in the regular season and Dwight Howard in the playoffs demonstrate how anchoring the paint late in games can dramatically influence outcomes. Defensive rebound percentages and low defensive ratings were consistently tied to wins, affirming the value of controlling possessions under high pressure.
Offensive efficiency also rises in closing moments. Nikola Jokić and Stephen Curry illustrate how elite fourth-quarter scoring capacity can overcome deficits. Kevin Durant shows a similar effect in late-game scenarios, combining high usage with strong shooting percentages to power his team in final stretches. For many star players, sustaining shooting efficiency while facing tighter defenses can be a deciding factor.
Ball handling emerges as a steadier factor overall, but subtle spikes occur in the second quarter (regular season) or third quarter (playoffs). During these periods, controlling turnovers and increasing assist ratios keep an offense fluid and build momentum heading into halftime or late-game action. Guards and forwards alike benefit from cutting turnovers in key moments, particularly as defenses intensify.
Tempo displays more variability across quarters in the regular season but exhibits a slow climb in playoff contexts until dropping late in games. Teams might push the pace early to secure leads, then shift to more deliberate strategies in the second half. This approach is especially noticeable for players like Stephen Curry and Klay Thompson, who pressure defenses early in postseason matchups only to slow down in the final minutes to protect leads.
4.2. Overall Impact and Player Contributions
Among all categories, Overall Impact stands out. The data show that a consistently high Net Rating or PIE across quarters signals success. In many cases, players who balance both offense and defense, like Anthony Davis or Kevin Garnett, hold top Overall Impact scores. Late-game surges in these metrics align well with actual NBA outcomes, highlighting how comprehensive skill sets prove indispensable when the margin for error shrinks.
While Damian Lillard and LeBron James excel in clutch or overtime scenarios, broader data imply that supporting lineups also matter. Defensive specialists or reliable secondary scorers can elevate a team’s defensive rating or net rating at crucial junctures, reducing the load on superstars.
4.3. Coaching Perspectives
These quarter-by-quarter findings resonate with established coaching strategies emphasizing game-long management of lineups and tactics. Coaches who allocate defensive anchors more minutes in the final quarter or use timeouts effectively to rest star players tend to maximize late-game performance.
The consistently high lift for fourth-quarter defensive metrics suggests that adjusting defensive matchups or employing zone schemes can pay dividends in tightly contested games. Such adjustments often make the difference in close contests and reinforce a team’s commitment to late-game defense.
Offensive adjustments become apparent as games approach their final minutes. Offensive rating and shooting efficiency peak during these crucial moments, prompting coaches to design end-of-game sets tailored for players with high scoring efficiency. The shift toward more isolations for players like Nikola Jokic or Kevin Durant in the postseason shows how coaches exploit star-level finishing ability to secure victories.
Positions further influence game outcomes. Guards must balance assist ratios with low turnovers, a requirement that becomes vital in the playoffs. Centers need to maintain dominant rebounding and a consistent net rating from the opening tip, while Forwards rely on offensive efficiency and ball security, thriving by facilitating play and minimizing early mistakes.
It is also important to recognize that external factors, including specific coaching strategies, opponent quality, and game importance, significantly influence player performance and game outcomes. For instance, in elimination playoff games, coaching decisions such as tighter rotations, increased minutes for star players, and tailored defensive schemes against key opponents can profoundly affect quarter-by-quarter performance. Future analyses that incorporate these external contextual variables could yield even richer strategic insights.
4.4. Data Science Perspective
A key strength of this study lies in its multi-step data science pipeline, beginning with thorough data collection from the NBA API for the last 20 years. We first identified active players using endpoints, making sure to exclude those who never actually entered a game. We then retrieved quarter-specific advanced player statistics, employing retry logic to handle API timeouts and appending columns to track both quarters and overtime periods, as needed. Intermediate results were saved at each step to CSV files, protecting progress and enabling restarts when necessary.
Following this, we conducted strict data cleaning by removing duplicates, reconciling missing positions, and fixing any inconsistencies to maintain dataset integrity. We applied four anomaly detection methods (Z-score, IQR, Isolation Forest, and DBSCAN) to remove outliers from multiple angles, preventing one method from dominating. With the data thus validated, we discretized features using four different approaches: equal width, equal frequency, manual thresholds, and K-Means, allowing us to transform raw metrics into clear “low”, “medium”, and “high” bins.
This well-defined and cohesive workflow produced a dataset that was both reliable and interpretable, enabling efficient application of FP-Growth. Although the study centers on sports analytics, the same framework—data collection, cleaning, outlier filtering, and feature engineering—holds value for data scientists in many domains. By systematically handling messy data, detecting anomalies, and converting continuous metrics into clear categories, practitioners can uncover valuable insights and make more robust decisions. This iterative pipeline can scale to big data scenarios, where advanced anomaly detection, flexible discretization methods, and ARM reveal patterns that might otherwise remain hidden. The process also helps reduce noise, refine metrics, and keep output closely aligned with practical decision-making.
4.5. Comparison with Related Work
This quarter-based approach confirms that both offense and defense are key, though the data suggest defense often carries a slightly greater influence on outcomes. Dehesa et al. [
34] identified differences between regular season and playoff performances in metrics like defensive ratings and effective field-goal percentage. Their analysis revealed how performance changes across game quarters, influenced by situational variables and game dynamics. Extending their work, our analysis across all quarters suggests that defensive performance remains an influential factor throughout the playoffs, with its impact becoming stronger in later periods. While Ruano et al. [
15] analyzed how situational variables and performance metrics influence outcomes during the 4th quarter of close games, our analysis broadens this approach by examining how players’ metrics contribute to game outcomes across all quarters.
Overall Impact metrics echo findings that versatile players excel in high-pressure situations. Comparisons of Tim Duncan’s and LeBron James’s two-way effectiveness support the conclusion that players who contribute on both ends produce more consistent playoff success. This reflects Ben Taylor’s [
35] emphasis that adaptability, whether on offense or defense, is necessary for succeeding against tough competition in the playoffs.
Finally, injuries remain a major factor. As Aksovic et al. [
36] show, basketball players frequently suffer knee and ankle injuries, which can impact their performance and availability under playoff pressure. Players like Zion Williamson and Joel Embiid, who often face health-related setbacks, see their efficiency decline in the postseason.
4.6. Threats to Validity and Limitations
Despite its detailed quarter-by-quarter analysis of NBA performance over two decades, the study faces several data science challenges that may limit its reliability and generalizability. We rely on per-quarter statistics to compute composite scores and mine association rules. However, aggregated data can miss contextual details, like lineup changes or game situations, and skew averages when players excel in one quarter but underperform in another. Additionally, the playoff dataset is much smaller than the regular season sample, which may yield inconsistent findings in categories such as Tempo and Ball Handling, where limited data reduce reliability.
While ARM effectively produces interpretable rule-based insights, it can introduce biases by primarily capturing straightforward if/then relationships. Compared to techniques like neural networks or reinforcement learning, ARM may miss complex, nonlinear interactions or sequential dependencies inherent in performance metrics. Future studies could incorporate comparisons with these advanced ML approaches to provide deeper and potentially more nuanced insights.
Participation thresholds were applied to avoid inflated statistics but might filter out emerging talents or players returning from injury, potentially overlooking significant performance spikes. Metrics were grouped into five categories to manage memory constraints, though overlaps among these groups may mask alternative trends. It is also acknowledged that category-based segmentation, adopted due to memory constraints, might have limited the detection of cross-category interactions. Composite scores were calculated using weighted averages based on domain knowledge, introducing subjectivity.
Moreover, discretizing continuous metrics into bins affects both the composite score calculations and the association rule mining process. Grouping continuous variables into discrete categories (low, medium, high) may introduce variability or obscure finer details in performance patterns. The choice of discretization methods influences results, and our final selection, based on manual reviews, may introduce subjectivity. Parameter settings, such as support, confidence, and lift, further shape the extracted rules. Newer algorithms like ARMICA-Improved and swarm-based approaches may address these limitations by automating parameter selection and preserving full feature relationships [
37].
5. Conclusions and Future Work
This study analyzed quarter-by-quarter NBA player performance from the 2004–2005 through 2023–2024 seasons, applying data mining and association rule techniques to uncover how advanced metrics shape regular season and playoff results. Focusing on five categories revealed that defensive metrics and all-around impact carry distinct weight in the final minutes.
In the later stages of games, defensive metrics, such as Defensive Rating and Rebounds, become significant. These measures peak in overtime and playoffs, highlighting the value of shutting down opponents when it matters the most. At the same time, offensive efficiency also takes center stage. Metrics like eFG% and TS% reveal that star players often elevate their scoring under pressure to close gaps or maintain leads.
Overall performance is effectively measured by Net Rating and PIE, which reliably predict winners. These metrics emphasize two-way performance, showing that success depends on contributions from both offense and defense. Ball handling remains critical throughout the game, particularly in the second or third quarter, when momentum can shift. Controlling turnovers during these periods helps teams build runs or disrupt opponents. Meanwhile, the role of Tempo is mixed; a fast pace in the first quarter can establish early leads, while a slower pace later helps secure the ball.
From a strategy perspective, our insights highlight the need for coaches to manage lineups to boost late-game defense whilst sustaining shooting efficiency. They also provide front offices with valuable information when recruiting players who excel during specific game periods or roles.
Future Work
Several directions can extend this research. Incorporating shot contests, forced turnovers, and advanced tracking systems can clarify how late-game defense influences outcomes. Another addition could involve multi-featured ARM. By addressing memory and parameter constraints, researchers could simultaneously analyze all metrics. This method may expose cross-category rules that our separate analysis overlooked.
A third direction focuses on the dynamic weighting of composite scores. Contextual factors, such as opponent strength, home versus away conditions, and back-to-back schedules, could be integrated to create adaptive metrics that mirror in-game complexities. These refined composite scores would more accurately reflect the factors that affect player performance.
There are opportunities for methodological improvements. Future work could include advanced dynamic discretization techniques, such as Gaussian mixture model (GMM) binning [
38] or quantile adaptive binning, to reduce information loss and improve granularity. Additionally, implementing distributed computing frameworks (e.g., Apache Spark) could help overcome current memory limitations, enabling more comprehensive ARM analyses across all performance categories.
Examining team context and synergy also presents another opportunity for expansion. Analyzing how specific lineups or small groups of players interact may reveal how duos or trios enhance or hinder quarter-specific performance. This type of analysis would provide coaches and analysts with insights into optimal roster configurations and game management.
Additionally, exploring other pattern recognition techniques, such as decision trees, neural networks, or Bayesian networks, would provide deeper insights beyond the <if/then> patterns identified by ARM. Evaluating multiple methodologies can enable a clearer understanding of each technique’s predictive capabilities, strengths, and limitations, potentially capturing more complex and nuanced relationships in the data.
Conducting comprehensive sensitivity analyses on ARM and discretization parameters would enhance the robustness and interpretability of our results. Evaluating how different settings affect the stability of identified patterns can validate the reliability of the findings, offering greater confidence in practical applications. Achieving this requires overcoming current computational constraints.
Replicating the analysis in other basketball leagues, such as the EuroLeague or CBA, could evaluate the universality of these findings. Comparing leagues may reveal whether certain patterns are unique to the NBA. By refining data collection, broadening the metric scope, and applying advanced data mining algorithms, future studies can support more effective roster and coaching strategies.


