
Analysis of China’s High-Speed Railway Network Using Complex Network Theory and Graph Convolutional Networks


Abstract
1. Introduction
2. Literature Review
2.1. Railway Network Analysis Based on CNT and GCNs
2.2. The Two Key Topics
3. Methodology
3.1. Community Detection
3.2. Link Prediction
4. Results
4.1. The Complex Network Characteristics of China’s HSR Network
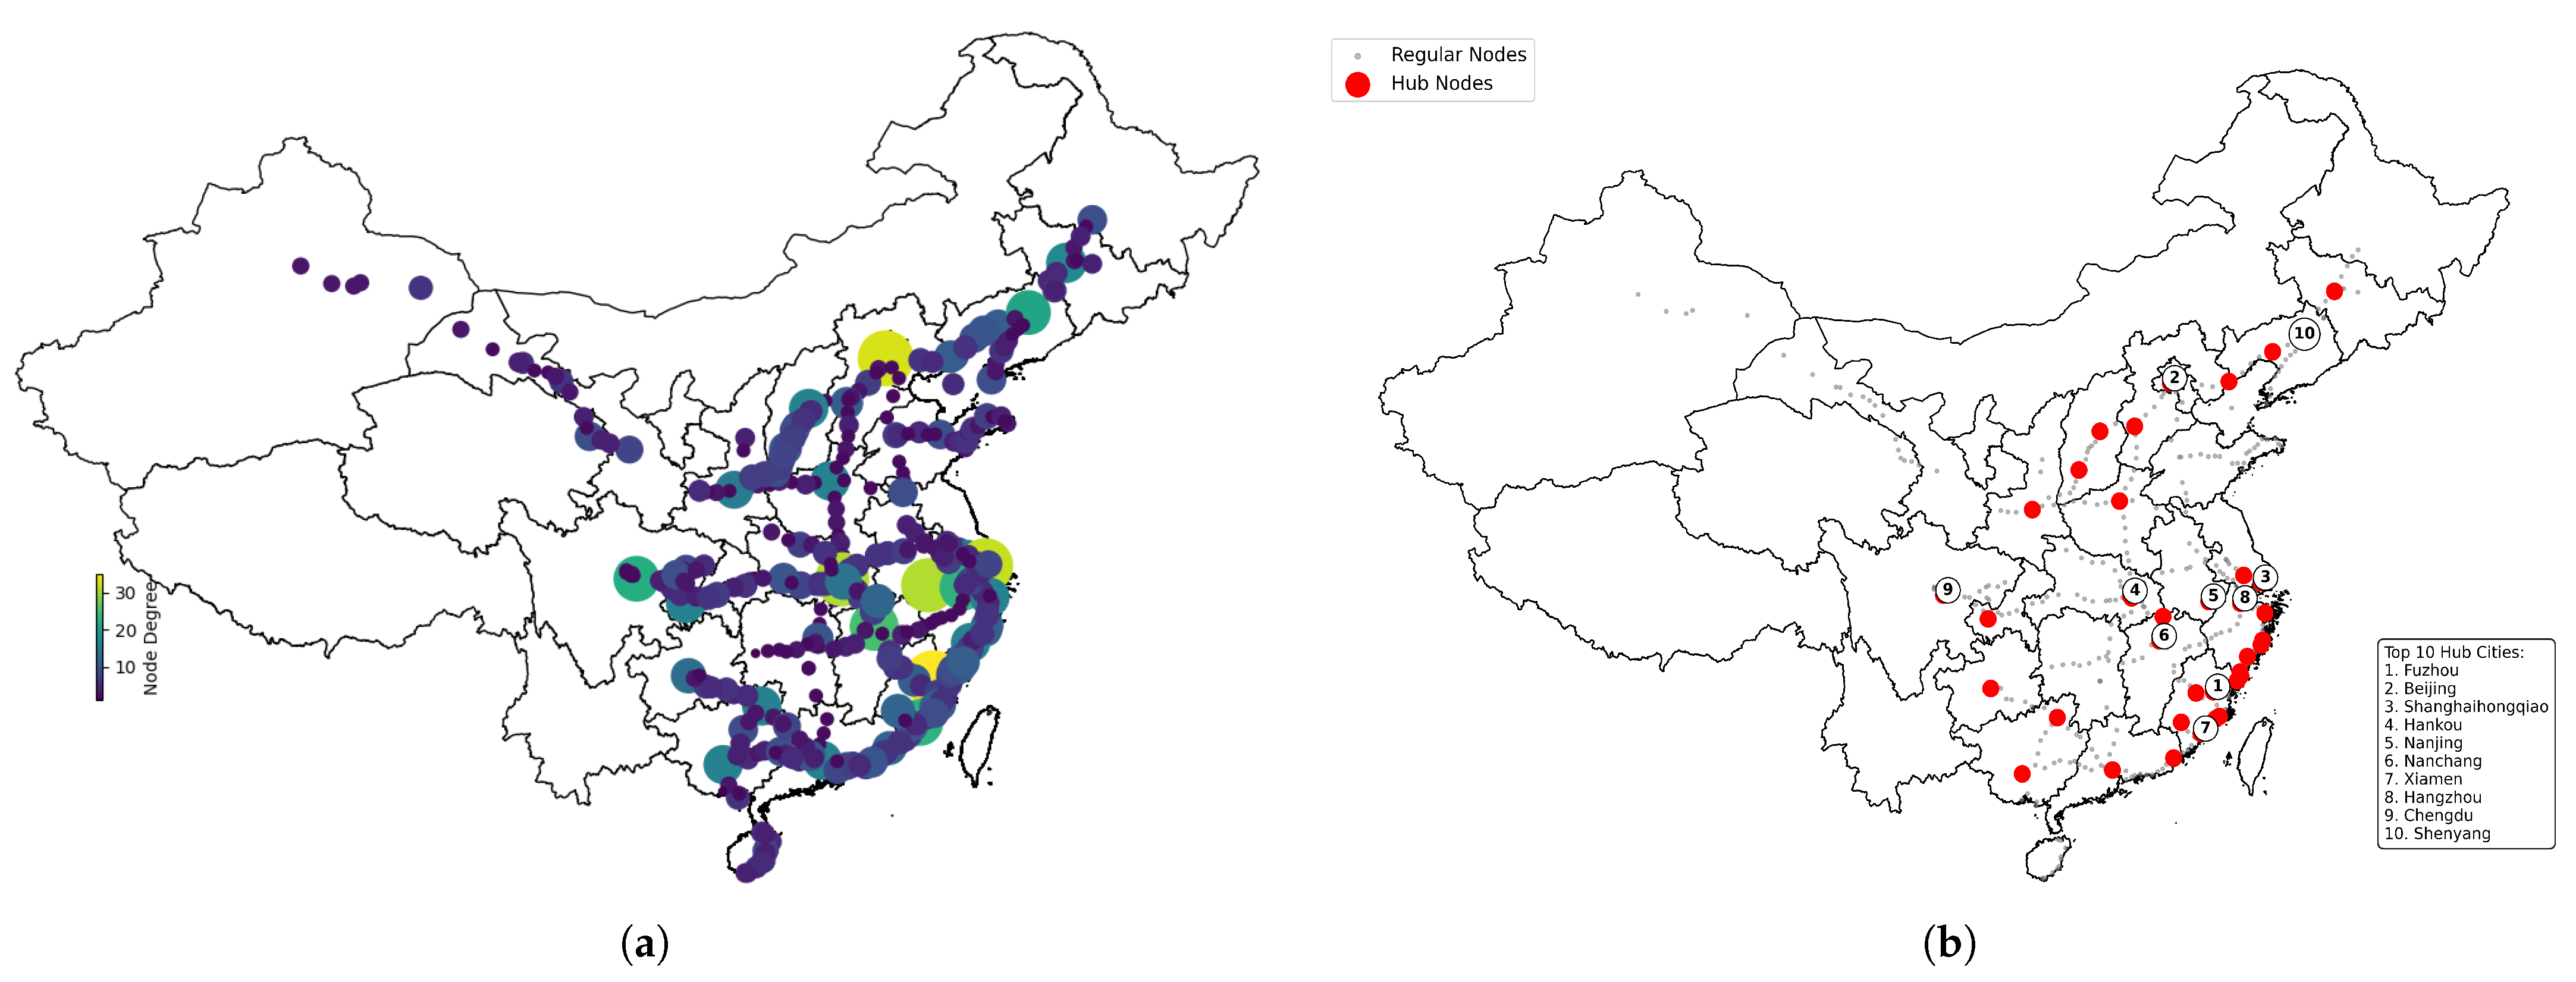
4.2. Key Node Detection
4.3. Community Detection and Analysis
4.4. Potential Links in the Network
5. Discussions
6. Conclusions and Future Work
Author Contributions
Funding
Data Availability Statement
Conflicts of Interest
Appendix A. Complex Network Indices

| Index | Equation | Definition |
|---|---|---|
| Degree Distribution | , where and n refer to the number of edges of node k and total number of nodes, respectively. | The probability distribution of the degrees of its nodes [40]. |
| Global Efficiency | , where is the shortest path length between node i and node j. | Measures the directness of information or resource transfer between pairs of nodes in a network. |
| Local Efficiency | , where is the number of neighbours of node i, is the set of neighbouring nodes, and is the shortest path between node j and node h. | Evaluates the efficiency of a subgraph formed by a node and its direct neighbours. |
| Assortativity Coefficient | , where and are the degrees of the nodes at the end of the i-th edge, and is the average degree of the network. | The correlation coefficient of the degree of nodes; measures the level of preference of nodes in a network connecting to their similar nodes. r is in the range of [−1, +1], indicating a spectrum from perfect disassortativity to perfect assortativity. |
| Network Density | . | Ratio of the number of edges e to its maximum possible number of edges n, reflecting the degree of saturation of the network. |
| Small World Effect | , , where n is the number of nodes, is the shortest path length (e.g., number of edges) between node i and node j, and is the average of degrees in a network. | A small world network has a short characteristic path length , and a significantly large clustering coefficient . |
| Node Elasticity (Key Nodes) | , where p is a node pair matrix representing the number of paths between each two nodes, and N is the total number of nodes. | Evaluates how node failures affect a network’s connectivity. The failure of a node with high elasticity may lead to network fragmentation or blockage of information dissemination. |
| Degree Centrality | . | Measures the number of direct connections (edges) a node v has. In a directed network, this can be split into in-degree (incoming edges) and out-degree (outgoing edges). It reflects a node’s immediate influence or connectivity. |
| Betweenness Centrality | , where is the total number of shortest paths from node s to node t, and is the number of those paths passing through node v. | Measures the extent to which a node lies on the shortest paths between other nodes in the network. A high value indicates the node acting as a key “bridge” in the network. |
| Closeness Centrality | , where is the shortest path distance between v and u. | Measures how close a node is to all other nodes in the network, calculated as the reciprocal of the average shortest path distance from node v to all other nodes u. A higher value means the node reaches others more quickly. |
| Clustering Coefficient | , where is the number of edges (triangles) between the neighbors of v, and is the maximum possible number of such edges. | Measures the degree to which the neighbors of a node v are connected to each other. A high value indicates a tightly knit local group. |
| Average Clustering Coefficient | , where is the clustering coefficients of node v and N is the total number of nodes | Measures the average of clustering coefficients across all nodes in a network. It reflects the overall tendency of nodes to form clustered groups, often used to identify small-world properties. |
| Node Count | N | The total number of nodes in a network, representing the stations or cities in a railway system. |
| Average Degree | , where is the degree of node i, and N is the total number of nodes. | The average number of connections (edges) per node in a network, indicating the overall connectivity level. |
| Average Path Length | , where is the shortest path length between node i and node j, and N is the total number of nodes. | The average shortest path length between all pairs of nodes in the network, reflecting the efficiency of information or resource transfer. |
| Density | , where E is the number of edges, and N is the total number of nodes. | The ratio of the actual number of edges to the maximum possible number of edges in the network, indicating how densely connected a network is. |
| Node Density | , where N is the number of nodes, and A is the area of the geographical region covered by the network. | The number of nodes per unit area, reflecting the spatial distribution and concentration of nodes in a network. |
| Crucial Pathways among Communities | / | The most important connections (edges) that link different communities in the network, often determined by their role in maintaining inter-community connectivity or facilitating information flow between communities. |
| Largest Strongly Connected Component Proportion | , where is the number of nodes in the largest strongly connected component and N is the total number of nodes in a network. | An SCC is a subset of nodes where every node is reachable from every other node following directed edges. A higher proportion indicates stronger overall connectivity in a directed network. |
| Largest Weakly Connected Component Proportion | , where is the number of nodes in the largest weakly connected component (WCC) and N is the total number of nodes in a network. | A WCC is a subset of nodes where every node is reachable from every other node when ignoring edge directions. A higher proportion indicates better basic connectivity. |
Appendix B. Heat Map by Community and Feature

Appendix C. Edge Density by Community

References
- Ghosh, S.; Banerjee, A.; Sharma, N.; Agarwal, S.; Ganguly, N.; Bhattacharya, S.; Mukherjee, A. Statistical analysis of the Indian railway network: A complex networkapproach. Acta Phys. Pol. Proc. Suppl. 2011, 4, 123–138. [Google Scholar] [CrossRef]
- Wang, L.; An, M.; Jia, L.; Qin, Y. Application of complex network principles to key stationidentification in railway network efficiency analysis. J. Adv. Transp. 2019, 2019, 1574136. [Google Scholar] [CrossRef]
- Gao, P.; Zheng, W.; Liu, J.; Wu, D. Research on Modeling and Analysis Methods of Railway Station YardDiagrams Based on Multi-Layer Complex Networks. Appl. Sci. 2025, 15, 2324. [Google Scholar] [CrossRef]
- Wang, W.; Cai, K.; Du, W.; Wu, X.; Tong, L.C.; Zhu, X.; Cao, X. Analysis of the Chinese railway system as a complex network. Chaos Solitons Fractals 2020, 130, 109408. [Google Scholar] [CrossRef]
- Cao, W.; Feng, X.; Zhang, H. The structural and spatial properties of the high-speed railwaynetwork in China: A complex network perspective. J. Rail Transp. Plan. Manag. 2019, 9, 46–56. [Google Scholar] [CrossRef]
- Mosayyebi, M.; Shakibian, H.; Azmi, R. Structural Analysis of Iran Railway Network based on Complex NetworkTheory. In Proceedings of the 2022 8th International Conference on Web Research (ICWR), Tehran, Iran, 11–12 May 2022; pp. 121–125. [Google Scholar] [CrossRef]
- Li, M.; Guo, W.; Guo, R.; He, B.; Li, Z.; Li, X.; Liu, W.; Fan, Y. Urban Network Spatial Connection and Structure in China Based onRailway Passenger Flow Big Data. Land 2022, 11, 225. [Google Scholar] [CrossRef]
- Xu, Z.; Zhang, Q.; Chen, D.; He, Y. Characterizing the Connectivity of Railway Networks. IEEE Trans. Intell. Transp. Syst. 2020, 21, 1491–1502. [Google Scholar] [CrossRef]
- Feng, X.; He, S.; Li, Y.B. Temporal characteristics and reliability analysis of railwaytransportation networks. Transp. A Transp. Sci. 2019, 15, 1825–1847. [Google Scholar] [CrossRef]
- Feng, F.; Jia, J.; Liang, A.; Liu, C. Bayesian network-based risk evaluation model for the operationalrequirements of the China Railway Express under the Belt and Road initiative. Transp. Saf. Environ. 2022, 4, tdac019. [Google Scholar] [CrossRef]
- Hussein, A. Robustness Assessment of Urban Rail Transit Network Based on theInterdependency Analysis: Chongqing Rail Transit in Jiangbei and Yuzhong asan Example. J. Manag. Humanit. Res. 2022, 7, 61–76. [Google Scholar] [CrossRef]
- Kipf, T.N.; Welling, M. Semi-Supervised Classification with Graph Convolutional Networks. arXiv 2017, arXiv:1609.02907. [Google Scholar]
- Breiman, L. Random forests. Mach. Learn. 2001, 45, 5–32. [Google Scholar] [CrossRef]
- Cortes, C.; Vapnik, V. Support-vector networks. Mach. Learn. 1995, 20, 273–297. [Google Scholar] [CrossRef]
- LeCun, Y.; Bengio, Y.; Hinton, G. Deep learning. Nature 2015, 521, 436–444. [Google Scholar] [CrossRef] [PubMed]
- Dwivedi, V.P.; Joshi, C.K.; Laurent, T.; Bengio, Y.; Bresson, X. Benchmarking Graph Neural Networks. J. Mach. Learn. Res. 2023, 24, 43:1–43:48. [Google Scholar]
- Luan, S.; Hua, C.; Lu, Q.; Zhu, J.; Chang, X.; Precup, D. When Do We Need GNN for Node Classification? arXiv 2022, arXiv:2210.16979. [Google Scholar] [CrossRef]
- Zhou, K.; Song, Q.; Huang, X.; Hu, X. Auto-GNN: Neural architecture search of graph neural networks. Front. Big Data 2019, 5, 1029307. [Google Scholar] [CrossRef]
- Jin, Z.; Wang, Y.; Wang, Q.; Ming, Y.; Ma, T.; Qu, H. GNNLens: A Visual Analytics Approach for Prediction Error Diagnosis of Graph Neural Networks. IEEE Trans. Vis. Comput. Graph. 2023, 29, 3024–3038. [Google Scholar] [CrossRef]
- Ying, R.; Bourgeois, D.; You, J.; Zitnik, M.; Leskovec, J. GNNExplainer: Generating Explanations for Graph Neural Networks. arXiv 2019, arXiv:1903.03894. [Google Scholar]
- Li, Z.; Huang, P.; Wen, C.; Rodrigues, F. Railway Network Delay Evolution: A Heterogeneous Graph Neural NetworkApproach. arXiv 2023, arXiv:2303.15489. [Google Scholar] [CrossRef]
- Yao, J.; Bai, W.; Yang, G.; Meng, Z.; Su, K. Assessment and prediction of railway station equipment health statusbased on graph neural network. Front. Phys. 2022, 10, 1080972. [Google Scholar] [CrossRef]
- Wang, L.; Wang, X.; Wang, J. Rail Transit Prediction Based on Multi-View Graph Attention Networks. J. Adv. Transp. 2022, 2022, 4672617. [Google Scholar] [CrossRef]
- Silva, T.C.; Zhao, L. Machine Learning in Complex Networks, 1st ed.; Springer Publishing Company, Incorporated: Cham, Switzerland, 2016. [Google Scholar]
- Danon, L.; Díaz-Guilera, A.; Duch, J.; Arenas, A. Comparing community structure identification. J. Stat. Mech. Theory Exp. 2005, 2005, P09008. [Google Scholar] [CrossRef]
- Newman, M.E.J. Modularity and community structure in networks. Proc. Natl. Acad. Sci. USA 2006, 103, 8577–8582. [Google Scholar] [CrossRef]
- Benchettara, N.; Kanawati, R.; Rouveirol, C. Supervised Machine Learning Applied to Link Prediction in BipartiteSocial Networks. In Proceedings of the 2010 International Conference on Advances inSocial Networks Analysis and Mining, Odense, Denmark, 9–11 August 2010; pp. 326–330. [Google Scholar] [CrossRef]
- O’Madadhain, J.; Hutchins, J.; Smyth, P. Prediction and ranking algorithms for event-based network data. SIGKDD Explor. Newsl. 2005, 7, 23–30. [Google Scholar] [CrossRef]
- Niwattanakul, S.; Singthongchai, J.; Naenudorn, E.; Wanapu, S. Using of Jaccard coefficient for keywords similarity. In Proceedings of the International MultiConference of Engineers and Computer Scientists, Hong Kong, China, 13–15 March 2013; Volume 1, pp. 380–384. [Google Scholar]
- Hesamipour, S.; Balafar, M.A. A new method for detecting communities and their centers using theAdamic/Adar Index and game theory. Phys. A Stat. Mech. Its Appl. 2019, 535, 122354. [Google Scholar] [CrossRef]
- Newman, M.E.J. Clustering and preferential attachment in growing networks. Phys. Rev. E 2001, 64, 025102(R). [Google Scholar] [CrossRef]
- Yu, E.Y.; Wang, Y.P.; Fu, Y.; Chen, D.B.; Xie, M. Identifying critical nodes in complex networks via graphconvolutional networks. Knowl.-Based Syst. 2020, 198, 105893. [Google Scholar] [CrossRef]
- Fortunato, S.; Hric, D. Community detection in networks: A user guide. Phys. Rep. 2016, 659, 1–44. [Google Scholar] [CrossRef]
- Hamerly, G.; Elkan, C. Learning the k in k-means. Adv. Neural Inf. Process. Syst. 2003, 16, 281–288. [Google Scholar]
- Pelleg, D.; Moore, A.W. X-means: Extending K-means with Efficient Estimation of the Number ofClusters. In Proceedings of the Seventeenth InternationalConference on Machine Learning (ICML’00), San Francisco, CA, USA, 29 June–2 July 2000; pp. 727–734. [Google Scholar] [CrossRef]
- Veličković, P.; Cucurull, G.; Casanova, A.; Romero, A.; Liò, P.; Bengio, Y. Graph Attention Networks. arXiv 2018, arXiv:1710.10903. [Google Scholar]
- Kipf, T.N.; Welling, M. Variational Graph Auto-Encoders. arXiv 2016, arXiv:1611.07308. [Google Scholar]
- Albert, R.; Jeong, H.; Barabási, A.L. Error and attack tolerance of complex networks. Nature 2000, 406, 378–382. [Google Scholar] [CrossRef] [PubMed]
- Callaway, D.S.; Newman, M.E.J.; Strogatz, S.H.; Watts, D.J. Network robustness and fragility: Percolation on random graphs. Phys. Rev. Lett. 2000, 85, 5468. [Google Scholar] [CrossRef]
- Lawyer, G. Understanding the influence of all nodes in a network. Sci. Rep. 2015, 5, 8665. [Google Scholar] [CrossRef]
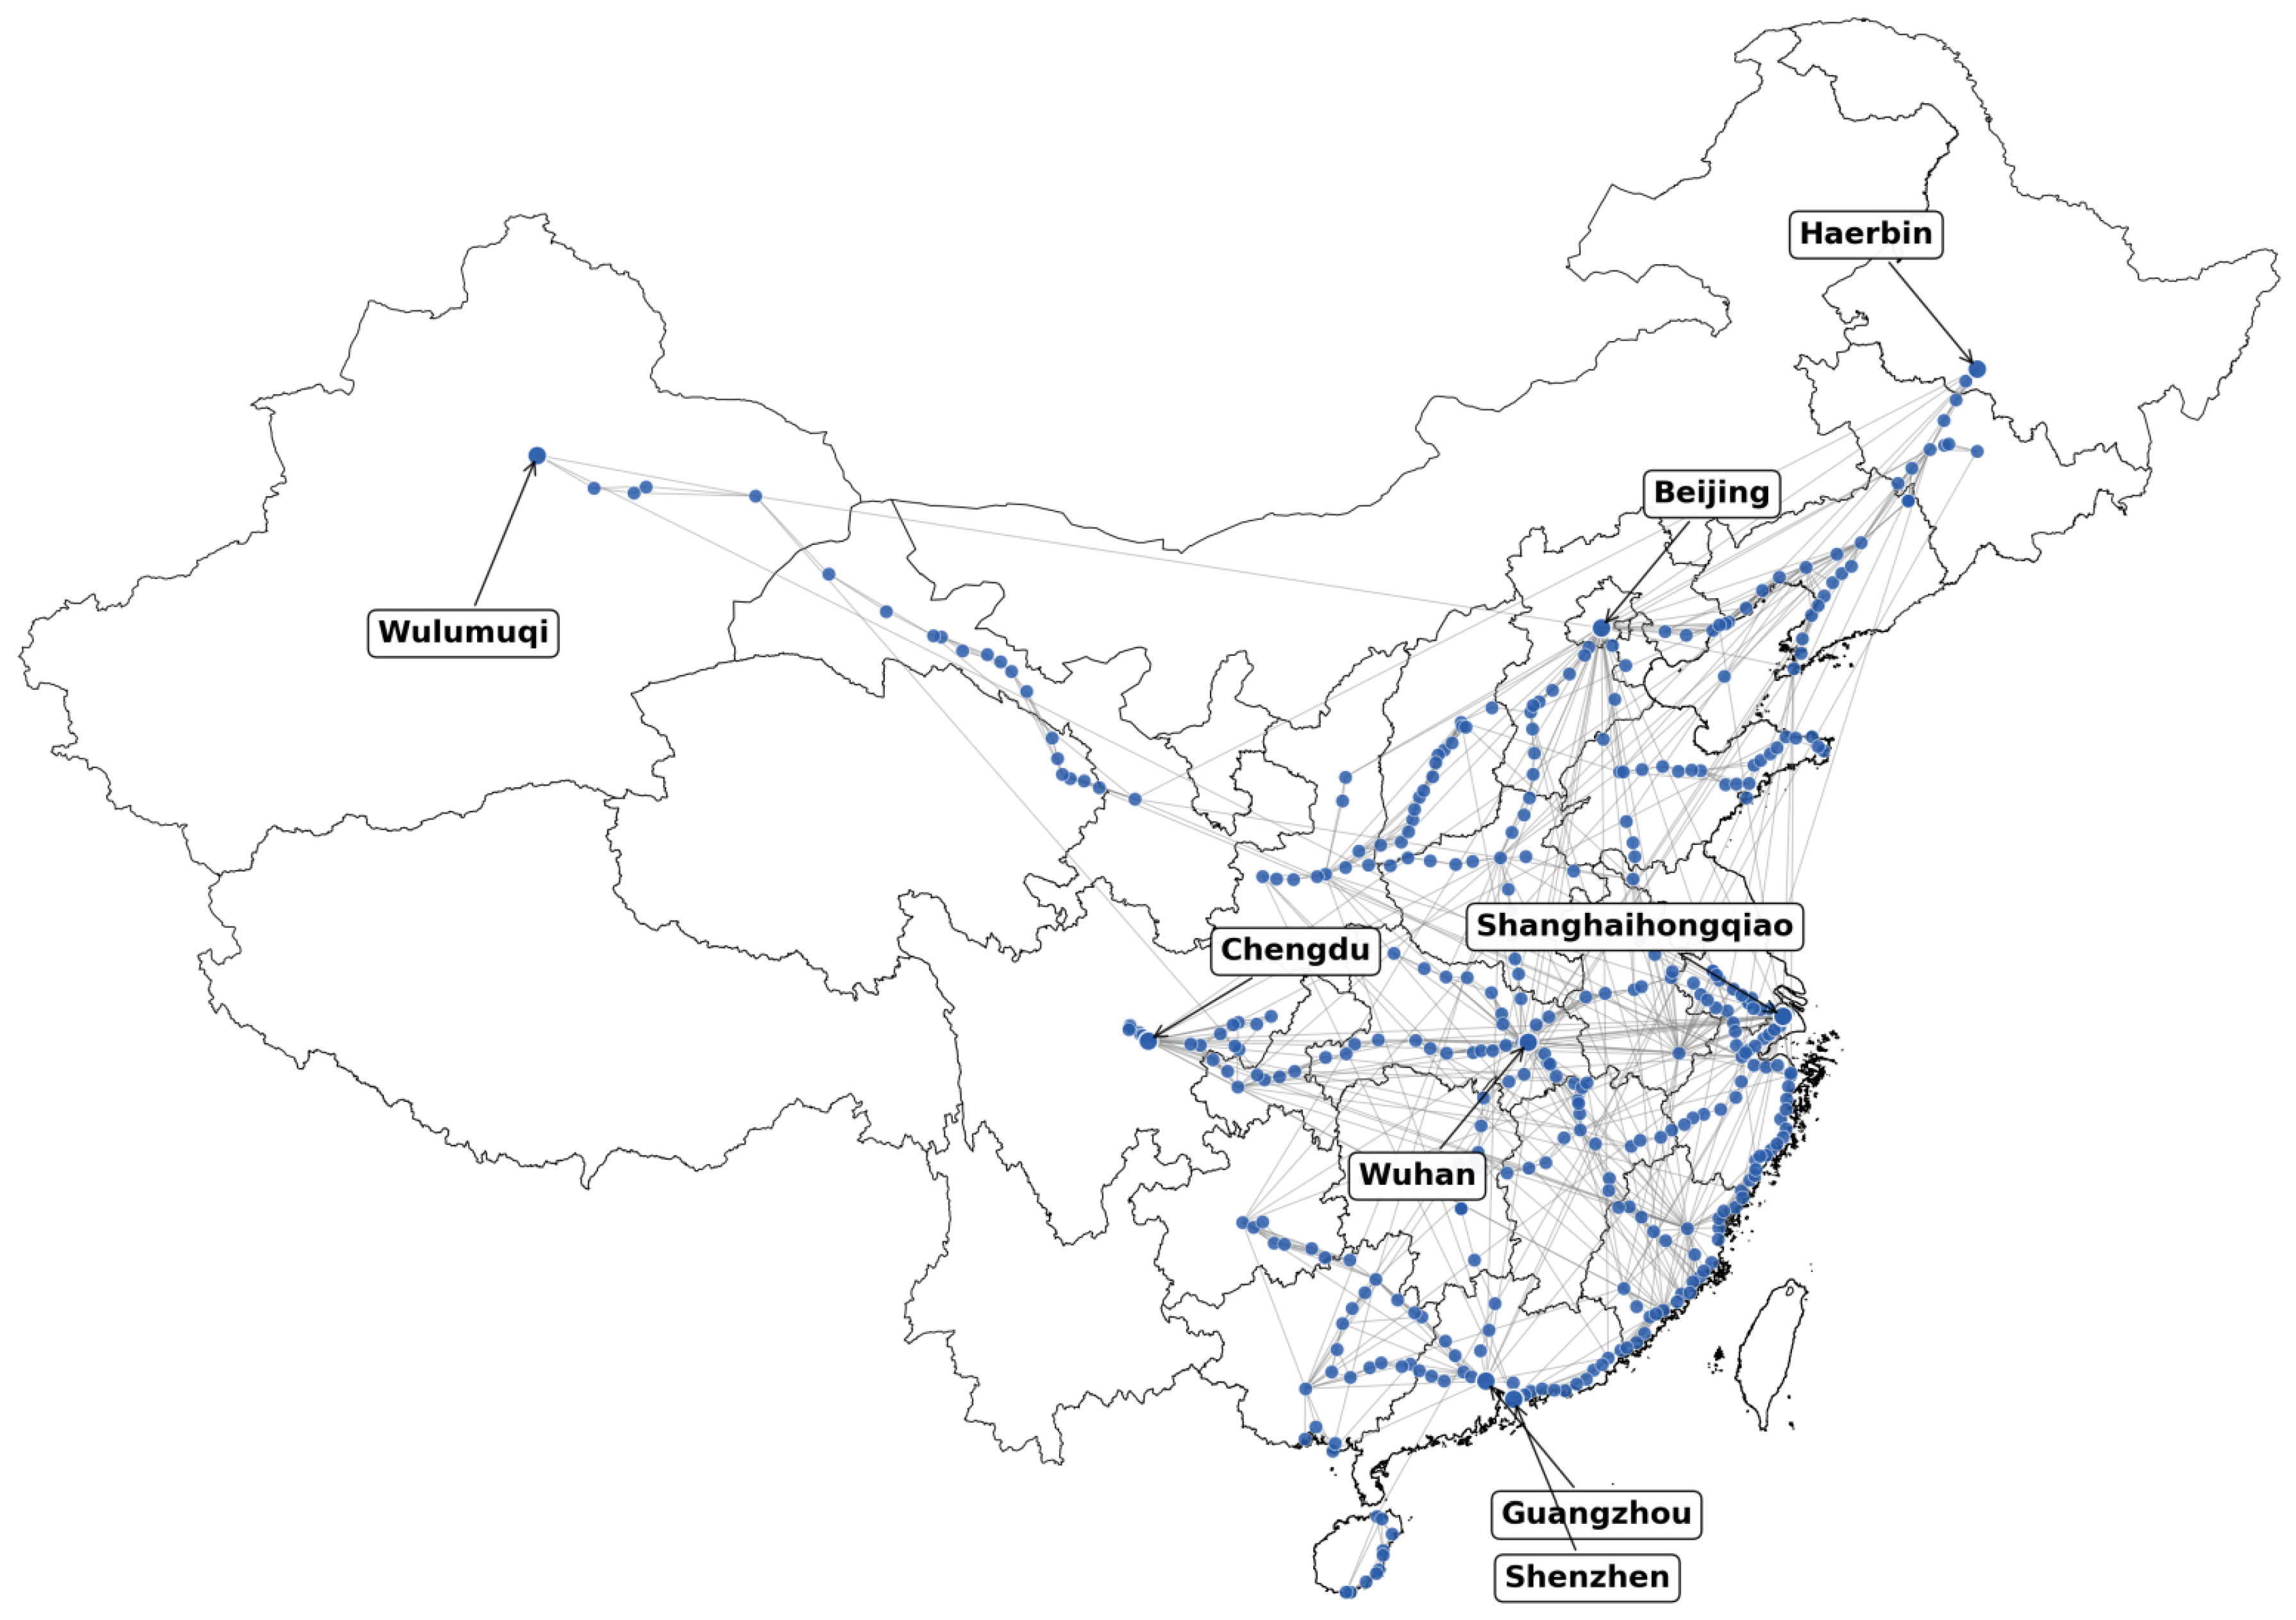


| Number of nodes | 379 | Number of edges | 1096 |
| Max degree | 35 | Min degree | 1 |
| Average clustering coefficient (C) | 0.5786 | Average shortest path length (L) | 4.2145 |
| Random network clustering coefficient () | 0.0104 | Random network characteristic path length () | 3.5940 |
| Rank | Name | Degree | Rank | Name | Degree |
|---|---|---|---|---|---|
| 1 | Fuzhou | 35 | 11 | Wuhan | 20 |
| 2 | Beijing | 33 | 12 | Changchun | 17 |
| 3 | (SH) Hongqiao | 32 | 13 | Guangzhou | 16 |
| 4 | Hankou | 31 | 14 | Chongqing | 16 |
| 5 | Nanjing | 31 | 15 | Nanning | 16 |
| 6 | Nanchang | 25 | 16 | Ningbo | 16 |
| 7 | Xiamen | 23 | 17 | Guilin | 16 |
| 8 | Hangzhou | 23 | 18 | Zhengzhou | 16 |
| 9 | Chengdu | 22 | 19 | Wenzhou | 16 |
| 10 | Shenyang | 21 | 20 | Taiyuan | 16 |
| Global Efficiency () | 0.2720 | Assortativity Coefficient (r) | 0.1688 |
| Local Efficiency () | 0.6663 | Network Density (D) | 0.0153 |
| Rank | Name | Score | Rank | Name | Score |
|---|---|---|---|---|---|
| 1 | Fuzhou | 6.516889 | 11 | Wuhan | 4.5285864 |
| 2 | (SH) Hongqiao | 6.1614046 | 12 | Changchun | 3.893515 |
| 3 | Beijing | 6.094687 | 13 | Wenzhou | 3.7896342 |
| 4 | Haikou | 5.9536953 | 14 | Chongqing | 3.7215261 |
| 5 | Nanjing | 5.91088 | 15 | Ningbo | 3.6994753 |
| 6 | Nanchang | 5.145378 | 16 | Nanning | 3.6439276 |
| 7 | Xiamen | 5.0674806 | 17 | Guangzhou | 3.639298 |
| 8 | Hangzhou | 4.768429 | 18 | Suzhou | 3.611753 |
| 9 | Chengdu | 4.6309624 | 19 | Taiyuan | 3.5928736 |
| 10 | Shenyang | 4.544697 | 20 | Guilin | 3.5588112 |
Disclaimer/Publisher’s Note: The statements, opinions and data contained in all publications are solely those of the individual author(s) and contributor(s) and not of MDPI and/or the editor(s). MDPI and/or the editor(s) disclaim responsibility for any injury to people or property resulting from any ideas, methods, instructions or products referred to in the content. |
© 2025 by the authors. Licensee MDPI, Basel, Switzerland. This article is an open access article distributed under the terms and conditions of the Creative Commons Attribution (CC BY) license (https://creativecommons.org/licenses/by/4.0/).
Share and Cite
Xu, Z.; Li, J.; Moulitsas, I.; Niu, F. Analysis of China’s High-Speed Railway Network Using Complex Network Theory and Graph Convolutional Networks. Big Data Cogn. Comput. 2025, 9, 101. https://doi.org/10.3390/bdcc9040101
Xu Z, Li J, Moulitsas I, Niu F. Analysis of China’s High-Speed Railway Network Using Complex Network Theory and Graph Convolutional Networks. Big Data and Cognitive Computing. 2025; 9(4):101. https://doi.org/10.3390/bdcc9040101
Chicago/Turabian StyleXu, Zhenguo, Jun Li, Irene Moulitsas, and Fangqu Niu. 2025. "Analysis of China’s High-Speed Railway Network Using Complex Network Theory and Graph Convolutional Networks" Big Data and Cognitive Computing 9, no. 4: 101. https://doi.org/10.3390/bdcc9040101
APA StyleXu, Z., Li, J., Moulitsas, I., & Niu, F. (2025). Analysis of China’s High-Speed Railway Network Using Complex Network Theory and Graph Convolutional Networks. Big Data and Cognitive Computing, 9(4), 101. https://doi.org/10.3390/bdcc9040101