
Generation Z’s Travel Behavior and Climate Change: A Comparative Study for Greece and the UK


Abstract
1. Introduction and Background
- The investigation of climate change’s impact on travel behavior among Generation Z across different socio-cultural contexts, specifically in Greece and the UK.
- The identification of latent and observed factors that shape the willingness to reduce car use and the determinants of the actual reduction in car use in response to climate change.
- The estimation of ordered response models to identify and quantify the relations hips between these latent and observed factors and the behavioral nuances and intentions of Gen Z individuals.
2. Methodological Approach
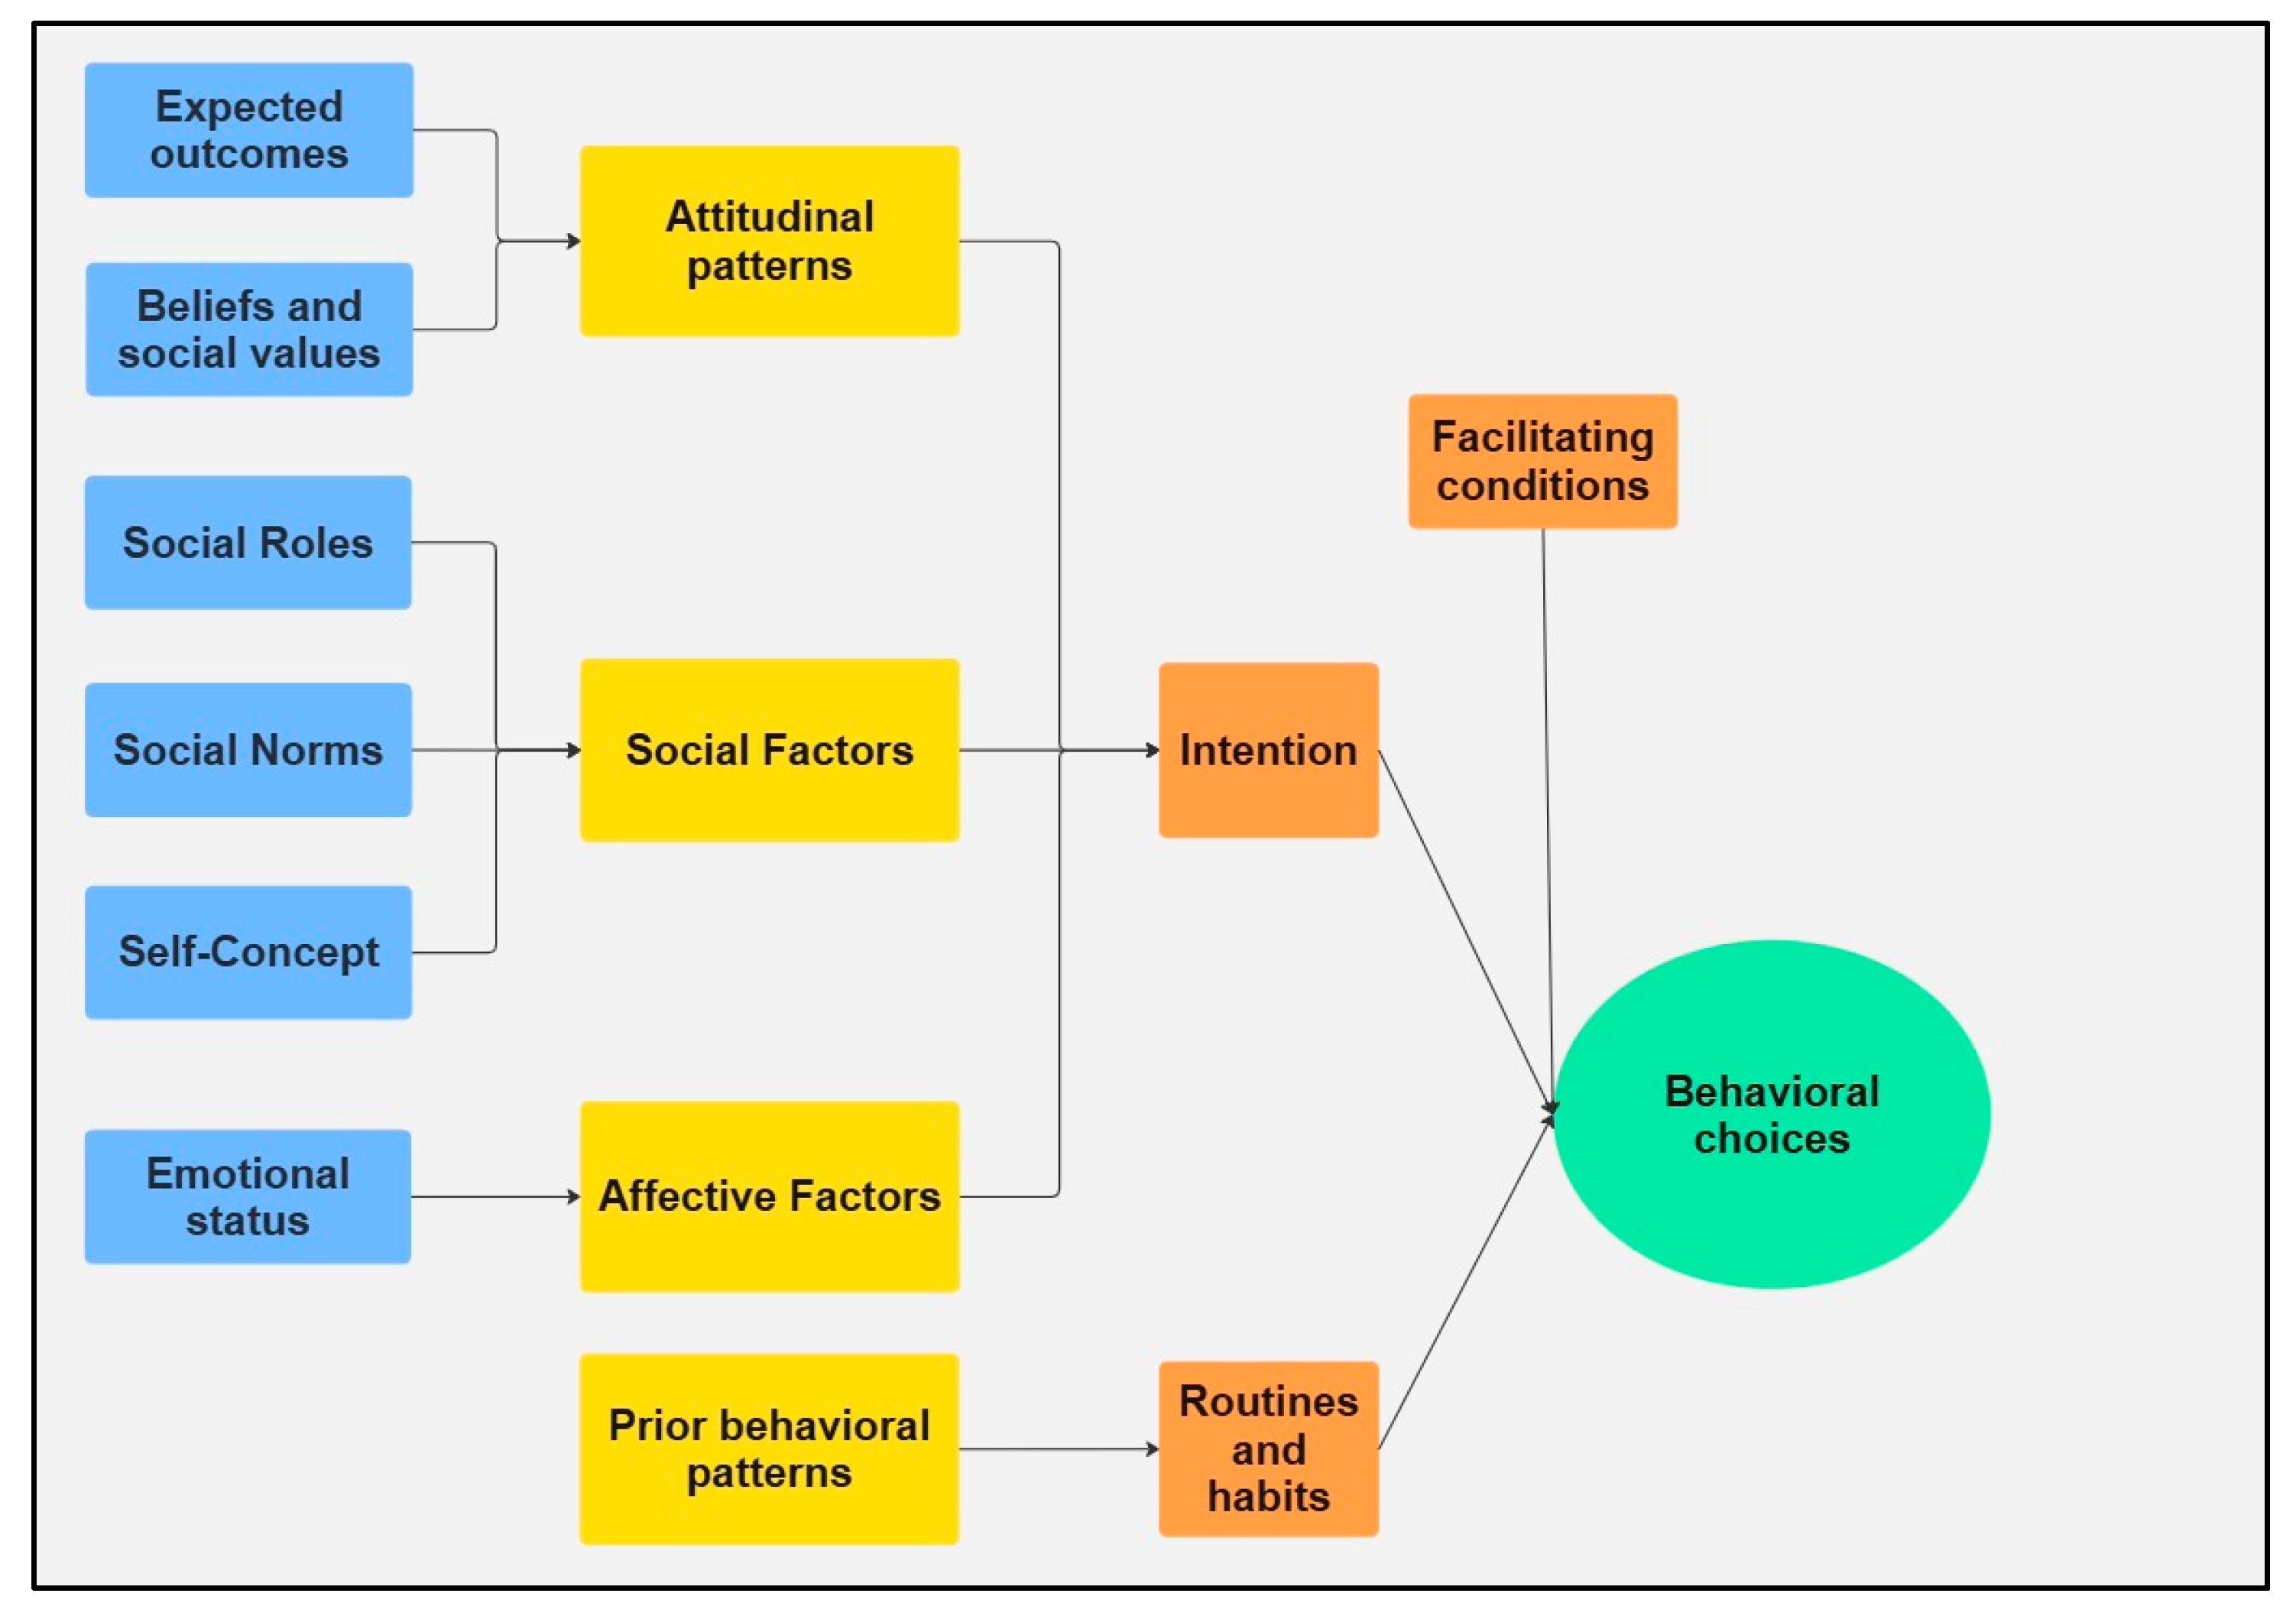
2.1. Theoretical Framework
2.2. Exploratory Factor Analysis
2.3. Ordered Probability Models
zi = 2 if μ0 < zi* ≤ μ1
zi = K if zi* ≥ μK − 1
3. Data
3.1. Greek Data—Questionnaire
- Socio-demographic Characteristics: Respondents’ gender, age, annual household income, educational level, and residential area.
- Travel Behavior: Respondents’ usual travel modes and trip purposes.
- Perceptions of Climate Change: Views and emotions about climate change.
- Climate Change and Travel: Perceptions on how climate change influences travel behavior and general pro-environmental attitudes or relevant behaviors.
- Mitigation Measures: Perceptions on measures and incentives aimed towards promoting environmentally sustainable transportation modes, and reactions to or expectations about proposed policy measures such as Low-Emission Zones (LEZs).
3.2. NTAS Data
4. Results and Analysis
4.1. Greek Data
4.1.1. Descriptive Analysis—Greek Data
- Less than once a year or never;
- Less than once a month but more than once a year;
- 1 to 3 times per month;
- 1 to 2 times per week;
- 3 to 4 times per week;
- 5 or more times per week.
4.1.2. Exploratory Factor Analysis—Greek Data
- Emotions about climate change;
- Social roles: Climate change is not an issue of individual responsibility;
- Social roles: Climate change is an issue of individual responsibility;
- Social norms: There is no point in reducing the amount I travel by car due to climate change;
- Social norms: Car use should be taxed for the benefit of mitigating climate change;
- The flexibility of travel habits.
4.1.3. Ordered Probability Models Greek Data
Willingness to Reduce Car Travel Due to Climate Change
Reduction in Car Travel Due to Climate Change
4.2. National Travel Attitudes Survey (NTAS) Data
4.2.1. Descriptive Analysis
4.2.2. Exploratory Factor Analysis—NTAS Data
4.2.3. Ordered Probability Model—NTAS Data
5. Discussion and Conclusions
Author Contributions
Funding
Institutional Review Board Statement
Informed Consent Statement
Data Availability Statement
Acknowledgments
Conflicts of Interest
References
- IPCC. Climate Change 2023: Synthesis Report. Contribution of Working Groups I, II, and III to the Sixth Assessment Report of the Intergovernmental Panel on Climate Change; Lee, H., Romero, J., Eds.; IPCC: Geneva, Switzerland, 2023; pp. 35–115. [Google Scholar]
- European Environment Agency (EEA). Transport and Mobility. 2024. Available online: https://www.eea.europa.eu/en/topics/in-depth/transport-and-mobility (accessed on 8 March 2025).
- Matulla, C.; Enigl, K. Securing High Levels of Sustainability in Transportation Under Future Climate Change. In Oxford Research Encyclopedia of Climate Science; Oxford University Press: Oxford, UK, 2023; Available online: https://oxfordre.com/climatescience/view/10.1093/acrefore/9780190228620.001.0001/acrefore-9780190228620-e-830 (accessed on 8 March 2025).
- Chatziioannou, I.; Alvarez-Icaza, L.; Bakogiannis, E.; Kyriakidis, C.; Chias-Becerril, L. A structural analysis for the categorization of the negative externalities of transport and the hierarchical organization of sustainable mobility strategies. Sustainability 2020, 12, 6011. [Google Scholar] [CrossRef]
- European Commission, Directorate General for Mobility and Transport. Transport in the European Union: Current Trends and Issues; Publications Office of the European Union: Luxembourg, 2024; Available online: https://data.europa.eu/doi/10.2832/131741 (accessed on 8 March 2025).
- Department for Transport. National Travel Attitudes Study, 2019–2024, [data collection], 2nd ed.; UK Data Service: Colchester, UK, 2024. [Google Scholar] [CrossRef]
- Givoni, M.; Bannister, D. Moving Towards Low Carbon Mobility; Edward Elgar Publishing: Cheltenham, UK, 2021. [Google Scholar] [CrossRef]
- World Health Organization (WHO). Sustainable Transport for Health; WHO Publication: Geneva, Switzerland, 2021; Available online: https://www.who.int/publications/i/item/WHO-HEP-ECH-AQH-2021.6 (accessed on 8 March 2025).
- Ek, K.; Wårell, L.; Andersson, L. Motives for walking and cycling when commuting: Differences in local contexts and attitudes. Eur. Transp. Res. Rev. 2021, 13, 46. [Google Scholar] [CrossRef]
- Gonzalez, J.N.; Gomez, J.; Vassallo, J.M. Are low emission zones and on-street parking management effective in reducing parking demand for most polluting vehicles and promoting greener ones? Transp. Res. Part A Policy Pract. 2023, 176, 103813. [Google Scholar] [CrossRef]
- Tassinari, F. Low emission zones and traffic congestion: Evidence from Madrid Central. Transp. Res. Part A Policy Pract. 2024, 185, 104099. [Google Scholar] [CrossRef]
- Sarmiento, L.; Wägner, N.; Zaklan, A. The air quality and well-being effects of low emission zones. J. Public Econ. 2023, 227, 105014. [Google Scholar] [CrossRef]
- Kang, C.; Ota, M.; Ushijima, K. Benefits of diesel emission regulations: Evidence from the world’s largest low emission zone. J. Environ. Econ. Manag. 2024, 125, 102944. [Google Scholar] [CrossRef]
- Hajmohammadi, H.; Heydecker, B. Evaluation of air quality effects of the London ultra-low emission zone by state-space modelling. Atmos. Pollut. Res. 2022, 13, 101514. [Google Scholar] [CrossRef]
- Holman, C.; Harrison, R.; Querol, X. Review of the efficacy of low emission zones to improve urban air quality in European cities. Atmos. Environ. 2015, 111, 161–169. [Google Scholar] [CrossRef]
- Gonzalez, J.; Gomez, J.; Vassallo, J.M. Do urban parking restrictions and low emission zones encourage greener mobility? Transp. Res. Part D Transp. Environ. 2022, 107, 103319. [Google Scholar] [CrossRef]
- Dimock, M. Defining Generations: Where Millennials End and Generation Z Begins; Pew Research Center: Washington, WA, USA, 2019; Available online: https://www.pewresearch.org/short-reads/2019/01/17/where-millennials-end-and-generation-z-begins/ (accessed on 8 March 2025).
- Tyson, A.; Kennedy, B.; Funk, C.; Gen, Z. Millennials Stand Out for Climate Change Activism, Social Media Engagement with Issue; Pew Research Center: London, UK, 2021; Available online: https://www.pewresearch.org/science/2021/05/26/gen-z-millennials-stand-out-for-climate-change-activism-social-media-engagement-with-issue/ (accessed on 8 March 2025).
- Deloitte. Deloitte global 2023 Gen Z and Millennial Survey: Waves of Change—Acknowledging Progress, Confronting Setbacks. Deloitte, 9, 2023. Available online: https://www2.deloitte.com/content/dam/insights/articles/glob175807_global-millennial---gen-z-survey/Deloitte_Global_2023_Gen_Z_Millennial_survey.pdf (accessed on 8 March 2025).
- Wong, Y.Z.; Hensher, D.A.; Mulley, C. Mobility as a service (MaaS): Charting a future context. Transp. Res. Part A Policy Pract. 2020, 131, 5–19. [Google Scholar] [CrossRef]
- Kriswardhana, W.; Esztergár-Kiss, D. Heterogeneity in transport mode choice of college students at a university based on the MaaS concept. Travel Behav. Soc. 2024, 36, 100801. [Google Scholar] [CrossRef]
- Department for Transport (DfT). National Attitudes Survey (NTAS). GOV.UK, 2023. Available online: https://www.gov.uk/government/collections/national-travel-attitudes-study-ntas (accessed on 8 March 2025).
- Domarchi, C.; Tudela, A.; González, A. Effect of attitudes, habit, and affective appraisal on mode choice: An application to university workers. Transportation 2008, 35, 585–599. [Google Scholar] [CrossRef]
- Arroyo, R.; Ruiz, T.; Mars, L.; Rasouli, S.; Timmermans, H. Influence of values, attitudes towards transport modes, and companions on travel behavior. Transp. Res. Part F Traffic Psychol. Behav. 2020, 71, 8–22. [Google Scholar] [CrossRef]
- Bradley, G.; Babutsidze, Z.; Chai, A.; Reser, J. The role of climate change risk perception, response efficacy, and psychological adaptation in pro-environmental behavior: A two-nation study. J. Environ. Psychol. 2020, 68, 101410. [Google Scholar] [CrossRef]
- Rahim, A.; Fonzone, A.; Fountas, G.; Downey, L. On the attitudes toward automation in determining the intention to use automated buses in Scotland. Transp. Res. Rec. 2023, 2677, 384–396. [Google Scholar] [CrossRef]
- Ajzen, I. The theory of planned behavior. Organ. Behav. Hum. Decis. Process. 1991, 50, 179–211. [Google Scholar] [CrossRef]
- Chatterton, T.; Anderson, O. An Introduction to Thinking About ‘Energy Behaviour’: A Multi-Model Approach; Department for Energy and Climate Change: London, UK, 2011. [Google Scholar]
- Salonen, A.; Fredriksson, L.; Järvinen, S.; Korteniemi, P.; Danielsson, J. Sustainable consumption in Finland—The phenomenon, consumer profiles, and future scenarios. Int. J. Mark. Stud. 2014, 6, 59–82. [Google Scholar] [CrossRef]
- Semple, T.; Fonzone, A.; Fountas, G. The impact of COVID-19, climate change, and working from home on travel choices. arXiv 2022, arXiv:2205.01027. [Google Scholar] [CrossRef]
- Nikiforiadis, A.; Lioupi, C.; Fountas, G.; Stamatiadis, N.; Basbas, S. Determinants of the travel satisfaction of e-scooter users. Travel Behav. Soc. 2024, 37, 100853. [Google Scholar] [CrossRef]
- Washington, S.; Karlaftis, M.G.; Mannering, F.; Anastasopoulos, P. Statistical and Econometric Methods for Transportation Data Analysis; Chapman and Hall/CRC: London, UK, 2020. [Google Scholar]
- Fountas, G.; Anastasopoulos, P.C. Analysis of accident injury-severity outcomes: The zero-inflated hierarchical ordered probit model with correlated disturbances. Anal. Methods Accid. Res. 2018, 20, 30–45. [Google Scholar] [CrossRef]
- Thomas, H.; Serrenho, A.C. Using different transport modes: An opportunity to reduce UK passenger transport emissions? Transp. Res. Part D Transp. Environ. 2024, 126, 103989. [Google Scholar] [CrossRef]
- Norbury, F. Roads Policing and Its Contribution to Road Safety; Parliamentary Advisory Council for Transport Safety: London, UK, 2020. [Google Scholar]
- Kaiser, H.F. An index of factorial simplicity. Psychometrika 1974, 39, 31–36. [Google Scholar] [CrossRef]
- Widadi, F.; Subroto, B.; Rahman, A. Tax avoidance mediated by constitutional ownership as moderating variables. Etikonomi 2022, 21, 411–430. [Google Scholar] [CrossRef]
- Mandolakani, F.S.; Saheli, M.V.; Singleton, P.A. Exploring the impacts of air quality on travel behavior and activity participation: Evidence from travel diary surveys in Northern Utah. arXiv 2024, arXiv:2408.03839. [Google Scholar]
- Vasudevan, N.; Gore, N.; Zope, R.; Arkatkar, S.; Joshi, G. Determining mode shift elasticity based on household income and travel cost. Res. Transp. Econ. 2021, 85, 100771. [Google Scholar] [CrossRef]
- Fountas, G.; Fonzone, A.; Olowosegun, A. The Impact of the Cost-Of-Living Crisis on Travel Choices: The Case of Scotland. Res. Transp. Econ. 2025, in press. [Google Scholar]
- Gray, S.G.; Raimi, K.T.; Wilson, R.; Árvai, J. Will Millennials save the world? The effect of age and generational differences on environmental concern. J. Environ. Manag. 2019, 242, 394–402. [Google Scholar] [CrossRef]
- Hamidi, Z.; Zhao, C. Shaping sustainable travel behavior: Attitude, skills, and access all matter. Transp. Res. Part D Transp. Environ. 2020, 88, 102566. [Google Scholar] [CrossRef]
- Office for National Statistics (ONS). (n.d.); SOC2010 Volume 3: The National Statistics Socio-Economic Classification (NS-SEC rebased on SOC2010). Available online: https://www.ons.gov.uk/methodology/classificationsandstandards/standardoccupationalclassificationsoc/soc2010/soc2010volume3thenationalstatisticssocioeconomicclassificationnssecrebasedonsoc2010 (accessed on 8 March 2025).
- Cruz, C.O.; Sarmento, G.M. “Mobility as a Service” Platforms: Using Digitalization to Increase the Sustainability of Transportation Systems. Sustainability 2020, 12, 6368. [Google Scholar] [CrossRef]
- Kovacs, L.N.; Jordan, G.; Berglund, F.; Holden, B.; Niehoff, E.; Pohl, F.; Kökönyei, G. Acting as we feel: Which emotional responses to the climate crisis motivate climate action. J. Environ. Psychol. 2024, 96, 102327. [Google Scholar] [CrossRef]
- Teixeira, J.F.; Silva, C.; Seisenberger, S.; Büttner, B.; McCormick, B.; Papa, E.; Cao, M. Classifying 15-minute cities: A review of worldwide practices. Transp. Res. Part A Policy Pract. 2024, 189, 104234. [Google Scholar] [CrossRef]
- Gyurián Nagy, N. Gender Differences in Environmental Attitudes: An Analysis Using the NEP Scale. Gend. Issues 2025, 42, 5. [Google Scholar] [CrossRef]
- Echavarren, J.M. The Gender Gap in Environmental Concern: Support for an Ecofeminist Perspective and the Role of Gender Egalitarian Attitudes. Sex Roles 2023, 89, 610–623. [Google Scholar] [CrossRef]
- Kirby, C.K.; Zwickle, A. Sustainability behaviors, attitudes, and knowledge: Comparing university students and the general public. J. Environ. Stud. Sci. 2021, 11, 639–647. [Google Scholar] [CrossRef]

| Thematic Categories | Variables | Question Type |
|---|---|---|
| Demographics | Gender | Multiple choice |
| Age | ||
| Educational level | ||
| Employment | ||
| Household income | ||
| Residential area in Thessaloniki | ||
| Travel behavior | Frequency of using different travel modes | 5-point Likert scale: ≥5 times a week to Less than once a year or never |
| Travel frequency for specific trip purposes | ||
| Frequency of key remote activities | ||
| Number of journeys under 3 km (or 2 miles) that I currently make by car but could easily switch to bus, bike, e-scooter, or walking | 5-point Likert scale: Strongly Disagree to Strongly Agree | |
| Climate change and travel | People’s mobility choices can help tackle climate change’s impacts | |
| To what extent do you agree or disagree that it is everyone’s responsibility to change travel behaviors to mitigate climate change impacts | ||
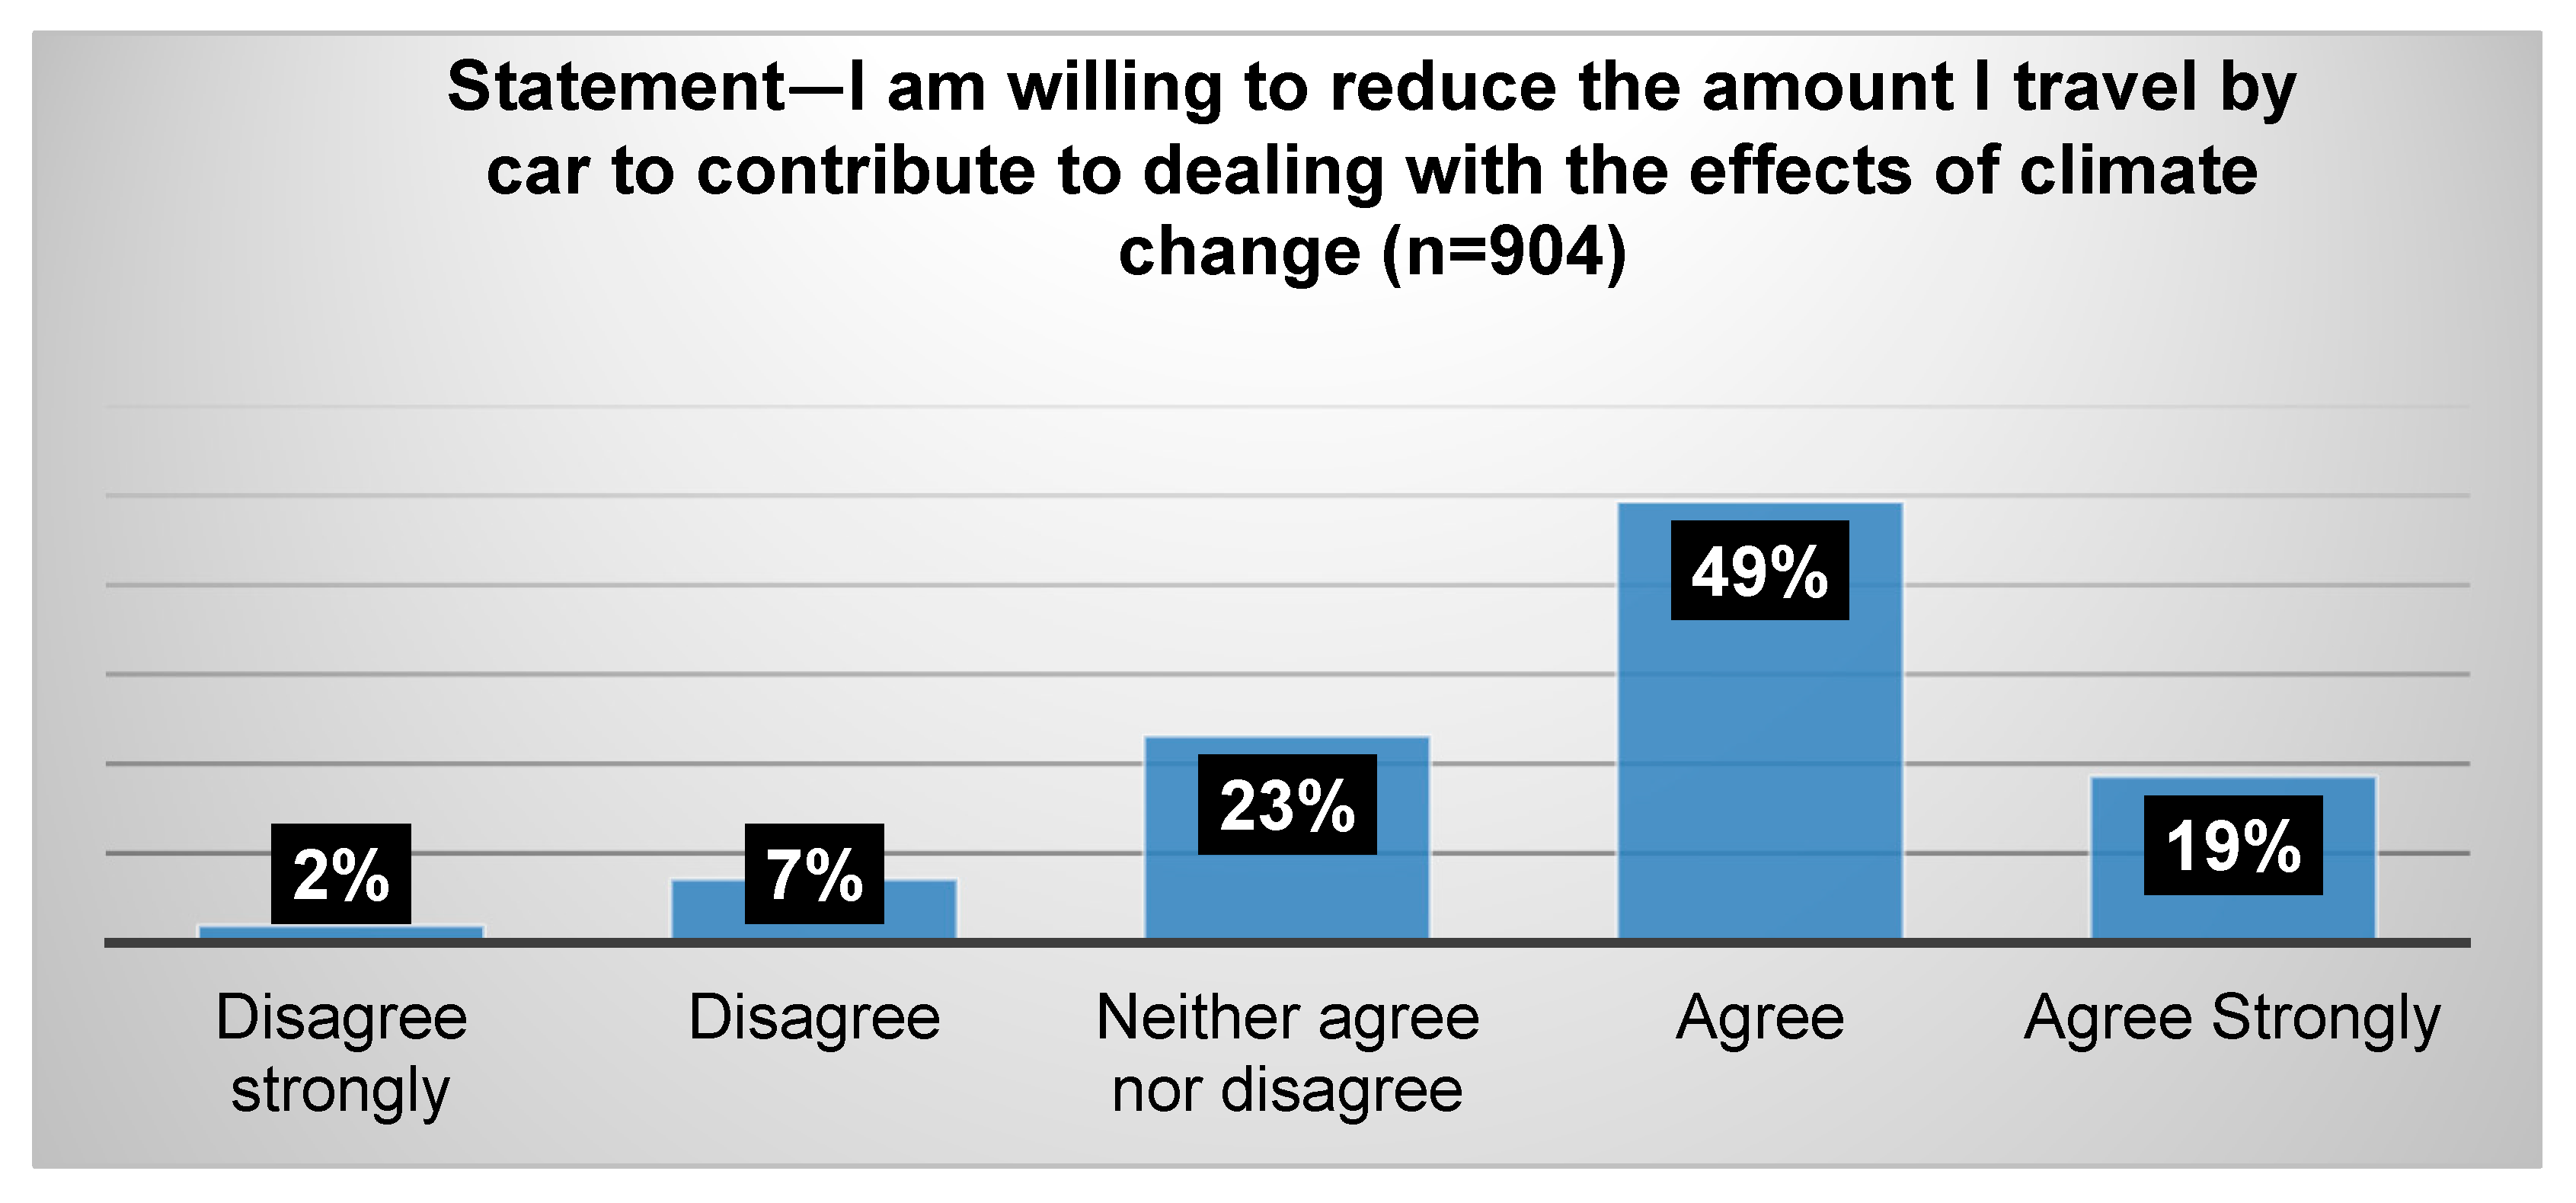
| I am willing to reduce the amount I travel by car to help tackle the impacts of climate change | ||
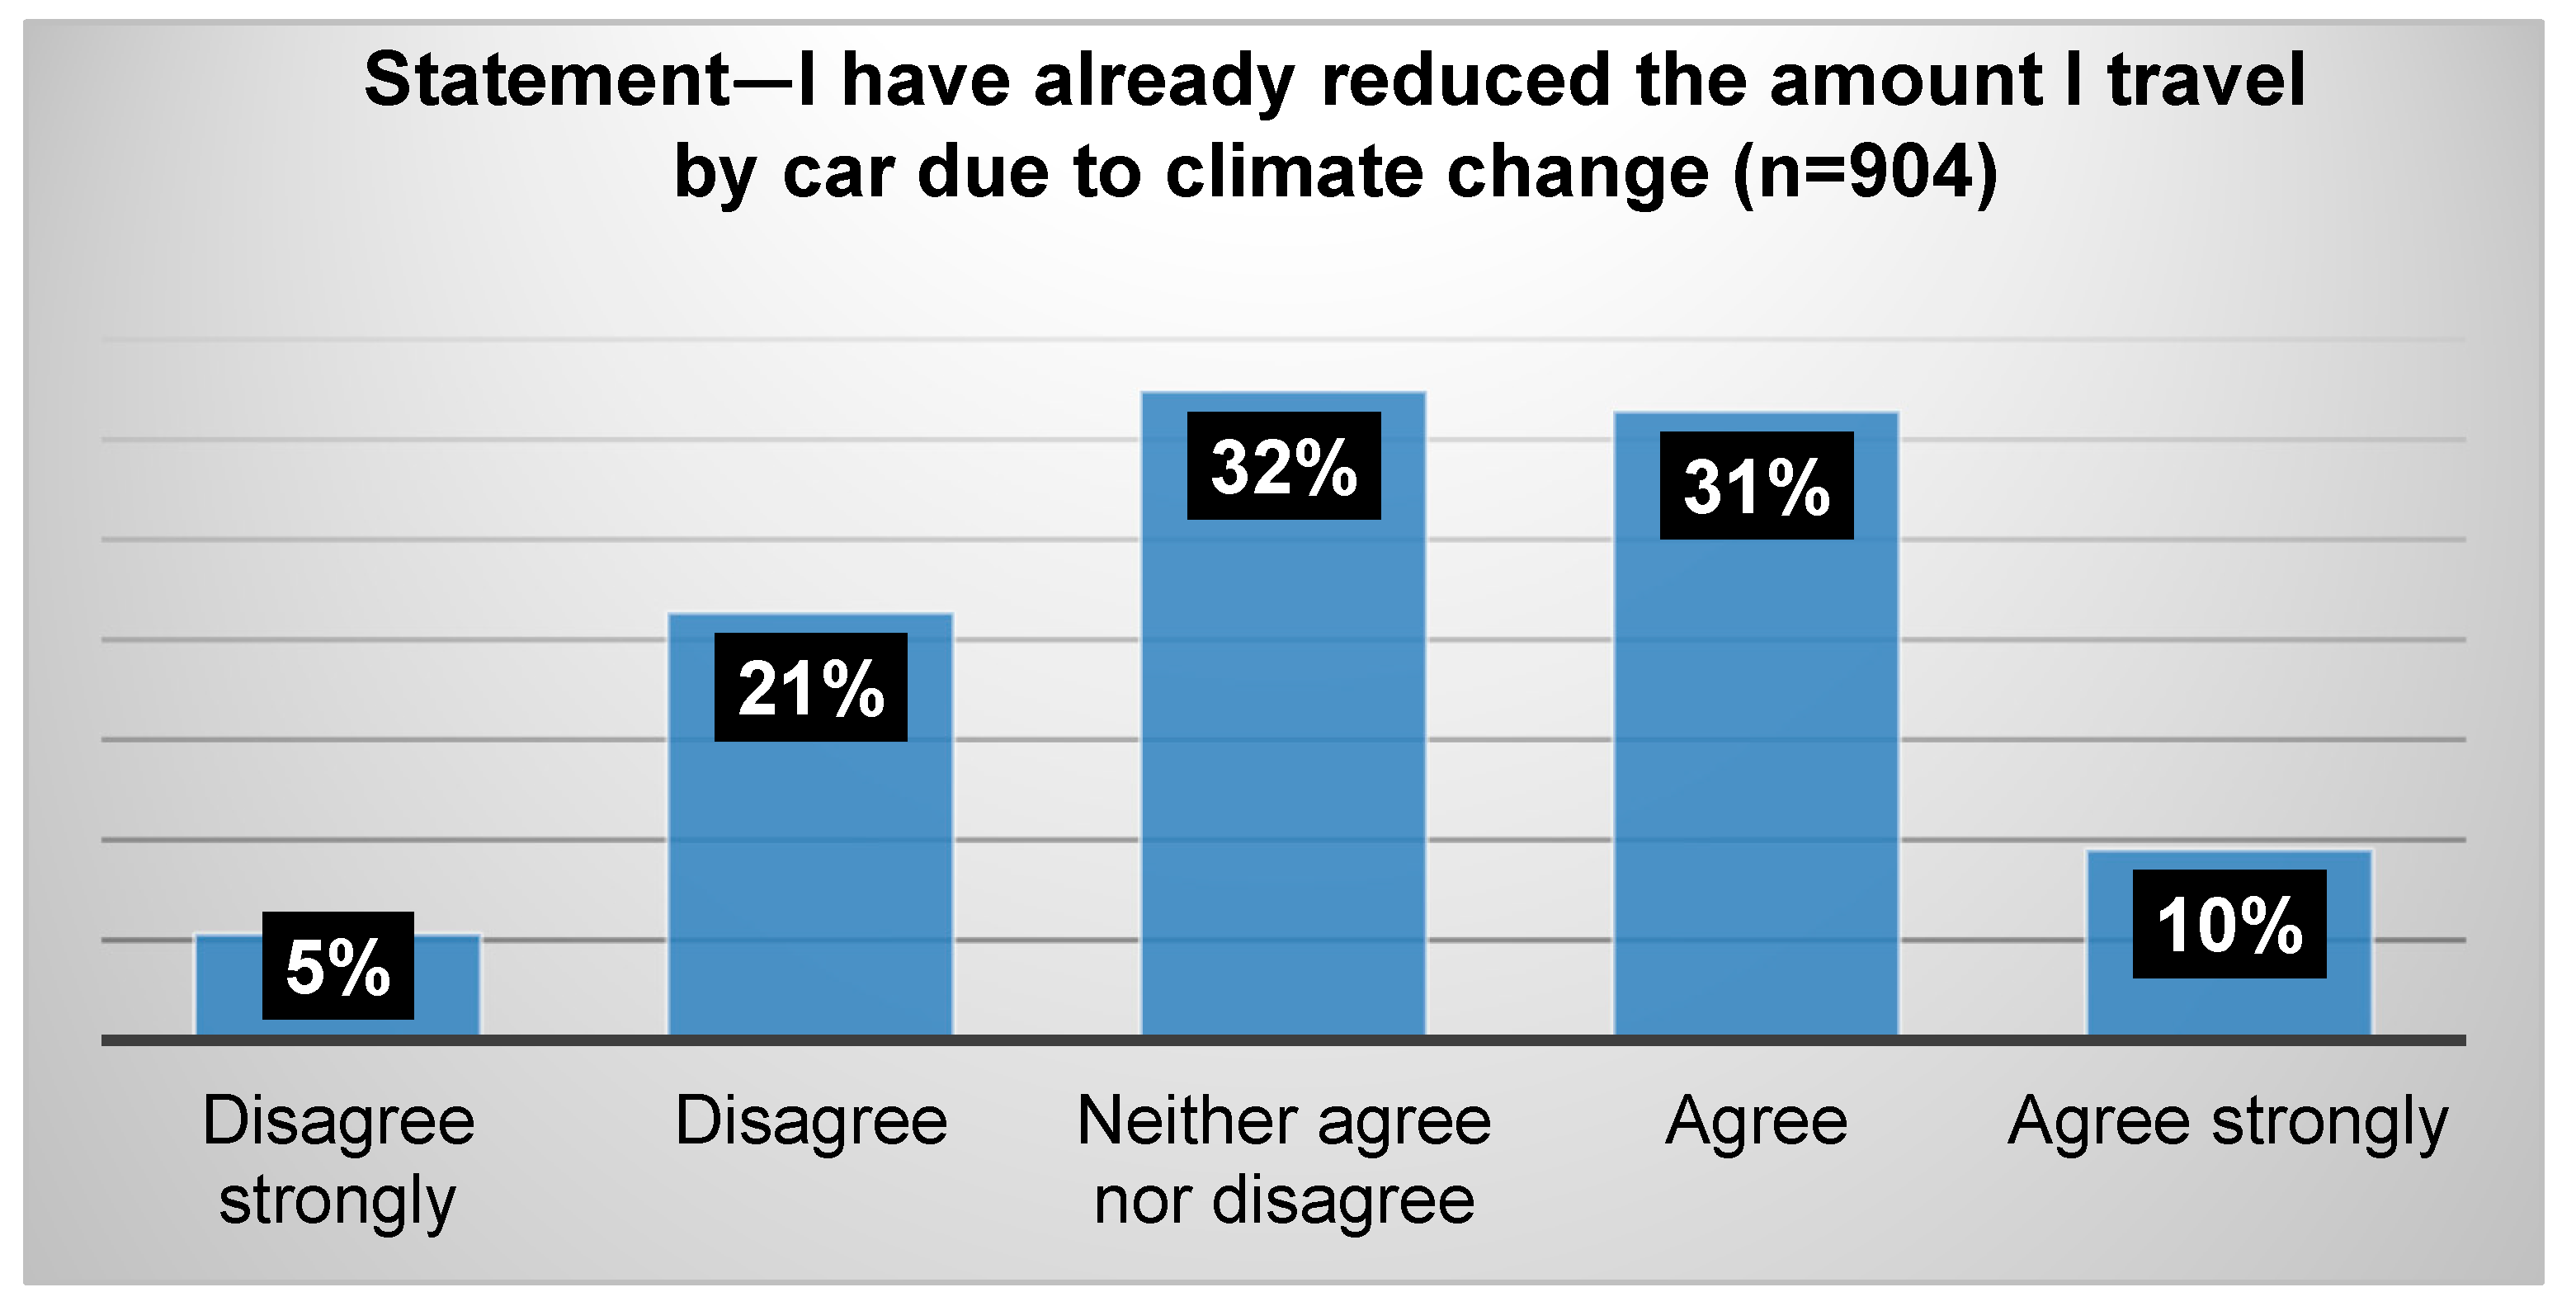
| I have already reduced the amount I travel by car due to climate change/I am in the process of doing that (CCT4) | ||
| (If CCT4 = Agree or strongly agree) Which travel mode did you use instead of car? | ||
| (If CCT4 = Agree or strongly agree) For which travel purposes have you reduced or will you reduce your car use? | ||
| For the benefit of the environment, we all need to reduce how much we use our cars. | ||
| Mitigation policies | To what extent do you agree or disagree with the implementation of Low Emission Zones in specific high polluted areas to combat climate change? (LEZ1) | |
| LEZs are mainly aimed at economic benefit. (LEZ2) | ||
| LEZs can contribute to improving public health and quality of life. (LEZ3) | ||
| LEZs cannot be implemented due to a lack of infrastructure. (LEZ4) | ||
| LEZs cannot be implemented because most people are not interested in environmental issues. (LEZ5) | ||
| What could encourage you to use public transport more frequently? | Multiple choice | |
| What could encourage you to cycle or to use e-scooters more often? | ||
| Which sources of information do you use to keep up with climate change issues? | ||
| Perceptions of climate change | Opinion on climate change | |
| Concern about air quality in my area | ||
| Entity (individual, industry, government) with key responsibility for tackling climate change impacts | ||
| Emotions on climate change |
| Category | Variable | Options | N | % |
|---|---|---|---|---|
| Demographics | Gender | Male | 272 | 30.1% |
| Female | 616 | 68.1% | ||
| Prefer not to answer | 14 | 1.5% | ||
| Household income | 0–15,000 € | 322 | 35.6% | |
| 15,000–30,000 € | 275 | 30.4% | ||
| 30,000+ € | 112 | 12.4% | ||
| Prefer not to answer | 195 | 21.6% | ||
| Occupation | Full time job—Yes | 112 | 12.4% | |
| Full time job—No | 792 | 87.6% | ||
| Part time job—Yes | 124 | 13.7% | ||
| Part time job—No | 780 | 86.3% | ||
| Stay-at-home individual—Yes | 4 | 0.4% | ||
| Stay-at-home individual—No | 900 | 99.6% | ||
| Unemployed—Yes | 76 | 8.4% | ||
| Unemployed—No | 828 | 91.6% | ||
| University Student—Yes | 761 | 84.2% | ||
| University Student—No | 143 | 15.8% | ||
| Educational level | Primary School | 1 | 0.1% | |
| Middle School | 2 | 0.2% | ||
| Secondary Education | 632 | 69.9% | ||
| Higher Education | 201 | 22.2% | ||
| Master’s/Doctoral Degree | 66 | 7.3% | ||
| Prefer not to answer | 2 | 0.2% |
| Category | Variable | Options | |||||
|---|---|---|---|---|---|---|---|
| Less Than Once a Year | Less Than Once a Month and More Than Once a Year | 1 to 3 Times per Month | 1 to 2 Times per Week | 3 to 4 Times per Week | 5 or More Times per Week | ||
| Travel habits | Private vehicle | 181 | 115 | 174 | 187 | 111 | 136 |
| 20.0% | 12.7% | 19.2% | 20.7% | 12.3% | 15.0% | ||
| Public transport | 31 | 58 | 95 | 130 | 172 | 418 | |
| 3.4% | 6.4% | 10.5% | 14.4% | 19.0% | 46.2% | ||
| On foot | 1 | 12 | 38 | 110 | 177 | 566 | |
| 0.1% | 1.3% | 4.2% | 12.2% | 19.6% | 62.6% | ||
| Taxi | 270 | 394 | 187 | 44 | 7 | 2 | |
| 29.9% | 43.6% | 20.7% | 4.9% | 0.8% | 0.2% | ||
| Bike | 682 | 149 | 32 | 15 | 11 | 15 | |
| 75.4% | 16.5% | 3.5% | 1.7% | 1.2% | 1.7% | ||
| E-scooter | 800 | 50 | 26 | 15 | 9 | 4 | |
| 88.5% | 5.5% | 2.9% | 1.7% | 1.0% | 0.4% | ||
| How concerned are you about air quality in your immediate area? | Not at all concerned | 1 | 0.1% |
| Not very concerned | 134 | 14.8% | |
| Fairly concerned | 417 | 46.1% | |
| Very concerned | 352 | 38.9% | |
| Perceptions on climate change | I believe that climate change is occurring, and it is a result of human activity | 878 | 97.1% |
| … it is not a result of human activity | 22 | 2.4% | |
| I don’t believe climate change is occurring | 4 | 0.4% |
| Category | Variable | Options | ||||
|---|---|---|---|---|---|---|
| Disagree Strongly | Disagree | Neither Agree nor Disagree | Agree | Agree Strongly | ||
| (FTH) Many of the journeys of <3 km that I make by car, I could just as easily… | … walk | 24 | 97 | 185 | 339 | 259 |
| 2.7% | 10.7% | 20.5% | 37.5% | 28.7% | ||
| … go by bus | 43 | 100 | 161 | 345 | 255 | |
| 4.8% | 11.1% | 17.8% | 38.2% | 28.2% | ||
| … cycle, if I had a bike | 117 | 181 | 221 | 256 | 129 | |
| 12.9% | 20.0% | 24.4% | 28.3% | 14.3% | ||
| Emotions (EMs)—Climate change makes me feel… | … sad | 17 | 59 | 232 | 384 | 212 |
| 1.9% | 6.5% | 25.6% | 42.5% | 23.5% | ||
| … anxious | 13 | 71 | 210 | 388 | 222 | |
| 1.4% | 7.9% | 23.2% | 42.9% | 24.6% | ||
| … angry | 15 | 94 | 273 | 332 | 190 | |
| 1.7% | 10.4% | 30.2% | 36.7% | 21.0% | ||
| … weak | 44 | 216 | 319 | 231 | 94 | |
| 4.9% | 23.9% | 35.3% | 25.6% | 10.4% | ||
| … guilty | 65 | 177 | 290 | 293 | 79 | |
| 7.2% | 19.6% | 32.1% | 32.4% | 8.7% | ||
| … scares me | 15 | 58 | 188 | 419 | 224 | |
| 1.7% | 6.4% | 20.8% | 46.3% | 24.8% | ||
| Social roles (SRs) | It is my responsibility to change the way I travel and live to help tackle climate change | 14 | 63 | 161 | 468 | 198 |
| 1.5% | 7.0% | 17.8% | 51.8% | 21.9% | ||
| It is other people’s responsibility, not mine… | 221 | 365 | 193 | 98 | 27 | |
| 24.4% | 40.4% | 21.3% | 10.8% | 3.0% | ||
| It is industry’s responsibility… | 60 | 199 | 275 | 242 | 128 | |
| 6.6% | 22.0% | 30.4% | 26.8% | 14.2% | ||
| It is the government’s responsibility… | 59 | 186 | 301 | 247 | 111 | |
| 6.5% | 20.6% | 33.3% | 27.3% | 12.3% | ||
| People’s travel behavior can help tackle climate change impacts | 5 | 23 | 81 | 538 | 257 | |
| 0.6% | 2.5% | 9.0% | 59.5% | 28.4% | ||
| Social norms (SNs) | It is important to adapt our travel habits to contribute to tackling climate change | 3 | 29 | 99 | 546 | 227 |
| 0.3% | 3.2% | 11.0% | 60.4% | 25.1% | ||
| For the benefit of the environment, we all need to reduce car use | 9 | 26 | 129 | 520 | 220 | |
| 1.0% | 2.9% | 14.3% | 57.5% | 24.3% | ||
| People should be able to use car as much as they want, even if it is harmful for the environment | 139 | 441 | 236 | 71 | 17 | |
| 15.4% | 48.8% | 26.1% | 7.9% | 1.9% | ||
| There is no point in reducing car usage for the benefit of the environment unless everyone else does the same | 149 | 373 | 198 | 145 | 39 | |
| 16.5% | 41.3% | 21.9% | 16.0% | 4.3% | ||
| People who use environmentally friendly vehicles should pay less tax | 55 | 148 | 252 | 329 | 120 | |
| 6.1% | 16.4% | 27.9% | 36.4% | 13.3% | ||
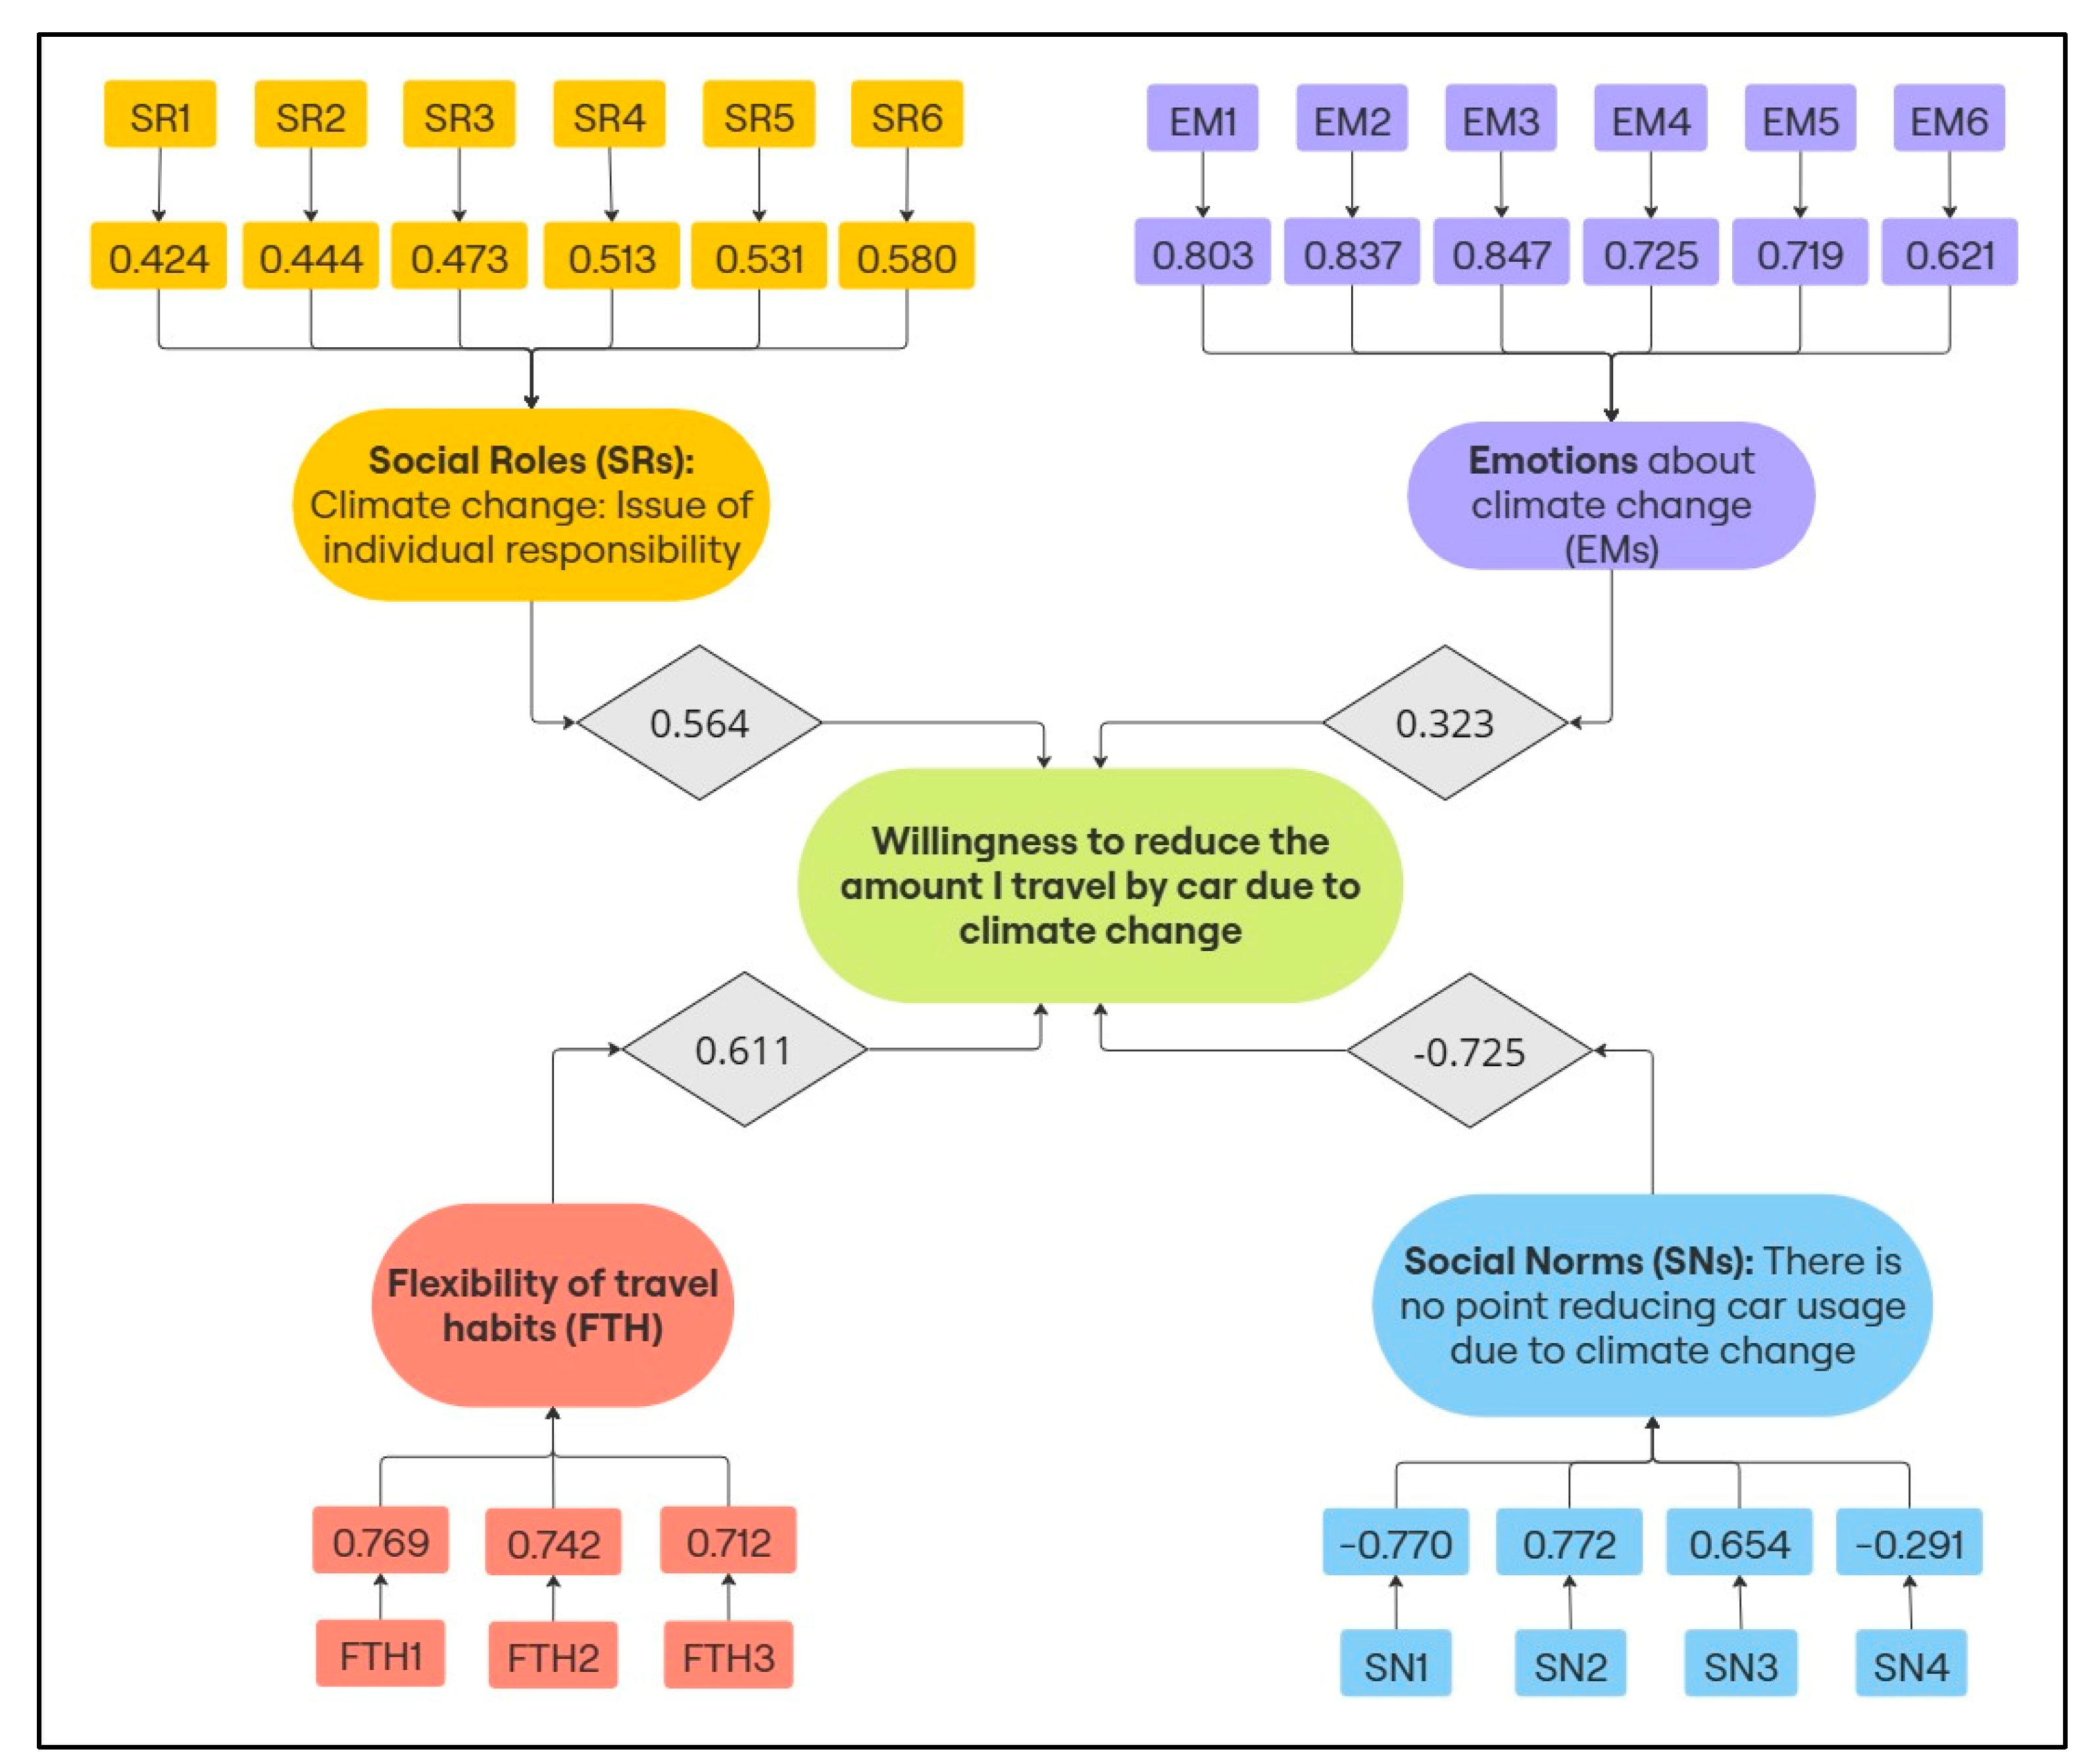
| Theoretical Component | Construct | Items | Factor Loadings |
|---|---|---|---|
| Emotions (EMs) | Emotions about climate change {KMO: 0.861, CR: 0.892} | Climate change makes me feel sad. (EM1) | 0.803 |
| Climate change scares me. (EM2) | 0.837 | ||
| Climate change makes me feel anxious. (EM3) | 0.847 | ||
| Climate change makes me feel angry. (EM4) | 0.725 | ||
| Climate change makes me feel weak. (EM5) | 0.719 | ||
| Climate change makes me feel guilty. (EM6) | 0.621 | ||
| Social roles: Whether climate change is an issue of individual responsibility (SRs) | Climate change: Issue of individual responsibility {KMO: 0.711, CR: 0.661} | It is my individual responsibility to change the way I travel and live to help tackle climate change. (SR1) | 0.424 |
| It is other people’s responsibility, not mine, to help tackle climate change. (SR2) | 0.444 | ||
| It is industry’s responsibility, not mine, to help tackle climate change impacts. (SR3) | 0.473 | ||
| It is the government’s responsibility, not mine, to help tackle climate change impacts. (SR4) | 0.513 | ||
| People’s travel behavior can help tackle climate change impacts. (SR5) | 0.531 | ||
| It is important to adapt our travel habits to contribute to tackling climate change. (SR6) | 0.580 | ||
| Climate change: Not an issue of individual responsibility {KMO: 0.711, CR: 0.696} | It is my individual responsibility to change the way I travel and live to help tackle climate change. (SR1) | −0.695 | |
| It is other people’s responsibility, not mine, to help tackle climate change. (SR2) | 0.599 | ||
| It is industry’s responsibility, not mine, to help tackle climate change impacts. (SR3) | 0.788 | ||
| It is the government’s responsibility, not mine, to help tackle climate change impacts. (SR4) | 0.744 | ||
| People’s travel behavior can help tackle climate change impacts. (SR5) | −0.641 | ||
| It is important to adapt our travel habits to contribute to tackling climate change. (SR6) | −0.663 | ||
| Social norms: Car use reduction due to climate change (SNs) | There is no point in reducing the amount I travel by car due to climate change {KMO:0.621, CR:0.729} | For the benefit of the environment, we all need to reduce how much we use our cars. (SN1) | −0.770 |
| People should be able to use their car as much as they want, even if it is harmful for the environment. (SN2) | 0.772 | ||
| There is no point in reducing the use of my car for the benefit of the environment unless everyone else does the same. (SN3) | 0.654 | ||
| People who use environmentally friendly vehicles should pay less tax on the vehicle. (SN4) | −0.291 | ||
| Travel habits: Context (FTH) | Flexibility of travel habits {KMO: 0.631, CR: 0.785} | Many of the journeys of less than 3 km (two miles) that I now make by car I could just as easily go on foot. (FTH1) | 0.769 |
| Many of the journeys of less than 3 km (two miles) that I now make by car I could just as easily go by bus. (FTH2) | 0.742 | ||
| Many of the journeys of less than 3 km (two miles) that I now make by car I could just as easily go by e-scooter. (FTH3) | 0.712 |
| Estimate | Std. Error | p-Value | ||
|---|---|---|---|---|
| Thresholds | (cc_willing = 0) | −5.080 | 0.450 | <0.001 |
| (cc_willing = 1) | −3.016 | 0.391 | <0.001 | |
| (cc_willing = 2) | −0.868 | 0.374 | 0.020 | |
| (cc_willing = 3) | 2.347 | 0.380 | <0.001 | |
| Variables | Emotions about climate change | 0.323 | 0.081 | <0.001 |
| Social roles: Climate change is an issue of individual responsibility | 0.564 | 0.083 | <0.001 | |
| Social norms: There is no point in reducing car use due to climate change | −0.725 | 0.082 | <0.001 | |
| Flexibility of travel habits | 0.611 | 0.075 | <0.001 | |
| Gender (1 if female, 69.4%; 0 otherwise) | 0.297 | 0.155 | 0.055 | |
| Concerns about air quality (1 if the respondent is concerned about the local air quality, 39.1%; 0 otherwise) | 0.279 | 0.148 | 0.059 | |
| Frequent travel for work (1 if the respondent travels for work more than once or twice in a week, 37.5%; 0 otherwise) | 0.331 | 0.146 | 0.023 | |
| Full-time job (1 if the respondent is engaged in full-time employment, 3.8%; 0 otherwise) | −0.672 | 0.354 | 0.058 | |
| Frequent travel with an environmentally friendly means of transport (1 if the respondent travels by car or taxi more than once or twice in a week, 49.8%; 0 otherwise) | 0.361 | 0.142 | 0.011 | |
| MODEL FIT STATISTICS | ||||
| McFadden pseudo ρ2 | 0.204 | |||
| −2 log likelihood for intercept only | 2237.34 | |||
| −2 log likelihood final | 1781.692 | |||
| Estimate | Std. Error | p-Value | ||
|---|---|---|---|---|
| Thresholds | (cc_carreduced = 0) | −2.962 | 0.274 | <0.001 |
| (cc_carreduced = 1) | −0.850 | 0.237 | <0.001 | |
| (cc_carreduced = 2) | 0.797 | 0.236 | <0.001 | |
| (cc_carreduced = 3) | 2.875 | 0.260 | <0.001 | |
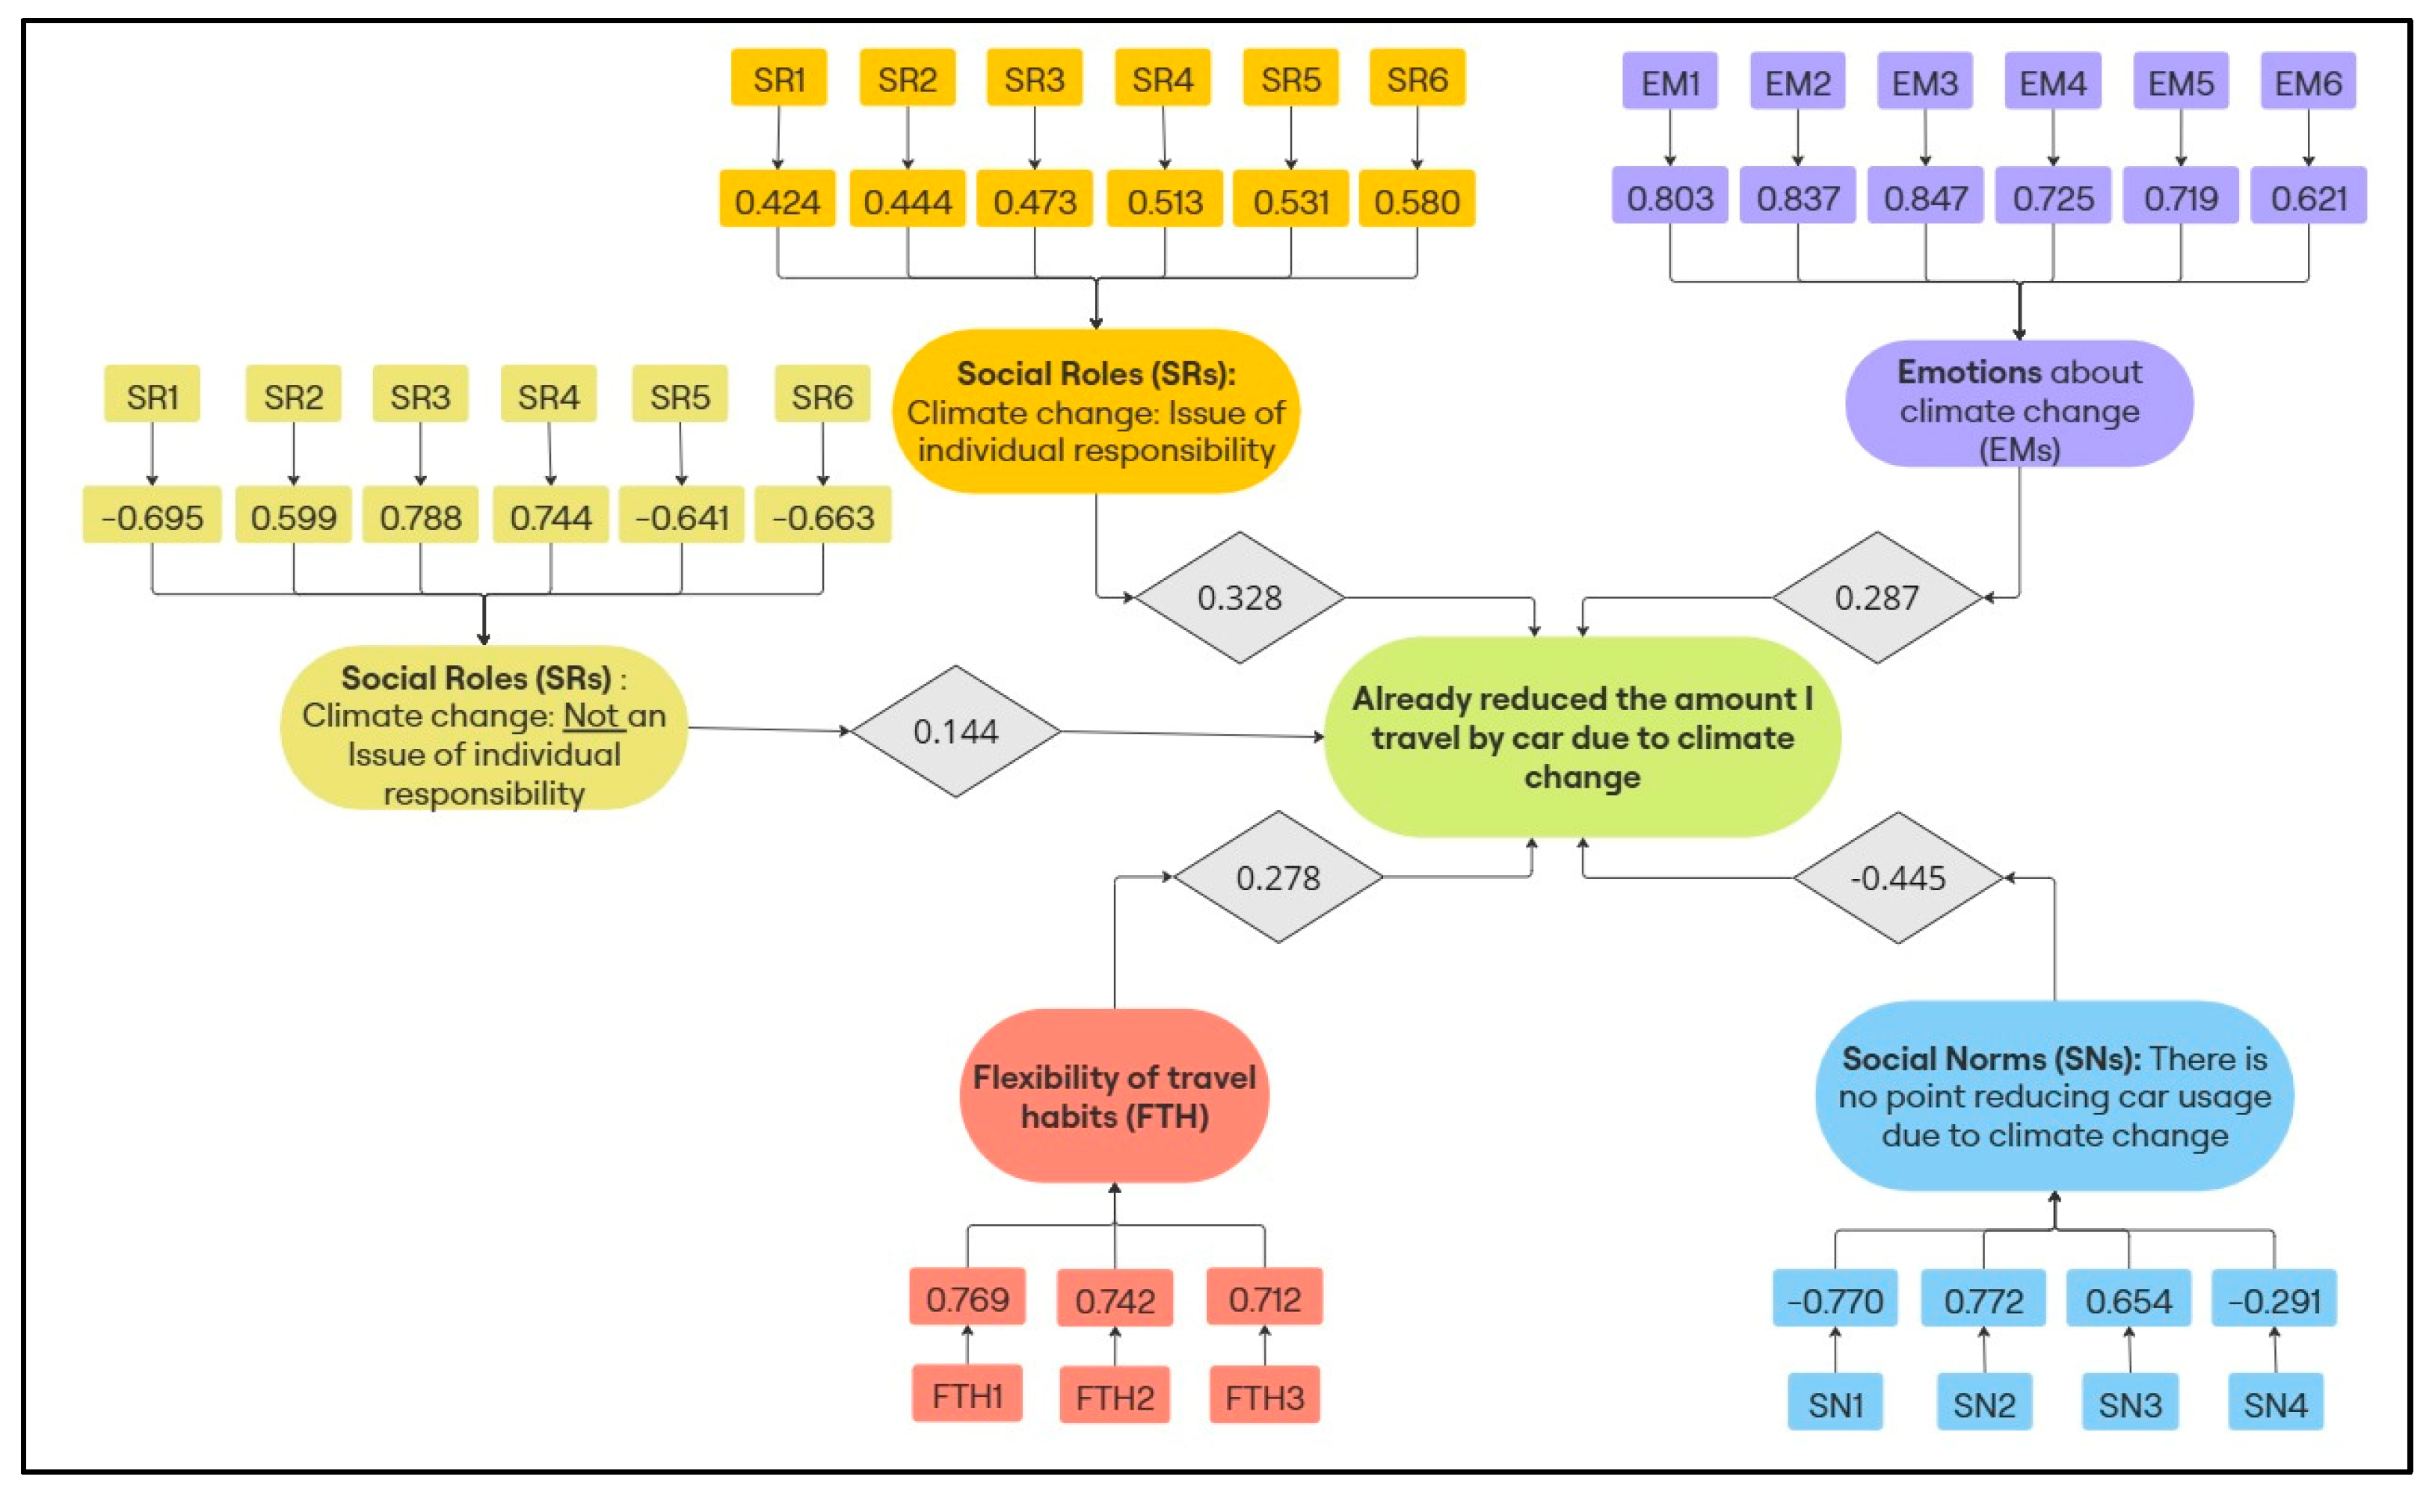
| Variables | Emotions about climate change | 0.287 | 0.079 | <0.001 |
| Social roles: Climate change is not an issue of individual responsibility | 0.144 | 0.071 | 0.043 | |
| Social roles: Climate change is an issue of individual responsibility | 0.328 | 0.084 | <0.001 | |
| Social norms: There is no point in reducing car use due to climate change | −0.445 | 0.086 | <0.001 | |
| Flexibility of travel habits | 0.278 | 0.073 | <0.001 | |
| Concerns about air quality (1 if the respondent is concerned about the local air quality, 39.4%; 0 otherwise) | 0.440 | 0.153 | 0.004 | |
| High household income (1 if the respondent has a household income of more than EUR 30,000, 15.8%; 0 otherwise) | −0.459 | 0.191 | 0.017 | |
| Graduates of higher education (1 if the respondent is a tertiary education graduate, 32.1%; 0 otherwise) | −0.271 | 0.150 | 0.071 | |
| MODEL FIT STATISTICS | ||||
| McFadden pseudo ρ2 | 0.098 | |||
| −2 log likelihood for intercept only | 2060.945 | |||
| −2 log likelihood final | 1858.866 | |||
| Theoretical Frame | Construct | Items | Factor Loadings |
|---|---|---|---|
| Travel habits (FTH) | Flexibility of travel habits {KMO = 0.702, CR = 0.897} | Many of the journeys of less than 3 km (2 miles) that I now make by car I could just as easily walk (FTH1) | 0.895 |
| … go by bus. (FTH2) | 0.830 | ||
| … go by e-scooter. (FTH3) | 0.860 | ||
| Social norms (SNs): Car use reduction due to climate change | Everyone needs to change their travel habits due to climate change {KMO = 0.642, CR = 0.737} | For the benefit of the environment, we all need to reduce how much we use our cars. (SN1) | 0.753 |
| People should be able to use their car as much as they want, even if it is harmful for the environment. (SN2) | −0.707 | ||
| There is no point in reducing the use of my car for the benefit of the environment unless everyone else does the same. (SN3) | −0.553 | ||
| People who use environmentally friendly vehicles should pay less tax on the vehicle. (SN4) | 0.542 |
| Estimate | Std. Error | p-Value | ||
|---|---|---|---|---|
| Thresholds | (ccacar = 0) | −2.253 | 0.169 | <0.001 |
| (ccacar = 1) | −1.314 | 0.148 | <0.001 | |
| (ccacar = 2) | −0.499 | 0.139 | <0.001 | |
| (ccacar = 3) | 1.078 | 0.151 | <0.001 | |
| Variables | Flexibility of travel habits | 0.155 | 0.065 | 0.016 |
| Social norms: Everyone needs to change travel habits due to climate change | 0.465 | 0.065 | <0.001 | |
| Frequent travel with an environmentally friendly means of transport to work (1 if the respondent travels with environmentally friendly means like buses, bicycles, on foot, e-scooters, the metro, etc., 26.1%; 0 otherwise) | 0.729 | 0.137 | <0.001 | |
| Socio-economic classification (1 if the respondent is a Manual/Service worker, 45.5%; 0 otherwise) | 0.206 | 0.116 | 0.075 | |
| MODEL FIT STATISTICS | ||||
| McFadden pseudo ρ2 | 0.108 | |||
| −2 log likelihood for intercept only | 1017.160 | |||
| −2 log likelihood final | 905.779 | |||
Disclaimer/Publisher’s Note: The statements, opinions and data contained in all publications are solely those of the individual author(s) and contributor(s) and not of MDPI and/or the editor(s). MDPI and/or the editor(s) disclaim responsibility for any injury to people or property resulting from any ideas, methods, instructions or products referred to in the content. |
© 2025 by the authors. Licensee MDPI, Basel, Switzerland. This article is an open access article distributed under the terms and conditions of the Creative Commons Attribution (CC BY) license (https://creativecommons.org/licenses/by/4.0/).
Share and Cite
Demiris, A.; Fountas, G.; Fonzone, A.; Basbas, S. Generation Z’s Travel Behavior and Climate Change: A Comparative Study for Greece and the UK. Big Data Cogn. Comput. 2025, 9, 70. https://doi.org/10.3390/bdcc9030070
Demiris A, Fountas G, Fonzone A, Basbas S. Generation Z’s Travel Behavior and Climate Change: A Comparative Study for Greece and the UK. Big Data and Cognitive Computing. 2025; 9(3):70. https://doi.org/10.3390/bdcc9030070
Chicago/Turabian StyleDemiris, Athanasios, Grigorios Fountas, Achille Fonzone, and Socrates Basbas. 2025. "Generation Z’s Travel Behavior and Climate Change: A Comparative Study for Greece and the UK" Big Data and Cognitive Computing 9, no. 3: 70. https://doi.org/10.3390/bdcc9030070
APA StyleDemiris, A., Fountas, G., Fonzone, A., & Basbas, S. (2025). Generation Z’s Travel Behavior and Climate Change: A Comparative Study for Greece and the UK. Big Data and Cognitive Computing, 9(3), 70. https://doi.org/10.3390/bdcc9030070