Scalable Predictive Modeling for Hospitalization Prioritization: A Hybrid Batch–Streaming Approach
Abstract
1. Introduction
1.1. Related Work
1.2. Positioning of Our Approach
2. Materials and Methods
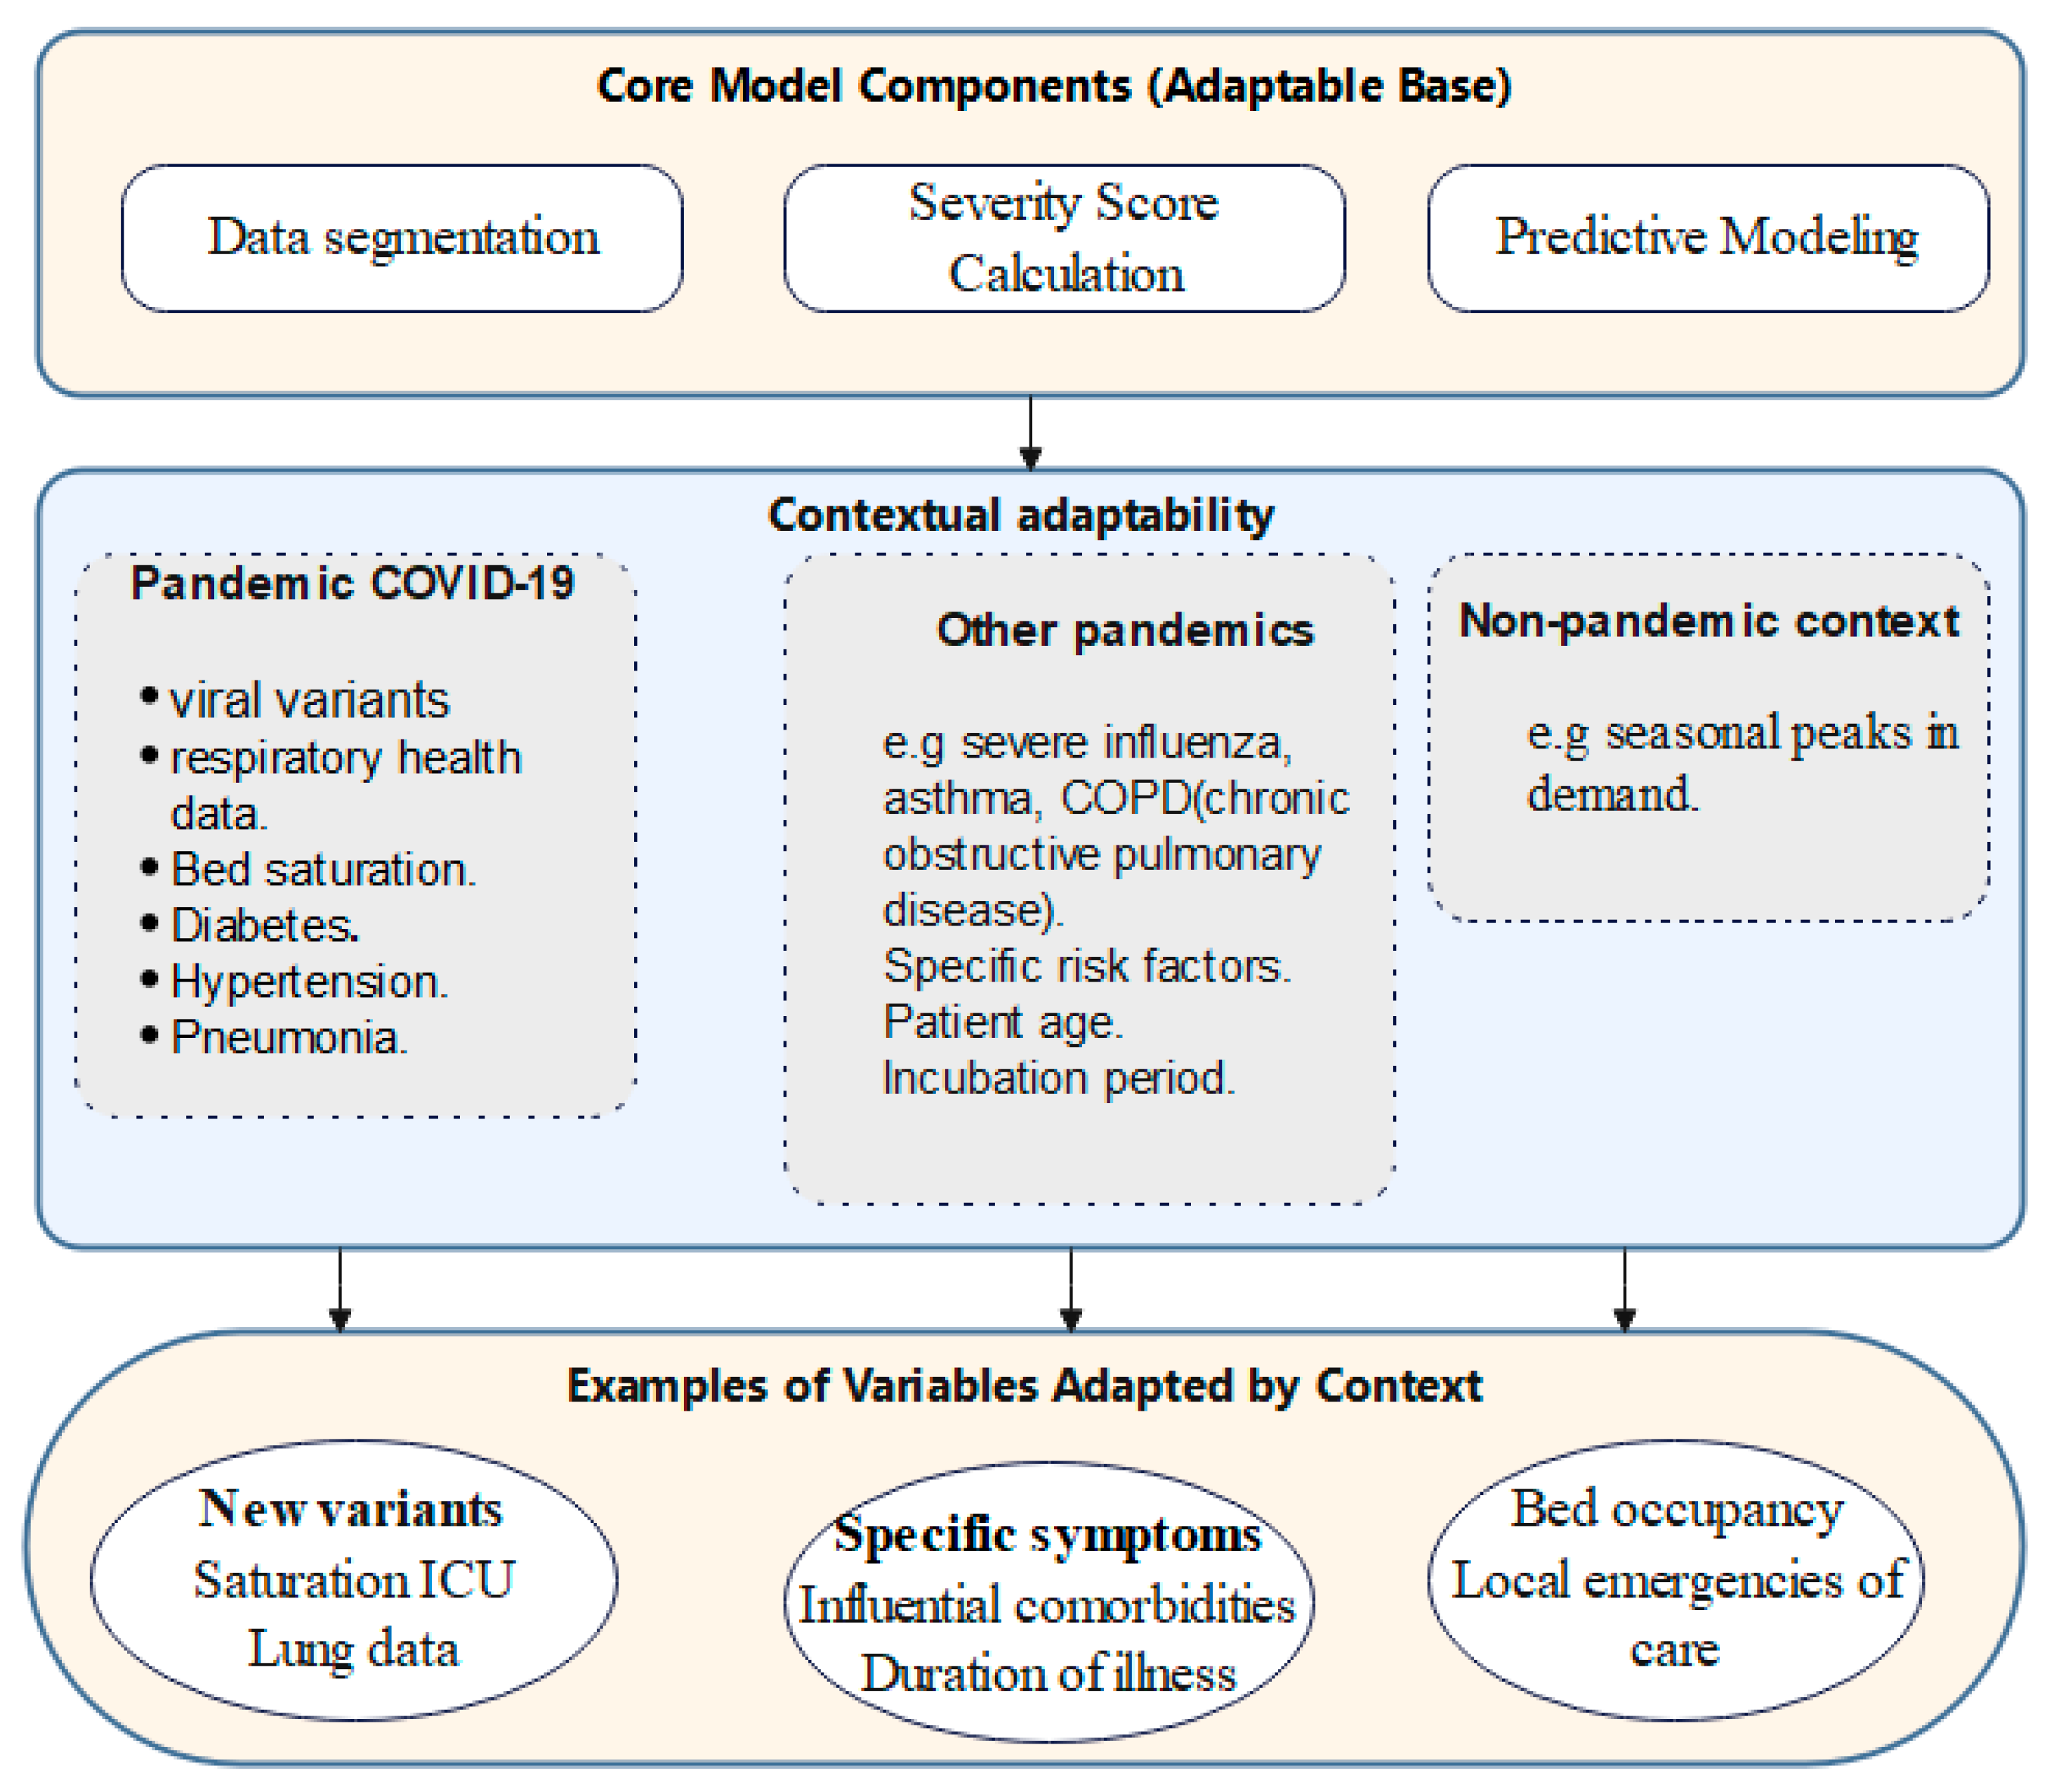
2.1. Global Algorithmic Approach for Predicting Infection Severity and Hospitalization Needs During Pandemics
- Data Preprocessing (D_clean): The initial preprocessing of the patient dataset (D) to remove inaccuracies and achieve uniformity for further analysis.
- Data Segmentation (D_death, D_live): The dataset is split into two subsets, one for patients who died due to the disease and the other for survivors (D_death and D_live), enabling focused analyses.
- Feature Selection (F_selected): Identification and selection of the most critical Features (F) out of Features extracted from D_death based on their significances and effects on patient outcomes.
- Severity Score Calculation: For every patient in the deceased subgroup, a severity score (Si) is computed by applying weights (W) to the selected features (F_selected), showing the compounded effect of different clinical indicators.
- Severity Score Categorization: The calculated severity scores are then classified into distinguishable severity levels (Ci), thus creating a structured system for risk assessment of the patients.
- Data Enrichment (D_enriched): Integration of the severity scores and categories back into the dataset, adding valuable insights for predictive modeling.
- Predictive Modeling: Creating a predictive model using D_enriched expanded cohort as the base, intended for predicting severity classes for the deceased patients.
- Predicting for Living Patients: Applying the predictive model to the subset of live patients (D_live), identifying their category of severity and the need for hospitalization.
| Algorithm 1: Assess Infection Severity and Prioritize Hospitalization |
| Inputs: D: Dataset of patient data F: Set of selected features W: Weights associated with features F Outputs: C: Severity categories for each patient Begin 1. D_clean ← PreprocessData(D) 2. (D_death, D_live) ← SegmentData(D_clean) 3. F_selected ← SelectFeatures(D_death, F) 4. For each patient di in D_death do 4.1. Si ← CalculateSeverityScore(di, F_selected, W) End for 5. For each score Si do 5.1. Ci ← CategorizeSeverityScore(Si) End for 6. D_enriched ← EnrichData(D_death, S, C) 7. Model ← TrainPredictiveModel(D_enriched) 8. For each patient dj in D_live do 8.1. Cj ← PredictSeverityCategory(dj, Model) End for 9. Return C End |
2.2. Detailed Methodology
- Dataset Description
- 2.
- Data Preprocessing
- 3.
- Dataset Segmentation
- 4.
- Feature Selection
- 5.
- Severity Score Calculation
- For the risk difference, we simply compared how often each comorbidity appeared among deceased patients versus those who survived, and then took the absolute gap between the two proportions. Here, ‘risk difference’ refers to the difference in prevalence of a feature between deceased and survivor groups. For example, if diabetes was present in 20% of deceased patients and 10% of survivors, the count difference equals 0.10.
- Correlation Adjustment: Each risk difference was adjusted by multiplying it with the associated correlation coefficient.
- In this formula, Δi shows how much a feature differs in prevalence between patients who died and those who survived, and ri is its correlation value. We then adjusted the weights so they stay roughly between −1 and +1, making the variables easier to compare. This basic scaling also helps prevent any single factor from dominating the score and keeps the process simple to repeat with other data.
- ⱳi represents the adjusted weight assigned to feature i, which is derived from its count difference and correlation coefficient. In some cases, such as AGE, the adjusted weight appeared negative in Table 4. This reflects the specific distribution in our dataset, where younger hospitalized patients and older survivors influenced the direction of the adjustment. More broadly, a negative weight should not be interpreted as a sign of protection. It simply means that the corresponding feature appears less frequently among fatal cases than among survivors. The direction of each weight is determined entirely by the data itself, reflecting the observed distributions in both cohorts rather than any predefined notion of risk or protection.
- ƒi shows the standardized value for every variable. Binary ones were set as 0 or 1, and continuous features like age were standardized with z-scores so they stay on a similar range. The sign of each factor came straight from what was observed in the data how often it appeared in deceased compared with surviving patient, not from any manual choice about risk or protection.
- 6.
- Severity Score Categorization
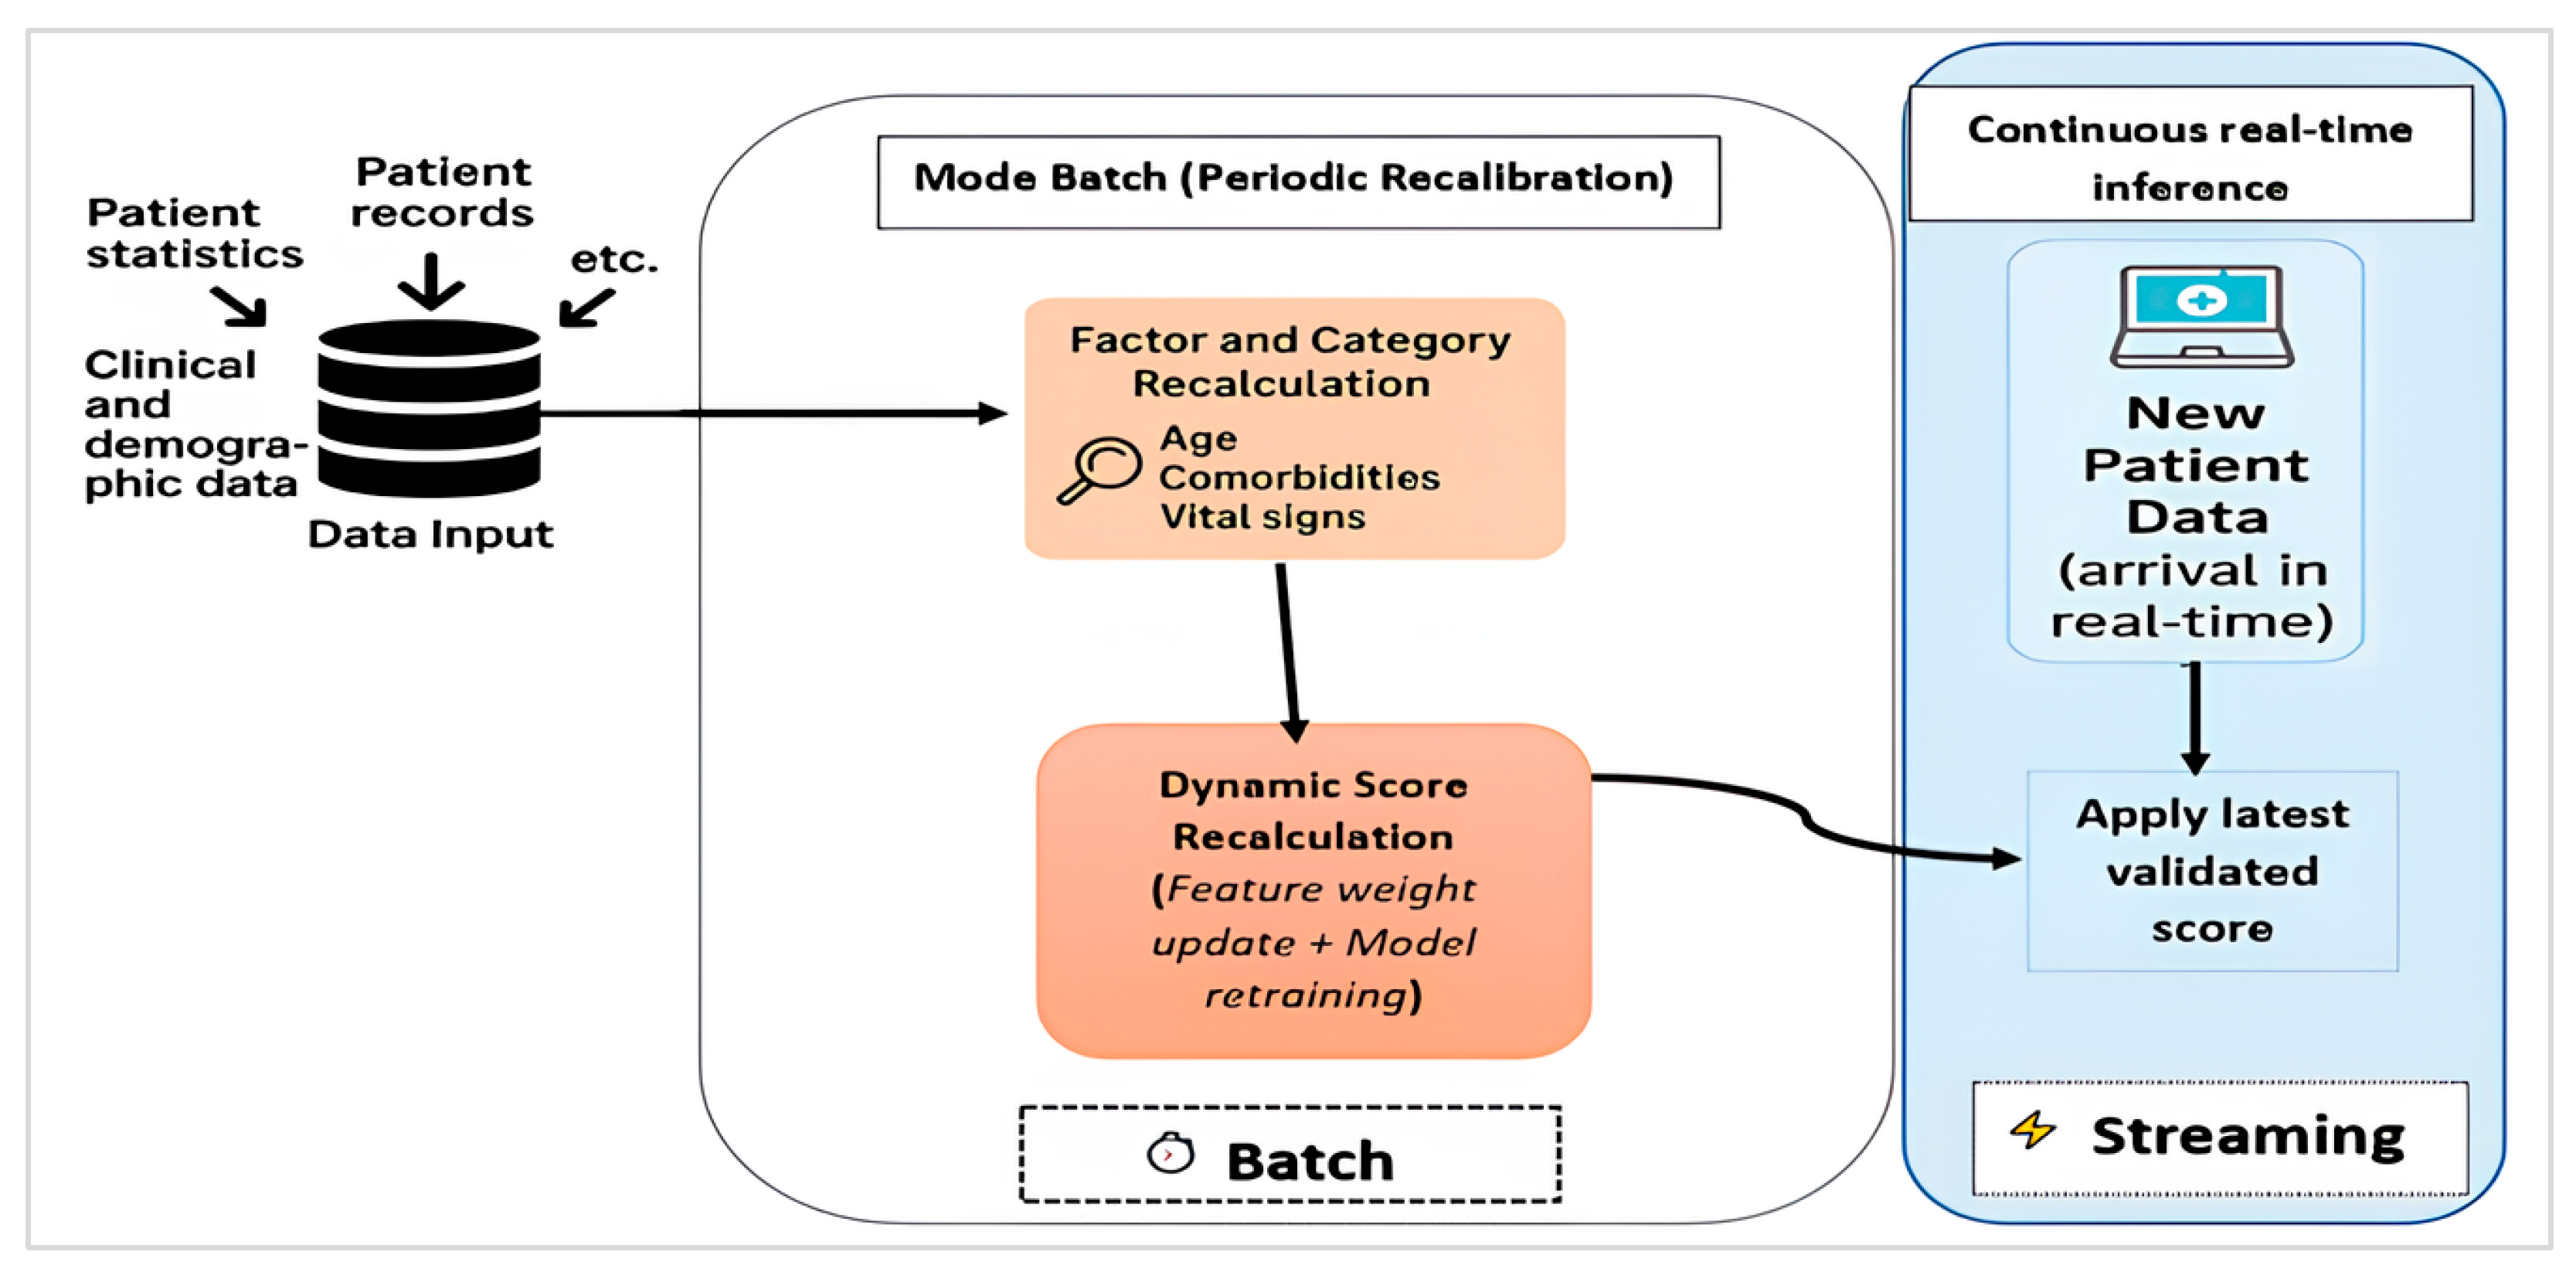
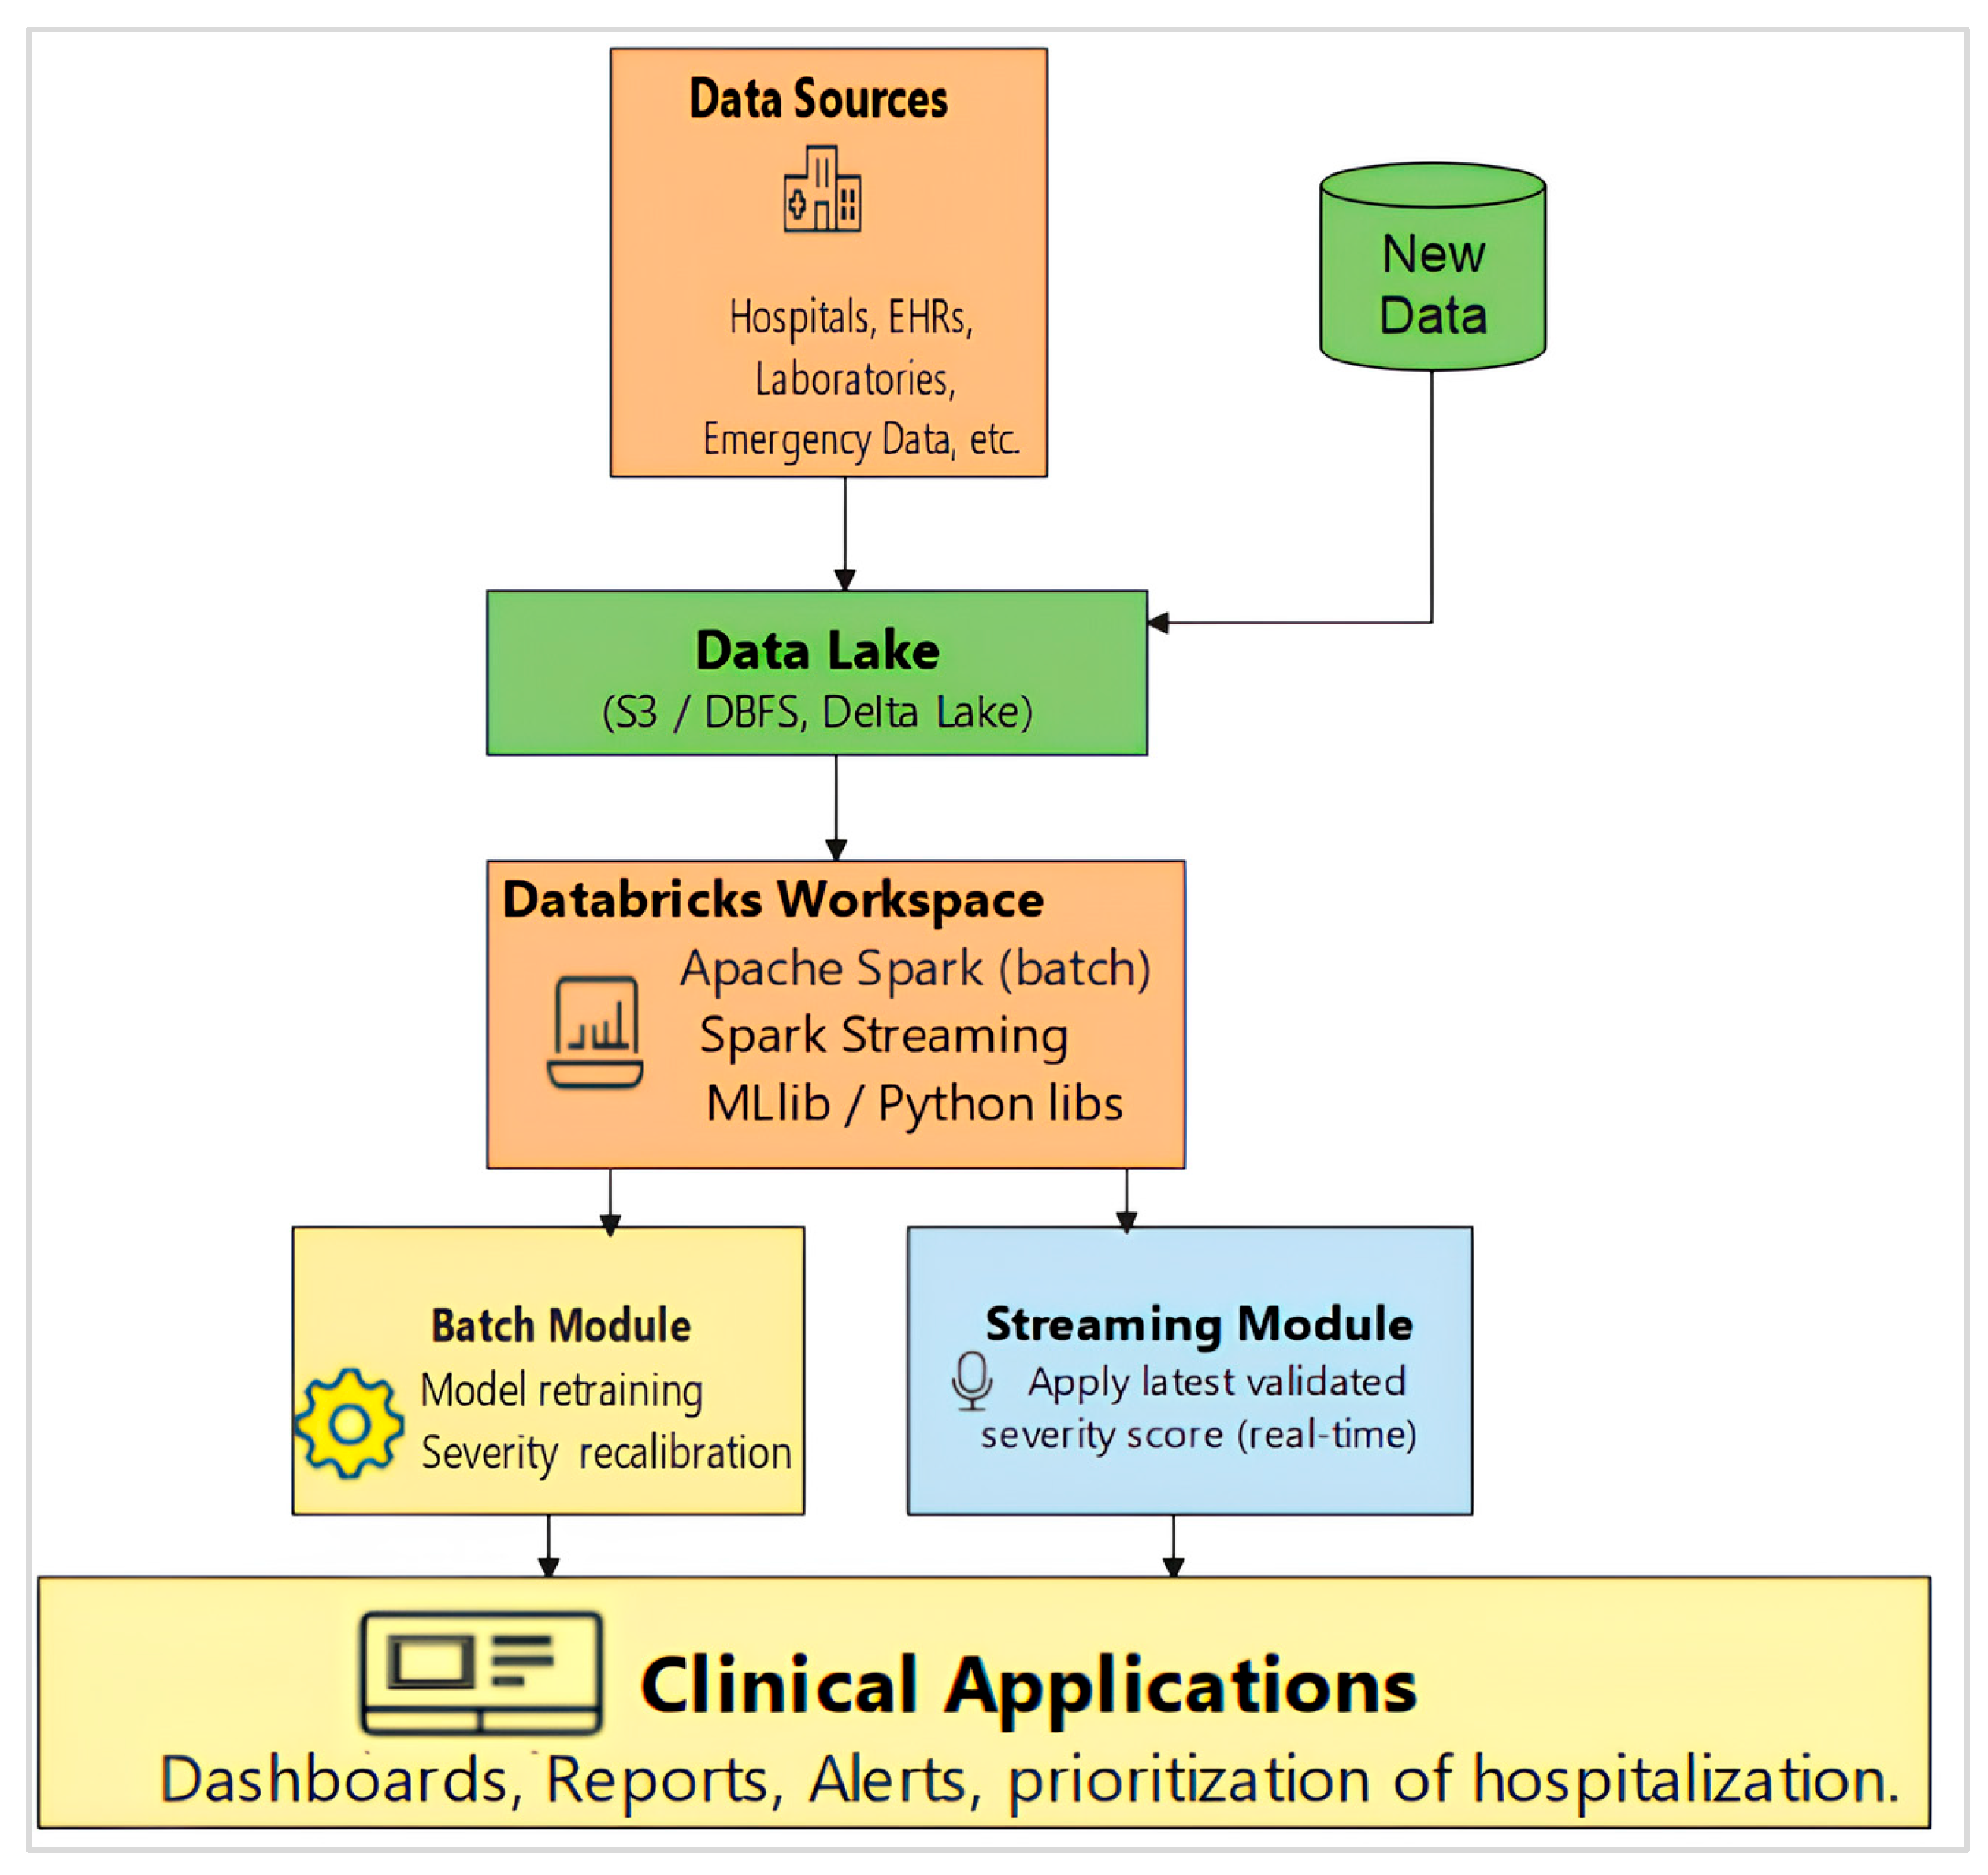
2.2.1. Hybrid Batch–Streaming Pipeline for Severity Scoring and Prioritization
- 7.
- Data Enrichment
- 8.
- Predictive Score Modeling
- ▪
- Death Dataset: This group included data from patients who had passed away. We used it mainly to train our prediction models, with 80% of the data set aside for training and 20% for testing. This split was essential for building models that could accurately predict severity scores.
- ▪
- Live Dataset: This group contained data from patients who survived. It was mainly used to test how well our models performed. Like the Death dataset, it was divided into −75% for training and 25% for testing. This setup helped us check how well the model could group patients by hospitalization needs, one of our main goals.
- 9.
- Model Selection and Evaluation
- ✓
- Interpretability, to provide clinical insights;
- ✓
- Predictive accuracy, to ensure reliable severity scoring;
- ✓
- Computational efficiency, to make sure models could be used in busy healthcare settings.
2.2.2. Model Evaluation Metrics
- 10.
- Model Parameters for Reproducibility
3. Implementation Environment
4. Results
4.1. Age Category Analysis
4.2. Age Distribution and Hospitalization Patterns
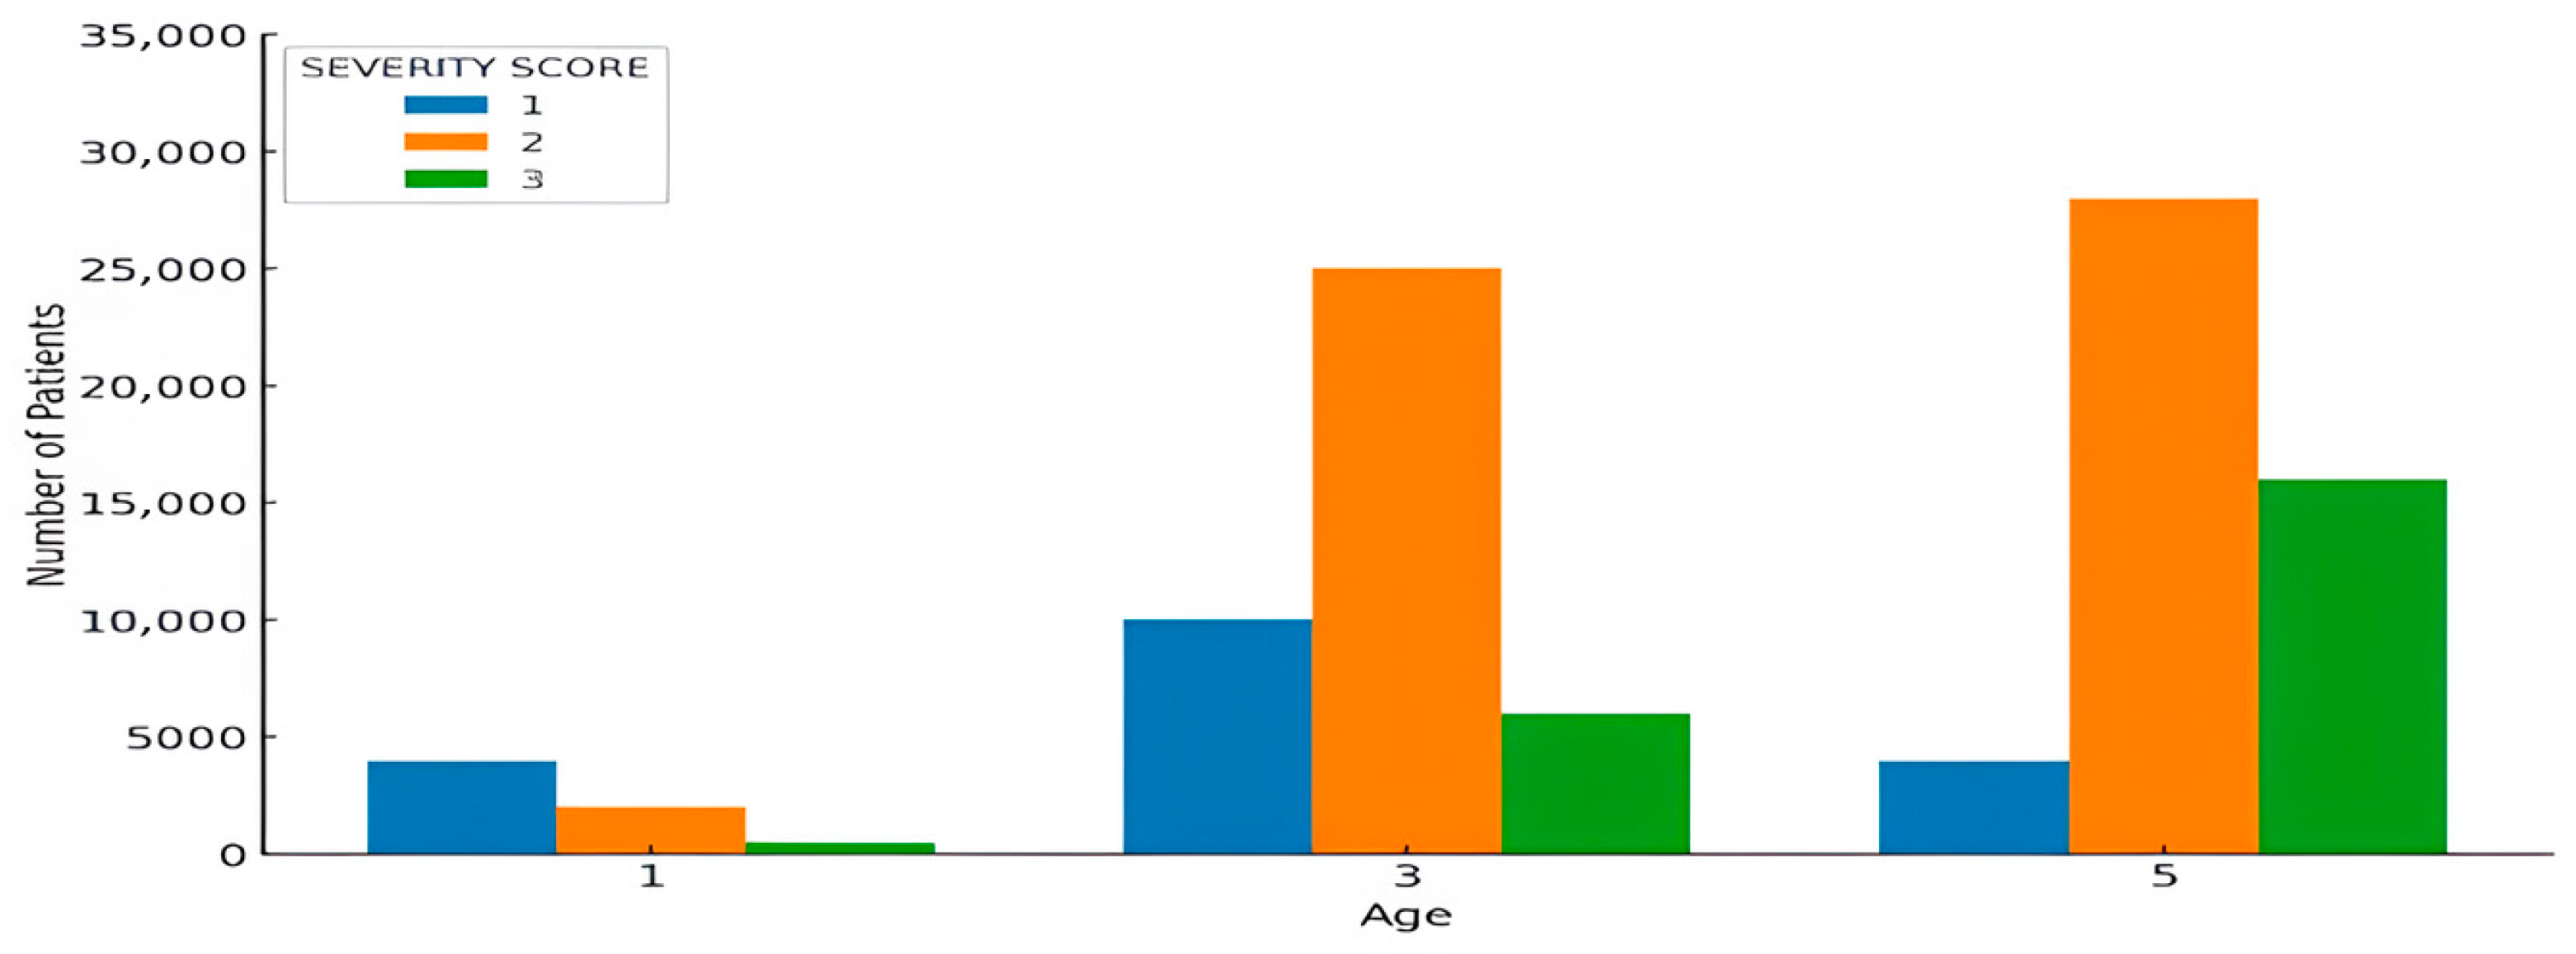
4.3. Analysis of Severity Scores by Age Category
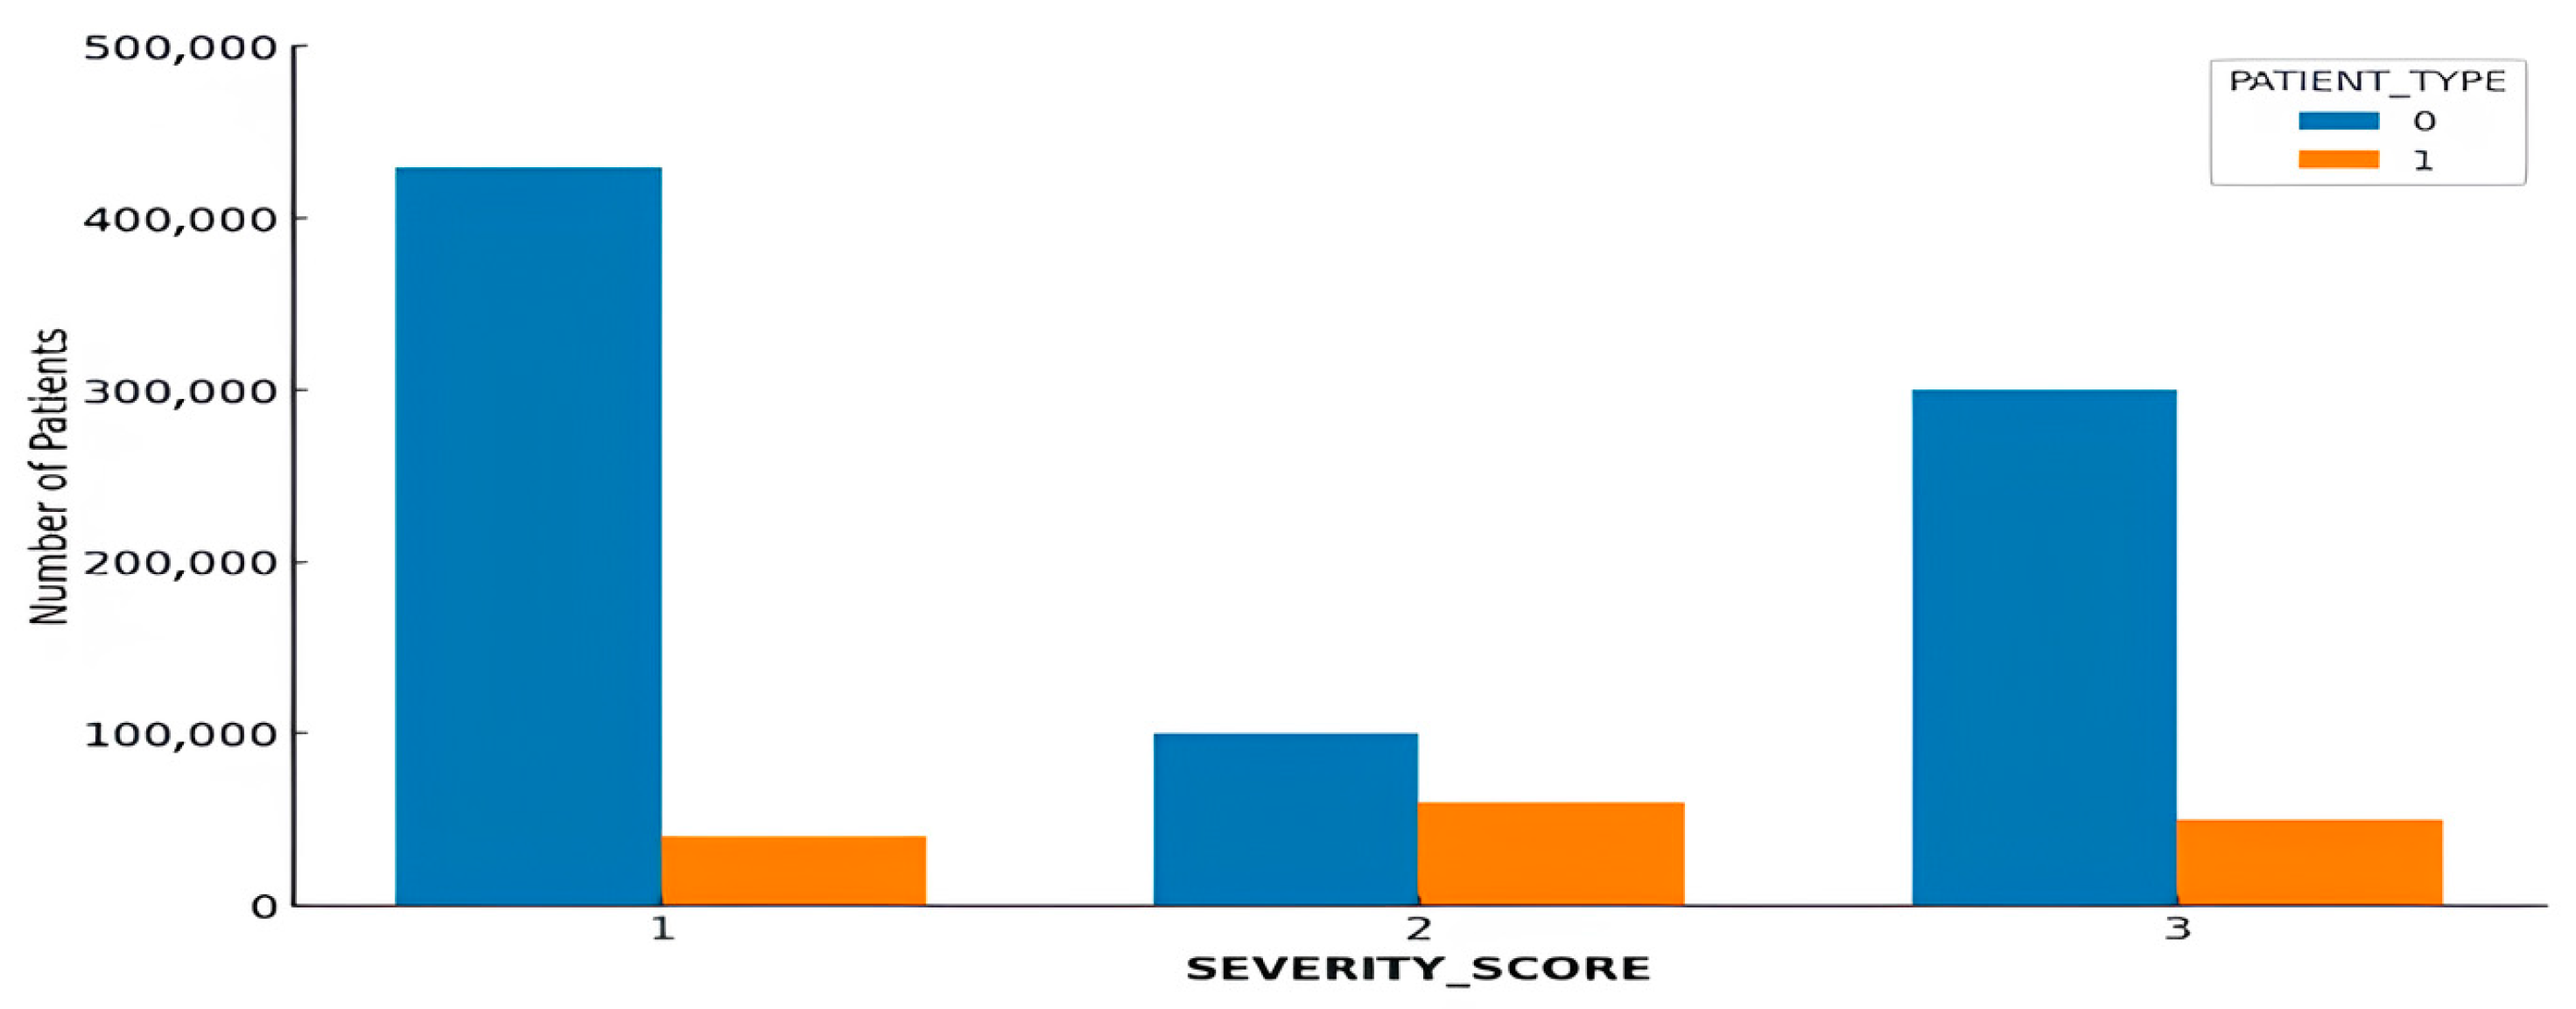
4.4. Severity Score Categorization
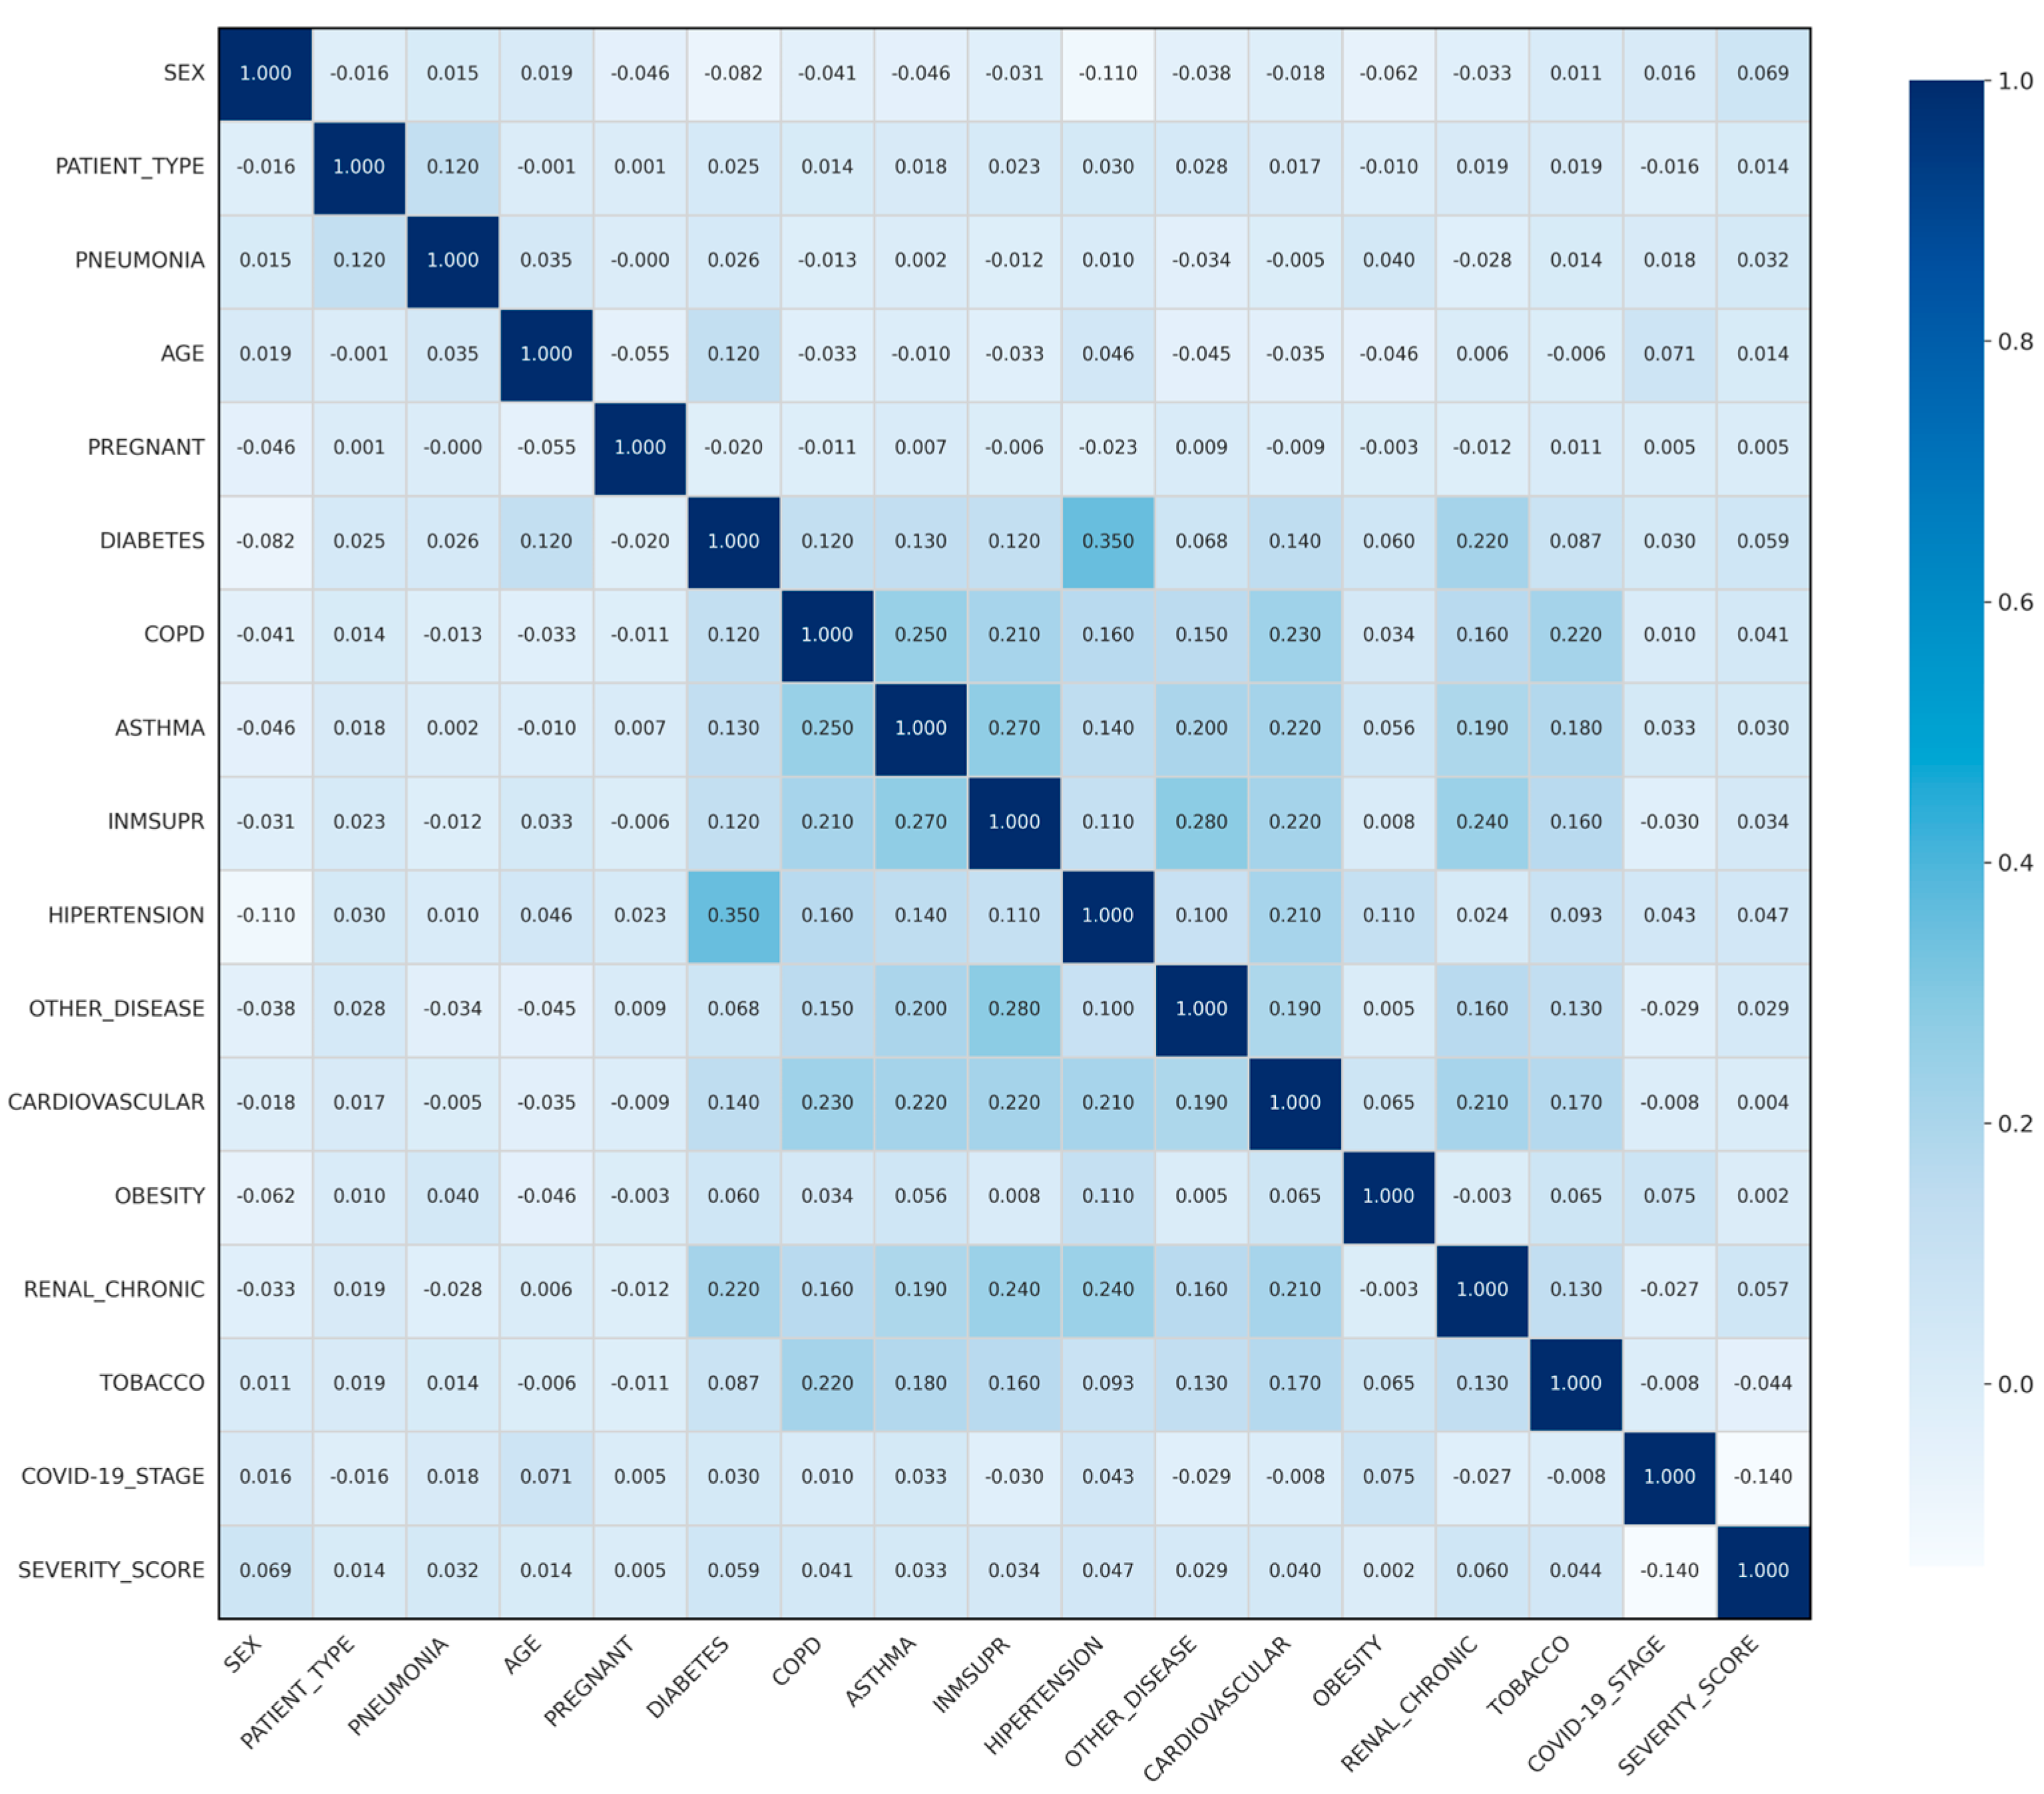
4.5. Correlation Analysis
4.6. Comparative Analysis of Algorithm Performance
4.6.1. Death Dataset:
4.6.2. Test 2 Live Dataset:
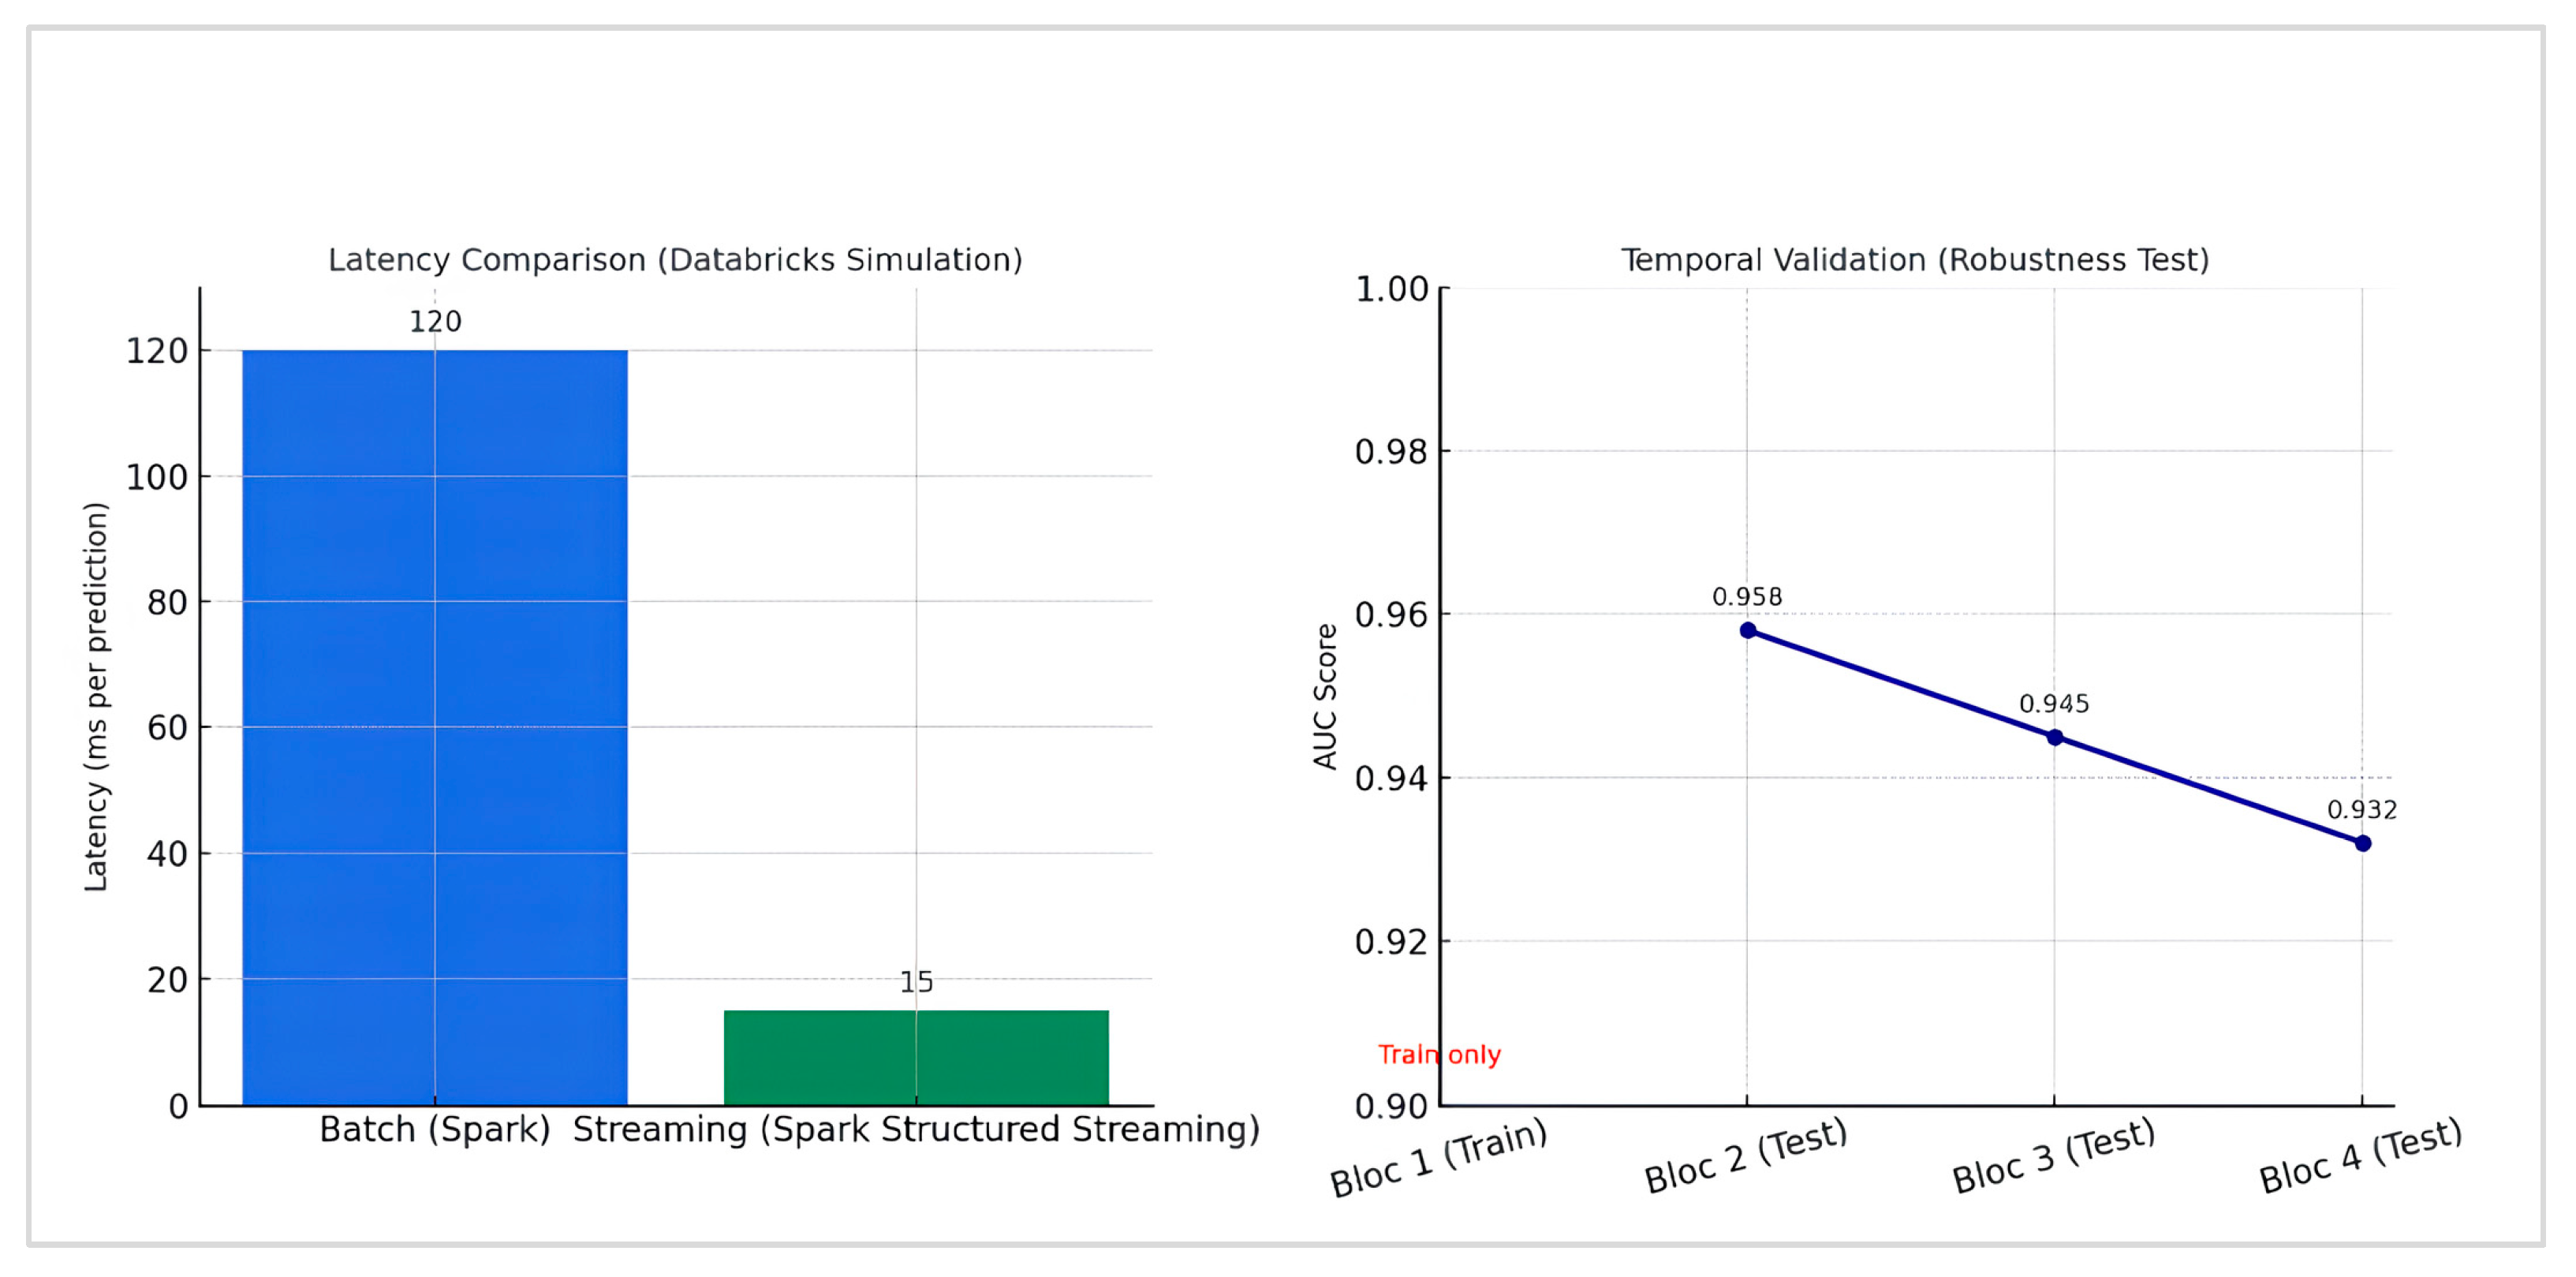
4.7. Robustness and Real-Time Performance Evaluation
5. Discussion
Limitations
6. Conclusions
Author Contributions
Funding
Institutional Review Board Statement
Informed Consent Statement
Data Availability Statement
Conflicts of Interest
References
- Filip, R.; Gheorghita Puscaselu, R.; Anchidin-Norocel, L.; Dimian, M.; Savage, W.K. Global Challenges to Public Health Care Systems during the COVID-19 Pandemic: A Review of Pandemic Measures and Problems. J. Pers. Med. 2022, 12, 1295. [Google Scholar] [CrossRef]
- Ndayishimiye, C.; Sowada, C.; Dyjach, P.; Stasiak, A.; Middleton, J.; Lopes, H.; Dubas-Jakóbczyk, K. Associations between the COVID-19 Pandemic and Hospital Infrastructure Adaptation and Planning—A Scoping Review. Int. J. Environ. Res. Public Health 2022, 19, 8195. [Google Scholar] [CrossRef]
- Pearce, S.; Marchand, T.; Shannon, T.; Ganshorn, H.; Lang, E. Emergency Department Crowding: An Overview of Reviews Describing Measures, Causes, and Harms. Intern. Emerg. Med. 2023, 18, 1137–1158. [Google Scholar] [CrossRef]
- Jovanović, A.; Klimek, P.; Renn, O.; Schneider, R.; Øien, K.; Brown, J.; DiGennaro, M.; Liu, Y.; Pfau, V.; Jelić, M.; et al. Assessing Resilience of Healthcare Infrastructure Exposed to COVID-19: Emerging Risks, Resilience Indicators, Interdependencies and International Standards. Environ. Syst. Decis. 2020, 40, 252–286. [Google Scholar] [CrossRef]
- Negro-Calduch, E.; Azzopardi-Muscat, N.; Nitzan, D.; Pebody, R.; Jorgensen, P.; Novillo-Ortiz, D. Health Information Systems in the COVID-19 Pandemic: A Short Survey of Experiences and Lessons Learned from the European Region. Front. Public Health 2021, 9, 676838. [Google Scholar] [CrossRef]
- Zhang, T.; Rabhi, F.; Chen, X.; Paik, H.; MacIntyre, C.R. A Machine Learning-Based Universal Outbreak Risk Prediction Tool. Comput. Biol. Med. 2024, 169, 107876. [Google Scholar] [CrossRef]
- Dziegielewski, C.; Talarico, R.; Imsirovic, H.; Qureshi, D.; Choudhri, Y.; Tanuseputro, P.; Thompson, L.H.; Kyeremanteng, K. Characteristics and Resource Utilization of High-Cost Users in the Intensive Care Unit: A Population-Based Cohort Study. BMC Health Serv. Res. 2021, 21, 1312. [Google Scholar] [CrossRef]
- McCabe, R.; Schmit, N.; Christen, P.; D’Aeth, J.C.; Løchen, A.; Rizmie, D.; Nayagam, S.; Miraldo, M.; Aylin, P.; Bottle, A.; et al. Adapting Hospital Capacity to Meet Changing Demands during the COVID-19 Pandemic. BMC Med. 2020, 18, 329. [Google Scholar] [CrossRef] [PubMed]
- Leung, C.K.; Mai, T.H.D.; Tran, N.D.T.; Zhang, C.Y. Predictive Analytics to Support Health Informatics on COVID-19 Data. In Proceedings of the 2021 IEEE 21st International Conference on Bioinformatics and Bioengineering (BIBE), Kragujevac, Serbia, 25–27 October 2021; pp. 1–9. [Google Scholar] [CrossRef]
- Gerevini, A.E.; Maroldi, R.; Olivato, M.; Putelli, L.; Serina, I. Machine Learning Techniques for Prognosis Estimation and Knowledge Discovery from Lab Test Results with Application to the COVID-19 Emergency. IEEE Access 2023, 11, 83905–83933. [Google Scholar] [CrossRef]
- Laatifi, M.; Douzi, S.; Bouklouz, A.; Ezzine, H.; Jaafari, J.; Zaid, Y.; El Ouahidi, B.; Naciri, M. Machine Learning Approaches in COVID-19 Severity Risk Prediction in Morocco. J. Big Data 2022, 9, 5. [Google Scholar] [CrossRef] [PubMed]
- Miranda, I.; Cardoso, G.; Pahar, M.; Oliveira, G.; Niesler, T. Machine Learning Prediction of Hospitalization due to COVID-19 Based on Self-Reported Symptoms: A Study for Brazil. In Proceedings of the 2021 IEEE EMBS International Conference on Biomedical and Health Informatics (BHI), Athens, Greece, 27–30 July 2021; pp. 1–5. [Google Scholar] [CrossRef]
- Li, Y.; Horowitz, M.A.; Liu, J.; Chew, A.; Lan, H.; Liu, Q.; Sha, D.; Yang, C. Individual-Level Fatality Prediction of COVID-19 Patients Using AI Methods. Front. Public Health 2020, 8, 587937. [Google Scholar] [CrossRef] [PubMed]
- Jain, L.; Gala, K.; Doshi, D. Hospitalization Priority of COVID-19 Patients Using Machine Learning. In Proceedings of the 2021 2nd International Conference on Advances in Computing, Communication, Embedded and Secure Systems (ACCESS), Greater Noida, India, 17–18 September 2021; pp. 150–155. [Google Scholar] [CrossRef]
- Shi, B.; Ye, H.; Zheng, J.; Zhu, Y.; Heidari, A.A.; Zheng, L. Early Recognition and Discrimination of COVID-19 Severity Using Slime Mould Support Vector Machine for Medical Decision-Making. IEEE Access 2021, 9, 121996–122015. [Google Scholar] [CrossRef]
- Darapaneni, N.; Singh, A.; Paduri, A.; Ranjith, A.; Kumar, A.; Dixit, D.; Khan, S. A Machine Learning Approach to Predicting COVID-19 Cases amongst Suspected Cases and Their Category of Admission. In Proceedings of the 2020 IEEE 15th International Conference on Industrial and Information Systems (ICIIS), Rupnagar, India, 26–28 November 2020; pp. 375–380. [Google Scholar] [CrossRef]
- Zheng, Y.; Zhu, Y.; Ji, M.; Wang, R.; Liu, X.; Zhang, M.; Liu, J.; Zhang, X.; Qin, C.H.; Fang, L.; et al. A Learning-Based Model to Evaluate Hospitalization Priority in COVID-19 Pandemics. Patterns 2020, 1, 100092. [Google Scholar] [CrossRef] [PubMed]
- Perez-Aguilar, A.; Ortiz-Barrios, M.; Pancardo, P.; Orrante-Weber-Burque, F. A Hybrid Fuzzy MCDM Approach to Identify the Intervention Priority Level of COVID-19 Patients in the Emergency Department: A Case Study. In Proceedings of the Digital Human Modeling and Applications in Health, Safety, Ergonomics and Risk Management; Duffy, V.G., Ed.; Springer: Cham, Switzerland, 2023; pp. 284–297. [Google Scholar] [CrossRef]
- Kang, J.; Chen, T.; Luo, H.; Luo, Y.; Du, G.; Jiming-Yang, M. Machine Learning Predictive Model for Severe COVID-19. Infect. Genet. Evol. 2021, 90, 104737. [Google Scholar] [CrossRef]
- Eddin, M.S.; Hajj, H.E. An Optimization-Based Framework to Dynamically Schedule Hospital Beds in a Pandemic. Healthcare 2025, 13, 2338. [Google Scholar] [CrossRef] [PubMed]
- Du, H.; Zhao, Y.; Zhao, J.; Xu, S.; Lin, X.; Chen, Y.; Gardner, L.M.; Yang, H.F. Advancing real-time infectious disease forecasting using large language models. Nat. Comput. Sci. 2025, 5, 467–480. [Google Scholar] [CrossRef]
- Ayvaci, M.U.S.; Jacobi, V.S.; Ryu, Y.; Gundreddy, S.P.S.; Tanriover, B. Clinically Guided Adaptive Machine Learning Update Strategies for Predicting Severe COVID-19 Outcomes. Am. J. Med. 2025, 138, 228–235. [Google Scholar] [CrossRef]
- Porto, B.M. Improving triage performance in emergency departments using machine learning and natural language processing: A systematic review. BMC Emerg. Med. 2024, 24, 219. [Google Scholar] [CrossRef]
- Cornilly, D.; Tubex, L.; Van Aelst, S.; Verdonck, T. Robust and Sparse Logistic Regression. Adv. Data Anal. Classif. 2023, 18, 663–679. [Google Scholar] [CrossRef]
- Kotsiantis, S.B. Decision Trees: A Recent Overview. Artif. Intell. Rev. 2013, 39, 261–283. [Google Scholar] [CrossRef]
- More, A.S.; Rana, D.P. Review of Random Forest Classification Techniques to Resolve Data Imbalance. In Proceedings of the 2017 1st International Conference on Intelligent Systems and Information Management (ICISIM), Aurangabad, India, 5–6 October 2017; pp. 72–78. [Google Scholar] [CrossRef]
- Nandi, A.; Ahmed, H. Condition Monitoring with Vibration Signals: Compressive Sampling and Learning Algorithms for Rotating Machine, 1st ed.; Wiley: Hoboken, NJ, USA, 2019. [Google Scholar] [CrossRef]
- Emambocus, B.A.S.; Jasser, M.B.; Amphawan, A. A Survey on the Optimization of Artificial Neural Networks Using Swarm Intelligence Algorithms. IEEE Access 2023, 11, 1280–1294. [Google Scholar] [CrossRef]
- Ontivero-Ortega, M.; Lage-Castellanos, A.; Valente, G.; Goebel, R.; Valdes-Sosa, M. Fast Gaussian Naïve Bayes for Searchlight Classification Analysis. NeuroImage 2017, 163, 471–479. [Google Scholar] [CrossRef] [PubMed]
- Chen, T.; Guestrin, C. XGBoost: A Scalable Tree Boosting System. In Proceedings of the 22nd ACM SIGKDD International Conference on Knowledge Discovery and Data Mining, San Francisco, CA, USA, 13–17 August 2016; pp. 785–794. [Google Scholar] [CrossRef]
- Rainio, O.; Teuho, J.; Klén, R. Evaluation Metrics and Statistical Tests for Machine Learning. Sci. Rep. 2024, 14, 6086. [Google Scholar] [CrossRef]





| Column | Values |
|---|---|
| USMER | 1 = Yes (patient treated in USMER unit), 2 = No |
| SEX | 1 = Female, 2 = Male |
| PATIENT_TYPE | 1 = Returned home (ambulatory), 2 = Hospitalized |
| INTUBED | 1 = Yes, 2 = No, 97 = Not applicable, 99 = Unknown |
| PNEUMONIA | 1 = Yes, 2 = No, 99 = Unknown |
| PREGNANT | 1 = Yes, 2 = No, 97 = Not applicable, 98 = Unknown |
| DIABETES | 1 = Yes, 2 = No, 98 = Unknown |
| COPD | 1 = Yes, 2 = No, 98 = Unknown |
| ASTHMA | 1 = Yes, 2 = No, 98 = Unknown |
| INMSUPR | 1 = Yes, 2 = No, 98 = Unknown |
| HYPERTENSION | 1 = Yes, 2 = No, 98 = Unknown |
| OTHER_DISEASE | 1 = Yes, 2 = No, 98 = Unknown |
| CARDIOVASCULAR | 1 = Yes, 2 = No, 98 = Unknown |
| OBESITY | 1 = Yes, 2 = No, 98 = Unknown |
| RENAL_CHRONIC | 1 = Yes, 2 = No, 98 = Unknown |
| TOBACCO | 1 = Yes, 2 = No, 98 = Unknown |
| CLASSIFICATION_FINAL | 1 = Confirmed COVID-19 by lab test, 2 = Confirmed by clinical–epidemiological association, 3 = Confirmed by expert judgment, 4 = Suspected case (no test), 5 = Not confirmed, 6 = Test negative, 7 = Pending test result |
| ICU | 1 = Yes, 2 = No, 97 = Not applicable, 99 = Unknown |
| Dataset | Number of Records |
|---|---|
| Death Dataset | 76,942 |
| Live Dataset | 971,633 |
| Variable | Correlation |
|---|---|
| PREGNANT | 0.001278 |
| OBESITY | 0.010314 |
| AGE | 0.011176 |
| COPD | 0.013767 |
| CLASSIFICATION_FINAL | 0.015668 |
| SEX | 0.015680 |
| CARDIOVASCULAR | 0.016966 |
| ASTHMA | 0.018245 |
| TOBACCO | 0.019461 |
| RENAL_CHRONIC | 0.019472 |
| INMSUPR | 0.022671 |
| DIABETES | 0.024625 |
| OTHER_DISEASE | 0.027784 |
| HYPERTENSION | 0.030368 |
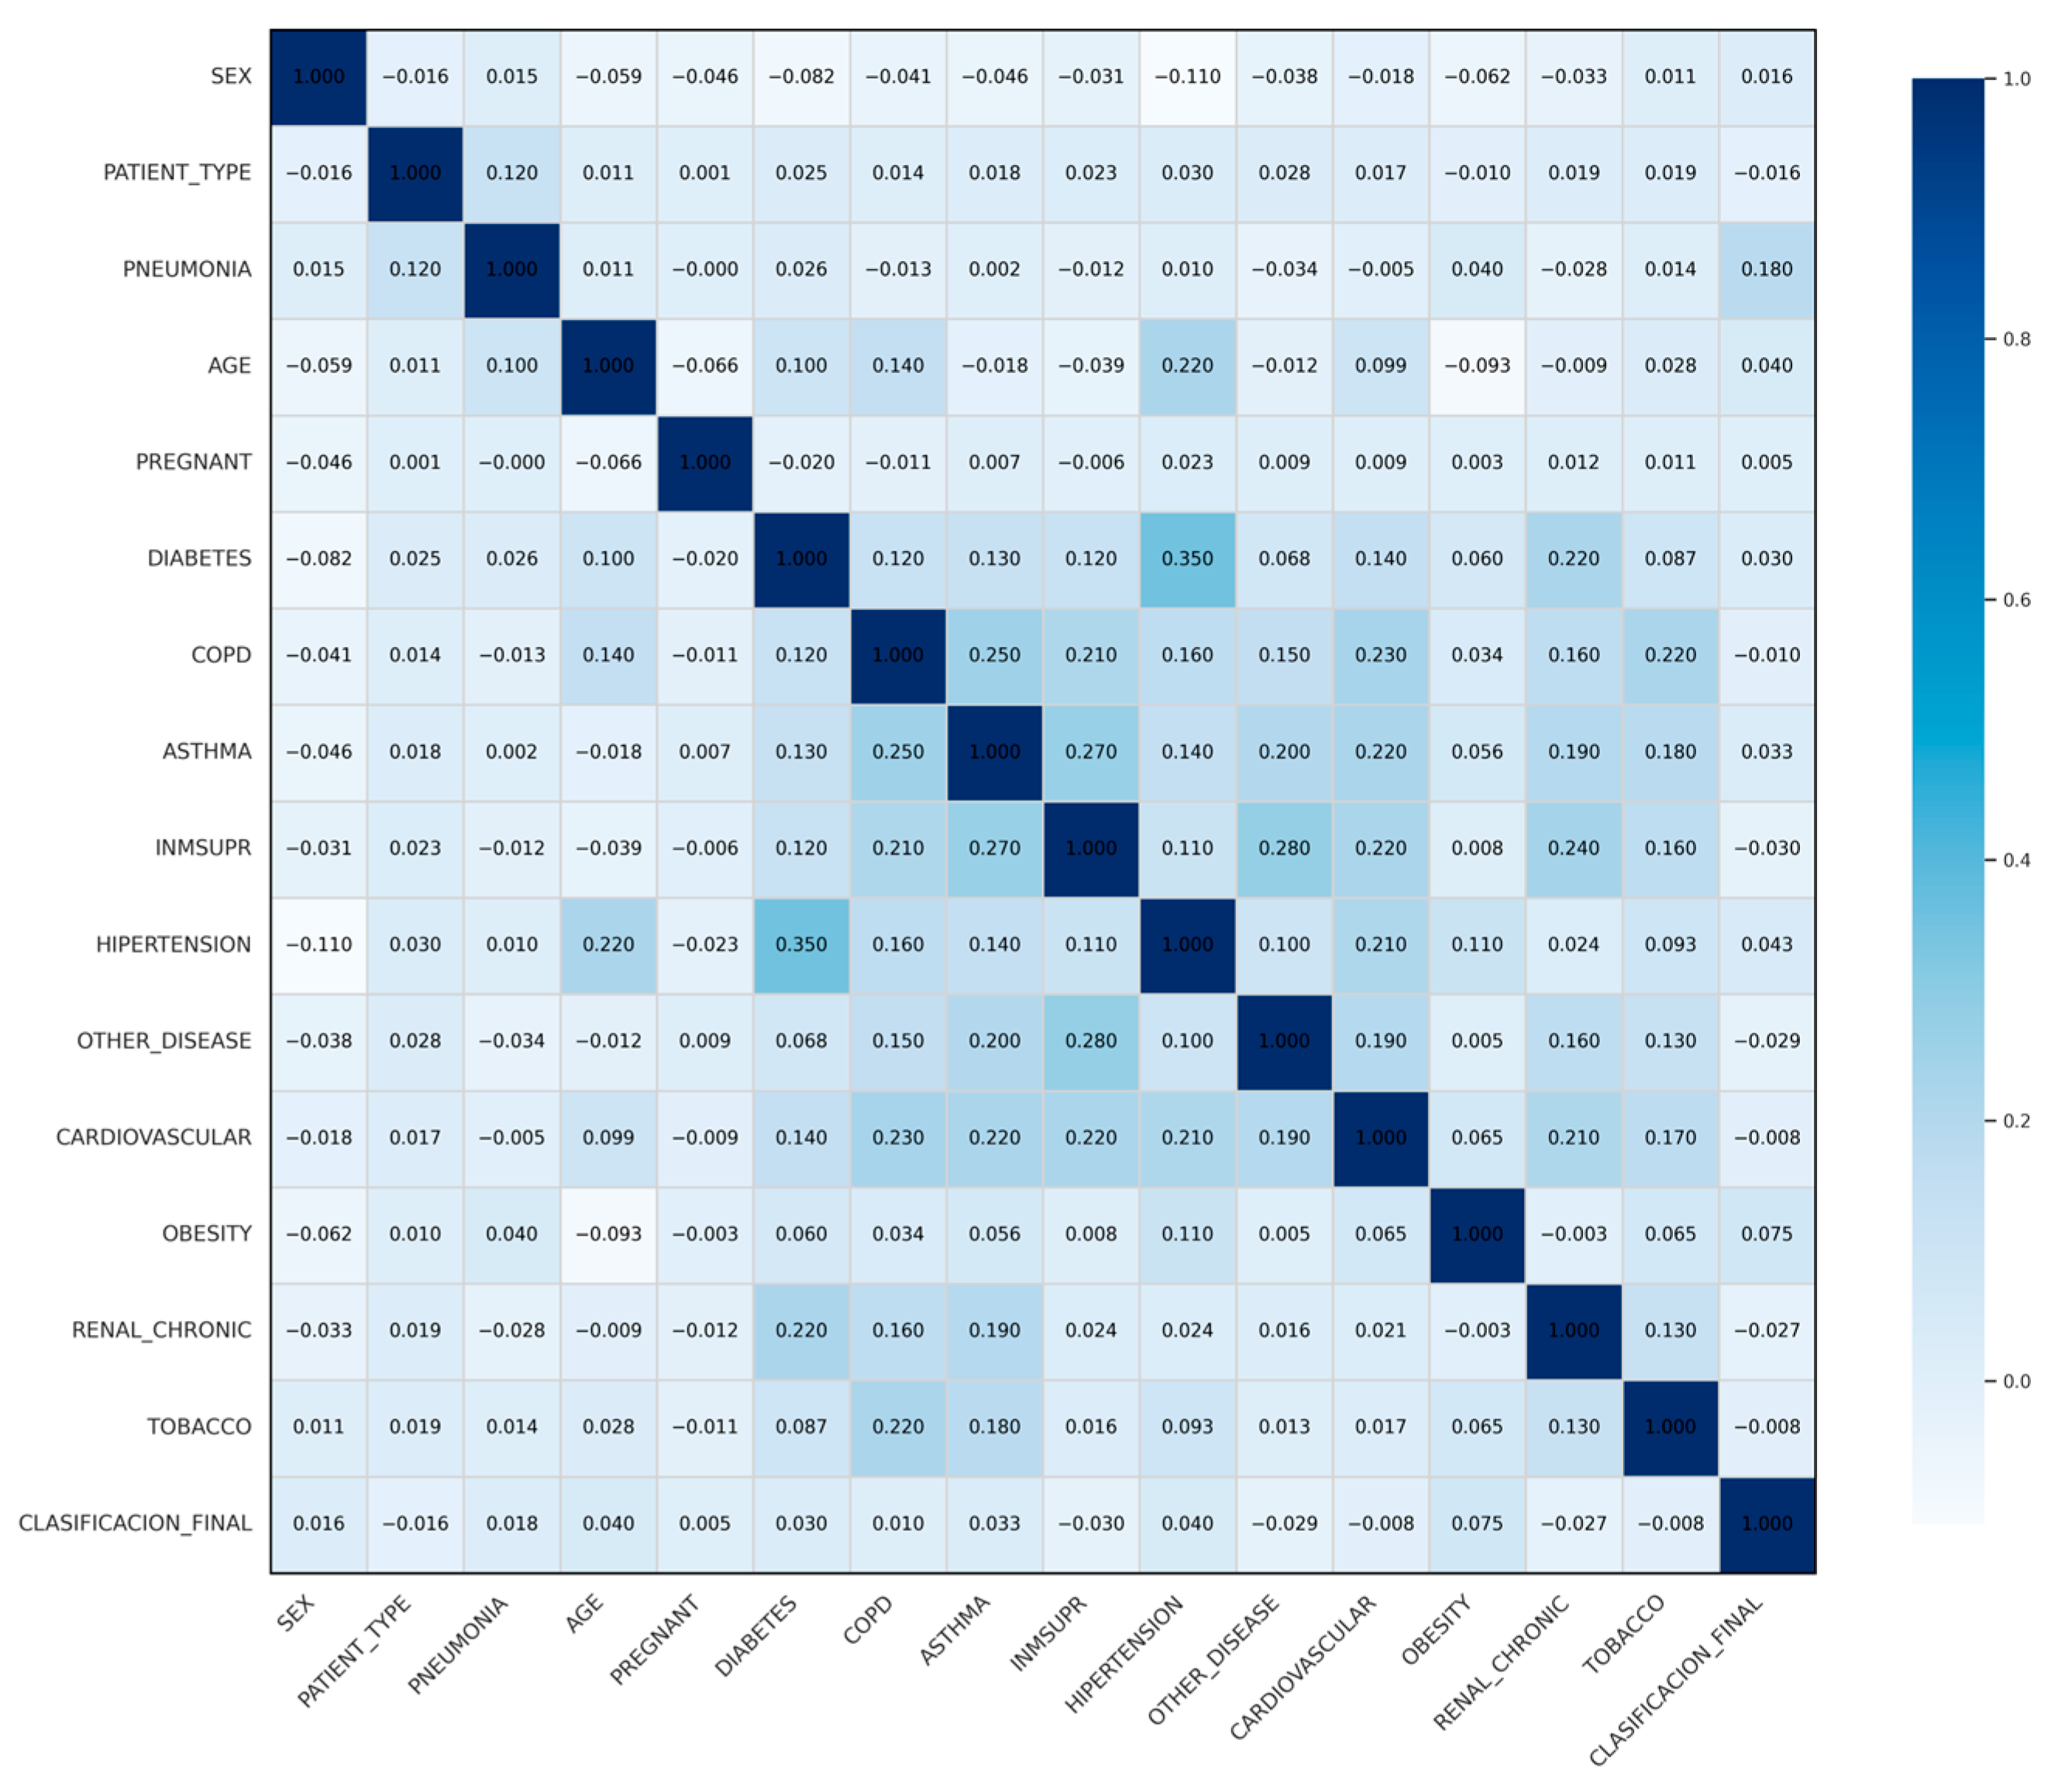
| PNEUMONIA | 0.122106 |
| PATIENT_TYPE | 1.000000 |
| Feature | Risk Difference (Δ) | Adjusted Weights |
|---|---|---|
| PNEUMONIA | +0.12 | +0.36 |
| SEX | +0.05 | +0.29 |
| AGE | −0.03 | −0.37 |
| HYPERTENSION | −0.03 | −0.32 |
| DIABETES | −0.04 | −0.43 |
| OBESITY | −0.03 | −0.40 |
| TOBACCO | −0.07 | −1.11 |
| RENAL_CHRONIC | −0.06 | −1.15 |
| CARDIOVASCULAR | −0.12 | −1.04 |
| COPD | −0.05 | −0.85 |
| INMSUPR | −0.06 | −1.00 |
| ASTHMA | −0.05 | −0.90 |
| PREGNANT | −0.01 | −0.09 |
| Severity Categorization | Score Intervals | Description |
|---|---|---|
| Low | [−24–79] | low risk of hospitalization |
| Moderate | [79–123] | moderate risk, special care required |
| High | [>123] | high risk, priority hospitalization |
| Model | Main Hyper Parameters |
|---|---|
| Artificial Neural Network (ANN) | 3 hidden layers [256, 128, 64]; activation ReLU; Dropout 0.2; optimizer Adam; learning rate = 0.001; batch size = 1024; epochs = 20; early stopping (patience = 3); class_weight = balanced |
| Random Forest | n_estimators = 300; max_depth = None; min_samples_split = 2; class_weight = balanced |
| XGBoost | n_estimators = 400; max_depth = 6; learning rate = 0.1; subsample = 0.8; colsample_bytree = 0.8 |
| Logistic Regression | solver = lbfgs; max_iter = 1000; class_weight = balanced |
| SVM (RBF) | kernel = rbf; C = 1.0; gamma = scale; class_weight = balanced |
| Decision Tree | criterion = gini; max_depth = None; min_samples_split = 2; class_weight = balanced |
| Naïve Bayes | var_smoothing = 1 × 10⁻⁹ (default) |
| Metric/Algorithm | Logistic Regression | Random Forest | ANN | Naive Bayes | Decision Trees | XGBoost | SVM |
|---|---|---|---|---|---|---|---|
| Category 1 Metrics | |||||||
| p | 0.99 | 0.98 | 0.97 | 0.69 | 0.84 | 0.94 | 0.90 |
| R | 0.98 | 0.99 | 0.98 | 0.40 | 0.87 | 0.93 | 0.88 |
| F | 0.99 | 0.99 | 0.98 | 0.51 | 0.87 | 0.94 | 0.89 |
| Category 2 Metrics | |||||||
| P | 1.00 | 1.00 | 1.00 | 0.93 | 0.84 | 0.95 | 0.91 |
| R | 1.00 | 1.00 | 0.99 | 0.92 | 0.87 | 0.94 | 0.89 |
| F | 1.00 | 1.00 | 1.00 | 0.93 | 0.87 | 0.95 | 0.90 |
| Category 3 Metrics | |||||||
| P | 0.99 | 0.99 | 0.98 | 0.62 | 0.91 | 0.94 | 0.90 |
| R | 0.99 | 0.99 | 0.98 | 0.75 | 0.89 | 0.93 | 0.88 |
| F | 0.99 | 0.99 | 0.98 | 0.68 | 0.90 | 0.94 | 0.89 |
| ROC AUC Score | 0.9999 | 0.9999 | 0.9980 | 0.9351 | 0.9531 | 0.9351 | 0.9451 |
| Cross-Validation Mean Accuracy | 0.9953 | 0.9946 | 0.9905 | 0.82 | 0.93 | 0.96 | 0.92 |
| Metric/Algorithm | Logistic Regression | Random Forest | ANN | Naive Bayes | Decision Trees | XGBoost | SVM |
|---|---|---|---|---|---|---|---|
| Patient type 0 Metrics | |||||||
| p | 0.93 | 0.93 | 0.98 | 0.94 | 0.89 | 0.95 | 0.90 |
| R | 0.96 | 0.96 | 0.97 | 0.90 | 0.92 | 0.96 | 0.93 |
| F | 0.95 | 0.95 | 0.95 | 0.92 | 0.90 | 0.95 | 0.91 |
| Patient type 1 Metrics | |||||||
| P | 0.77 | 0.79 | 0.99 | 0.50 | 0.70 | 0.82 | 0.65 |
| R | 0.51 | 0.50 | 0.53 | 0.65 | 0.55 | 0.60 | 0.48 |
| F | 0.61 | 0.61 | 0.73 | 0.57 | 0.61 | 0.69 | 0.55 |
| ROC AUC Score | 0.81 | 0.84 | 0.958 | 0.81 | 0.85 | 0.93 | 0.82 |
| Cross-Validation Mean Accuracy | 0.9116 | 0.9114 | 0.9869 | 0.8642 | 0.89 | 0.92 | 0.88 |
| Reference and Year | Techniques/Methods | Best Algorithm | Accuracy | Recall | F1 Score | Limitation |
|---|---|---|---|---|---|---|
| Gerevini et al., 2023 [10] |
| Decision Trees (Bagging, Boosting) | 90%+ (81.9% on 4th day) | - | - |
|
| Igor Miranda et al., 2024 [12] |
| NN | 84.7% | 84.6% | - | Use of self-reported data, difficulty in accurately predicting hospitalizations. |
| Li et al., 2020 [13] | AI methods for individual-level fatality prediction using autoencoders | Autoencoder | - | 97% (on Wolfram dataset) | - | Sensitivity below 50% in death prediction. Models struggle to accurately predict death. |
| Jain et al., 2021 [14] |
| Naïve Bayes | 78.4% | - | - | The model might not adapt well to rapidly evolving situations or different phases of the pandemic. |
| Shi et al., 2021 [15] |
| SVM | 91.91% | 91.91% | - |
|
| Darapaneni et al., 2020 [16] |
| SVM | 82% | - | - | The utilization of blood-related features in this approach may entail a substantial time investment for analysis due to their intricate and detailed nature, potentially impacting prediction timeliness. |
| Kang et al., 2021 [19] |
| ANN | - | 85.7% | 96.4% |
|
| Shams Eddin and El Hajj 2025 [20] | Robust optimization framework for hospital bed allocation under uncertain demand | - | - | - | (cost reduction ~50%) | High computational complexity and reliance on precise demand data. Lacks predictive ML for dynamic feature integration, unlike our scalable Spark pipeline. |
| Ayvaci et al. 2025 [22] | Adaptive machine learning updates for severity prediction | XGBoost | - | - | 81% | Complex contextual updates with potential historical bias. Not scalable for big data, addressed by our Spark recalibration. |
| Cornilly et al. 2023 [24] | Robust and sparse logistic regression techniques with L1 regularization for stability | Logistic Regression | - | - | Up to 85% (predictive accuracy) | Static model lacking dynamic batch-streaming integration. Not suited for rapidly evolving scenarios, unlike our hybrid design. |
| Tianyu et al. 2024 [6] | Universal outbreak risk prediction tool based on machine learning ensembles | Random Forest Ensemble | - | 90% | - | No real-time streaming pipelines to adapt to sudden changes. Lacks the dual-dataset robustness of our hybrid framework. |
| This Study, 2025 | Dynamic scoring model; Big data infrastructure; feature selection and recalibration; predictive modeling for severity and hospitalization | ANN | 98.69% | - | - |
|
Disclaimer/Publisher’s Note: The statements, opinions and data contained in all publications are solely those of the individual author(s) and contributor(s) and not of MDPI and/or the editor(s). MDPI and/or the editor(s) disclaim responsibility for any injury to people or property resulting from any ideas, methods, instructions or products referred to in the content. |
© 2025 by the authors. Licensee MDPI, Basel, Switzerland. This article is an open access article distributed under the terms and conditions of the Creative Commons Attribution (CC BY) license (https://creativecommons.org/licenses/by/4.0/).
Share and Cite
Berros, N.; Filaly, Y.; El Mendili, F.; El Bouzekri El Idrissi, Y. Scalable Predictive Modeling for Hospitalization Prioritization: A Hybrid Batch–Streaming Approach. Big Data Cogn. Comput. 2025, 9, 271. https://doi.org/10.3390/bdcc9110271
Berros N, Filaly Y, El Mendili F, El Bouzekri El Idrissi Y. Scalable Predictive Modeling for Hospitalization Prioritization: A Hybrid Batch–Streaming Approach. Big Data and Cognitive Computing. 2025; 9(11):271. https://doi.org/10.3390/bdcc9110271
Chicago/Turabian StyleBerros, Nisrine, Youness Filaly, Fatna El Mendili, and Younes El Bouzekri El Idrissi. 2025. "Scalable Predictive Modeling for Hospitalization Prioritization: A Hybrid Batch–Streaming Approach" Big Data and Cognitive Computing 9, no. 11: 271. https://doi.org/10.3390/bdcc9110271
APA StyleBerros, N., Filaly, Y., El Mendili, F., & El Bouzekri El Idrissi, Y. (2025). Scalable Predictive Modeling for Hospitalization Prioritization: A Hybrid Batch–Streaming Approach. Big Data and Cognitive Computing, 9(11), 271. https://doi.org/10.3390/bdcc9110271


