Article

DRCCT: Enhancing Diabetic Retinopathy Classification with a Compact Convolutional Transformer

by
Mohamed Touati
1,2,3,*,
Rabeb Touati
3,
Laurent Nana
1,
Faouzi Benzarti
2 and
Sadok Ben Yahia
4
1
Lab-STICC/UMR CNRS 6285, University of Brest, F-29238 Brest, France
2
The National Higher Engineering School of Tunis, University of Tunis, Tunis 1008, Tunisia
3
Laboratory of Human Genetics, Faculty of Medicine of Tunis, University of Tunis El Manar, Tunis 1007, Tunisia
4
The Maersk Mc-Kinney Moller Institute, University of Southern Denmark, 6400 Sonderborg, Denmark
*
Author to whom correspondence should be addressed.
Big Data Cogn. Comput. 2025, 9(1), 9; https://doi.org/10.3390/bdcc9010009
Submission received: 30 August 2024 / Revised: 4 December 2024 / Accepted: 6 December 2024 / Published: 9 January 2025
(This article belongs to the Special Issue Recent Advances in Big Data-Driven Prescriptive Analytics)

Abstract

:
Diabetic retinopathy, a common complication of diabetes, is further exacerbated by factors such as hypertension and obesity. This study introduces the Diabetic Retinopathy Compact Convolutional Transformer (DRCCT) model, which combines convolutional and transformer techniques to enhance the classification of retinal images. The DRCCT model achieved an impressive average F1-score of 0.97, reflecting its high accuracy in detecting true positives while minimizing false positives. Over 100 training epochs, the model demonstrated outstanding generalization capabilities, achieving a remarkable training accuracy of 99% and a validation accuracy of 95%. This consistent improvement underscores the model’s robust learning process and its effectiveness in avoiding overfitting. On a newly evaluated dataset, the model attained precision and recall scores of 96.93% and 98.89%, respectively, indicating a well-balanced handling of false positives and false negatives. The model’s ability to classify retinal images into five distinct diabetic retinopathy categories demonstrates its potential to significantly improve automated diagnosis and aid in clinical decision-making.

1. Introduction

Diabetes is a widespread metabolic condition that leads to multiple vascular complications throughout the body. The likelihood of eye-related problems escalates when diabetes is present alongside other health conditions like hypertension, obesity, and elevated cholesterol levels. This condition harms the tiny blood vessels in the retina, resulting in a condition called diabetic retinopathy (DR). This frequent complication progressively damages these blood vessels, disrupting the retina’s normal function. The damage can cause fluid to leak and blood vessels to become blocked, leading to significant vision loss or even blindness if left untreated. Diabetic retinopathy is the leading cause of global blindness, making early detection crucial. Emerging technologies, particularly artificial intelligence (AI), offer promising alternatives for cost-effective and efficient DR screening. Recent research [1] has focused on leveraging machine learning (ML) techniques to enhance the detection and classification of DR. A study that reviewed various ML methods for DR detection highlighted the importance of early intervention and the potential of AI in providing scalable screening solutions. Figure 1 depicts a retinal fundus exam highlighting key features of diabetic retinopathy (DR). Microaneurysms are small bulges visible within the retinal vessels, along with hemorrhages and exudates, indicators of bleeding and protein deposits. These findings are characteristic of non-proliferative diabetic retinopathy (NPDR), an early stage of the condition. DR is progressive, making early detection and treatment crucial to avoid significant vision loss. If left untreated, the disease may advance to proliferative diabetic retinopathy (PDR), marked by abnormal blood vessel growth.
This study conducted a bibliometric analysis using data from Scopus and Web of Science to explore different ML styles used in DR diagnosis, combining quantitative and qualitative analyses to offer insights into image segmentation methods, datasets, and ML approaches, including traditional and deep learning techniques. Advances in artificial intelligence (AI) present new ways to enhance disease detection and management. A total of 178 studies [2] on DR screening systems using AI techniques were reviewed, highlighting the urgent need for automated, reliable solutions due to the global rise in DR patients. The review spans publications from January 2014 to June 2022, discussing various AI, machine learning (ML), and deep learning (DL) tools used for DR detection. A key focus is on the comparison between custom-built convolutional neural networks (CNNs) and those employing transfer learning with established architectures like VGG, ResNet, or AlexNet. While creating a CNN from scratch requires significant time and resources, transfer learning offers a quicker alternative. However, studies indicate that custom CNN architectures often outperform those using existing structures. This distinction warrants further research. The survey also explores feature extraction techniques, which enhance model performance by reducing feature vector size and computational effort. Publicly available datasets were analyzed, along with performance metrics crucial for evaluating the accuracy and effectiveness of DR detection systems. The review identifies a gap in technologies capable of predicting all DR stages and detecting various lesions, highlighting the need for advanced solutions to improve patient outcomes and prevent vision loss. Future research should consider emerging concepts like transfer learning, ensemble learning, explainable AI, multi-task learning, and domain adaptation to enhance early DR detection.
Recent developments in deep learning, particularly with vision transformers (ViTs), have demonstrated significant potential in medical imaging. The number of publications on ViTs surged to 19 by the end of 2022, highlighting their ability to enhance medical image analysis [3]. ViTs improve both the accuracy and speed of analyzing retinal images, which is crucial for early diagnosis and intervention. Our project leverages these advancements by incorporating ViTs into AI tools for detecting and managing diabetic retinopathy. This strategy aims to equip healthcare professionals with advanced tools for more effective diagnosis and treatment, ultimately helping preserve patients’ vision.
In this work, we introduce the Diabetic Retinopathy Compact Convolutional Transformer (DRCCT), a groundbreaking model specifically designed to resolve the limitations of classical approaches in diabetic retinopathy (DR) detection and classification. The DRCCT combines the potency of convolutional neural networks (CNNs) with vision transformers (ViTs), achieving an optimal balance between efficacious feature extraction and the capability to detect long-range dependencies. This combination enhances the capability of CNNs to accurately analyze retinal images, making it a robust and highly efficient solution for medical imaging applications, particularly in DR.
The DRCCT employs convolutional tokenization, which transforms retinal images into compact, meaningful representations, enabling the transformer encoder to process these tokens using attention mechanisms. This design permits the model to detect minor anomalies with pinpoint accuracy, enhancing the overall diagnostic precision. The DRCCT has demonstrated exceptional performance, with an average F1-score of 0.97, precision of 96.93%, and recall of 98.89%, indicating its ability to minimize false positives and negatives. When compared to our recent works, such as Xception in [4] and ResNet with attention mechanism [5], as well as vision transformers, our model outperformed all alternatives in terms of accuracy and scalability. By effectively addressing crucial obstacles such as dataset imbalance and the intricate nature of retinal data, the DRCCT establishes a novel standard for dependable and efficacious detection of diabetic retinopathy.

2. Literature Review

In recent years, the demand for precise diagnosis of diabetic retinopathy (DR) has received considerable attention, prompting the development of numerous Computer-Aided Diagnosis (CAD) methods designed to aid clinicians in interpreting fundus images. Deep learning algorithms have particularly stood out due to their exceptional ability to automatically extract and classify features. For example, Sheikh and Qidwai [6] applied the MobileNetV2 architecture on a different dataset, utilizing transfer learning to achieve a remarkable 90.8% accuracy in diagnosing DR and 92.3% accuracy in identifying referable diabetic retinopathy (RDR) cases with an AUC score of 0.9. The macro precision, recall, and F1-scores are 77.6%, 83.1%, and 80.1%, respectively. In [7], the researchers tackled the problem as a binary classification task, attaining an impressive 91.1% accuracy on the Messidor dataset and 90.5% on the EyePACS dataset. These results underscore the method’s strong potential for application in clinical environments. Moreover, the study in [8] proposed a multi-channel Generative Adversarial Network (GAN) with semi-supervised learning for assessing diabetic retinopathy (DR). The model tackles the issue of mismatched labeled data in diabetic retinopathy (DR) classification through three primary mechanisms: a multi-channel generative approach to produce sub-field images, a multi-channel Generative Adversarial Network (GAN) with semi-supervised learning to effectively utilize both labeled and unlabeled data, and a DR feature extractor designed to capture representative features from high-resolution fundus images. In [4], M. Touati et al. presented an approach that combines image processing with transfer learning techniques. The advanced image processing steps are designed to extract richer features, improving the quality of subsequent analysis. Transfer learning, using the Xception model, speeds up the training process by utilizing pre-existing knowledge. These combined techniques resulted in high training accuracy (92%) and test accuracy (88%), demonstrating the effectiveness of the proposed method. In a separate study, Yaqoob et al. [9] developed a method for detecting and grading diabetic retinopathy by merging ResNet-50 features with a Random Forest classifier. This approach leverages features from ResNet-50’s average pooling layer and highlights the role of specific layers in improving performance. ResNet helps overcome issues like vanishing gradients, enabling effective training of deeper networks. In [10], researchers used feature extraction to identify anomalies in retinal images, allowing for quick diabetic retinopathy (DR) detection on a scale of 0 to 4. Various classification algorithms were tested, with the Naïve Bayes Classifier achieving 83% accuracy. According to Toledo-Cortés et al. [11], the DLGP-DR model represents a significant advancement in deep learning for diabetic retinopathy (DR) detection, leveraging a Gaussian process to enhance classification and ranking. This model surpassed earlier approaches in both accuracy and AUC, offering valuable insights into areas of misclassification. On the EyePACS dataset, DLGP-DR achieved impressive metrics, including a sensitivity of 0.9323, specificity of 0.9173, and an AUC of 0.97. When tested on the Messidor dataset, the model maintained strong performance, with sensitivity, specificity, and AUC scores of 0.7237, 0.8625, and 0.8787, respectively. These findings highlight its adaptability and efficacy across varied datasets. In [12], Holly H. Vo introduced two innovative deep learning architectures for fine-grained diabetic retinopathy (DR) classification: CKML-Net and VNXK. CKML-Net, inspired by GoogLeNet, leverages multiple filter sizes and incorporates multiple loss functions to enhance feature extraction and training efficiency. VNXK, built upon VGGNet, adds an extra kernel layer and adopts a hybrid LGI color space combining luminance, green, and intensity components for improved DR recognition. Additionally, transfer learning is employed to address dataset imbalances. The proposed models achieved state-of-the-art performance on the EyePACS and Messidor datasets. In [5], Touati et al. introduced a ResNet50 model integrated with attention mechanisms, marking a significant advancement in diabetic retinopathy (DR) detection. The model achieved a training accuracy of 98.24% and an F1-score of 95%, demonstrating superior performance compared to existing methods. The approach described in [13], named TaNet, leverages transfer learning for classification and has shown excellent results on datasets such as Messidor-2, EYEPACS-1, and APTOS 2019. The model achieved impressive metrics, including 98.75% precision, 98.89% F1-score, and 97.89% recall, outperforming current methods in terms of accuracy and prediction performance. In [14], four scenarios using the APTOS dataset were tested with HIST, CLAHE, and ESRGAN. The CLAHE and ESRGAN combination achieved the highest accuracy of 97.83% with a CNN, matching experienced ophthalmologists. This underscores the value of advanced preprocessing in improving DR detection and suggests further research on larger datasets could be beneficial. In a manner similar to [15], which introduced a novel ViT model for predicting diabetic retinopathy severity using the FGADR dataset, ref. [16] underscores the potential of vision transformers in advancing diagnostic accuracy and performance in medical imaging tasks. The study in [17] presents DR-CCTNet, a modified transformer model designed to improve automated DR diagnosis. Tested on diverse fundus images from five datasets with varying resolutions and qualities, the model utilized advanced image processing and augmentation techniques on a large dataset of 154,882 images. The compact convolutional transformer was found to be the most effective, achieving 90.17% accuracy even with low-pixel images. Key contributions include a robust dataset, innovative augmentation methods, improved image quality through pre-processing, and model optimization for better performance with smaller images. In [18], a new deep learning model, Residual–Dense System (RDS-DR), was developed for early diabetic retinopathy (DR) diagnosis. This model combines residual and dense blocks to effectively extract and integrate features from retinal images. Trained on 5000 images, RDS-DR achieved a high accuracy of 97% in classifying DR severity. It outperformed leading models like VGG16, VGG19, Xception, and InceptionV3 in both accuracy and computational efficiency. Berbar [19] presents a novel approach for detecting and classifying diabetic retinopathy using fundus images. The method employs a feature extraction technique known as “Uniform Local Binary Pattern Encoded Zeroes” (ULBPEZ), which reduces feature size to 3.5% of its original size for more compact representation. Preprocessing includes histogram matching for brightness standardization, median filtering for noise reduction, adaptive histogram equalization for contrast enhancement, and unsharp masking for detail sharpening. Yasashvini R et al. [20] investigated the use of convolutional neural networks (CNN) and hybrid CNNs for diabetic retinopathy classification. They developed several models, including a standard CNN, a hybrid CNN with ResNet, and a hybrid CNN with DenseNet. The models achieved accuracy rates of 96.22%, 93.18%, and 75.61%, respectively. The study found that the hybrid CNN with DenseNet was the most effective for automated diabetic retinopathy classification. Ghaffar Nia et al. [21] highlight that healthcare’s vast data is ideal for deep learning (DL) and machine learning (ML) advancements. Medical images from various sources are key for improving analysis. To enhance image quality for CAD systems in diabetes detection, techniques like denoising, normalization, bias field correction, and data balancing are used. These methods reduce noise, standardize intensity, correct intensity variations, and address class imbalances, respectively, to improve image analysis. Yaoming Yang et al. [22] examined the advancement of transformers in NLP and CV, highlighting the 2017 introduction of the transformer, which improved NLP by capturing long-range text dependencies. Their machine learning process involves resizing retinal images to 448 × 448 pixels, normalizing them, and dividing them into 16 × 16 pixels patches with random masks. These patches are processed by a pretrained vision transformer (ViT) to extract features, which are then decoded, reconstructed, and used by a classifier to detect diabetic retinopathy (DR). The study found that using vision transformers (ViTs) with Masked Autoencoders (MAE) for pre-training on over 100,000 retinal images resulted in better DR detection than pre-training with ImageNet, achieving 93.42% accuracy, 0.9853 AUC, 0.973 sensitivity, and 0.9539 specificity. More recently, in 2021, Nikhil Sathya et al. [23] introduced an innovative approach by combining vision transformers (ViTs) with convolutional neural networks (CNNs) for medical image analysis. Jianfang Wu et al. [24] highlighted the importance of attention mechanisms in natural language processing, noting that transformers, which eschew traditional convolutional layers for multi-head attention, offer advanced capabilities. Although CNNs have proven effective in grading diabetic retinopathy by efficiently extracting pixel-level features, the emergence of transformers offers potential benefits in this field [25]. Integrating CNNs with vision transformers (ViTs) has shown to be more effective than relying solely on pure ViTs, as CNNs are limited in handling distant pixel relationships, while ViTs perform exceptionally well in complex tasks like dense prediction and detecting tiny objects. However, ViTs are still considered a black box due to their opaque internal processes, highlighting the need for further research to create explainable ViT models or hybrid CNN-ViT models for diabetic retinopathy classification and similar applications.

3. Transformers for Diabetic Retinopathy

Transformers have gained significant traction in both natural language processing (NLP) and medical imaging due to their ability to capture contextual information and long-term relationships. Originally designed for sequential data tasks, transformers have revolutionized deep learning, especially in the field of computer vision. Their integration into areas such as image segmentation, classification, and disease detection has significantly enhanced diagnostic accuracy and supported the automation of medical decision-making processes. According to Shamshad et al. [3], research publications exploring vision transformers (ViTs) for medical imaging have increased substantially since January 2020. By the end of 2022, the number of publications had grown to 19, underscoring the rising attention ViTs are receiving for their transformative potential in medical image analysis. This surge in research highlights the growing recognition of ViTs in advancing critical medical applications, including image segmentation, reconstruction, and classification.
The self-attention mechanism within transformers allows them to effectively capture global patterns and contextual relationships in images, making them highly suitable for analyzing complex structures such as retinal images. The introduction of vision transformers (ViTs) has marked a pivotal step forward for image classification, particularly in the detection and analysis of diabetic retinopathy. The ability of ViTs to recognize global patterns in retinal imagery is essential for identifying the different stages of diabetic retinopathy, from mild to severe conditions.
Compact Convolutional Transformers (CCTs) represent an advanced adaptation of ViTs specifically designed for medical imaging applications. By employing sequence pooling and replacing traditional patch embeddings with convolutional embeddings, CCTs introduce a stronger inductive bias and remove the reliance on positional embeddings. These improvements enhance the accuracy of CCTs over other ViT variant models like ViT-lite and provide a wider range of options for establishing input. CCTs are especially well-suited for retinal image analysis and show great promise in the detection of diabetic retinopathy.

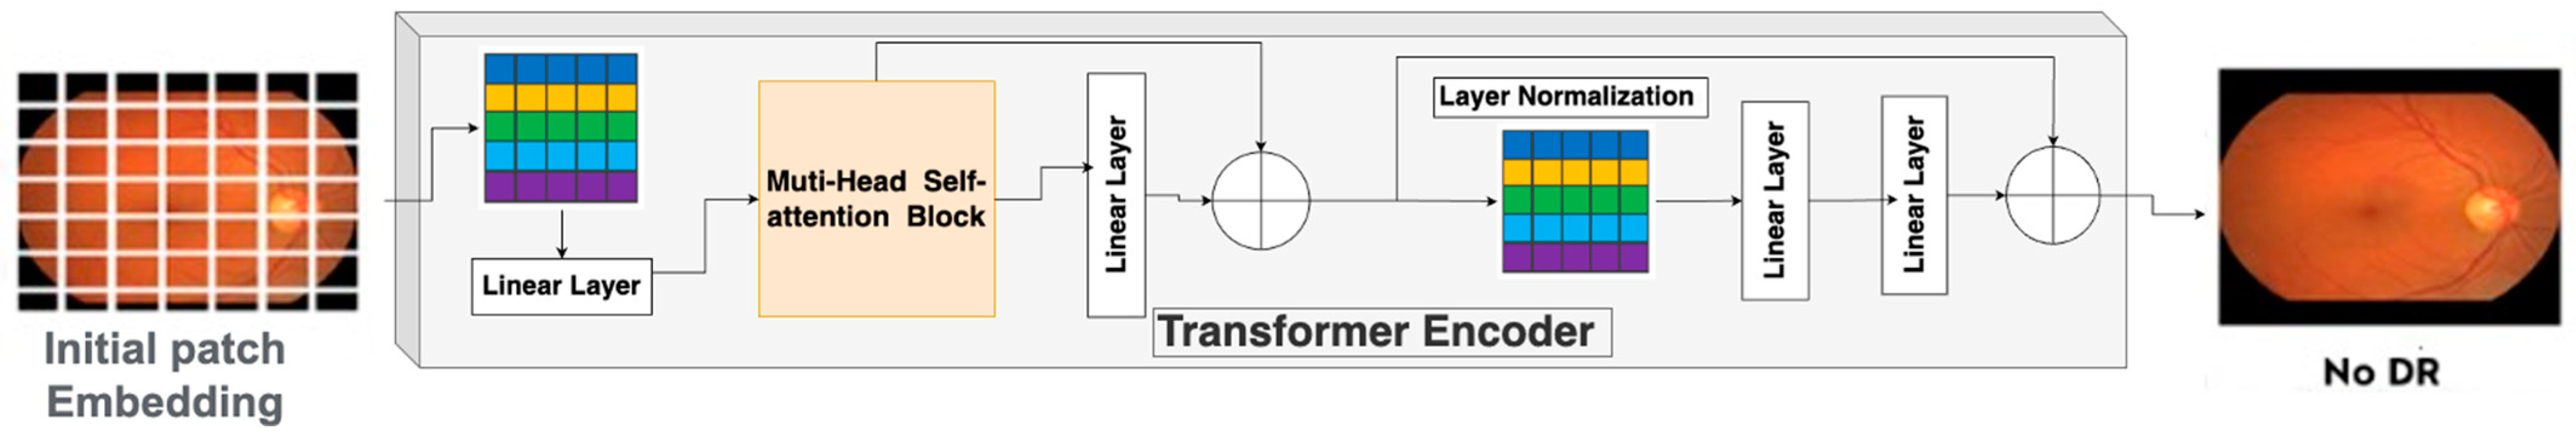
3.1. Vision Transformer

The vision transformer (ViT) represents a significant breakthrough in artificial intelligence applied to image recognition, emerging as a promising alternative to convolutional neural networks (CNNs) and recurrent neural networks (RNNs) in image classification tasks. Developed by researchers at Google Brain, the ViT takes an innovative approach by segmenting images into patches and processing them through a transformer-based encoding architecture. This allows the model to effectively capture global dependencies using self-attention mechanisms. Unlike CNNs, which focus on local patterns in a hierarchical manner, and RNNs, which handle sequential information, the ViT processes local features within patches while simultaneously considering the entire image, thus offering a global receptive field. This approach surpasses the local and sequential processing capabilities of CNNs and RNNs. Additionally, the parallelizable nature of the transformer’s architecture enhances the scalability of ViT, giving it an edge over other models whose scalability is constrained by their sequential data processing methods.
As shown in Table 1, ViT architectures have outperformed CNNs in complex tasks such as dense prediction and tiny object detection by utilizing advanced internal representations of visual data. Despite these advancements, the internal representations of ViTs are often opaque, treating the model as a “black box”. To improve the understanding and interpretation of ViT models, especially in medical image analysis and classification, developing new visualization layers is essential. This research aims to enhance the explainability of vision transformers for more effective applications in medical imaging [26].

3.2. Main Components of a Vision Transformer

The vision transformer (ViT) is a specialized adaptation of the original transformer architecture designed for image classification tasks. It starts by dividing an image into a grid of 2D patches, each with a specific resolution. These patches are then flattened and projected into a higher-dimensional space to create “patch embeddings”. To capture the spatial relationships between patches, ViT includes learnable token embeddings, akin to the [CLS] tokens used in BERT, which represent the entire image context. Positional encodings are added to preserve the spatial arrangement of the patches [27]. ViT functions as a traditional transformer encoder, processing sequences of these embeddings through self-attention and feedforward layers. The final output from the encoder is then passed through a multilayer perceptron (MLP) head for classification. This structure allows ViT to effectively analyze and classify images by considering the contextual relationships among the patches. This section explores the fundamental concepts of ViT, focusing on its attention mechanism and the various functional blocks depicted in the Figure 2.

3.2.1. The Vision Transformer Encoder

The vision transformer (ViT) encoder is composed of alternating layers of multi-head attention (MHA) blocks and multi-layer perceptron (MLP) blocks. Before each transformation block, layer normalization is applied, and residual connections are added after each block. These residual connections (also known as “skip connections”) provide alternate pathways for data, allowing the ViT to bypass certain layers and reach deeper parts of the model more directly. Layer normalization is a technique used to standardize the distribution of inputs to each layer of the model, improving learning speed and generalization accuracy. It involves centering and rescaling the input vector representation to ensure consistency in the input size for the normalization layer. Unlike traditional transformer blocks that have both encoding and decoding layers, the vision transformer only has an encoding layer. The output of the transformer encoder is then sent to the MLP head, which performs class classification based on the image representations learned from the class labels in the final layer [27].

3.2.2. Patch Embedding

To address memory constraints, images are divided into smaller patches for sequential processing. Each patch is converted into a feature vector, drawing on the embedding concept used in vision transformers (ViTs) [16]. These vectors are visualized in an embedding space where similar features group together, aiding in classification. Figure 2 shows how this process works, with the embedding layers being refined during training. This approach, particularly in retinal imaging, combines positional encoding with feature embedding to ensure accurate feature selection.

3.2.3. Position Encoding

The limited knowledge of each patch’s position is a key challenge in architectures that use patch embedding, making it difficult to establish relationships between them. Transformers address this issue with positional embedding, which preserves the positional information of tokens within a sequence. This is particularly important in fields like medical imaging, where precise feature identification is critical. Unlike traditional methods, transformers use positional embeddings, which are learned during training, to incorporate positional information. In vision transformers, these embeddings are essential because image patches do not naturally contain spatial information. Positional embeddings are combined with patch embeddings to encode the location of each patch in the image, linking feature vectors to their positions in the sequence. Positional encoding is usually implemented with sine and cosine functions at different frequencies for each embedding dimension. These values are then merged with feature vectors to create a new vector that represents both the feature and its position.

3.2.4. Attention Mechanism

Attention mechanisms, inspired by human visual focus, improve deep learning models by emphasizing the most relevant parts of an image. This selective emphasis helps the model capture crucial contextual information while ignoring noise, enhancing the accuracy and efficiency of tasks like image classification, object detection, and semantic segmentation. There are two main types of attention mechanisms: self-attention, which analyzes relationships within a sequence, and multi-head attention, which applies self-attention across multiple subspaces. The core function of attention mechanisms is to capture dependencies between elements in a sequence, regardless of their position.

3.2.5. Self-Attention

The self-attention mechanism is fundamental to the transformer’s architecture, enabling it to model long-term dependencies in a sequence. It generates a representation for each sequence element by considering the influence of all other elements. This is done by calculating similarity scores between pairs of elements, which are then converted into attention weights using a softmax function. These weights help create a weighted sum of the original element representations, capturing the sequence’s global context. The self-attention mechanism involves three key components: the query (Q), the key (K), and the value (V). The query is the element being contextualized, the key is used to determine relevance, and the value is the element weighted by the attention score to produce the final output.

3.2.6. Multi-Head Self-Attention Mechanism

The multi-head attention mechanism in transformers uses multiple parallel self-attention “heads”, each focusing on different data aspects. These heads apply distinct transformations to the input, highlighting unique features. Their outputs are then combined and further processed to enhance the model’s understanding of the data. The classification head in the vision transformer converts the encoder’s output into class probabilities. It typically involves a multi-layer perceptron (MLP) or a linear layer, which processes and flattens the patch embeddings, applies dropout to avoid overfitting, and predicts the image class.

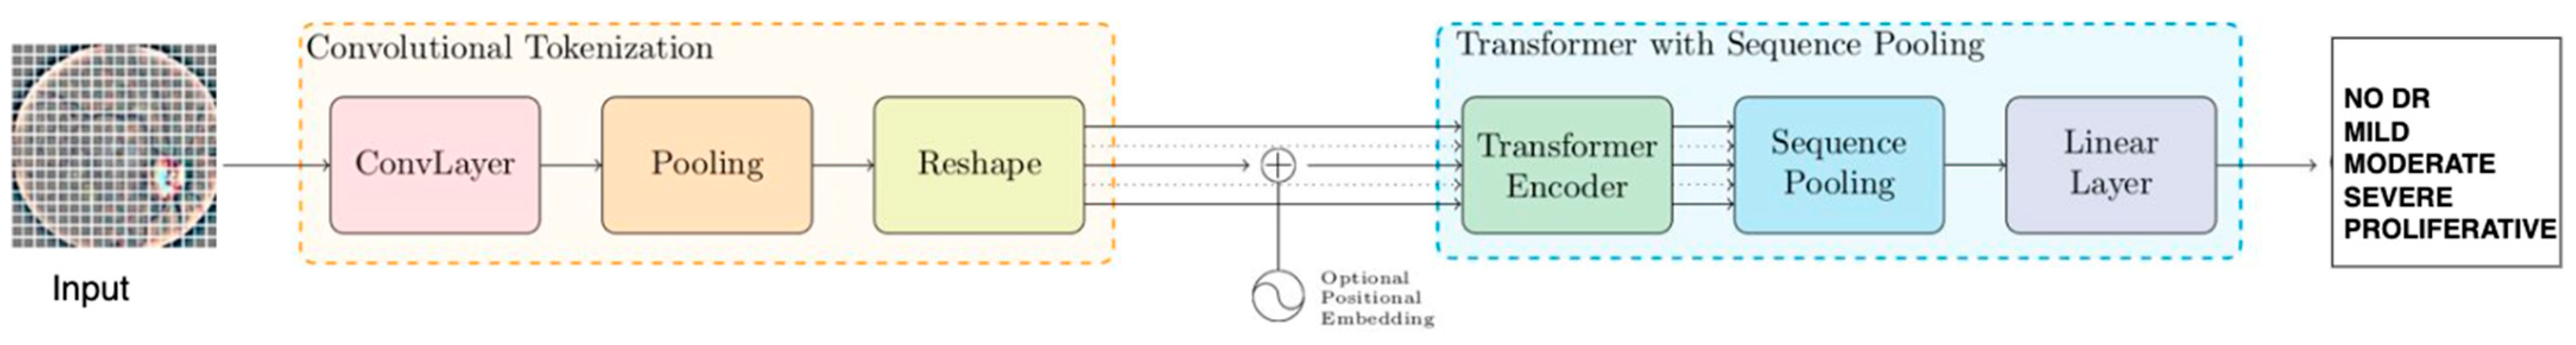
3.3. Compact Convolutional Transformers for DR Detection

In our study we introduce the compact convolutional transformer (CCT) as a highly efficient model for classifying and detecting the stages of diabetic retinopathy. Unlike other transformer-based models, the CCT excels in performance, as shown in the work of [26] on smaller datasets, while also significantly reducing computational costs and memory usage. This efficiency challenges the conventional notion that transformers require vast computational resources, making them accessible even in resource-limited settings. The ability of the CCT to operate effectively with limited data highlights its potential for broader application in various scientific domains where data availability is often constrained, thereby extending the reach and impact of machine learning research.

3.3.1. Convolutional Tokenization

Convolutional tokenization serves as the initial step in the CCT architecture defined in the Figure 3, where regions of interest within retinal images are segmented using convolutional layers. These layers are configured with specific parameters such as kernel size, stride, and padding, which dictate how the images are divided into patches.
x0 = AveragePool(ReLU(conv2D(x)))
For an image with a height of 112, width of 112, and a number of channels of 3, convolutional tokenization is employed to extract features from each patch. The process can be represented by the sequential operation of the Equation (1).
In the DRCCT (Diabetic Retinopathy Compact Convolutional Transformer) model, four different filters (16, 32, 64, and 128) are used within the CCT tokenizer. These filters determine the number of output channels or feature maps produced by the convolutional layer. By adjusting the size and quantity of patches through the use of various filters, the model achieves a balance between the detail within patches and the overall sequence length generated. The dashed arrow line in Figure 3 shows optional operations, such as positional encoding, that can improve spatial awareness in the embedding space. The solid arrow lines, on the other hand, represent the main data movement through the parts, ensuring consistency throughout the processing steps. Moreover, the “+” symbol in the figure denotes operations such as addition or concatenation, wherein the outputs of specific modules are merged. The compact convolutional transformer (CCT) architecture combines a convolutional tokenizer, SeqPool, and a transformer encoder. CCT variants are denoted by the number of transformer encoder layers and convolutional layers, such as CCT-7/3x2, which signifies a model with seven transformer encoder layers and a two-layer convolutional tokenizer with a 3 × 3 kernel size [26].

3.3.2. CCT Encoder

Following convolutional tokenization, the sequences are processed through a series of transformer blocks in the CCT architecture. Each transformer block includes two main components: a multi-head attention (MHA) layer and a multi-layer perceptron (MLP) block. The patches are encoded using layer normalization, MHA, and MLPs with ReLU activation and dropout. Key parameters such as the number of layers, output channels, hidden units, and dropout rates are carefully defined to optimize the model’s performance. Stochastic depth is employed as a regularization method, which involves applying residual branches from transformer blocks before the residual connections during training. The dashed arrow lines in Figure 3 highlight stochastic depth regularization, this technique reduces the network’s effective depth, improving generalization and reducing the risk of overfitting. The output of the transformer encoder is a tensor containing encoded patch features, which is then prepared for further processing and classification.

3.3.3. Sequence Pooling

In traditional transformer models, such as ViT and BERT, global average pooling is used to combine the output token sequence into a single class index. However, the newer approach to “sequence pooling” employs an attention-based mechanism to retain essential information from various parts of the input image. This method enhances model performance without extra parameters and slightly reduces computational demand. The sequence pooling process begins by transforming the output sequence of the transformer encoder:
x L = f ( x 0 ) R b , n , d
where x L is the output from layer L of the transformer encoder, b is the batch size, n is the sequence length, and d is the total embedding dimension. This output is then processed through a linear layer:
x = s o f t m a x ( g ( x L ) T ) R b , 1 , d
where x′ contains the importance weights for the tokens. These weights are applied to the output sequence to produce the final weighted output:
z = x L x
The result, z, is a weighted and flattened output used for classification purposes.
The solid arrow lines in Figure 3 illustrate the flow of this weighted aggregation mechanism, which ensures that the most informative patches contribute to the classification task.

3.3.4. Classification Tasks

In the final stage of the CCT model, dense layers are employed for the classification of diabetic retinopathy stages. The final dense layer typically outputs class probabilities for multi-class classification tasks or a single value for binary classification. Dense neural networks are particularly effective at learning complex patterns from input data, making them a popular choice in machine learning and deep learning applications, especially for tasks involving image classification.
The “+” symbol in Figure 3 represents the merging of outputs from various components before feeding them into the dense layers. This step ensures the integration of features learned from both convolutional and transformer-based processes, enabling accurate predictions of diabetic retinopathy stages.
Compact convolutional transformers (CCTs) represent a hybrid architecture that combines the strengths of convolutional layers with the self-attention mechanism of transformers. Unlike vision transformers, which rely on patch-based embeddings, CCTs construct convolutional embeddings that preserve local spatial information, while still allowing the model to capture global patterns through self-attention. For tasks like diabetic retinopathy detection, where the data is often smaller, this hybrid strategy is especially useful. A CCT solves the challenge of keeping performance on limited datasets while avoiding the computational overhead typically associated with traditional ViT models. The model can find tiny details in retinal pictures thanks to this combination of local and global patterns.

4. Work Done

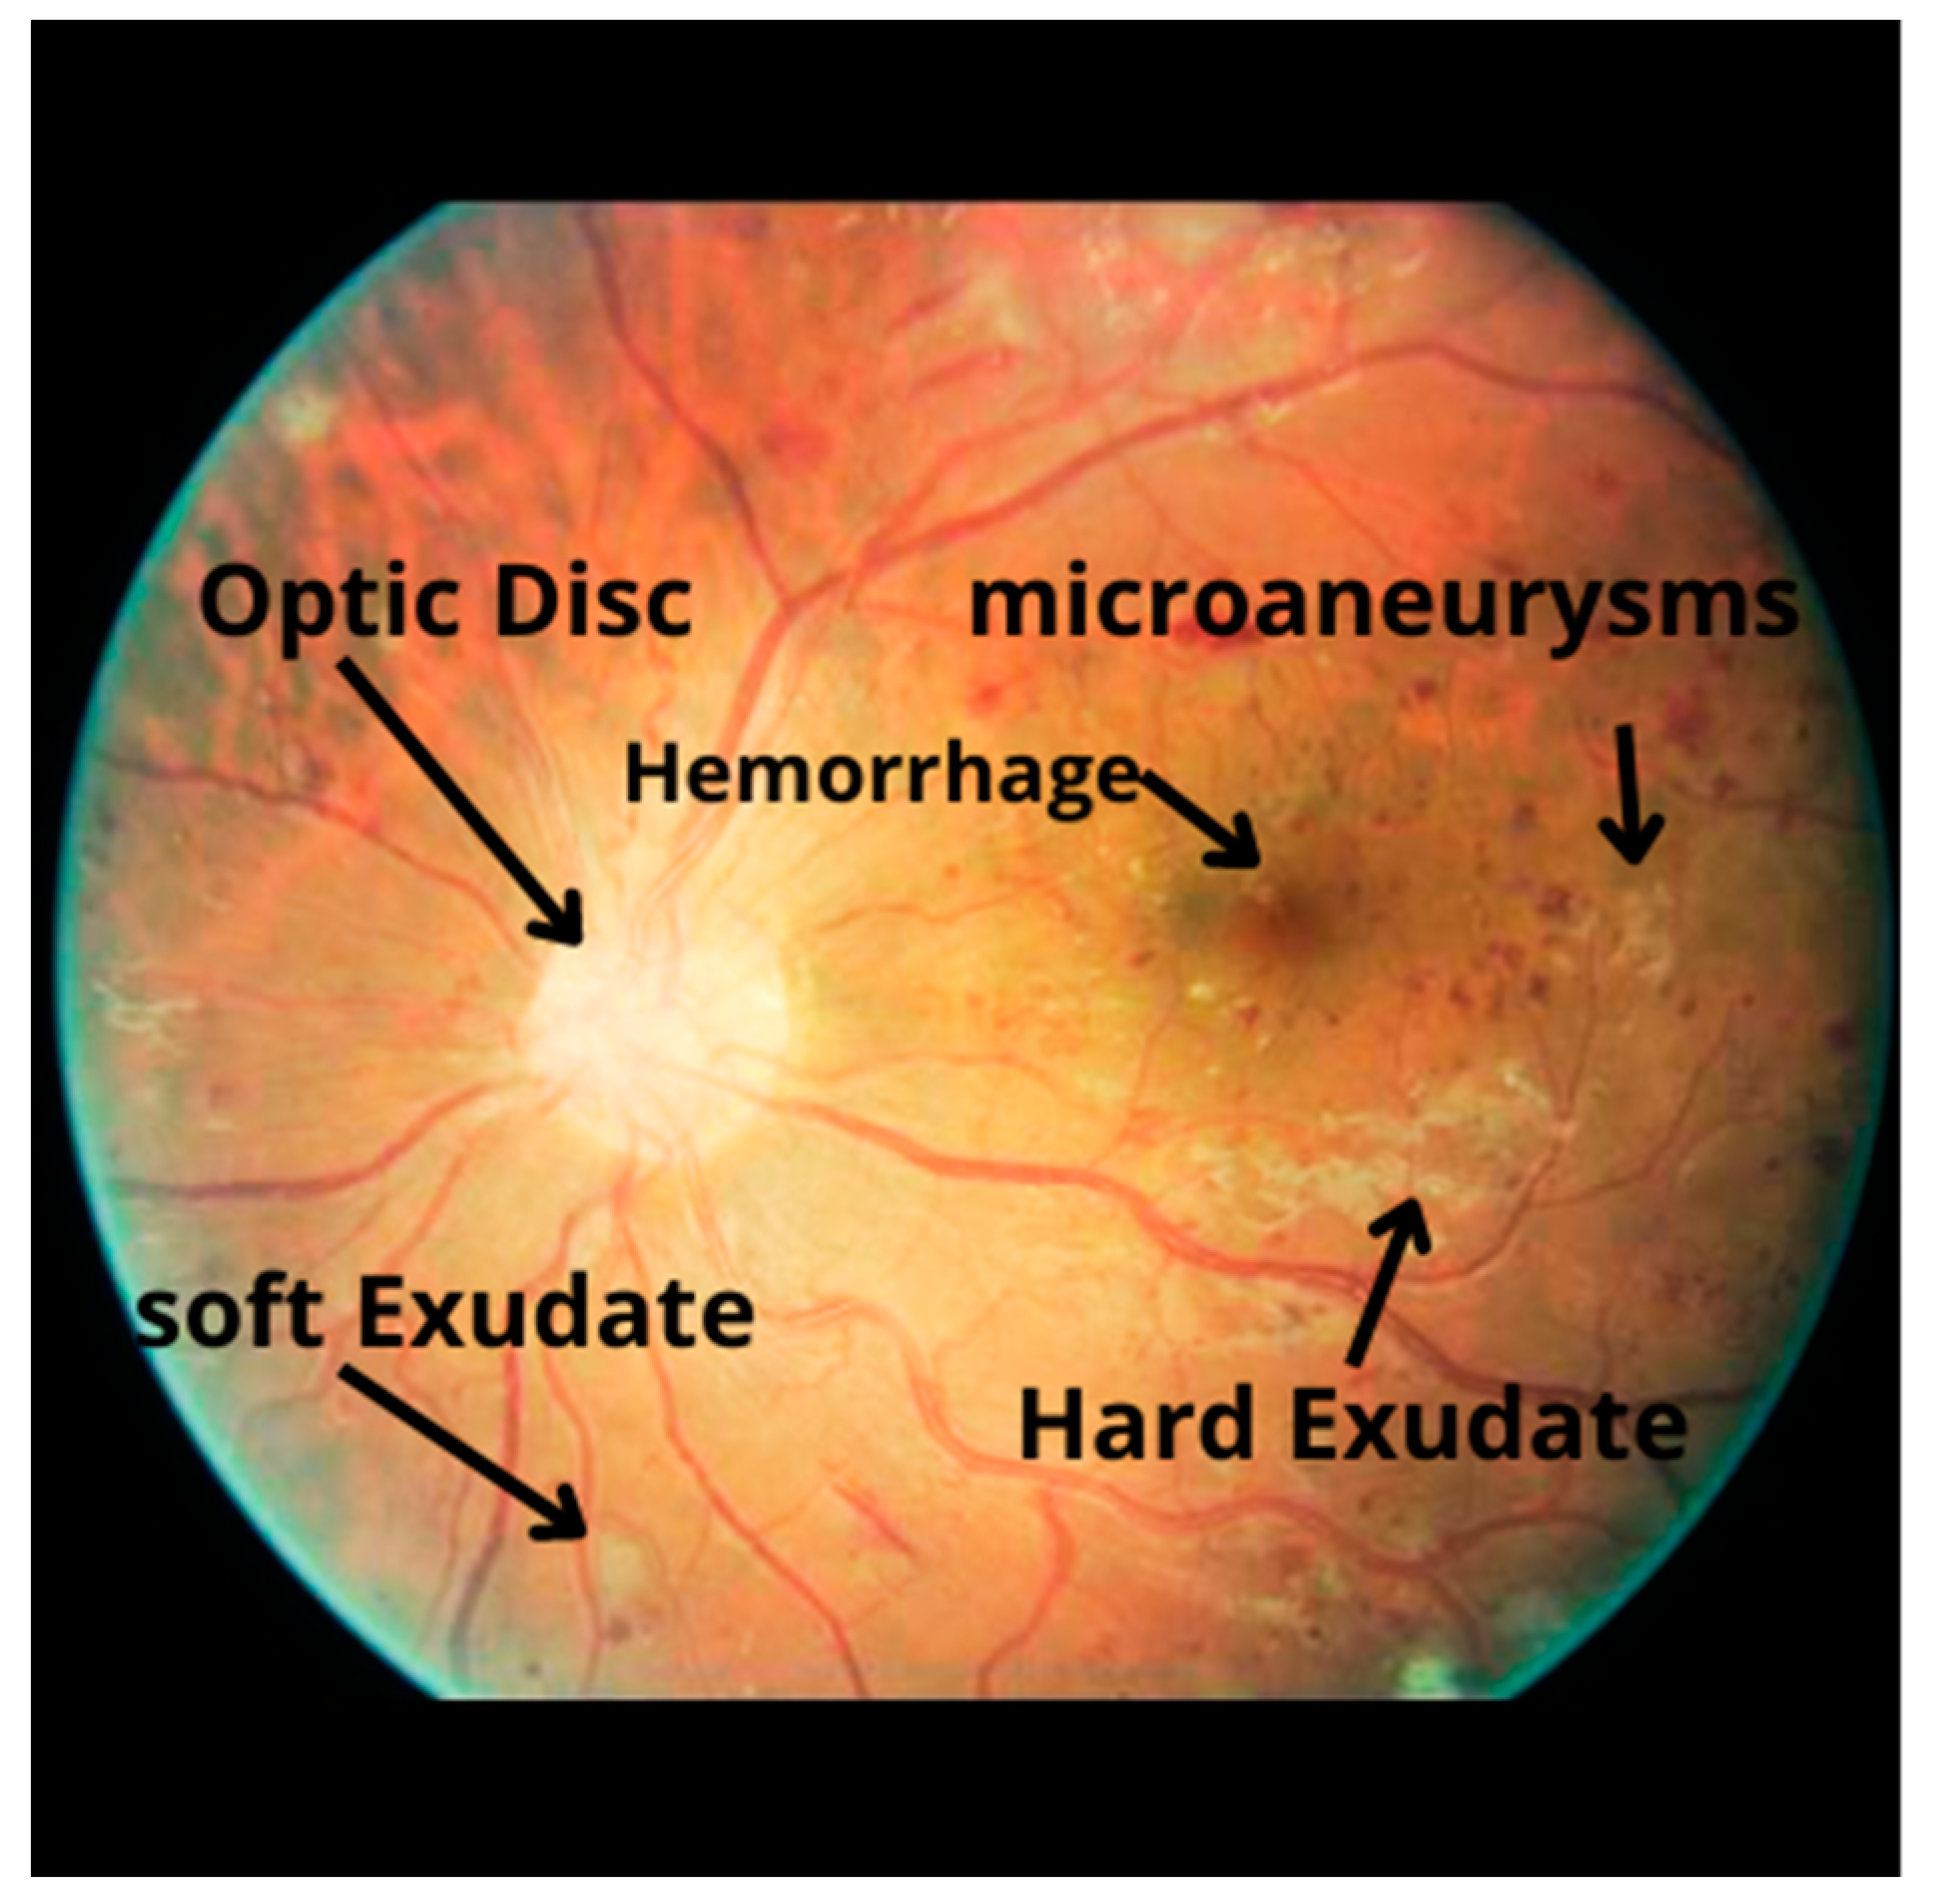
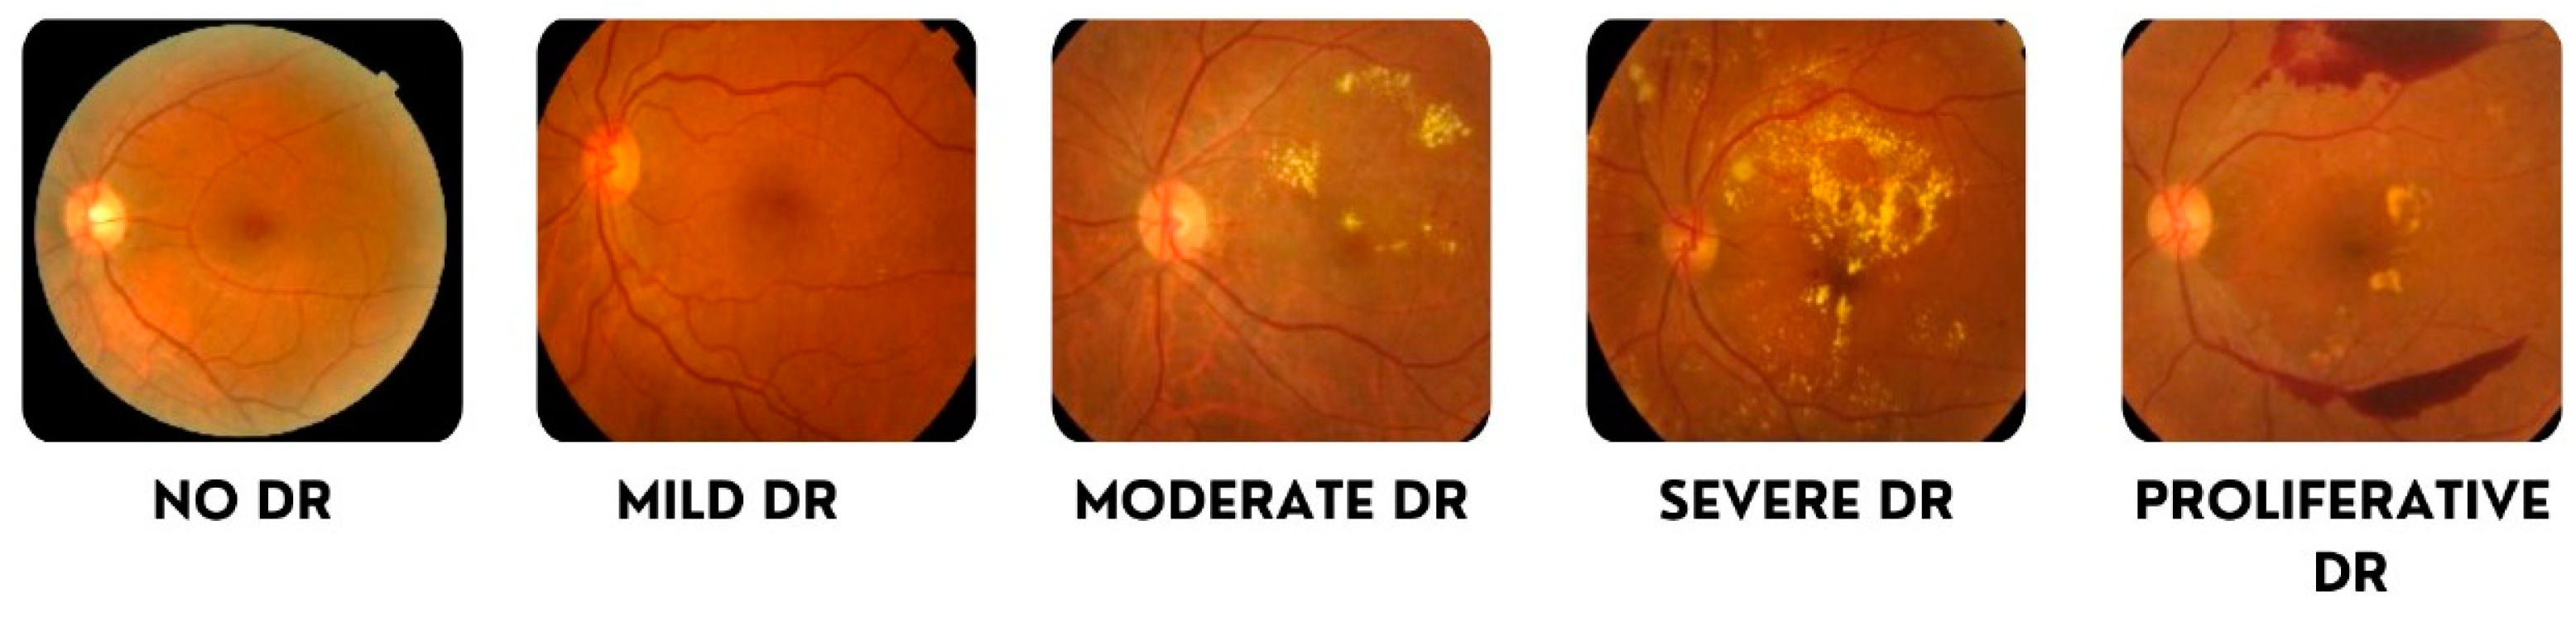
4.1. Data Undestading

Data collection is essential in the medical field, particularly for building reliable models for healthcare applications. For this study, we utilized the widely recognized APTOS 2019 Blindness Detection dataset from Kaggle, which is a popular resource for diabetic retinopathy detection. The dataset consists of 35,216 retinal images labeled across five diabetic retinopathy (DR) severity levels:
  • 0: No DR
  • 1: Mild
  • 2: Moderate
  • 3: Severe
  • 4: Proliferative DR
The images were taken using fundus photography under a variety of imaging conditions, which introduces real-world challenges such as variability in focus, exposure, and artifacts. The images come from multiple clinics and were captured using different cameras over time, adding further complexity to the dataset.
For our work, we focused on a subset of the data, comprising 3662 training images and 1928 validation images. These images have been annotated based on the severity levels of diabetic retinopathy, as described above. The following Figure 4 summarizes the classes of our training and testing images.
The Kaggle APTOS 2019 dataset was validated by our team in collaboration with Dr. Rabeb Touati and eye specialists. This involved cross-referencing with clinically validated datasets, reviewing image labels for accuracy, and ensuring data quality met real-world medical standards. This expert validation enhances the dataset’s reliability, ensuring that our model performs effectively under realistic medical conditions. The data were suitable for benchmarking diabetic retinopathy detection systems because of the robust preprocessing techniques applied. Table 2 displays the final distribution of the dataset, indicating the number of images per category.

4.2. Image Preprocessing

4.2.1. Feature Extraction

In image preprocessing, we ensured data quality and consistency by extracting images while preserving visual details. We applied resizing and pixel normalization for uniform scaling and effective data management. To enhance image representation and feature extraction, we used convolution and resizing techniques to emphasize key patterns and structures in retinal images presented in the Figure 1. Convolutional layers in our model were crucial for automatically detecting important visual patterns, which aids in precise feature extraction and accurate diabetic retinopathy analysis. Additionally, these layers helped reduce dimensionality, providing a more informative and compact data representation.

4.2.2. Noise Reduction

Image preprocessing plays a crucial role in enhancing the quality and effectiveness of diabetic retinopathy (DR) detection. The process begins with grayscale conversion, which simplifies the image data by reducing it from RGB to a single channel of intensity values. This step is essential for focusing on the critical features necessary for DR detection, achieved through Formula (5):
I g r a y = 0.2989 × R + 0.5870 × G + 0.1140 × B
The result is a single-channel image that minimizes computational complexity while retaining key visual information. Following this, CLAHE (Contrast Limited Adaptive Histogram Equalization) is applied to the grayscale image and enhanced the local contrast of the image, which making the DR features, such as microaneurysms, more visible.
To further refine the image, Gaussian smoothing is employed. This technique involves applying a Gaussian filter to the CLAHE-enhanced image to reduce noise while preserving important edges. The Gaussian filter is represented by the Formula (6):
                I S m o o t h = I C L A H E G σ
where G σ denotes the Gaussian kernel with standard deviation σ . This results in a smoothed image that facilitates better feature detection and segmentation.
Finally, median filtering is used to address any remaining noise, particularly salt-and-pepper noise, while maintaining edge integrity. By applying a median filter (7) to the smoothed image:
I m e d i a n = M e d i a n F i l t e r ( I s m o o t h ) .
The outcome is a further noise-reduced image that preserves fine details and edges, thereby enhancing the accuracy of subsequent feature extraction. Together, these preprocessing steps ensure that the image is optimally prepared for the detection of diabetic retinopathy, enhancing both feature visibility and overall model performance.

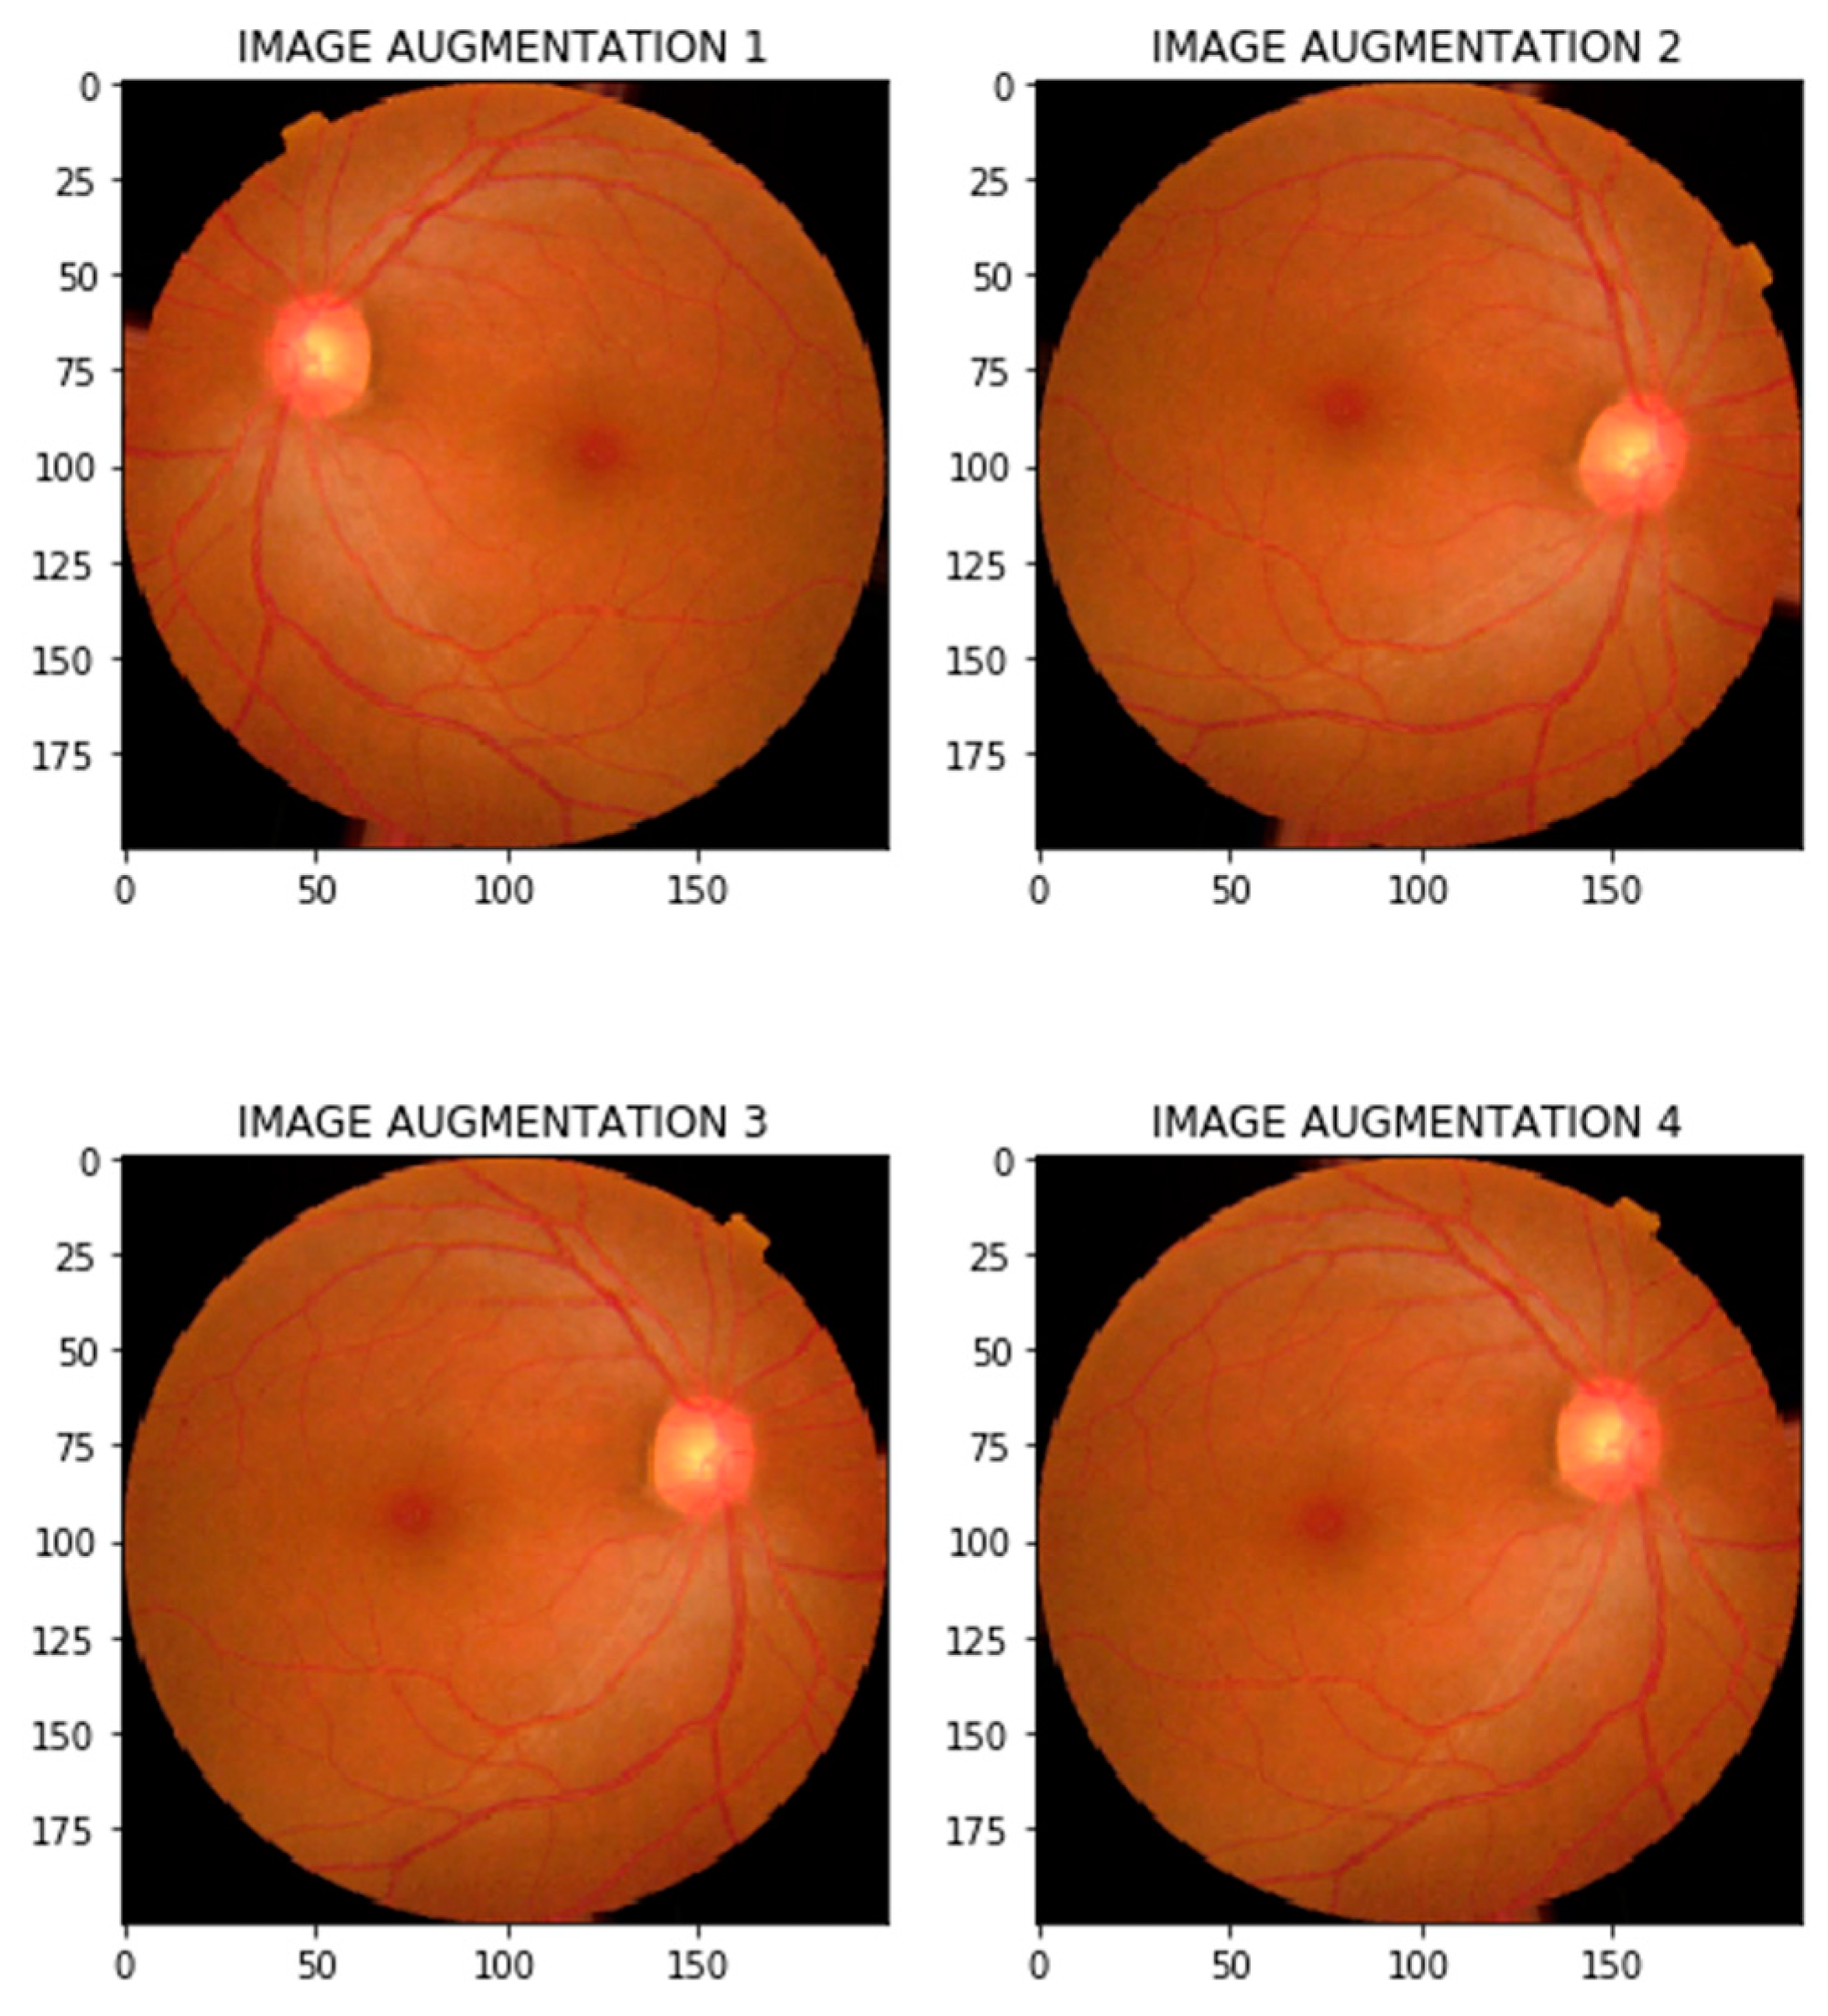
4.2.3. Data Augmentation

This project aimed to enhance a diabetic retinopathy detection model by addressing the challenges posed by limited, imbalanced, and noisy fundus image datasets. We used data augmentation methods such as rotation, resizing, flipping, cropping, shifting, and noise addition to increase the quantity, diversity, and quality of the data. By providing more varied and realistic data, we aimed to enhance the model’s generalization, reduce overfitting, and boost its ability to accurately detect diabetic retinopathy.
Figure 5 illustrates four examples of data augmentation applied to a fundus image:
Rotation (Image Augmentation 1): The image is rotated clockwise, introducing angular variations to help the model generalize to images captured at different orientations.
Horizontal Flipping (Image Augmentation 2): The image is mirrored horizontally to show changes in position and make sure the model doesn’t focus on one area.
Shifting (Image Augmentation 3): The image is shifted downward and to the right, mimicking misaligned or off-centered fundus images that may occur during real-world data collection.
Resizing (Image Augmentation 4): The image is scaled, simulating changes in camera focus or image acquisition distance, to improve robustness to size variations.
These changes make the data more diverse and help the model do better on unknown data. They also reduce the chance of overfitting and make diabetic retinopathy detection more accurate.

4.2.4. Data Balancing

To ensure fair and accurate diabetic retinopathy classification, it is crucial to address class imbalance. When certain classes dominate the dataset, models can become biased, performing well on majority classes but poorly on minority ones. By using techniques like RandomOverSampler from the imbalanced-learn library we can balance the dataset by duplicating samples from minority classes. This process ensures each class has an equal number of samples, 2805, allowing the model to learn and predict across all categories with greater accuracy and fairness.

4.3. Modeling Bulding

In our research, we present the Diabetic Retinopathy Compact Convolutional Transformer (DRCCT), a cutting-edge model specifically designed for accurately classifying and detecting the stages of diabetic retinopathy. As illustrated in Figure 6, our DRCCT workflow is designed with a streamlined architecture that significantly boosts efficiency, especially when working with smaller datasets. It begins with a careful process of collecting and preprocessing retinal images, utilizing median filtering alongside Contrast Limited Adaptive Histogram Equalization (CLAHE) to enhance image quality. To tackle the issue of class imbalance, the model integrates a RandomOverSampler, ensuring equitable representation across different classes. A key feature of the DRCCT’s cutting-edge design is its combination of convolutional tokenization and transformer encoder components, which contribute to its effectiveness. The convolutional tokenization technique efficiently transforms the incoming images into useful tokens, capturing vital details and minimizing dimension. Attention mechanisms are used to identify and classify subtle differences in diabetic retinopathy stages in the transformer encoder. The conventional notion that transformer models require extensive computational resources is defied by this unique architecture.
The model shown in Figure 7 incorporates convolutional tokenization with four filter sizes (16, 32, 64, 128) to generate patch sequences, enabling the capture of features at multiple scales. Positional embeddings are added to preserve the spatial relationships within the patches. The architecture consists of the following key components
  • Input Layer:
Shape: (None, 112, 112, 3)
Accepts retinal images of size 112 × 112 with 3 color channels (RGB).
  • CCT Tokenizer:
Shape: (None, 4, 128)
Performs convolutional tokenization, producing sequences of 128-dimensional feature patches. Multiple filter sizes (16, 32, 64, 128) enable the model to capture a diverse range of visual patterns.
  • Element-Wise Addition (tf.operators_add):
Shape: (None, 4, 128)
Integrates information across tokenized sequences using element-wise addition, combining features from different sources.
  • Layer Normalization 1:
Shape: (None, 4, 128)
  • Stabilizes training and accelerates convergence by normalizing token sequences.
Multi-Head Attention (AMH):
Shape: (None, 4, 128)
Captures complex dependencies and relationships across patches, ensuring global context awareness.
  • Stochastic Depth:
Shape: (None, 4, 128)
Improves generalization through random layer dropping, acting as a regularization technique during training.
  • Add:
Shape: (None, 4, 128)
Combines residual information from previous layers, refining the feature representations.
  • Layer Normalization 2:
Shape: (None, 4, 128)
Ensures stability and consistency of the processed sequences.
Finally, a sequence pooling layer extracts the most informative features from the encoded patches, which are then passed to a fully connected dense layer for the final classification task.
Furthermore, the DRCCT approach aims to preserve the spatial connections in visual information through the utilization of enhanced spatial encodings. This is essential for precisely examining retinal formations. The design also features stochastic depth regularization, boosting generalization and helping avoid overfitting in clinical scenarios. Its adaptive multi-head attention mechanism concentrates on vital regions like the optic disc and microaneurysms, ensuring key features are highlighted for diagnosis. In conclusion, DRCCT has been exclusively trained for detecting diabetic retinopathy, with fine-tuned parameters that improve its capability to detect minute disease indicators. Overall, these innovations make DRCCT a tailored and efficient tool for enhancing diagnostic precision in healthcare systems, specifically in the case of DR.

5. Results and Discussion

5.1. Training and Validation Accuracy

The following Figure 8 presents the results for the balanced APTOS dataset, where data balancing was performed using Random Oversampling to address class imbalances. The dataset was split into 80% for training and 20% for validation. The DRCCT model, comprising 2,342,326 parameters, was trained using the AdamW optimizer over 100 epochs, demonstrating robust learning and excellent generalization capabilities. This comprehensive architecture enabled the model to efficiently analyze retinal images and classify the severity of diabetic retinopathy with high accuracy. The training accuracy steadily increased from 25% at epoch 0 to 99% at epoch 100, while the validation accuracy began at 35% and reached 95% by the end of the 100 epochs. During the 100 epochs, the validation accuracy consistently exceeded the training accuracy, indicating that the model did not overfit the training data. Figure 8 shows that the model can be generalized well and adapt to new, previously unseen data.

5.2. Confusion Matrix Analysis

These metrics demonstrate that the model can balance the trade-offs between avoiding false positives and false negatives and can capture the most relevant samples for each class. The confusion matrix presented in Figure 9 evaluates the performance of the classification model for diagnosing diabetic retinopathy.
The confusion matrix reveals that while the DRCCT model demonstrates a strong performance in certain classes, like No_DR, it struggles significantly with others, particularly Mild, Moderate, Severe, and Proliferate_DR. The high number of false positives in the Mild class and false negatives in the Moderate class suggest that the model may require further fine-tuning or additional data to better distinguish between these stages. The complete miss in the Severe and Proliferate_DR classes indicates a need for model refinement, especially when taking into account the clinical significance of accurately detecting these advanced stages of diabetic retinopathy.
The performance of a classification model is evaluated using four key metrics. True positives (TP) are the cases where the model correctly identifies images as belonging to a positive class, such as a specific stage of diabetic retinopathy (DR). True negatives occur when the model correctly classifies images that don’t belong to a positive class, such as identifying “No DR”. False positives (FP) happen when the model incorrectly labels an image as positive, like detecting “Mild DR” in an image with “No DR”. Conversely, false negatives (FN) occur when the model fails to detect a positive case, such as classifying “Severe DR” as “No DR”. There are five categories for images in the model, representing the stages of DR: 0 (no disease), 1 (mild disease), 2 (moderate disease), 3 (severe disease), and 4 (proliferative disease).
A c c u r a c y = T P + T N / T P + T N + F P + F N
P r e c i s i o n = T P / T P + F P
F 1 s c o r e = 2 × p r e c i s i o n × r e c a l l / ( p r e c i s i o n + r e c a l l )
S p e c i f i c i t y = T N T N + F P
Specificity, as defined by Equation (11), is sometimes known as the false positive rate (FPR). It is the counterpart to sensitivity and measures the model’s ability to correctly identify negative samples. Mathematically, specificity is expressed as follows:
S e n s i t i v i t y = T P T P + F N
Sensitivity is a positive predictive value referred as true positive rate (TPR) and assesses the ratio of correctly predicted positive results to the total number of predicted positives. It is determined by Equation (12).
The confusion matrix offers critical insights into the model’s capability to classify diabetic retinopathy (DR) stages. The dominance of diagonal elements, such as 531, 600, and 553, indicates high accuracy in predicting cases across different stages, reflecting strong overall performance. Nevertheless, non-diagonal values highlight some challenges. For instance, 20 “Moderate” DR cases were incorrectly labeled as “Mild”, likely due to overlapping clinical features. Misclassifications between more distinct stages, like “Mild” and “Severe”, are rare, demonstrating the model’s ability to avoid significant errors. The model excels at recognizing severe DR stages, with minimal errors in the “Severe” category. However, “Mild” cases show some confusion, particularly with “Moderate”, indicating difficulty in identifying subtle early signs of the disease. Metrics-wise, the model achieves high true positive rates while attaining low false positives and false negatives. For example, false positive values like 4 and 9 and false negatives in the “Moderate” class suggest areas for improvement, especially in distinguishing early and mid-stage DR.

5.3. Model Testing and Metrics

We use accuracy and precision, defined by Equations (8) and (9), respectively, as metrics to assess the correctness of our classification model. Accuracy measures the overall effectiveness of the model in correctly classifying both positive and negative instances, while precision focuses on the accuracy of the positive predictions. The F1-score combines precision and sensitivity into a single metric. It is calculated using Equation (10). The model was tested on a new dataset to evaluate its generalization performance. It achieved high accuracy, with precision and recall scores of 96.93% and 98.89%, respectively. The model also achieved the following metrics:
  • Testing Loss: 0.462828
  • Testing Accuracy: 96.93%
  • Average Confidence (AC): 98.25%
  • Testing F1-Score: 96.96%
  • Testing Recall (Sensitivity): 98.89%
The model’s test performances are evaluated through key metrics, including sensitivity, specificity, precision, and F1-score. These metrics confirm the model’s ability to correctly classify samples across different classes, effectively balancing false positives and negatives.
The close alignment between training and validation losses suggests minimal overfitting and robust performance, supporting the model’s high precision and recall scores across various diabetic retinopathy stages. This balance between training and validation losses underscores the model’s reliability and effectiveness in accurately classifying diabetic retinopathy.
As shown in Figure 10, our results indicate that our model performs well, with an average F1-score of 0.973 across all classes. This confirms that the model is effective at detecting true positives while minimizing false positives.

5.4. Training and Validation Loss

The training and validation loss values, as depicted in Figure 11, demonstrate the DRCCT model’s effective learning and generalization. The consistently low training loss, decreasing to around 0.03, indicates that the model is effectively minimizing errors on the training dataset. Similarly, the validation loss, stabilizing at approximately 0.04, reflects the model’s strong ability to generalize to new, unseen data.

5.5. Advanced Optimization Strategies

5.5.1. Optimizer

In the DRCCT model, the AdamW optimizer was selected for its superior handling of weight decay, which effectively prevents overfitting by decoupling weight decay from the gradient update process. The adaptive learning rate mechanism of AdamW adjusts for each parameter based on gradient moments, ensuring stable and efficient convergence. Its momentum-based updates and bias correction techniques further enhance training stability and speed, making it well-suited for the model’s complex architecture, which combines convolutional networks and transformers. The AdamW update rule is calculated by:
θ t = θ t 1 η ( m ^ t v ^ t + ϵ + λ × θ t 1 )
where θ t represents the parameters at time step t , η is the learning rate, m ^ t and v ^ t are the bias-corrected first and second moment estimates, θ   = 10 8 is a small constant for numerical stability, and λ = 0.01 is the weight decay coefficient.

5.5.2. Cost Function

Loss functions are crucial in guiding a model’s learning process by minimizing errors and improving performance. The selection of a loss function depends on the specific goals and data characteristics. For the DRCCT model, Categorical Cross-Entropy was chosen due to its effectiveness in multi-class classification tasks, such as diabetic retinopathy severity classification. It measures the divergence between the model’s predicted probability distribution and the actual distribution of the classes, directly aiding in accuracy improvement. The Categorical Cross-Entropy loss function is defined as:
L o s s C E E = n = 1 N y i log ( y ^ i )
where N is the number of classes, y i is the ground truth label for class i, and y ^ i is the predicted probability for class i.
Focal Loss can be a viable alternative when data imbalances are a concern. It focuses on more challenging examples and ensures a harmonious performance across all classes. The Focal Loss function is as follows (15).
L o s s C E E = n = 1 N ( 1 y ^ i ) γ y i log ( y ^ i )
where γ is the focusing parameter that adjusts the rate at which easy examples are down-weighted.

5.5.3. Learning Rate Adjustment

The learning rate is one of the most crucial hyperparameters in deep learning, governing how quickly or slowly a model adapts to the training data. Selecting an appropriate learning rate is essential for effective convergence. In this work, several techniques were implemented to optimize the learning rate:
Cyclical Learning Rate (CLR): CLR varies the learning rate cyclically between a minimum and maximum value. By allowing the learning rate to periodically increase and decrease, the model can escape local minima, leading to better convergence. We set the base learning rate at 1 × 10⁻⁴ and the maximum at 1 × 10⁻³, which helped in stabilizing the training process and achieving more robust performance.

5.5.4. Regularization Techniques

Regularization is essential to prevent overfitting, especially when dealing with numerous parameters, as is common in transformer-based models like our DRCCT model. Several regularization methods were utilized.
Dropout: To mitigate overfitting, dropout was increased in the transformer blocks from 0.3 to 0.4. By randomly deactivating a fraction of neurons during training, dropout forces the model to learn more robust features that are not reliant on specific neurons.
L2 Regularization: Also known as weight decay, L2 regularization penalizes large weights by adding a regularization term to the loss function. This prevents the model from becoming overly complex and helps in maintaining generalization. In this study, an L2 regularization coefficient between 1 × 10⁻⁴ and 5 × 10⁻⁴ was applied.
Label Smoothing: To further reduce overfitting and make the model more tolerant to noisy labels, label smoothing was employed with a smoothing factor of 0.1. This technique reduces the confidence of the model in its predictions, which can help in preventing the model from becoming too confident and overfitting to the training data.

5.6. Results Overview

The DRCCT model shows consistently high performance across all metrics, effectively classifying diabetic retinopathy (DR) into five categories: No_DR, Mild, Moderate, Severe, and Proliferate_DR. Our model for classifying diabetic retinopathy (DR) across different severity levels demonstrates consistently high performance, with impressive metrics throughout.
Table 3 reveals that the model demonstrates exceptional precision and recall across all diabetic retinopathy (DR) classes. Notably, it achieves outstanding performance in the No_DR category, with a precision of 0.99, recall of 0.97, and an F1-score of 0.98. Similarly, in the Severe DR category, the model exhibits a precision of 0.96, a perfect recall of 1.00, and an F1-score of 0.98. These results underscore the model’s strong capability in accurately identifying both the absence and presence of severe DR. This high level of accuracy and the model’s effectiveness in capturing true positives are crucial in medical diagnostics, ensuring reliable identification of DR stages. Additionally, the F1-scores, ranging between 0.95 and 0.98 across all classes, reflect the model’s ability to balance precision and recall, making it dependable across various stages of DR. The DRCCT model stands out with its balanced performance across all DR classes, minimal overfitting, and high accuracy metrics. It is competitive with the latest models in the field and shows potential for practical application in medical diagnostics, where reliability and accuracy are critical.

5.7. Comparative Study of Results

As demonstrated by our DRCCT architecture, the performance of compact convolutional transformer (CCT) models surpass that of conventional convolutional neural network (CNN) models in key metrics such as precision, recall, and F1-score. Our results show that the DRCCT achieves a remarkable score of 0.973 across all categories, indicating not only superior precision but also a consistent capacity to maintain performance across various severity levels of diabetic relapse. This consistency is particularly noteworthy when compared to CNN-based models like ResNet-50 with Random Forest classifiers and ViT CNNs, which often exhibit fluctuating results across different datasets.
While some CNN architectures, such as the Xception pretrained model and Residual Block + CNN, report high accuracy, they frequently lack comprehensive metrics on precision and recall across multiple classes. In contrast, the DRCCT provides detailed performance metrics that clearly reflect its balanced efficacy across all severity levels of DR. The advanced design of CCT models facilitates the effective capture of spatial features and relationships within retinal images, which is crucial for precise classification.
Moreover, when evaluated alongside cutting-edge systems such as the Residual–Dense System and vision transformers using Masked Autoencoders (MAE), our model achieves F1-scores that are comparable to or surpass those of these more intricate architectures, showcasing its competitiveness while maintaining efficiency. In summary, CCT models, including the DRCCT, not only provide exceptional performance metrics but also demonstrate the robustness required for accurate classification of diabetic retinopathy severity, establishing them as sophisticated and practical options in clinical environments.
The performance of our DRCCT model is notably exceptional when compared to the various methods presented in Table 4, which summarizes the performance of different authors’ models alongside ours. For example, our model achieves an impressive F1-score of 0.97, exceeding the results of Sheikh and Qidwai’s transfer learning approach utilizing MobileNetV2, which reports a DR detection accuracy of 90.8% and an RDR accuracy of 92.3% [6]. Furthermore, although Gao, Leung, and Miao’s efficient CNN attains an accuracy of 90.5% [7], the DRCCT consistently exhibits a higher F1-score, highlighting its superior performance.
Additionally, our model demonstrates significant improvements over the ResNet-50 combined with a Random Forest classifier proposed by Yaqoob et al. [9], which achieved 96% accuracy on the Messidor-2 dataset and 75.09% on EyePACS. The DRCCT model performs on par with Messidor-2 while surpassing EyePACS, highlighting its robustness across diverse datasets. Furthermore, the DRCCT outperforms other models, such as the Xception pretrained model, which achieved a training accuracy of 94% and a test accuracy of 89%. Notably, our model’s F1-score of 0.97 reflects a more balanced performance, indicating its effectiveness in handling class imbalances and maintaining consistency across all metrics.
Furthermore, although numerous models, including those utilizing deep learning methods like the Residual–Dense System and ViT CNN, achieve high performance metrics, the architecture of the DRCCT successfully integrates the advantages of convolutional networks and transformers. This integration enables the model to capture both local and global features within retinal images, a capability essential for precise classification of diabetic retinopathy. Overall, the DRCCT’s outstanding performance across critical metrics reinforces its status as a sophisticated and dependable solution for practical applications in diabetic retinopathy detection, showcasing its potential for clinical implementation.
A researcher in LabSTICC and Pixemantic Startup, specializing in deep healthcare, created a cutting-edge platform for diabetic retinopathy detection. Pixemantic developers helped deploy a web application powered by our DRCCT model, which has shown remarkable accuracy, including in challenging left eye cases, as seen in Figure 12. This project, supported by Dr. Rabeb Touati’s expertise, exemplifies the power of AI in advancing early diagnosis and improving patient care.

6. Conclusions and Perspectives

6.1. Summary of Findings

This research has effectively developed the Diabetic Retinopathy Compact Convolutional Transformer (DRCCT) model, demonstrating its high precision in classifying and detecting the stages of diabetic retinopathy. By merging convolutional layers with transformer techniques, the DRCCT model achieved remarkable results, including an average F1-score of 0.973, a precision of 96.93%, and a recall of 98.89%. The training and validation accuracy increased steadily from 25% at epoch 0 to 99% at epoch 100, while the validation accuracy began at 35% and reached 95% by the end of the 100 epochs. The model’s generalization ability and its avoidance of overfitting are highlighted by this consistent improvement in accuracy and the fact that the validation accuracy consistently exceeded the training accuracy. It surpasses existing models such as MobileNetV2, ResNet-50 with Random Forest classifiers, and vision transformers with Masked Autoencoders, offering superior precision and robustness in addressing class imbalance and reducing false positives. The successful use of advanced regularization techniques, such as dropout and stochastic depth, emphasizes the model’s versatility and its potential for clinical integration, where early and accurate detection is vital for effective treatment.

6.2. Limitations

The DRCCT model, though highly effective, encounters difficulties when dealing with imbalanced datasets and closely resembling data classes, especially in distinguishing between stages such as “Mild” and “Moderate” diabetic retinopathy, which can lead to occasional misclassifications. Variability in data quality across patients, including differences in retinal image clarity and localized pathology, also impacts the model’s precision. Moreover, the large number of parameters necessitates meticulous tuning when applied to new datasets. Implementing region-specific datasets, adaptive learning methods, and unsupervised approaches such as dimensionality reduction could potentially mitigate these shortcomings in the future. These methods can make the model work better for many different types of patients and help it classify subtle diseases better.

6.3. Future Directions in Securing AI-Driven Healthcare Systems

In healthcare diagnosis systems like our diabetic retinopathy detection model, our ongoing research aims to address critical security vulnerabilities, particularly systematic poisoning attacks. These attacks can compromise machine learning models by injecting malicious data into training sets, potentially leading to misdiagnoses or missed cases. For example, introducing incorrect retinal images could negatively impact the detection of diabetic retinopathy, thereby compromising patient safety [29].
Additionally, we recognize the challenges of energy-efficient, long-term health monitoring through AI-powered IoT devices. Compromised devices, such as pacemakers or glucose monitors integrated into our monitoring systems, could manipulate patient data. This underscores the importance of both energy efficiency and security, particularly for continuous monitoring, where vulnerabilities may persist over time [30].
Furthermore, as we incorporate AI into the internet of things for future applications such as smart hospitals, we recognize the additional risks involved. In this context, AI-driven IoT systems responsible for managing real-time patient data may be susceptible to compromise, resulting in privacy breaches or manipulation of health outcomes. Our research will also address AI security threats like adversarial attacks, which can significantly impact diagnostic accuracy. Minor alterations to retinal images, undetectable to the human eye, may influence the model’s outputs, resulting in incorrect diagnoses. As a result, we emphasize the importance of robust model training, anomaly detection, and adversarial training to safeguard the integrity of our detection models.

Author Contributions

Conceptualization, M.T. and R.T.; methodology, M.T.; software, M.T.; validation, L.N., R.T. and F.B.; formal analysis, M.T.; investigation, M.T. and R.T.; resources, F.B.; data curation, M.T.; writing original draft preparation, M.T.; writing review and editing, R.T. and L.N.; visualization, M.T. and S.B.Y.; supervision, F.B., L.N., R.T. and S.B.Y.; project administration, L.N. and F.B. All authors have read and agreed to the published version of the manuscript.

Funding

This research did not receive any funding.

Institutional Review Board Statement

Not applicable.

Informed Consent Statement

Not applicable.

Data Availability Statement

The dataset used in this research is available at https://www.kaggle.com/datasets/mariaherrerot/aptos2019 (accessed on 27 June 2019).

Conflicts of Interest

The authors declare no conflict of interest.

References

  1. Bidwai, P.; Gite, S.; Pahuja, K.; Kotecha, K. A Systematic Literature Review on Diabetic Retinopathy Using an Artificial Intel-Ligence Approach. Big Data Cogn. Comput. 2022, 6, 152. [Google Scholar] [CrossRef]
  2. Subramanian, S.; Mishra, S.; Patil, S.; Shaw, K.; Aghajari, E. Machine Learning Styles for Diabetic Retinopathy Detection: A Review and Bibliometric Analysis. Big Data Cogn. Comput. 2022, 6, 154. [Google Scholar] [CrossRef]
  3. Shamshad, F.; Khan, S.; Zamir, S.W.; Khan, M.H.; Hayat, M.; Khan, F.S.; Fu, H. Transformers in Medical Imaging: A Survey. Med. Image Anal. 2023, 88, 102802. [Google Scholar] [CrossRef] [PubMed]
  4. Touati, M.; Nana, L.; Benzarti, F. A Deep Learning Model for Diabetic Retinopathy Classification. In Digital Technologies and Applications, Proceedings of the ICDTA 2023, Fez, Morocco, 27–28 January 2023; Motahhir, S., Bossoufi, B., Eds.; Lecture Notes in Networks and Systems; Springer: Cham, Switzerland, 2023; Volume 669, p. 669. [Google Scholar]
  5. Touati, M.; Nana, L.; Benzarti, F. Enhancing diabetic retinopathy classification: A fusion of ResNet50 with attention mechanism. In Proceedings of the IEEE/IFAC 10th International Conference on Control, Decision and Information Technologies (CoDIT), Valletta, Malta, 1–4 July 2024. [Google Scholar]
  6. Sheikh, S.; Qidwai, U. Using MobileNetV2 to Classify the Severity of Diabetic Retinopathy. Int. J. Simul.-Syst. Sci. Technol. 2020, 21, 16.1–16.6. [Google Scholar] [CrossRef]
  7. Gao, J.; Leung, C.; Miao, C. Diabetic Retinopathy Classification Using an Efficient Convolutional Neural Network. In Proceedings of the 2019 IEEE International Conference on Agents (ICA), Jinan, China, 18–21 October 2019. [Google Scholar]
  8. Wang, S.; Wang, X.; Hu, Y.; Shen, Y.; Yang, Z.; Gan, M.; Lei, B. Diabetic retinopathy diagnosis using multichannel generative adversarial network with semisupervision. IEEE Trans. Autom. Sci. Eng. 2020, 18, 574–585. [Google Scholar] [CrossRef]
  9. Yaqoob, M.K.; Ali, S.F.; Bilal, M.; Hanif, M.S.; Al-Saggaf, U.M. ResNet-based deep features and random forest classifier for diabetic retinopathy detection. Sensors 2021, 21, 3883. [Google Scholar] [CrossRef] [PubMed]
  10. Dharmana, M.M.; Aiswarya, M.S. Pre-diagnosis of Diabetic Retinopathy using Blob Detection. In Proceedings of the 2020 Second International Conference on Inventive Research in Computing Applications (ICIRCA), Coimbatore, India, 15–17 July 2020; IEEE: Piscataway, NJ, USA, 2020; pp. 98–101. [Google Scholar]
  11. Toledo-Cortés, S.; De La Pava, M.; Perdomo, O.; González, F.A. Hybrid Deep Learning Gaussian Process for Diabetic Retinopathy Diagnosis and Uncertainty Quantification. In Proceedings of the International Workshop on Ophthalmic Medical Image Analysis, Lima, Peru, 8 October 2020; Springer: Cham, Switzerland, 2020; pp. 206–215. [Google Scholar]
  12. Vo, H.H.; Verma, A. New deep neural nets for fine-grained diabetic retinopathy recognition on hybrid color space. In Proceedings of the 2016 IEEE International Symposium on Multimedia (ISM), San Jose, CA, USA, 11–13 December 2016; IEEE: Piscataway, NJ, USA, 2016; pp. 209–215. [Google Scholar]
  13. Vani, K.S.; Praneeth, P.; Kommareddy, V.; Kumar, P.R.; Sarath, M.; Hussain, S.; Ravikiran, P. An Enhancing Diabetic Retinopathy Classification and Segmentation based on TaNet. Nano Biomed. Eng. 2024, 16, 85–100. [Google Scholar] [CrossRef]
  14. Alwakid, G.; Gouda, W.; Humayun, M.; Jhanjhi, N.Z. Enhancing diabetic retinopathy classification using deep learning. Digit. Health 2023, 9, 20552076231203676. [Google Scholar] [CrossRef] [PubMed]
  15. Nazih, W.; Aseeri, A.O.; Atallah, O.Y.; El-Sappagh, S. Vision transformer model for predicting the severity of diabetic retinopathy in fundus photography-based retina images. IEEE Access 2023, 11, 117546–117561. [Google Scholar] [CrossRef]
  16. Al-Hammuri, K.; Gebali, F.; Kanan, A.; Chelvan, I.T. Vision transformer architecture and applications in digital health: A tutorial and survey. Vis. Comput. Ind. Biomed. Art 2023, 6, 14. [Google Scholar] [CrossRef]
  17. Khan, I.U.; Raiaan, M.A.K.; Fatema, K.; Azam, S.; Rashid, R.u.; Mukta, S.H.; Jonkman, M.; De Boer, F. A Computer-Aided Diagnostic System to Identify Diabetic Retinopathy, Utilizing a Modified Compact Convolutional Transformer and Low-Resolution Images to Reduce Computation Time. Biomedicines 2023, 11, 1566. [Google Scholar] [CrossRef]
  18. Bashir, I.; Sajid, M.Z.; Kalsoom, R.; Ali Khan, N.; Qureshi, I.; Abbas, F.; Abbas, Q. RDS-DR: An Improved Deep Learning Model for Classifying Severity Levels of Diabetic Retinopathy. Diagnostics 2023, 13, 3116. [Google Scholar] [CrossRef]
  19. Berbar, M. Features extraction using encoded local binary pattern for detection and grading diabetic retinopathy. Health Inf. Sci. Syst. 2022, 10, 14. [Google Scholar] [CrossRef] [PubMed]
  20. R., Y.; Raja Sarobin M., V.; Panjanathan, R.; S., G.J.; L., J.A. Diabetic Retinopathy Classification Using CNN and Hybrid Deep Convolutional Neural Networks. Symmetry 2022, 14, 1932. [Google Scholar] [CrossRef]
  21. Ghaffar Nia, N.; Kaplanoglu, E.; Nasab, A. Evaluation of artificial intelligence techniques in disease diagnosis and prediction. Discov. Artif. Intell. 2023, 3, 5. [Google Scholar] [CrossRef]
  22. Yang, Y.; Cai, Z.; Qiu, S.; Xu, P. Vision transformer with masked autoencoders for referable diabetic retinopathy classification based on large-size retina image. PLoS ONE 2024, 19, e0299265. [Google Scholar] [CrossRef] [PubMed] [PubMed Central]
  23. Kumar, N.S.; Karthikeyan, B.R. Diabetic Retinopathy Detection using CNN, Transformer and MLP based Architectures. In Proceedings of the 2021 International Symposium on Intelligent Signal Processing and Communication Systems (ISPACS), Hualien City, Taiwan, 16–19 November 2021; Available online: https://ieeexplore.ieee.org/abstract/document/9651024 (accessed on 28 December 2021).
  24. Wu, J.; Hu, R.; Xiao, Z.; Chen, J.; Liu, J. Vision Transformer-based recognition of diabetic retinopathy grade. Med. Phys. 2021, 48, 7850–7863. [Google Scholar] [CrossRef] [PubMed]
  25. Islam, K. Recent advances in vision transformer: A survey and outlook of recent work. arXiv 2022, arXiv:2203.01536. [Google Scholar] [CrossRef]
  26. Hassani, A.; Walton, S.; Shah, N.; Abuduweili, A.; Li, J.; Shi, H. Escaping the Big Data Paradigm with Compact Transformers. arXiv 2021, arXiv:2104.05704. [Google Scholar]
  27. Dosovitskiy, A.; Beyer, L.; Kolesnikov, A.; Weissenborn, D.; Zhai, X.; Unterthiner, T.; Dehghani, M.; Minderer, M.; Heigold, G.; Gelly, S.; et al. An image is worth 16x16 words: Transformers for image recognition at scale. arXiv 2020, arXiv:2010.11929. [Google Scholar] [CrossRef]
  28. Wang, Z.; Yin, Y.; Shi, J.; Fang, W.; Li, H.; Wang, X. Zoom-in-net: Deep mining lesions for diabetic retinopathy detection. In Proceedings of the Medical Image Computing and Computer Assisted Intervention MICCAI 2017: 20th International Conference, Quebec City, QC, Canada, 11–13 September 2017; Springer International Publishing: Cham, Switzerland, 2017. Part III. pp. 267–275. [Google Scholar]
  29. Jagielski, M.; Oprea, A.; Biggio, B.; Liu, C.; Nita-Rotaru, C.; Li, B. Manipulating Machine Learning: Poisoning Attacks and Countermeasures for Regression Learning. IEEE Secur. Priv. 2018, 16, 88–96. [Google Scholar]
  30. Nia, A.M.; Mozaffari-Kermani, M.; Sur-Kolay, S.; Raghunathan, A.; Jha, N.K. Energy-Efficient Long-Term Continuous Personal Health Monitoring. IEEE Trans. Multi-Scale Comput. Syst. 2015, 1, 85–98. [Google Scholar] [CrossRef]
Figure 1. Diabetic retinopathy: key features.
Bdcc 09 00009 g001
Figure 2. Transformer encoder block in vision transformer with multi-head self-attention module.
Bdcc 09 00009 g002
Figure 3. Compact convolutional network architecture.
Bdcc 09 00009 g003
Figure 4. Diabetic retinopathy classes.
Bdcc 09 00009 g004
Figure 5. Data augmentation operation.
Bdcc 09 00009 g005
Figure 6. Our DRCCT workflow.
Bdcc 09 00009 g006
Figure 7. Model composition.
Bdcc 09 00009 g007
Figure 8. Training and validation accuracy.
Bdcc 09 00009 g008
Figure 9. Confusion matrix of DRCCT.
Bdcc 09 00009 g009
Figure 10. Multi-class classification performance of the model: metrics and results.
Bdcc 09 00009 g010
Figure 11. Training and validation loss.
Bdcc 09 00009 g011
Figure 12. Left eye prediction.
Bdcc 09 00009 g012
Table 1. Comparison of neural network architectures: CNNs, RNNs, and ViTs.
AspectCNNsRNNsViTs
ArchitectureConvolutional layersSequential recurrent layersTransformer encoder with self-attention
Data ProcessingLocal patterns, spatial hierarchiesSequential informationDependencies, global integration
Feature LearningLocal features, sequential learningGlobal features, entire sequenceLocal integration into patches, global integration
Receptive FieldLocalLocal (sequential)Global
Feature EngineeringMore manual, learns from dataMore manual, learns from dataLess manual, learns from data
ScalabilityAverageLow (sequential processing)High (parallel processing)
Table 2. Distribution of the DR dataset.
ClassesTrain Set Test Set
No DR2192549
Mild592148
Moderate1518380
Proliferative DR472118
Severe28472
Table 3. Comprehensive results summary table.
MetricNo_DRMildModerateSevereProliferateMicro AvgMacro AvgWeighted AvgSamples Avg
Precision0.990.960.980.960.970.970.970.970.97
Recall0.970.990.921.000.970.970.970.970.97
F1-Score0.980.980.950.980.970.970.970.970.97
Support5496045455555522805280528052805
Table 4. Comparison of various authors’ methods and performance against our model.
Authors MethodPerformance Our Model
Sheikh and Qidwai [6]Transfer Learning of MobileNetV290.8% DR, 92.3% RDRLikely superior, F1-score: 0.97
Gao, J.; Leung, C and Miao, C [7]DL/Efficient CNN90.5% accuracy Exhibits a higher F1-score
Yaqoob et al. [9]ResNet-50 with a Random Forest classifier96% on the Messidor-2, 75.09% EyePACSBetter than EyePACS, comparable to Messidor-2
Dharmana and Aiswarya [10]Significantly improved83% accuracySignificantly better
Toledo-Cortés et al. [11]Deep Learning/DLGP-DR, Inception-V393.23% sensitivity, 91.73% specificity, 0.9769 AUCEnhanced sensitivity and specificity
Wang, S. et al. [8]Deep Learning/GAN Discriminative modelEyePACS: 86.13% accuracy; Messidor: 84.23% accuracy; Messidor (2): 80.46% accuracySuperior performance across metrics
Touati, Nana, and Benzarti [4]Xception pretrained modelTraining accuracy: 94%, Test accuracy: 89%, F1-score: 0.94Notable F1-score of 0.97
Z. Wang, Y. Yin. [28]Deep Learning/CNN+Attention NetworkAUC 0.921/Acc 0.905 for normal/abnormal Our model Likely superior based on metrics
Khan, I et al. [17]Compact Convolution Network Acc 90.17%Significantly better, likely 97% accuracy
M. Berbar [19]Residual–Dense System97% in classifying DR severityComparable or slightly better
Nazih et al. [15]ViT CNNF1-score: 0.825, accuracy: 0.825, B Acc: 0.826, AUC: 0.964, precision: 0.825, recall: 0.825, specificity: 0.956Significantly better, F1-score: 0.97
Ijaz Bashir et al. [18]Residual Block + CNNAccuracy of 97.5% Comparable, accuracy likely around 97%
Yasashvini R et al. [20]Hybrid CNNs ResNet, and a hybrid CNN with DenseNetThe models achieved accuracy rates of 96.22%, 93.18%, and 75.61%, respectivelyDRCCT Demonstrates a strong performance
Yaoming Yang et al. [22]Vision transformers (ViT) combined with Masked Autoencoders (MAE) Accuracy 93.42%, AUC 0.9853, sensitivity 0.973, specificity 0.9539Slightly better F1-score
Disclaimer/Publisher’s Note: The statements, opinions and data contained in all publications are solely those of the individual author(s) and contributor(s) and not of MDPI and/or the editor(s). MDPI and/or the editor(s) disclaim responsibility for any injury to people or property resulting from any ideas, methods, instructions or products referred to in the content.

