Article

AMIKOMNET: Novel Structure for a Deep Learning Model to Enhance COVID-19 Classification Task Performance

Magister of Informatics, Universitas Amikom Yogyakarta, Yogyakarta 55283, Indonesia
Big Data Cogn. Comput. 2024, 8(7), 77; https://doi.org/10.3390/bdcc8070077
Submission received: 8 May 2024 / Revised: 22 June 2024 / Accepted: 28 June 2024 / Published: 9 July 2024
(This article belongs to the Special Issue Big Data System for Global Health)

Abstract

:
Since early 2020, coronavirus has spread extensively throughout the globe. It was first detected in Wuhan, a province in China. Many researchers have proposed various models to solve problems related to COVID-19 detection. As traditional medical approaches take a lot of time to detect the virus and require specific laboratory tests, the adoption of artificial intelligence (AI), including machine learning, might play an important role in handling the problem. A great deal of research has seen the adoption of AI succeed in the early detection of COVID-19 using X-ray images. Unfortunately, the majority of deep learning adoption for COVID-19 detection has the shortcomings of high error detection and high computation costs. In this study, we employed a hybrid model using an auto-encoder (AE) and a convolutional neural network (CNN) (named AMIKOMNET) with a small number of layers and parameters. We implemented an ensemble learning mechanism in the AMIKOMNET model using Adaboost with the aim of reducing error detection in COVID-19 classification tasks. The experimental results for the binary class show that our model achieved high effectiveness, with 96.90% accuracy, 95.06% recall, 94.67% F1-score, and 96.03% precision. The experimental result for the multiclass achieved 95.13% accuracy, 94.93% recall, 95.75% F1-score, and 96.19% precision. The adoption of Adaboost in AMIKOMNET for the binary class increased the effectiveness of the model to 98.45% accuracy, 96.16% recall, 95.70% F1-score, and 96.87% precision. The adoption of Adaboost in AMIKOMNET in the multiclass classification task also saw an increase in performance, with an accuracy of 96.65%, a recall of 94.93%, an F1-score of 95.76%, and a precision of 96.19%. The implementation of AE to handle image feature extraction combined with a CNN used to handle dimensional image feature reduction achieved outstanding performance when compared to previous work using a deep learning platform. Exploiting Adaboost also increased the effectiveness of the AMIKOMNET model in detecting COVID-19.

1. Introduction

The new variant of coronavirus, known as COVID-19, has spread around the world at a massive scale. Many patients with pneumonia disease were initially detected in the Wuhan region in China around December 2019 [1,2]; at first, it was an unknown category of illness. The symptoms found in several patients were like that of severe acute respiratory syndrome (SARS). The Chinese Center for Disease Control and Prevention (CCDC) detected a new type of coronavirus (nCoV) through throat swab samples collected from several patients in Wuhan. Eventually, as many as 692,201,275 people were infected with coronavirus, with more than 6,903,321 deaths and 664,525,952 recoveries all around the world as of July 2023 [3]. Because this was a challenging condition, academics and medical experts adopted real-time reverse transcription polymerase chain reaction (RT-PCR) to evaluate and identify COVID-19 [4], whereby the reverse transcription task, which is responsible for capturing an infected person’s DNA, can be obtained. After that, the DNA is subjected to PCR so that it can be strengthened before it is evaluated. Because coronavirus is the only virus that contains RNA patterns, it is possible for PCR to detect the virus. The results acquired using a PCR pack were delayed because of the increase in demand for COVID-19 tests. Consequently, the results that are generated by PCR kits are not dependable due to the incidence of false-negative (FN) outputs as a result of their composition [4].
Pneumonia is a potentially fatal respiratory illness that affects around 7% of the world’s population each year [5]. It is a condition that is thought to be fatal and has unrelenting outcomes within a short period because it causes a steady flow of fluid inside the lungs, ultimately resulting in drowning. The bacteria, germs, and other organisms that cause pneumonia induce a heightened response in the area of the lung sacs called alveoli [6]. When microorganisms begin to multiply within the lungs, leukocytes begin producing sores in the sacs to combat the bacteria and fungi that are responsible for the infection. Therefore, the region of the lungs that is influenced by pneumonia becomes filled with an infected fluid, which leads to breathing difficulty as well as tussis and fever. It is possible for a person to pass away because of this dangerous pneumonia infection if the earlier stages are not treated with appropriate medication [7].
Individuals who contract COVID-19 infection may experience the subsequent signs and symptoms: fever, cough, taste or smell loss, sore throat, chest pain, and dyspnea [8]. Patients with pneumonia infection, pneumothorax, pulmonary tuberculosis, or cancer in the lungs (LC) are those who exhibit these symptoms most frequently. Because of this, it can be challenging for medical professionals to identify COVID-19 [9]. Many researchers and professionals in the medical field need a technique with which to accurately diagnose COVID-19 [10]. It was determined that X-ray imaging analysis was the best method for identifying coronavirus. Chest radiography, also known as chest X-rays, is the cheapest and most common medical analysis procedure used today. Even in poor nations, contemporary digital radiography devices are fairly affordable. Therefore, health professionals make extensive use of this method in their work to identify and analyze potentially lethal diseases such as tuberculosis (TB), pneumonia, and LC. X-ray images of a patient’s chest can provide an incredible amount of information about their medical history. Despite this, obtaining an accurate identification of COVID-19 using X-ray imaging is the most important undertaking for medical professionals. When it comes to chest X-rays, overlapping tissue structures significantly increase the level of difficulty associated with making an accurate diagnosis. Because of this, the human diagnostician may encounter difficulties in detecting COVID-19 when the degree of contrast between the lesion and the neighboring tissues is relatively small or when the lesion covers the ribs. It is not always easy to identify a person who has COVID-19, pneumothorax, pneumonia, LC, or TC from chest X-rays, and this can be the case even for an experienced medical professional. Therefore, the automated identification of these disorders using chest radiographs by means of AI—more specifically, the field of machine learning models—may provide a solution to this problem [11]. There has been a lot of elation brought about by reports that DL and transfer learning algorithms are outperforming humans in diagnostic evaluations. In the field of AI, both approaches, namely, deep learning and transfer learning, provide a framework where previously acquired information can be used to address new but relevant tasks in a manner that is significantly more efficient and effective [12]. In previous studies, the ability of machine learning algorithms to detect COVID-19 was famously called the transfer learning method.
The process of illness classification has been fundamentally altered by DL models, which has presented medical practitioners with a new opportunity [13,14]. The majority of medical diagnosis systems that use CNNs and that have seen great achievements have been used in the segmentation and identification of brain and breast tumors [15], the detection of cancer cells, the treatment of chest infections [16], and the diagnosis of cancer in individual cells [17]. Accordingly, CNNs have become a famous model in COVID-19 detection. Based on the history of CNNs, Fukushima initially suggested the CNN architecture in 1988 [18]. However, because of the limitations of the computing devices required to train the network, it was not widely deployed. LeCun et al. successfully solved the handwritten digit categorization issue in the 1990s by using CNNs and a gradient-based learning method [19]. Subsequently, scientists enhanced CNNs even more and obtained cutting-edge outcomes in numerous identification assignments. CNNs are superior to primitive ML in several ways, including their structural similarity to the natural visual processing system, their ability to learn and extract the abstractions of 2D features, and their high level of optimization in processing both 2D and 3D images. The maximum pooling phase of a CNN is effective at collecting structural variations. Additionally, compared to completely connected networks of similar dimensions, CNNs have much fewer elements because they are made up of weak connections with coupled weights. The gradient-based learning approach is mostly used to train CNNs, with training declining with the declining gradient issue. CNNs are able to produce significantly precise weights given that the network as a whole is trained using the gradient-based approach to directly lower mistake criteria. Several studies have adopted CNNs to solve the problem of automatic detection of COVID-19. For example, in a study by Hammoudi et al. [20], they implemented a hybrid CNN to solve category four lung disease, including bacterial, COVID-19, viral, and normal cases. The report demonstrated that their model achieved 95.72% in accuracy tests.
Deep learning (DL) was first introduced in the last decade with the name AlextNet [21,22]. AlexNet became one of the most popular DL techniques due to tremendous achievements in the domain of computer science applications, such as image processing. AlexNet is composed of CNN working mechanisms. After the emergence of AlexNet, various DL techniques appeared, including VGG-16, GoogleNet, RestNet, DenseNet, MobileNet, etc. Stacks of many convolutional layers and max-pooling layers are commonly used, followed by fully linked and SoftMax mechanisms at the end of the layering. Another DL model is composed of recurrent neural networks (RNNs), including long short-term memory (LSTM), gated recurrent units (GRUs), and an auto-encoder (AE) [23,24]. There are examples of deep learning approaches for cyber security algorithms [23,25] and e-commerce [26], which achieved excellent performance. However, the majority of the DL models above consist of a lot of parameters, meaning high computation costs and a lot of time required for the learning process.
DL is the most popular machine learning approach that can be utilized in detecting COVID-19. One of the most popular kinds of DL models is the visual geometry group (VGG). VGG consists of several variants, including VGG-16, VGG-19, and VGG-32. The VGG architecture is created from two convolutional processes that involve the ReLU activation function. After processing with ReLU, they continue with maximum pooling and are linked to multiple layers. The whole process involves the ReLU activation function, and the last process adopts SoftMax to produce the classification result. One study adopted VGG-16 to automatically detect COVID-19 [27]. This study considered four classes of datasets, including normal, COVID-19, bacteria, and pneumonia images. According to the evaluation metrics, the VGG-16 model achieved 87.49% accuracy.
DenseNet is a convolutional neural network architecture proposed by Gao Huang et al. in 2017 [14]. Specifically, they used whole output layers coupled to all of the subsequent networks within a dense layer. Consequently, the network exhibits a high level of interlayer connection, which justifies its designation as DenseNet. The utilization of this notion demonstrates efficacy in the context of adopting characteristics. This mechanism achieved significant network number reduction. The DenseNet architecture is composed of multiple solid blocks and transformation blocks strategically stored among two consecutive solid-block layers. The DenseNet model provides great results when handling COVID-19 classification. Another study implemented a DenseNet model for X-ray lung images for lungs that were normal, had COVID-19, or had pneumonia [28]; according to the experimental report, this DenseNet model achieved 96.25% accuracy.
The explanations above describe the effective achievements of DL algorithms. Some of them developed hybrid multi-layer DL models, and the majority of the studies succeeded in developing significant COVID-19 detection. However, these existing models require high computation costs for the transfer learning process. Moreover, the model’s performances produced an error detection of more than 3%. Following on from this, we propose a novel DL classification model called the AMIKOMNET that was designed specifically for this research project. Our proposed model exploits a subclass of DL algorithms called AE and a CNN model with minimum layers and parameters; it incorporates a combination of the enhancement algorithm using AdaBoost. The development of AMIKOMNET aims to reduce error detection and high computation costs by using a low number of parameters. Chest X-ray image datasets were used to observe the effectiveness of AMIKOMNET. The X-ray image datasets include normal patients, COVID-19 patients, and pneumonia patients. Our proposed model is a hybrid model that uses an AE, CNN, and Adaboost. The hybrid model uses a serial mechanism that involves three essential algorithms.
In summary, there are three main contributions from this study:
  • A novel, hybrid method involving a CNN and AE with a minimum number of layers and parameters that is used to effectively learn different classes of lung disease X-ray images and classify them;
  • A novel, hybrid model aimed at reducing error classification by using the hybridization of an AE, CNN, and AdaBoost;
  • A novel image analysis model that uses heat map patterns as a result of applying Grad-CAM. This application is essential in determining the focus location impact of pneumonia or COVID-19.

2. Literature Review

The classification of respiratory system problems utilizes multiple types of medical imaging material, i.e., MRI scan images, CT scans, and X-rays. The most essential material used in this is the application of DL. Numerous investigations have shown that COVID-19 may be found using X-rays, saving time and effort for medical personnel. However, finding COVID-19 at an early stage has been a difficult aspect in current studies. In this section, we explain several of the most significant and pertinent publications on AI techniques used in lung disease detection, for instance, COVID-19, pneumonia, pneumothorax, lung cancer, and tuberculosis. A comparison of state-of-the-art techniques is demonstrated in Table 1. In summary, the majority of the studies handle essential problems regarding COVID-19 detection, such as a minimum number of datasets for training, inaccurate detection results, reducing the time needed for computation, and adopting several types of datasets that are popularly named multimodal.
Many medical studies involving DL algorithms have begun in recent decades. The adoption of DL algorithms has seen success in handling several problems in medical imaging problems. A review study conducted by Moorthy and Gandhi [29] shows that DL has played an essential role in five areas of medical imaging, including segmentation, classification, detection, registration, and image enhancement. In terms of classification tasks, the majority of researchers employ a CNN variant, such as deep CNN. Several studies have involved traditional machine learning algorithms. For example, the authors of [30] used random forest (RF) to classify COVID-19 and non-COVID-19 samples. They considered that the adoption of a DL algorithm required high computation costs. The experiment showed that RF achieved an accuracy of 87.9%, a sensitivity of 90.7%, and a specificity of 83.3%. One study compared DL models for COVID-19 classification [31], including several generic DL models such as RestNet, VGG19, DenseNet, and Inception; Inceptionv3 achieved 98% accuracy. Another proposed model using DenseNet aimed to reduce error detection in COVID-19 identification by using DenseNet [28]. This research aimed to enhance COVID-19 detection even with a minimum number of datasets. The feature extraction process involved ImageNet, and the classification algorithm used was DenseNet; the experimental report shows that DenseNet accuracy was 96.25%, its precision was 96.28%, its recall was 96.29%, and its specificity was 96.21%, yet the model required high levels of computation to learn the datasets.
Imbalanced datasets are a big problem in COVID-19 detection. The classification task can see inaccurate results due to imbalanced data training. A study implemented GAN to generate imitation datasets [32]. The researchers adopted VGG16 as the core algorithm for the classification task. The experimental results achieved an accuracy of 94.74%, a sensitivity of 92.86%, a specificity of 87.50%, and an F1-score of 96%. A study that used a parallel hybridization model using InceptionV3 and VGG16 aimed to reduce error detection. The experimental results show an accuracy of 98%, a recall of 98%, and a precision of 98%. This research achieved tremendous results, but the model, again, requires high computation costs. A similar hybrid model using VGG16 and VGG19 aimed to reduce error detection. The model achieved an accuracy of 92%, a precision of 93%, a recall of 92%, a specificity of 77.77%, a sensitivity of 98.68%, and an F1-score of 92%. Another hybrid model using parallel MobileNet aimed to reduce error detection [33]. The researchers reported an accuracy of 93.4%, a precision of 93.48%, and a recall of 92.7%. This research implemented CT scan images, with the training process using 100 epochs, which is in contrast to a previous study, where they used swab tests instead. From a computation cost point of view, this model uses very low computation because it does not involve image data. They incorporated principal component analysis into the feature extraction process and used this with several traditional machine learning algorithms, such as naïve Bayes, random forest, support vector regression, and linear regression. The experimental results show that naïve Bayes achieved the best performance, with an accuracy of 83%, a recall of 82.7%, and a precision of 62.6%. The shortcoming of this research is that the performance of the model is very low.
The difficult problem to solve in COVID-19 detection is the bias of datasets, where image datasets are collected from several different types of hospital resources. The problem occurs due to similarity classes among the image datasets. Research that aimed to solve this problem has been conducted [34]. The proposed model implements advanced texture feature extraction with GLCM (grey-level co-occurrence matrix), GLDM (grey-level different matrix), and wavelet transform, and a CNN is responsible for classifying COVID-19. The experimental results show an accuracy of 92%, a recall of 93%, a precision of 87%, and an F1-score of 89%.
Table 1. Previous work regarding DL models for COVID-19 detection using X-ray in binary class datasets: (1) COVID-19; (2) pneumonia; (3) healthy/normal; (4) pneumonia bacteria; (5) pneumonia viral; (6) tuberculosis; (7) lung cancer; (8) no finding; (9) influenza; (10) SARS.
Ref.YearClassesAlgorithmAccuracy
[30]20211, 2Random Forest 87.9%
[28]20211, 3DenseNet DL96.25%
[31]20211, 3Custom CNN94.5%
[32]20241, 3GAN and VGG1696.55%
[35]20241, 3Inceptionv3 and VGG1699%
[36]20241, 3Hybrid VGG16 and VGG1992%
[33]20241, 3Parallel MobileNet96%
[37]20241, 3RestNet5097.19%
[38]20241, 10SVM, Naïve Bayes, Random Forest94%
[34]20241, 5Modified CNN92%
[39]20241, 3Ensemble KNN, SVM87%
Many researchers implemented multi class lung diseases detection. They found essential algorithm to enhance classification task. The study explanation shows on Table 2 below. For Example, a proposed model called BDCNet that uses a CNN enhancement algorithm was recently created by the authors of the current study for COVID-19 detection [40]. We used three classes of lung diseases, including COVID-19, pneumonia, and LC. We adopted one DL model in the context of a traditional CNN and used evaluation metrics to observe model performance; this model was compared against several modern DL platforms, such as ResNet-50 and VGG-19. The BDCNet model achieved a tremendous performance when compared to the other competing techniques, with an accuracy of 99.10%. This study involves 15,043 X-ray images in total, including 6012 images of pneumonia, 180 images for COVID-19 cases, and 8851 images of healthy cases. The experimental report showed an accuracy of 88.9% [41]. The architecture of the model conducts an analysis based on 18 layers for the residual convolutional layer, working on categorization after using a CNN model to determine the most noticeable traits as part of the initial step. The anomaly module was applied in the final stage to identify the model scores. A total of 1531 X-ray images were used in the experiment, 100 of which showed positive results for COVID-19 and the rest of which revealed pneumonia infection. The model achieved a precision of 70.65% and a recall of 96% for COVID-19 classification.
The limited number of datasets in this area has become a serious problem. GAN is a popular algorithm that is used to generate automatic datasets. Researchers conducted a study to enhance the limited number of datasets [42]. The experiment involved 307 images from COVID-19 datasets. Several DL algorithms were involved in this study, including Alexnet, GoogleNet, and RestNet. The experimental results demonstrate that the adoption of GAN and RestNet achieved better performance over another DL model. This model achieved an accuracy of 81.48%, a precision of 88.10%, a recall of 81.48%, and an F1-score of 84.66%. Researchers proposed another model aimed at the same case of a limited number of datasets. They adopted a patch-based CNN to extract image datasets, and they used a statistical analysis biomarker, with RestNet18 used as the classification task engine. The training process involved a pretrained model based on ImageNet. The performance of the model achieved 88.9% accuracy, 83.4% precision, 85.9% recall, and 96.4% specificity.
The problem of error detection in COVID-19 classification is still a serious problem. A study tried to solve the problem by using a hybrid scenario, which has become a popular model, even though the model uses very high computation costs, for example, ensemble learning using InceptionRestnet, Restnet50, and MobileNet [43]. The adoption of this ensemble learning achieved 95.09% accuracy, 94.43% sensitivity, 98.31% precision, and 94.84% F1-score. Researchers proposed a study to enhance COVID-19 classification by using highlighted spatial areas as regions of interest (ROI) in X-rays [27]. The classification algorithm in this research used attention with VGG16. The result of the experiment achieved 79.56% accuracy. The drawback of research using limited numbers of datasets is that it has an impact on inaccurate performance. In later work, researchers required GAN to produce more datasets. Researchers proposed a model using GAN to generate imitation datasets [44,45]. The majority of DL variants require huge datasets to learn. GAN provided better achievements in generating datasets. A type of GAN algorithm, Unet-GAN, was used as a basic mechanism in a Unet model. The researchers selected DenseNet as the classifier engine. The experimental results show an accuracy of 98.59%, a precision of 98.33%, a recall of 98.68%, a specificity of 99.30%, and an F1-score of 98.50%.
One of several strategies to increase the effectiveness of the classification task is preprocessing enhancement. Researchers [46] used the modification of a CNN with a rest block as the classifier engine. The experimental results achieved a specificity of 93.33% and an F1-score of 93.07%. Another piece of research adopted point-of-care ultrasound images (POCUS) [47], using a CNN as the classifier engine. The experiment implemented three classes of lung diseases, including COVID-19. The results show that the model achieved great effectiveness, with 99.76% accuracy, 99.89% specificity, 99.87% sensitivity, and 99.75% F1-score. The drawback of this approach is the datasets are not popular in medical applications.
The majority of existing models use a DL model. DL always requires high computation costs and is always time-consuming. One study [48] proposed a model that aimed to lower the computation cost. This model used advanced contrast enhancement (CLAHE) because the majority of X-ray images have low standard quality. They integrated the results of contrast enhancement with traditional machine learning algorithms, such as Naïve Bayes, KNN, decision tree, and SVM. Naïve Bayes showed better performance in this study, with 99.01% accuracy, 97.77% precision, 100% recall, and 98.87% F1-score. A hybrid model using a DL algorithm was used in [49]. The authors used a serial hybrid model of RestNet, VGG, and fusion. Their research involved eight classes of lung diseases, and they adopted a GAN algorithm to handle imbalanced datasets. The experimental results show an accuracy of 92.88%, a sensitivity of 82.37%, a precision of 89.56%, and an F1-score of 85.82%. A hybrid multimodal dataset that included X-rays, CT scans, and sounds was integrated in [50]. A CNN was responsible for the classification task, and the experimental results showed an accuracy of 99.01%. The adoption of image data enhancement plays an essential role in enhancing classification tasks, such as the adoption of region proposal networks to detect chest cavity regions of interest (ROI). Their model achieved 98.10% accuracy, 98.13% precision, 99.03% specificity, 98.30% recall, and 98.12% F1-score.
Table 2. Previous work regarding DL models for COVID-19 detection using X-rays in multiclass datasets: (1) COVID-19; (2) pneumonia; (3) healthy/normal; (4) pneumonia bacteria; (5) pneumonia viral; (6) tuberculosis; (7) lung cancer; (8) no finding; (9) influenza; (10) SARS.
Ref.YearClass DatasetAlgorithmTest
[40]20211, 2, 3, 7Modification layer VGG1999.10%
[42]20201, 3, 4, 5GAN, GoogleNet, Restnet18, Alexnet80.56%
[51]20201, 2, 3Xception+Resnet5091.40%
[52]20201, 3, 4, 5, 6Hybrid CNN88.90%
[53]20201, 2, 3CNN and MobileNet96.78%
[54]20201, 2, 4Inception V376.0%
[55]20201, 2, 3Resnet and SVM95.33%
[43]20211, 3, 4, 5Inception, RestNet, MobileNet94.84%
[40]20211, 2, 3, 7UUNet++95.24%
[27]20211, 2, 8Attention and VGG1687.49%
[56]20201, 2, 3Enhanced CNN93.3%
[44]20231, 2, 3GAN and CNN98.78%
[45]20221, 2, 3GAN and CNN99.2%
[46]20211, 2, 3, 9Annotation and CNN96.7%
[47]20241, 2, 3Enhance Xception99.7%
[48]20241, 2, 3CLAHE and Naïve Bayes, SVM98%
[49]20241, 3, 4, 9, 10, 6 Multimodal, VGG19, RestNet95.97%
[50]20241, 2, 3, 4, 5, 6, 7, 8, 9Multimodal and CNN99.1%
[57]20241, 3, 8MLP-BiLSTM98.10%
A COVID-19 detection model was proposed by Apostolopoulos et al. [53]. They utilized a MobileNet-V2 model in addition to a CNN model on two classes of datasets. The first dataset has a total of 1427 images, of which 224 show positive results for COVID-19, 700 for bacterial infections, and the other images are normal. In the second dataset, there is a comparable number of images with COVID-19, pneumonia, and normal. When compared to a traditional CNN model, the MobileNet-V2 model achieved 96.78% accuracy and 98.6% recall. Tsiknakis et al. [54] proposed a new model for the classification of COVID-19 by employing a pretrained model known as InceptionV3. This method used 572 cases of bacterial and viral infections, 122 images of COVID-19, and 150 images of normal cases to learn. It was determined that 76% accuracy was attained. In the research, 381 X-ray images were loaded into nine distinct models that had previously been trained. In this study, they used SVM and ResNet-50 to extract these features, from which COVID-19 was then found. The ResNet-50 model achieved 95.33% accuracy and 95.33% F1-score.
A proposed model for COVID-19 detection used a CNN-based model called CovXNet for COVID-19 image classification [58]. The feature was extracted using the CNN model, and the depth-wise convolution phenomena were examined; this made automatic identification possible. The CovXNet model uses a gradient-based selective localization technique, which was created by utilizing X-ray images of both healthy individuals and individuals with pneumonia in order to identify COVID-19. For normal and COVID-19 instances, the model yielded an accuracy rate of 97.4%; for all other cases, including pneumonia and bacterial and viral infections, the algorithm generated a detection accuracy of 90.2%. When Horry et al. [59] were tasked with classifying photos contaminated with COVID-19, they used four well-known medical transfer learning classifiers. A total of 60,798 photos were used to validate the model: a total of 115 images showed COVID-19-positive X-rays, 60,361 images were normal, and 322 images showed pneumonia infection. In the experiment, they employed four different types of transfer learning and compared them. According to the results, VGG-19 performed the best, with 81% accuracy.
A study by Kermany tried to increase accuracy performance in COVID-19 and pneumonia detection by using a pretrained model with Inception-V3. The objective of the study was to diagnose pneumonia based on X-ray images [60]. The following experimental results demonstrated that the diagnostic accuracy of the model was 92.8%, and its recall was determined to be 93.2%. A study by Wang [61] produced an analysis of localization methods to detect pneumonia infection in X-rays images, aiming to discover the exact location of the disease. According to the results of their experiment, the curve (AUC) for the categorization of the pneumonia disease class was 63.3%. In addition, Rajpurkar [62] used a hypothesized model with 121 CNNs and obtained an AUC curve of 0.768. In addition to this study, they then gave their model the name CheXNet, and it was analyzed and verified using the publicly accessible “chest X-ray” image collection, which has 112,120 frontal chest images. In their study on the classification of chest diseases, Malik et al. [50] computed the consumption of a CNN with two branches. Their model detected a pneumonia disease class with an AUC curve of 0.776. The technique of disease diagnosis based on radiograph images was investigated, and the imaging of the chest area was used to apply a segmentation process to a variety of bodily organs.
A study by Wang noticed the tones of pneumonia in association with lethal coronavirus (COVID-19), where severely infected humans with acute respiratory illnesses were first discovered in Wuhan. The outbreak of the disease began in people with severe acute respiratory infections. The number of people who were infected with COVID-19 was very hard to obtain; however, these data are very necessary in terms of understanding the pattern of how the disease might spread in the future [63]. During the pandemic, the pathogenic laboratory was a viable choice; nevertheless, their testing procedure was time-consuming and frequently produced false negative (FN) results. Because of this, the screening for this condition was carried out utilizing various forms of medical imaging, such as CT scans and MRI scans, in conjunction with DL techniques. An AUC of 89.5% was reached during the preliminary screening, along with a specificity of 88% and a recall of 87%.
A CNN model was used by Stephen et al. to diagnose people with pneumonia based on chest X-ray images taken from a database. The proposed CNN models were examined (starting from the ground up) to extract the significant and dominating characteristics from X-ray images to detect pneumonia. This model tackled the problem of medical imaging for a significant number of pneumonia datasets, and it came up with significant results [64]. When it comes to categorization, other methodologies rely on handcrafted and pretrained methods to achieve a remarkable level of performance. They trained their model with information from multichannel images to imitate the clinical monitoring procedure. A proposed model by Wang et al. [63] applied a regression mechanism with DL to automatically screen for pneumonia. First, they improved their ability to screen for pneumonia by extracting visual cues from multiple modes of photos. This allowed them to better detect the illness. A second process for new structures of the chest was studied by utilizing a recurrent convolutional neural network (RCNN), which can automatically extract numerous image characteristics from multichannel image slices. RCNN is able to do this because it can extract many image features simultaneously. When compared to the previous baseline work, also known as RCNN with a ResNet structure, the suggested model demonstrated an improvement, with an accuracy of 2.3% and a sensitivity evolution of 3.1%.
Janizek et al. [65] described the emergence of pneumonia due to several factors, such as fungi, viruses, and also bacteria. Taking chest X-rays of patients is a standard diagnostic procedure that is utilized in the evaluation and treatment of pneumonia. In detecting pneumonia from medical images, a certain type of CNN model was used, which is built on pretrained layers, such as Inception, VGG32, Exception, Efficient, ResNet, and InceptionRestnet, and it attained an extremely high level of accuracy. For chest X-rays and computed tomography (CT) of COVID-19 infection, Dansana et al. [66] conducted an evaluation of pretrained convolutional layers, for instance, VGG-19, Inception-v2, and DT. They revealed that VGG-19 outperformed the other methods in classifying the radiographs and CT scan images of people infected with COVID-19. The experimental report showed a diagnosis accuracy of 91%. Moreover, Soin [55] and Chouhan et al. [67] initiated an innovative novel DL framework as a method for health professionals to use in the diagnosis of pneumonia. They used many distinct types of pretrained neural networks on chest X-rays in order to extract the dominating features, and then they evaluated the classification accuracy of these features. After that, they assembled the last network for the pretrained process, allowing them to reach the highest possible diagnostic accuracy. In their research, Waheed et al. [68] created a novel model using an “Auxiliary Classifier Generative Adversarial Network” (ACGAN) and called it COVIDGAN, which was used to produce imitations of chest X-ray images. According to the experimental reports, their models improved the accuracy over that of a traditional CNN model in pneumonia classification tasks, and they claimed that their model achieved more efficient and useful application when supporting radiologists.
A classification ML model called COVIDNET was proposed by Wang et al. [56]. Their research goal was to enhance the classification algorithm. The categories of the datasets included COVID-19-infected and normal lungs. Their experiment implemented a dataset with 13,975 images collected from 13,870 human illness cases. They used CNN as the main ML algorithm for the classification task. COVIDNET was compared with previous work based on VGG-16 and RestNet-50. According to the experimental report, COVIDNET outperformed VGG-16 and RestNet-50. Following these evaluation metrics, COVIDNET achieved 93.3% accuracy, VGG-16 achieved 83.30% accuracy, and RestNet-50 achieved 90.6% accuracy. Furthermore, another model for COVID-19 classification using DL was proposed by Zhang et al. [41]. They implemented a novel DL method called generative adversarial network (GAN) to enhance the preprocessing of datasets. The preprocessing process included generating augmentation data. They considered training the model using multiclass classification, including COVID-19, normal, and pneumonia cases. The main ML algorithm used enhanced CNN architectures. According to the evaluation report, their model achieved 98.78% accuracy.
A novel model using a pretrained model based on VGG-16, RestNet, Inception, and MobileNet was proposed by Uddin et al. [31], where only two classes were included: normal patients and COVID-19 patients. They implemented an enhanced and novel CNN model as the main algorithm for the classification task. The experimental results demonstrated that their model achieved 97% accuracy. A proposed model using a novel GAN to augment generated imitation data (combined with the enhanced CNN model) was proposed by Gulakala et al. [45]. They applied this to a multiclassification task, including COVID-19 class, patients with healthy lungs, and lungs with pneumonia. The experimental results show that the hybrid model of GAN and the novel CNN architecture achieved tremendous results: 99.2% accuracy. A novel model using annotation and a CNN framework was first initiated by Liang et al. [46]. The adoption of annotation is responsible for increasing the effectiveness of detection performance. The novel annotation model was built with a specific application in mind in this study, with a CNN algorithm responsible for tackling the classification task. The evaluation report showed that this model achieved 96.72% F1-score and 99.33% specificity.
A study that employed GAN aimed to automatically generate COVID-19 datasets. They integrated GAN with VGG16 for the classification task of detecting COVID-19 [32]. Here, GAN was responsible for handling imbalanced datasets between normal and COVID-19 X-ray images. The adoption of GAN to generate imitation datasets successfully improved upon a previous deep CNN model. According to the experimental report, GAN and VGG16 achieved 96.55% accuracy. Almost similar in terms of utilizing GAN and VGG16, another study proposed a novel algorithm that integrated dual DL algorithms [35]. Their model consists of Inceptionv3 and VGG16. The objective of their study was to enhance the performance of previous work in terms of handling error detection due to low-quality X-ray images, low-accuracy classification, and overfitting. This study consists of two classes, including normal and COVID-19. The datasets contain 121 X-ray images of COVID-19 and 122 X-ray images of normal patients. According to the experimental report, the combination of Inceptionv3 and VGG16 achieved 98% accuracy. Surprisingly, their model was superior when compared to previous DL-based work, including VGG16, MobileNet, RestNet50, and DenseNet models.
A study to enhance the COVID-19 classification task was proposed by Prince et al. [48]. The majority of machine learning faces the problem of requiring a huge amount of data for training, with the training process requiring high computation costs that are time-consuming. In aiming to solve this problem, they employed contrast enhancement using contrast-limited adaptive histogram equalization (CLAHE). After image processing with CLAHE, they transformed the images to the YCrCB color mode. The classification characteristic vector that was utilized is a balanced regional binary spectrum based on reflection (Cr) and YCb. In this research, several traditional classifiers were considered, including naïve Bayes, decision trees, logistic regression, nearest neighbor, and SVM. The proposed method was adopted for a binary class. According to the experimental report, their model achieved 99% accuracy. The best performance was achieved by naïve Bayes as the classifier in a binary class including normal and COVID-19 cases. The shortcoming of this research is that the experiment did not consider a multiclass classification task.
Even though the majority of the work has succeeded in handling some of the obstacles during the COVID-19 pandemic, COVID-19 detection still faces several shortcomings. Error detection is still a relevant problem in this area of research. One study aimed to enhance the COVID-19 classification task by using hybrid deep learning, as proposed by Abdullah et al. [36]. The proposed model used a hybrid, dual deep learning algorithm that includes VGG16 and VGG19 in a parallel scenario. The experiment considered two classes of lung diseases, including normal and COVID-19. The datasets used contain 2413 X-ray images of COVID-19 patients and 6807 images that represent normal patients. According to the experimental report, the proposed method achieved 92% accuracy. The proposed model was also compared with several state-of-the-art models, including VGG16, VGG19, Efficienet, and RestNet. They claimed the hybrid model of VGG16 and VGG19 was superior to several deep learning platforms. Indeed, the hybridization of deep learning models requires millions of parameters, which has an impact on computation cost.
The review above shows the existing deep learning approaches face the shortcomings of high error detection, high computation cost, image dataset bias, and a lack of image datasets. From a medical diagnosis point of view, the problem of error detection cannot be tolerated. There are several problems in deep learning when hybrid models are adopted, including high computation costs. The deep learning process requires many layers, and the stacking of these layers is necessary for learning. This is very costly from a computing perspective. Additionally, the involvement of an unlimited number of layers influenced overfitting. Therefore, reducing error detection is an avenue of research that remains open. In this study, we consider integrating a dual model of traditional deep learning platforms, including AE and CNN, with the aim of enhancing the effectiveness of the classification task. To the best of our knowledge, AE and traditional CNNs involve a lower number of parameters; the number of parameters can be seen in Table 2, Table 3 and Table 4. The adoption of Adaboost is expected to increase classification performance in COVID-19 detection. Applying this to multiclass datasets becomes essential in terms of observing the performance of such models in several classes of lung diseases.
3. Materials and Methods

Our proposed model is called AMIKOMNET. The name was inspired by our University of Amikom Yogyakarta. AMIKOMNET involves a hybrid model that uses AE, CNN, and AdaBoost. AMIKOMNET was implemented on real datasets, including 6000 images. The image datasets consist of 2000 normal cases, 2000 COVID-19 infection cases, and 2000 pneumonia infection cases. We collected the research material data as a dataset from the popular website Kaggle.com. The dataset is free for public access [69]. In this research, we created an effective DL model that can automatically identify respiratory illnesses. The image size of the gathered X-ray datasets is always 256 pixels per side, and the X-rays in the database were split into three groups for training, validation, and testing. The AMIKOMNET model was trained using normal, COVID-19, and pneumonia images. The experiment was conducted with a batch size of 64 for as many as 20 iterations with an early stop mechanism. The AMIKOMNET model’s classification performance was compared to that of two different DL models by using a confusion matrix. We selected VGG16 and DenseNet to be involved in our experiment. The experiment used a similar number of parameters, number of epochs, learning rate, batch size, and number of datasets. In our opinion, the schematic comparison is fair enough to observe and compare our model. VGG16 and DenseNet represent popular state-of-the-art DL models. Moreover, we compared our experimental results with previous work based on the literature review. Our model also considered the application of the Grad-CAM approach, aiming to analyze the image classification results by using the image of a patterned heat map of the lungs.

3.1. Auto-Encoder (AE) Layer

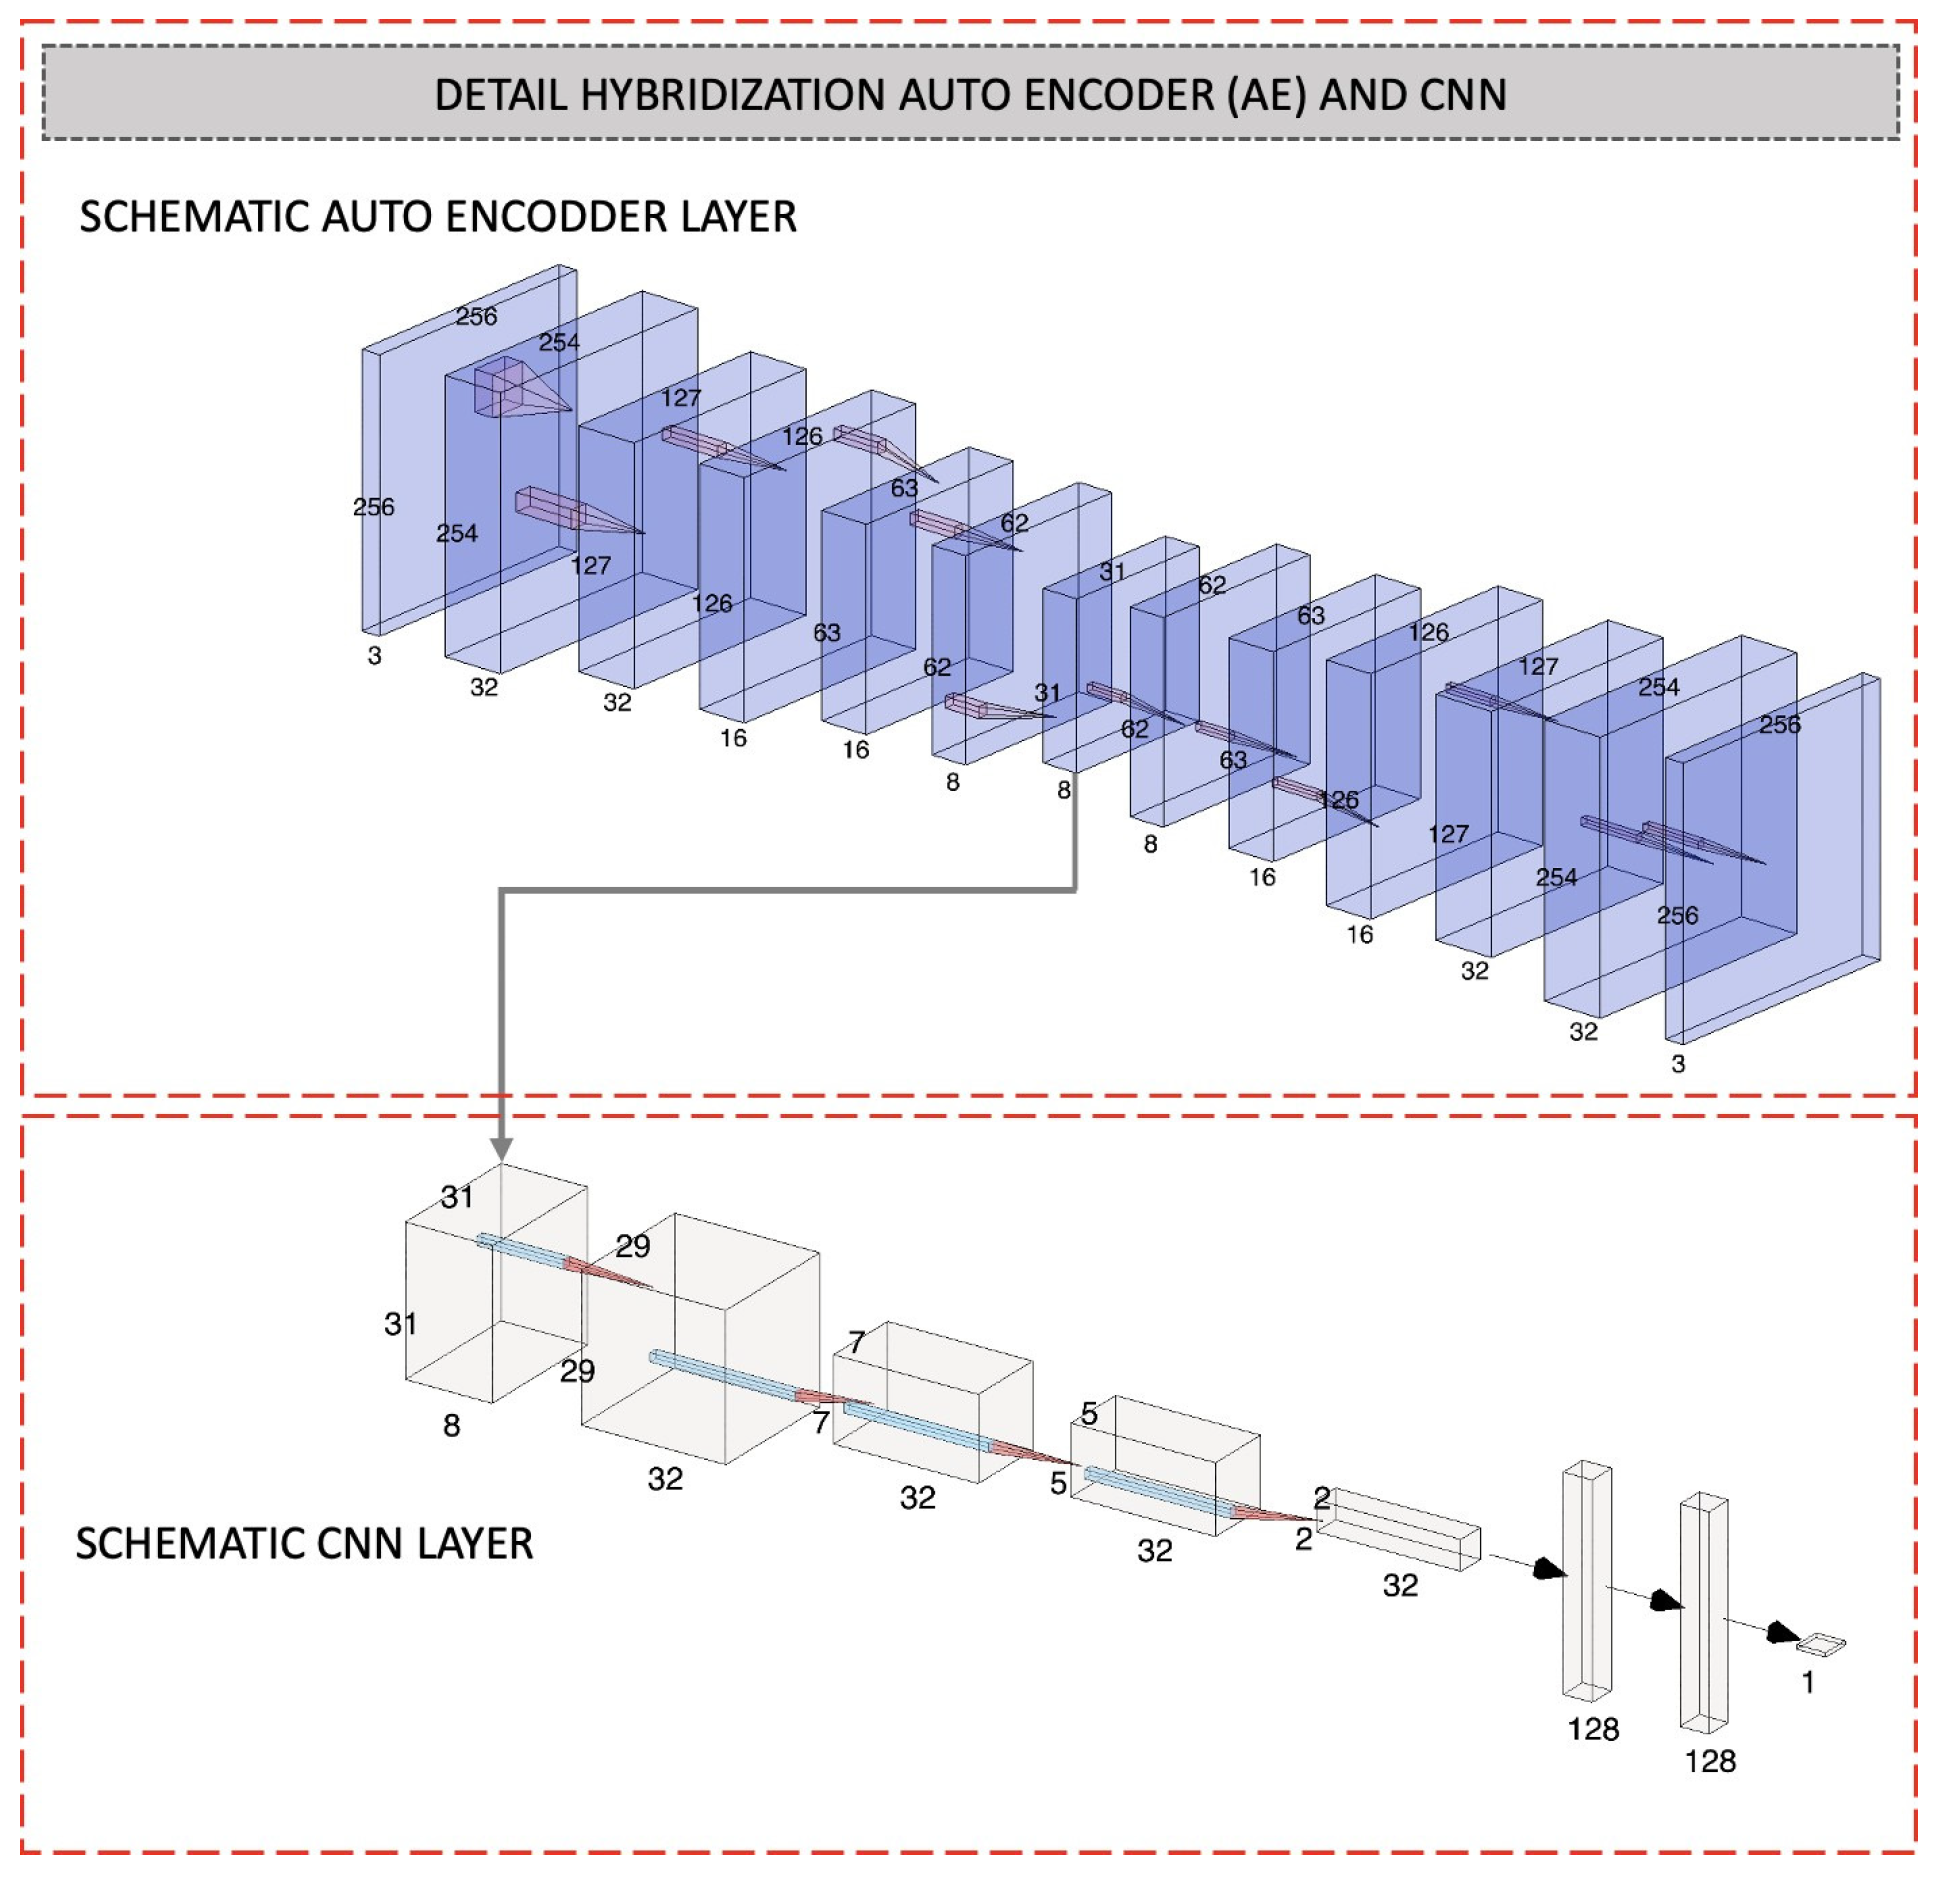
AE represents a subclass of neural networks. The benefit of the AE model is that it has the characteristic of feature extraction representation. This method consists of two important mechanisms, including a decoder and encoder layer, in which the decoder is responsible for collecting the input information layer. The encoder’s responsibility is to extract the information representation from the decoder data stream. AE starts with the input x R d , and the second section is related to the mapping of the latent representation feature via h R d , adopting the deterministic by the given equation h = f θ = σ ( W x ¯ a 2 + b 2 = c 2 + b ) with parameters θ = ( W , b ) ; the method aims to extract the input latent space into vector mapping, which can be calculated using the equation f : y = f θ = h = σ W h + b , where σ = ( W h + b ) . Both equations obtain the constrained version of W = b . This has become a mechanism to achieve similar latent space between the input layer as the encoding step and the extraction of the output latent space as the decoding step. Details of the architecture of the AE network are demonstrated in the first section of Figure 1. The AE model is responsible for extracting the lung X-ray image from the datasets.

3.2. CNN Layer

DL technology is an advanced version of the machine learning model. DL adoption has grown at a massive scale in many AI applications. The number of layers grows exponentially with the number of hidden layers; hence, the name “deep”. The structure was given its name in honor of the mathematical operator convolution. Furthermore, a common CNN architecture contains an input feature-extracting convolution layer, a size-reducing pooling layer, and the neural network’s completely linked layer. The CNN model is built by integrating one or more of these such layers, and they are used in the scenario of internal parameters to increase the performance of a specific process, e.g., object detection. In this study, the CNN is responsible for obtaining the classification task with a dimensional reduction mechanism. The architecture of the CNN model is observable in the second section of Figure 1.
CNNs have demonstrated significant achievements in computer science research and application. CNNs are structured as hierarchical models, characterized by the CNN and subsampling layers present in alternating order. This architectural design has a resemblance to the arrangement of basic and complicated cells seen in the primary visual brain. Moreover, the network architecture consists of three essential foundational components that must be arranged and assembled as required. The framework of a CNN contains three important tasks, including a convolutional process, a maximal pooling process, and the classification task as the last process. DL based on a CNN is extensively employed in models in the realm of supervised learning for image classification, and they establish a notable standard for numerous benchmark evaluations. Moreover, CNNs utilize multistage, trainable designs. In connection with this, function maps use an array number to calculate the representation of the input and also the representation of the output.

3.3. The Proposed Hybrid AE and CNN for the AMIKOMNET Model

AE consists of two essential processes, including the feature extraction and feature selection stages. Feature extraction is responsible for operating as a decoder, and feature selection is responsible for operating as an encoder. A detailed description of layer transformation for the AE area is shown in Table 3 and Table 4. An explanation of the layer transformation process of the convolutional process from the CNN (to obtain pneumonia, COVID-19, or normal cases, which represent the classification task) is shown in Table 5.
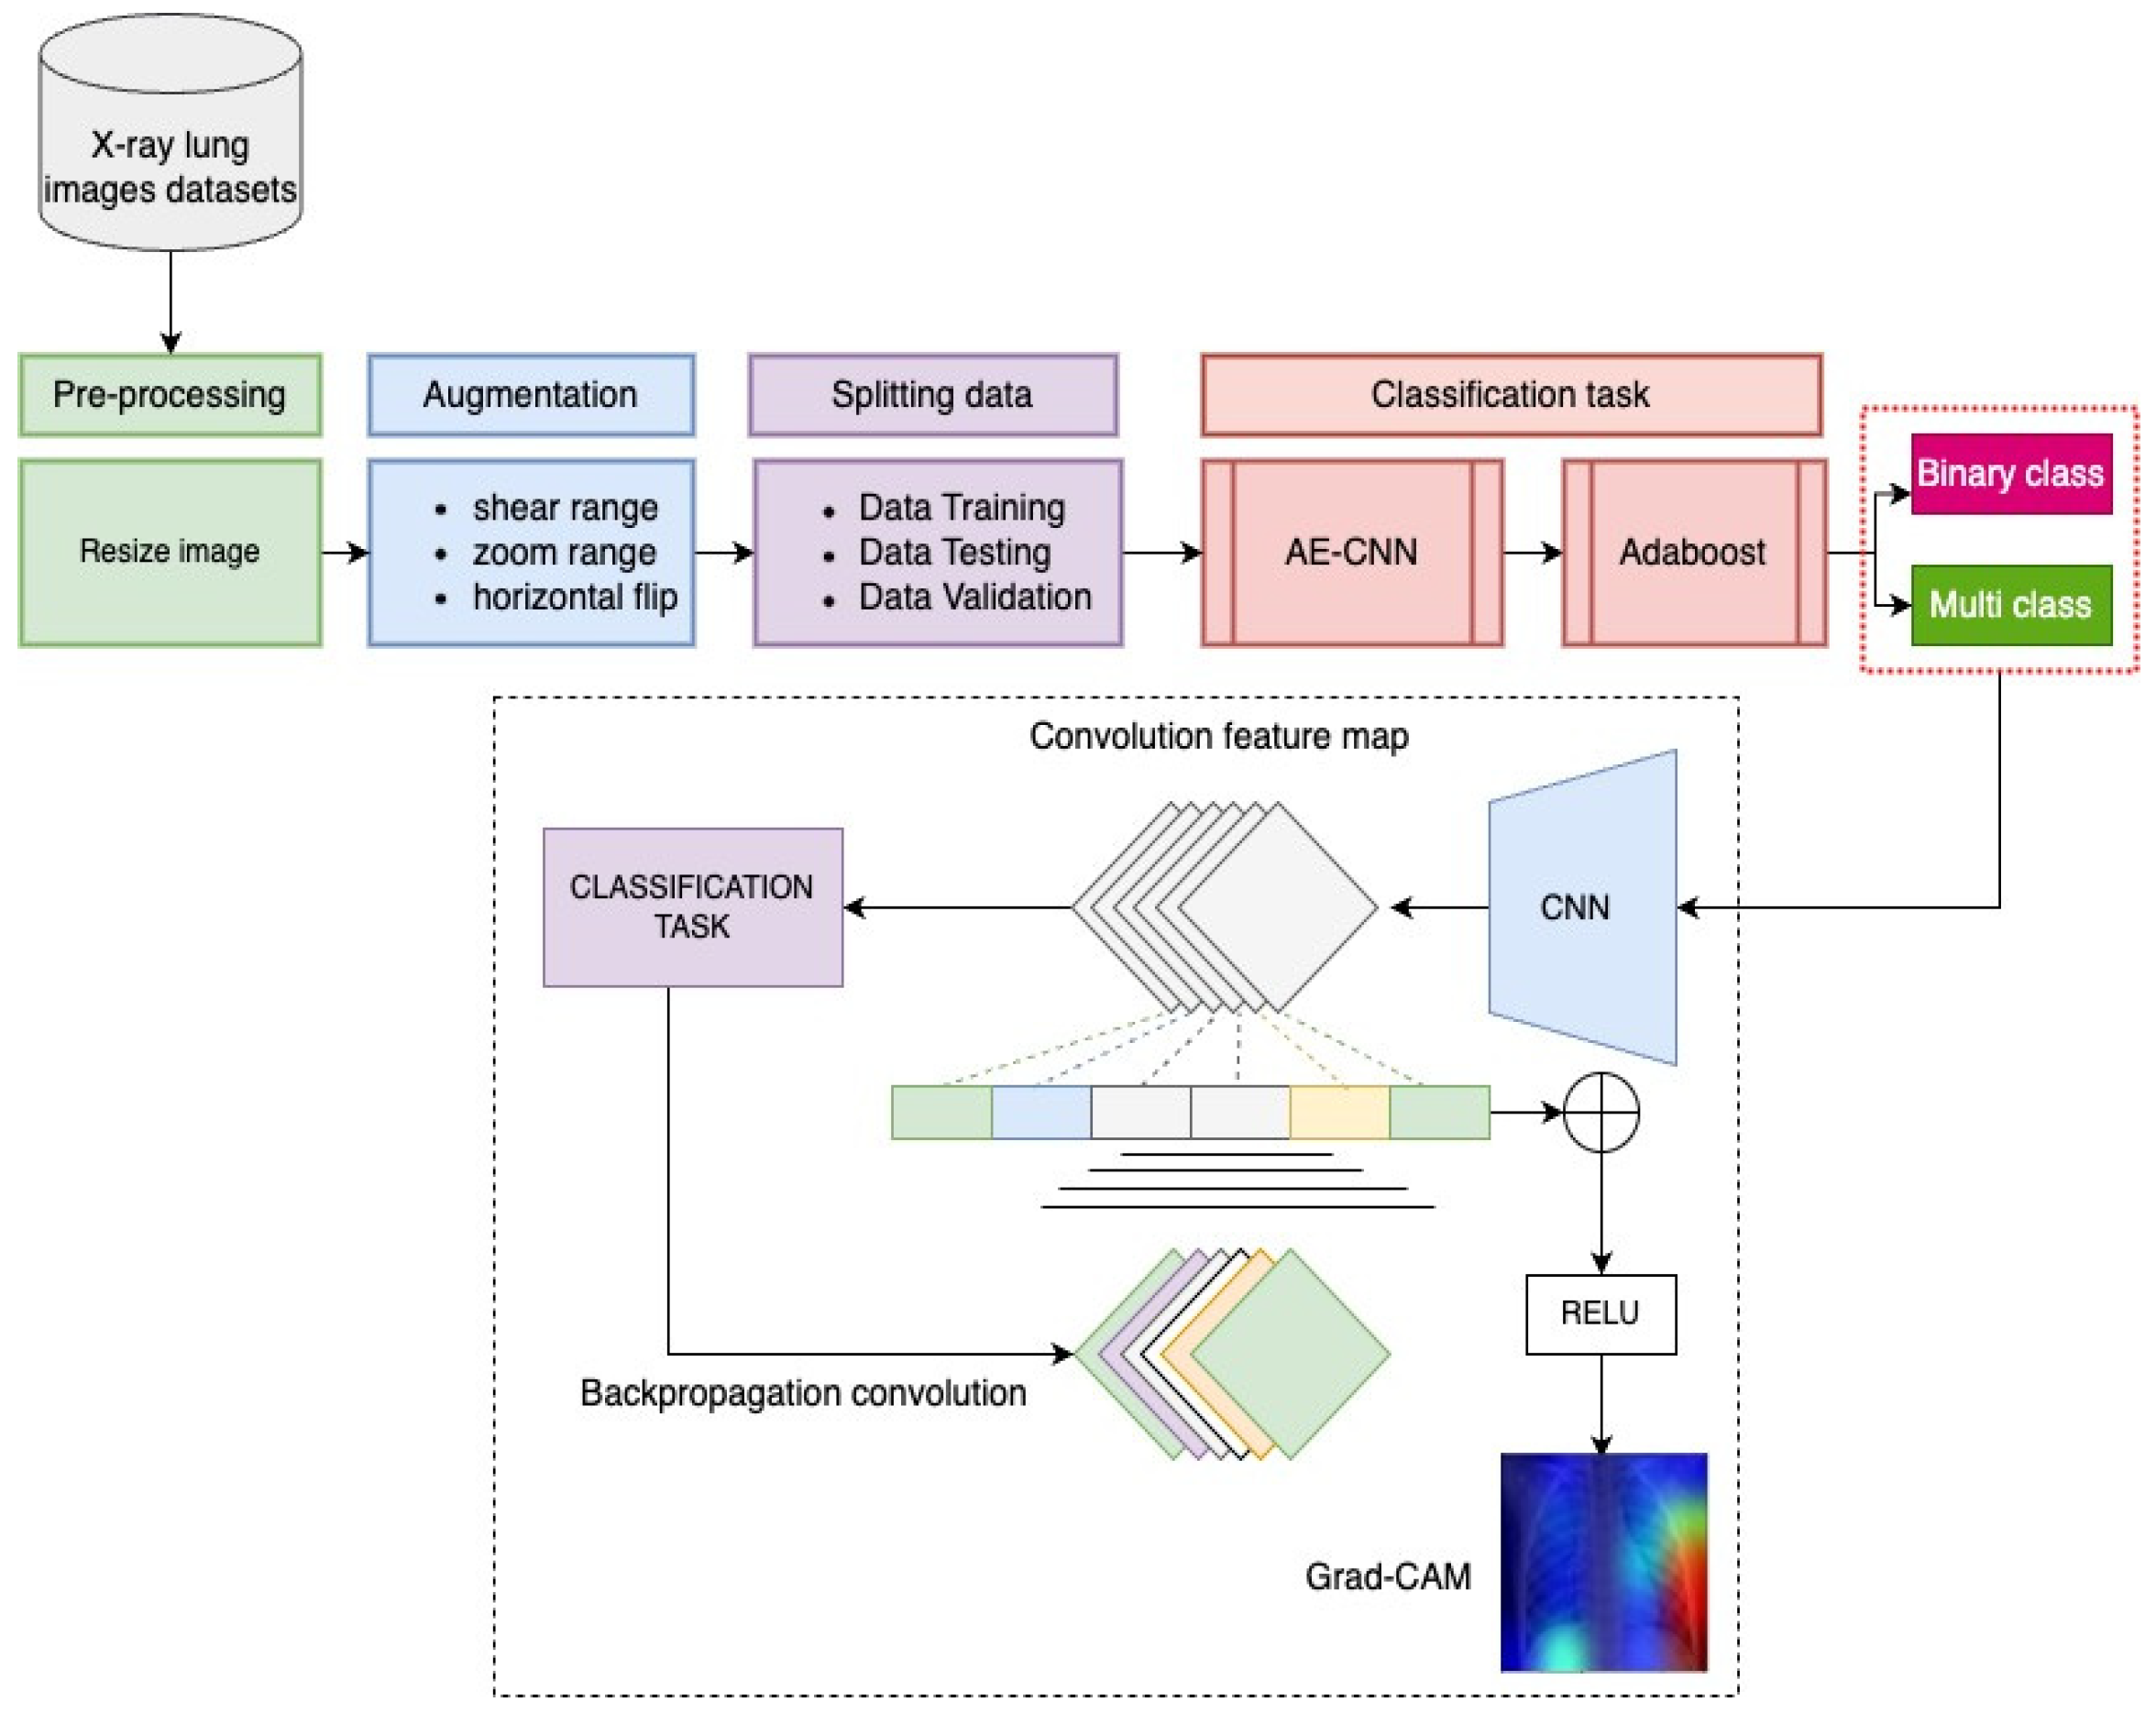
In this study, we developed a DL framework called AMIKOMNET. The main essential goal of our research is to produce an effective framework to classify COVID-19 and pneumonia disease using X-ray lung imagery. We implemented Grad-CAM heat mapping to help medical practitioners analyze X-ray images. The description of several of the processes of the AMIKOMNET framework can be seen in Figure 2. The AMIKOMNET framework includes preprocessing, augmentation, the classification of the hybrid AE and CNN, and the evaluation metrics. The output from the classification result becomes the input for the Grad-CAM engine to obtain a heat map image. An explanation of Grad-CAM used in this study is shown in Figure 2 below.

3.4. Datasets Characteristics

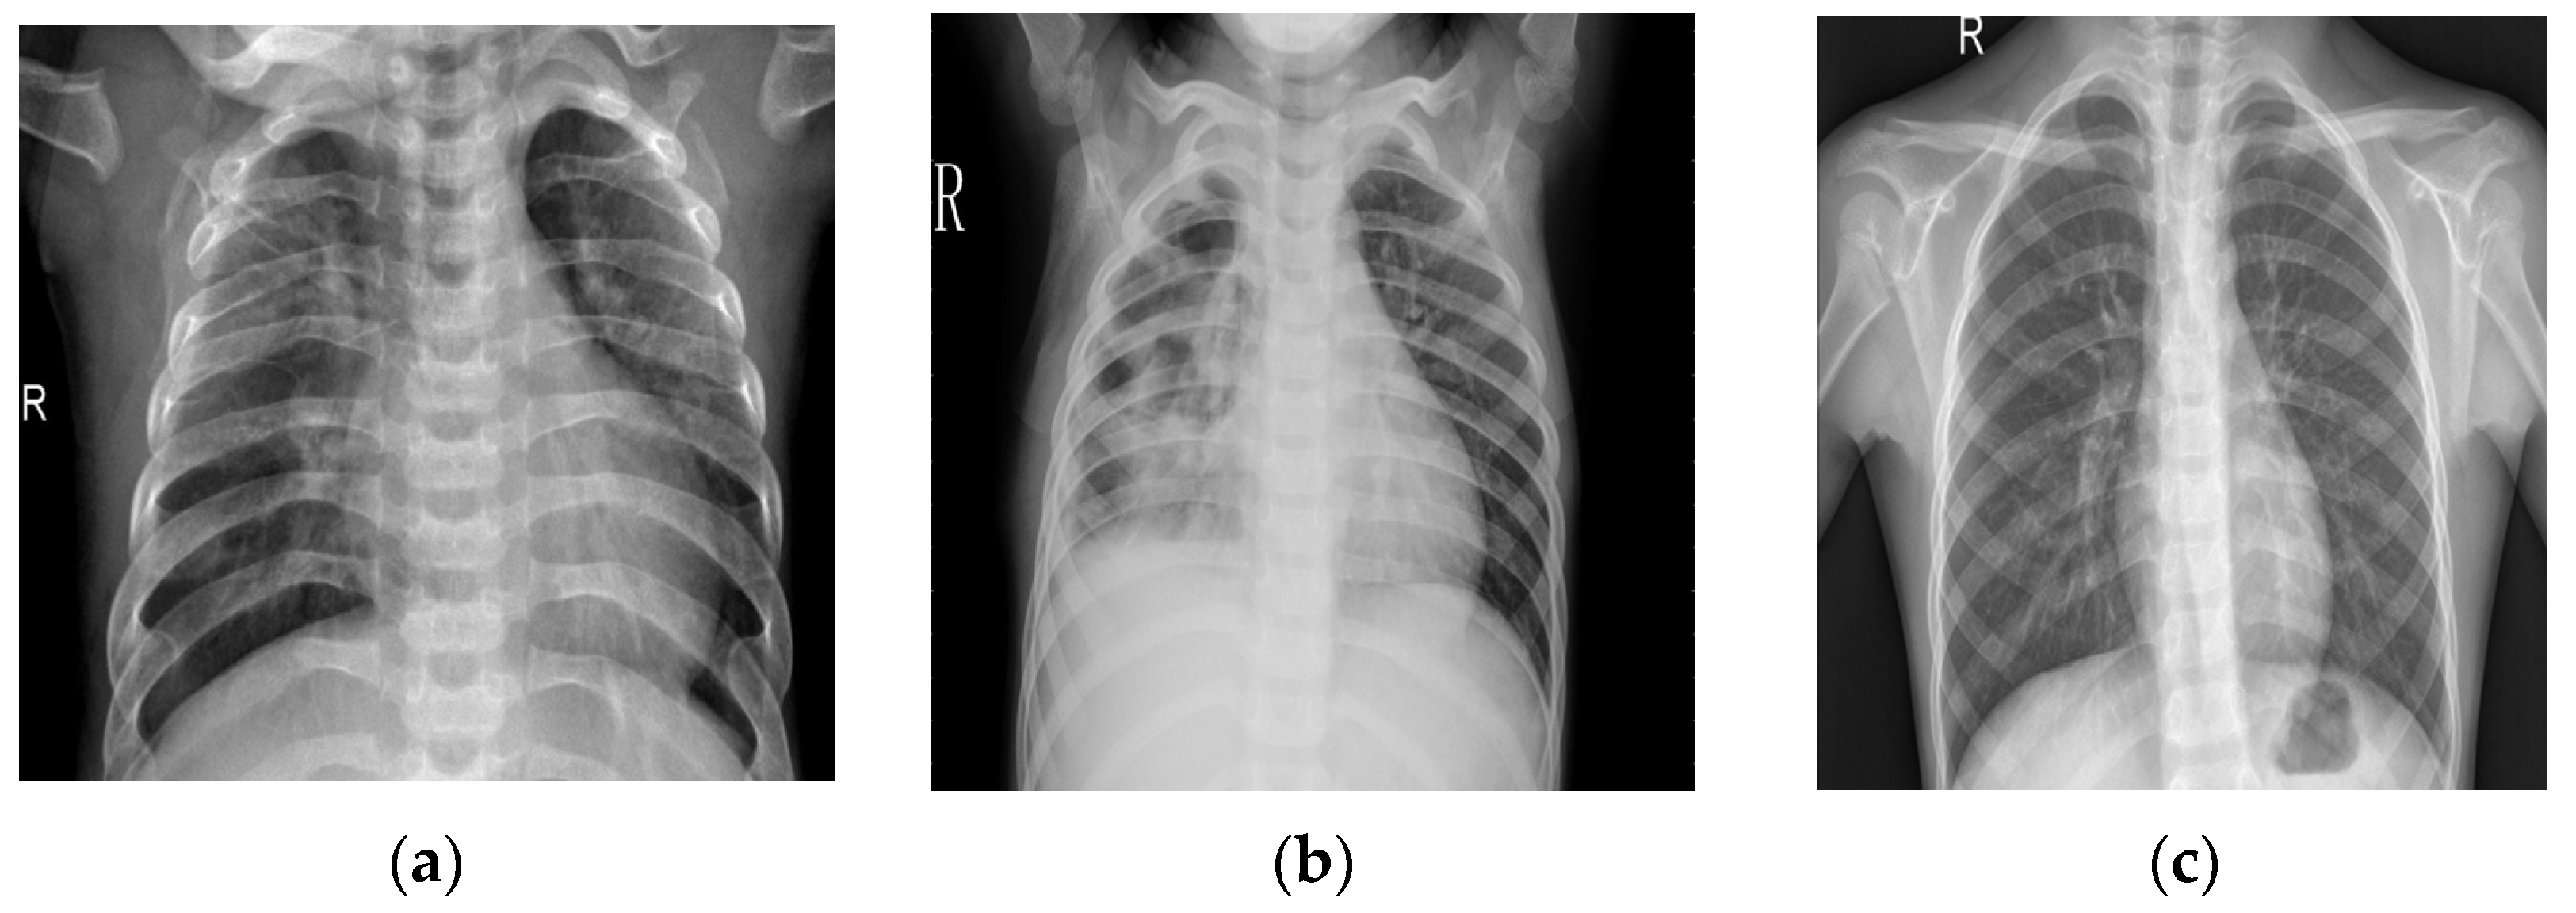
Numerous datasets containing X-ray images, including healthy cases and cases with pneumonia, have been created. Nevertheless, the availability of X-ray images depicting COVID-19 infections is limited. A dataset of X-ray images of patients infected with COVID-19 was obtained from various sources, including GitHub repositories and the Society of Medical and Interventional Radiology (SIRM) database. The dataset containing images of pneumonia and normal X-rays was obtained from the Kaggle repository. Figure 1 and Figure 2 present a collection of images representing the three distinct classes. Lung image data collection is shown in Figure 3, with a normal lung image sample (Figure 3a), a COVID-19 lung image sample (Figure 3b), and a pneumonia lung image sample (Figure 3c).
The dataset consists of 7200 X-ray images that have been prepared. Among the total, 2400 cases are attributed to COVID-19 infections, 2400 cases are associated with pneumonia, and 2400 cases are categorized as normal instances. The training set comprises 70% of the total number of images, the validation set consists of 10% of the images, and the remaining 20% of the images are allocated to the test set. The training dataset consists of 1800 X-ray images, and the validation dataset has 200 images. Additionally, the testing dataset contains 400 images for every class category. Table 6 provides an overview of the dataset size and partitioning according to class.

3.5. Datasets Pre-Processing

The width size of the chest X-rays ranged from 1350 to 2800 pixels, and the height ranged from 690 to 1340 pixels. In the interest of maintaining coherence, we scaled the photos to the predetermined resolution of 256 × 256. It was discovered (see Table 3) that the number of training and validation images required for COVID-19 is significantly lower than those required for other chest disorders. Therefore, in order to solve the problem of overfitting, several data standardization techniques are available. In order to properly train the AMIKOMNET model, the data were normalized for the purposes of this inquiry using pixel normalization techniques. When the datasets were prepared, the AMIKOMNET model was able to receive them and begin the training process.
Prior to processing, it is important to transform and rescale the fundamental chest X-ray image to fit the input layer of the network. Each DL platform has its own unique processing method. For example, SqueezeNet requires resizing to dimensions of 227 × 227 pixels. Additional platforms, such as VGG16, VGG19, RestNet, and DenseNet, necessitate an input size of 224 × 224 pixels. Conversely, Inception mandates that the input be rescaled to a size of 299 × 299 pixels. The dataset was augmented with the implementation of four geometric transformations:
  • To convert the image horizontally, use the height shift range option;
  • Similarly, the image is transformed vertically by using the dimension change range option;
  • Additionally, shear range argumentation was utilized to apply shearing transformation;
  • An argument was used to employ a zoom range to randomly adjust the level of zoom within images.
We configured the augmentation setting with a rescaling step of 1./255, a shear range of 0.2, a zoom range of 0.2, and a horizontal flip with the true option. The experiment implemented an image data generator from the Keras library in Python 3.7.

3.6. Evaluation Result

In aiming to evaluate the effectiveness of our proposed model, we considered adopting evaluation metrics, including confusion matrix, accuracy, F1-score, recall, and precision tests. Accuracy represents the percentage of correct values in the image classification test set. Accuracy is a popular evaluation metric that is used for a classification task and serves to rapidly and intuitively calculate the performance of the model. A confusion matrix, on the other hand, demonstrates the result of the estimation of the actual class and presents a more detailed explanation of the analysis of the classification performance.
The accuracy of a model is measured by comparing how many predictions it accurately guessed relative to how many it mistook. It evaluates the model’s sample classification accuracy, where the accuracy degree can be calculated as
A c c = T P + T N T o t a l   S a m p l e
The recall test is also popularly called sensitivity. Sensitivity represents a positive sample that was truly detected. It can be computed by using the formula as follows:
R e c a l l = T P T P + F P
The proportion of correctly positive predictions is known as precision. Thus, it is illustrative of the following:
P r e c i s i o n = T P T P + F N
The F1-score balances accuracy and recall in a single number. It is a single number that provides an ideal compromise between precision and recall. The formula for the F1-score can be seen as follows:
F 1 s c o r e = P r e c i s i o n × R e c a l l P r e c i s i o n + R e c a l l
where the number of cases that are correctly identified as positive by a model is sometimes known as “True Positives” (TP). The number of instances that were correctly labeled negative by the model is sometimes known as “True Negatives” (TN). Incorrectly identified positive examples are known as false positives (FP). The number of samples that were wrongly labeled as negative by the model is also known as false negatives (FN). They represent the sum of all the data values in the dataset.

4. Results and Discussion

4.1. Classification Result Measurement

In this study, we adopted some experimental evaluation reports, including evaluation metrics and image analysis. The evaluation metrics are responsible for understanding the effectiveness of the AMIKOMNET model in detecting pneumonia-infected, COVID-19-infected, or normal lungs. We also compared the effectiveness of the AMIKOMNET model with previous works. Moreover, the second essential evaluation metric used was image analysis based on Grad-CAM. Basically, the Grad-CAM model implements some targeted design flowing into the last convolution network with the aim of producing a coarse image mapping spotlight for the essential area from the X-ray image of the lung. The Grad-CAM model is responsible for extracting the detection model of the pneumonia lung case. The use of Grad-CAM makes understanding the results easy for people. Grad-CAM creates the highlighted area influenced by pneumonia or COVID-19 in the lung X-ray image. Unfortunately, without the Grad-CAM mechanism generated by the convolutional mechanism, the image cannot be distinguished by using normal human vision.
In this study, we used AMIKOMNET to classify pneumonia-infected, COVID-19-infected, and normal lungs based on X-ray images. The details of the experimental results are shown in Table 7 for the binary class and Table 8 for the multiclass. AMIKOMNET consists of two models, including AMIKOMNET-1 and AMIKOMNET-2. The AMIKOMNET-1 model involves a hybridization of AE and CNN, while the AMIKOMNET-2 model involves a hybridization of AE, CNN, and AdaBoost. According to the experimental reports in Table 7, AMIKOMNET-1 achieved 96.90% accuracy, 95.06% recall, 94.67% F1-score, and 96.03% precision. Meanwhile, the AMIKOMNET-2 model achieved 98.45% accuracy, 96.16% recall, 95.70% F1-score, and 96.87% precision. AdaBoost played an important role in increasing the effectiveness of AMIKOMNET-2. AMIKOMNET-2 outperformed AMIKOMNET-1 in every evaluation metric. Surprisingly, AMIKOMNET-1 and AMIKOMNET-2 are both superior to previous work, including CNN, VGG-16, DenseNet, RestNet, MobileNet, and Inception. The hybridization between AE and CNN succeeded in increasing the performance of the models in the classification of COVID-19 and pneumonia. Moreover, the adoption of AdaBoost in AE and CNN successfully boosted AMIKOMNET. The AdaBoost-adopted ensemble for learning optimized performance in the classification task.
Table 8 demonstrates the experimental results of a multiclass scenario for several DL model variants in detecting the cases of normal, pneumonia-infected, and COVID-19-infected lungs. Table 8 shows a comparison of the results of AMIKOMNET1 and AMIKOMNET2 with recent state-of-the-art models. Following our experimental report, both proposed models achieve better effectiveness over CNN, VGG16, MobileNet, RestNet, and DenseNet. The hybrid AE and CNN setup succeeded in increasing its effectiveness over previous works using CNN, VGG, RestNet, and DenseNet. AMIKOMNET-1 integrated an AE into a CNN model with the aim of succeeding at a lung image classification task. This is different from the overall competitor model, which only implements convolution layers. The role of the AE algorithm in reducing the image dimensions with feature selection representation is very important. Even though the lung image dimensions of latent space are quite small, the dimensional lung image obtained a more representative vector space. Moreover, the CNN algorithm responsible for classifying lung diseases showed tremendous performance. In contrast to AE, the CNN involves a convolutional model that reduces the dimensions of the lung image. The CNN has a very important role in generating a convolutional layer in small lung image dimensions, which only requires a resolution of 31 × 31 × 8. On the other hand, the combined usage of AE and CNN as a feature selection engine and convolutional dimensional reduction engine is very useful for enhancing performance in the lung image classification task.
In the second proposed model, called AMIKOMNET-2, we implemented the hybridization of AE and CNN with the AdaBoost technique. AdaBoost is an ensemble learning model that applies DL and upgrades a multiplication (shortcoming) classifier to a useful platform classifier. The scenario of the AMIKOMNET-2 experiment is similar to our previous model, where the results show an accuracy of 96.65%, a recall of 94.93%, an F1-score of 95.76%, and a precision of 96.17%. The effectiveness level from the implementation of AdaBoost reached 1.52% in accuracy, 2.76% in recall, 3.94% in F1-score, and 5.52% in precision (see Table 8). Our experiment of a comparison scenario also considered similar datasets, augmentation processes, and ratios for splitting the testing and training data.
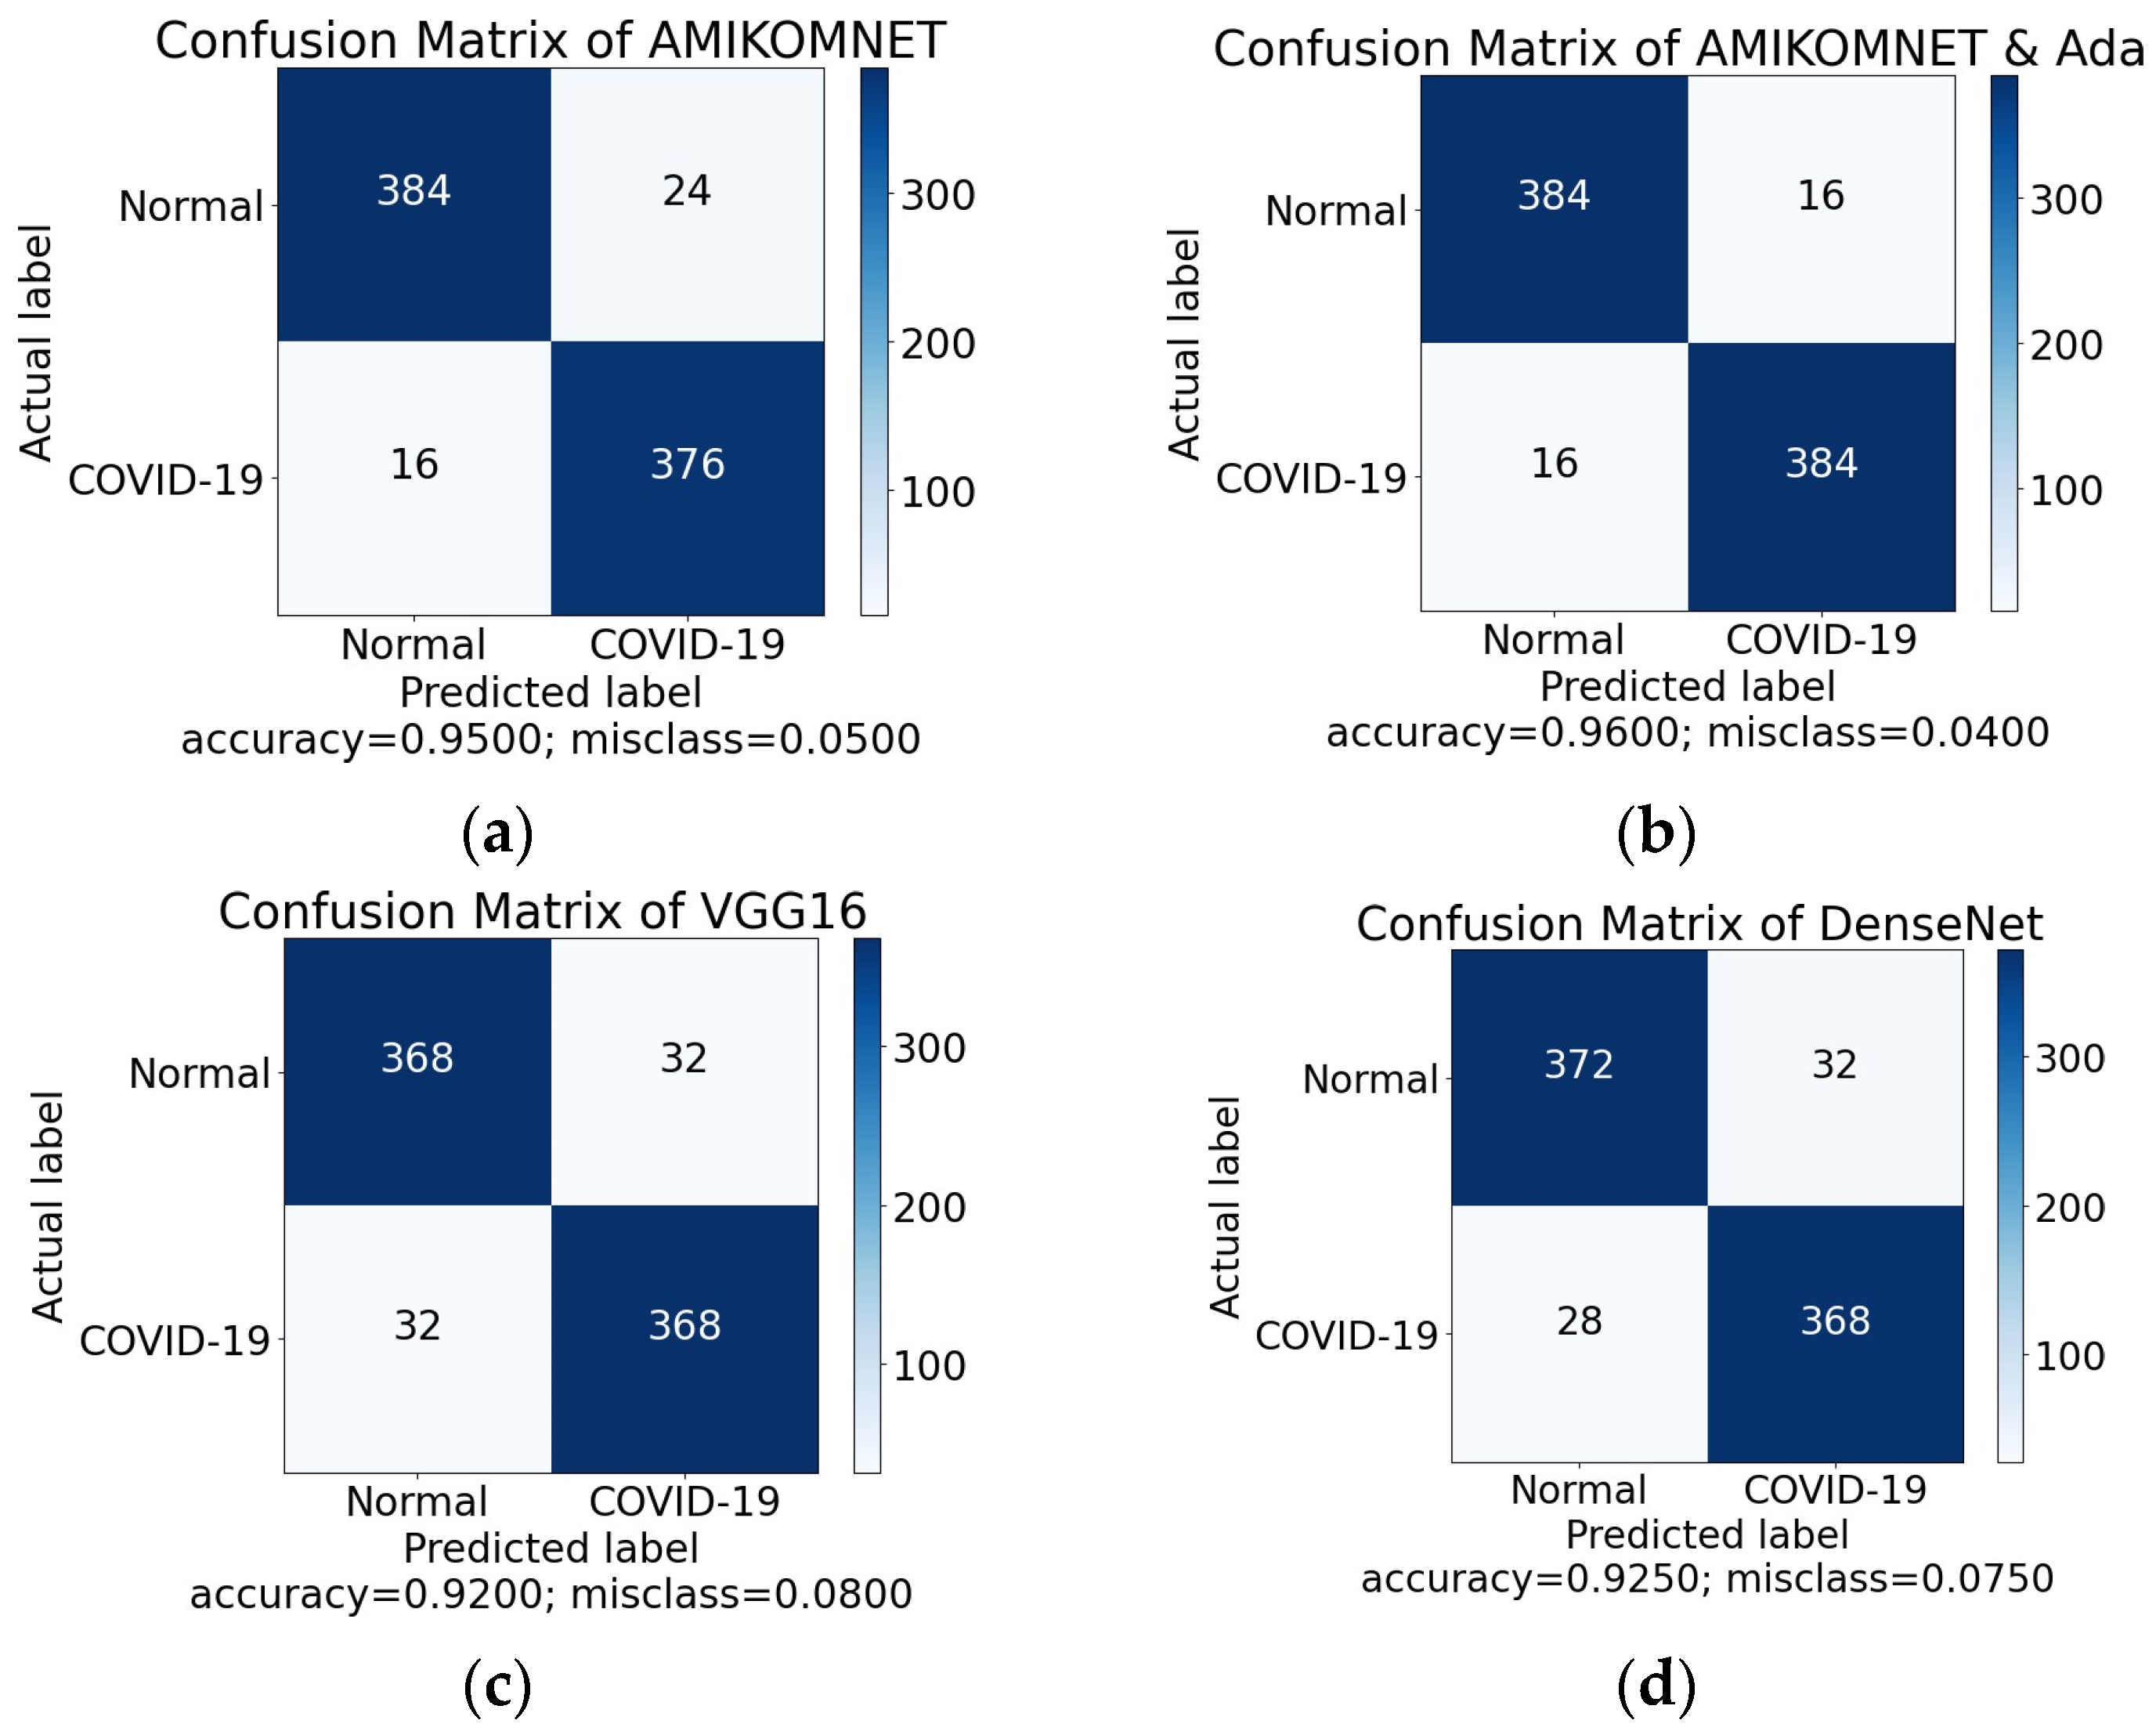
In this evaluation metric, we considered the implementation of a confusion matrix to evaluate the binary class of our proposed model. The completion of the confusion matrix evaluation result can be seen in Figure 4 below. According to the confusion matrix report, the AMIKOMNET-1 model (hybrid AE and CNN only) (Figure 4a) achieved better effectiveness than VGG-16 (Figure 4c). AMIKOMNET-1 achieved 95% for correct classification and 5% in misclassification, whereas VGG-16 only achieved 92% in correct classification and 8% in misclassification. There is a significant increase in accuracy of 3% for true classification over VGG-16, and misclassification was 3% lower than VGG-16.
In the second confusion matrix for AMIKOMNET-2 (Figure 4b), where the model integrates AE, CNN, and AdaBoost, the model was evaluated and demonstrated 96% in correct classification, with a misclassification of 4%. The increase in effectiveness of classification performance between AMIKOMNET-1 and AMIKOMNET-2 is 1%. Moreover, AMIKOMNET-2 is superior to VGG-16 by 4%, according to the confusion matrix, achieving an increase in effectiveness of 3.5% when compared to the DenseNet model.
Our proposed model also underwent a multiclass classification task, including normal, COVID-19-infected, and pneumonia-infected lungs. The result of the experiment is presented on a confusion matrix, as shown in Figure 5a–d. AMIKOMNET-1 achieved 93% in true detection and 7% in misclassification detection (see Figure 5a). AMIKOMNET-2 achieved 94.67% for true classification and 5.33% for misclassification (see Figure 5b). Moreover, both models are superior to VGG-16 (Figure 5c) and DenseNet (Figure 5d), with significant performance.
The hybridization of dual DL approaches was finalized to develop a novel model named AMIKOMNET. The AMIKOMNET model faced several serious shortcomings when applied in real medical work. There are several essential problems concerning many misdetection results, for instance, in the case of the binary class classification task, where there were normal patient conditions that were detected as COVID-19. The AMIKOMNET model produced misdetection in 5% of the results (Figure 4a), whereas AMIKOMNET with AdaBoost produced misdetection in 4% (Figure 4b) of the results. Hence, this is, indeed, a serious problem, as the patients who were detected as COVID-19 patients were detected as normal patients by the AMIKOMNET algorithm. If the model were to be applied in the real medical world, people who are infected with COVID-19 would be declared as normal patients, and as such, they could have possibly spread coronavirus further in society. The condition will be difficult to prevent because patients do not receive specific treatments, whereas COVID-19 patients must be quarantined and receive additional medicine and nutrition.
The AMIKOMNET model was implemented in a multiclass classification task, including normal, pneumonia, and COVID-19 cases. Surprisingly, based on the confusion matrix test, the AMIKOMNET model achieved significant performance over previous work using VGG-16 and DenseNet. Unfortunately, the AMIKOMNET model produced several misclassifications, equating to 7% of the results (Figure 5), whereas AMIKOMNET with AdaBoost produced misclassifications in 5.3% (Figure 5b) of the results. The multiclass classification task for COVID-19 provides a very hard challenge where misdetection cannot be reduced significantly. In this case, normal patients were detected as having COVID-19 and pneumonia. Some patients with COVID-19 were detected as normal or with pneumonia, and some pneumonia patients were detected as having COVID-19 and as normal patients. It is a very serious issue when a COVID-19 patient is detected as a normal patient because they can interact with the public/society and potentially transmit COVID-19 further. In the same vein, this is very dangerous for COVID-19 patients who are tagged as normal because they do not receive special treatment and therapy, endangering the health of the person infected with COVID-19. However, normal patients tagged as COVID-19 or pneumonia patients are not considered serious misclassification, and a COVID-19 diagnosis detected in a pneumonia patient would influence the kind of medicine, medical treatment, and therapy that would be given.
COVID-19 patients who are detected as pneumonia patients need special attention, and this also requires serious treatment. The mistaken detection of the two classes of pneumonia and COVID-19 would have a serious impact. Pneumonia and COVID-19 are clearly different, even though they sometimes have similar symptoms. Pneumonia is a lower respiratory tract infection that causes inflammation or acute inflammation of the lung parenchyma, whereas COVID-19 is a serious upper respiratory tract infection that can eventually spread to the lungs [60]. Health experts and researchers have agreed that these two diseases require different treatments. The incorrect treatment of or confusion between these two classes of diseases will have fatal consequences for the patient.
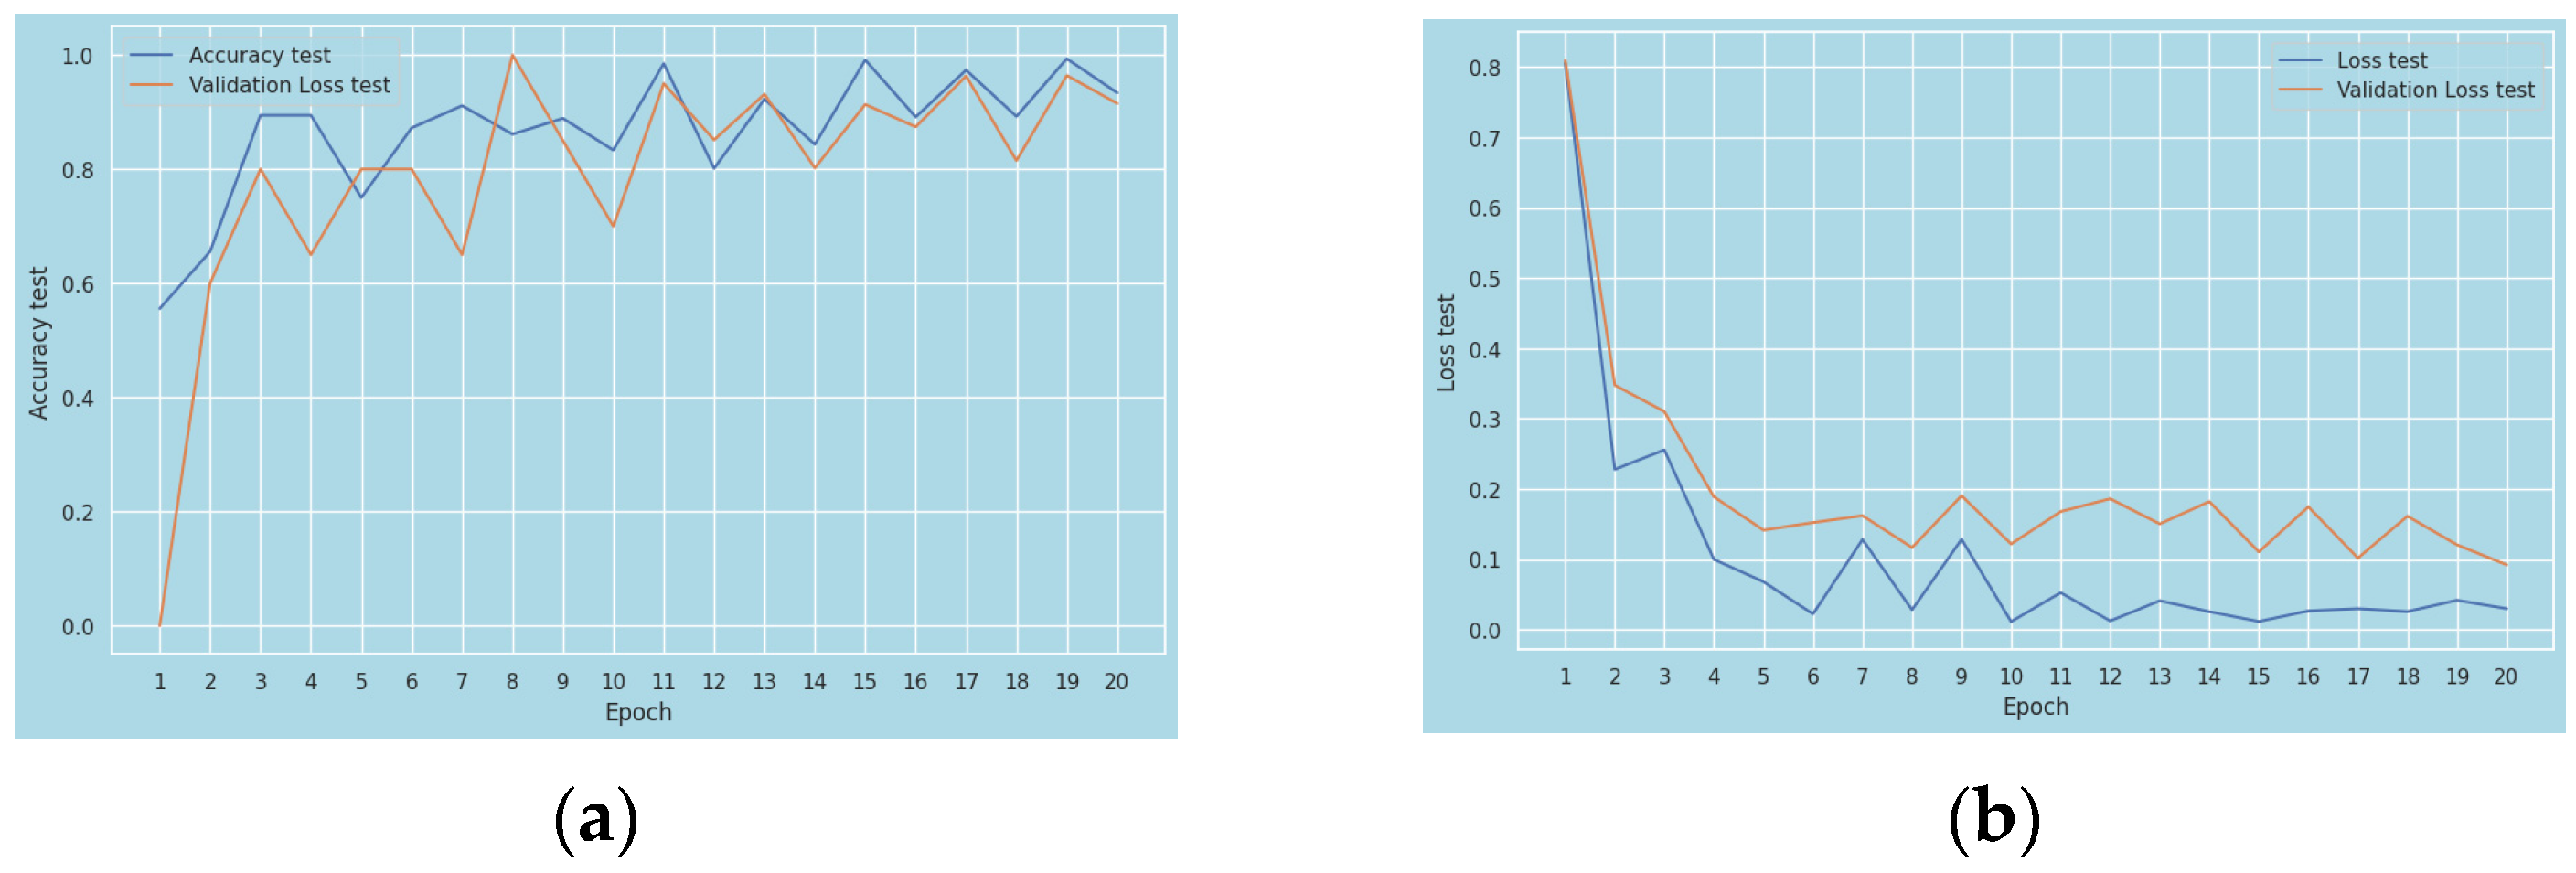
Based on Figure 6b,d, we can see that the loss values spike dramatically at the beginning of the training section and then decline noticeably as the training progresses. Since there are significantly fewer observations in the COVID-19, pneumonia, and normal classes, this dramatic increase and decrease can be explained by the former. These extreme fluctuations are mitigated toward the end of training, thanks to the deep model’s repeated inspection of all X-ray images for each training epoch. The lost test result of AMIKOMNET-1 demonstrated a value of 0.0377, and the lost validation test saw 0.04389, whereas the AMIKOMNET-2 loss test achieved 0.0252, and the loss validation test achieved 0.03389. Both of our proposed models reached near 0 values. According to the evaluation performance of the ML principal point of view, a result close to 0 is an excellent result. A detailed description of the loss test results can be seen in Figure 6, and an illustration of the loss test training process can be seen in Figure 6b,d. Following on from the evaluation model using the loss test, the AMIKOMNET model achieved the best performance in the COVID-19 classification task.
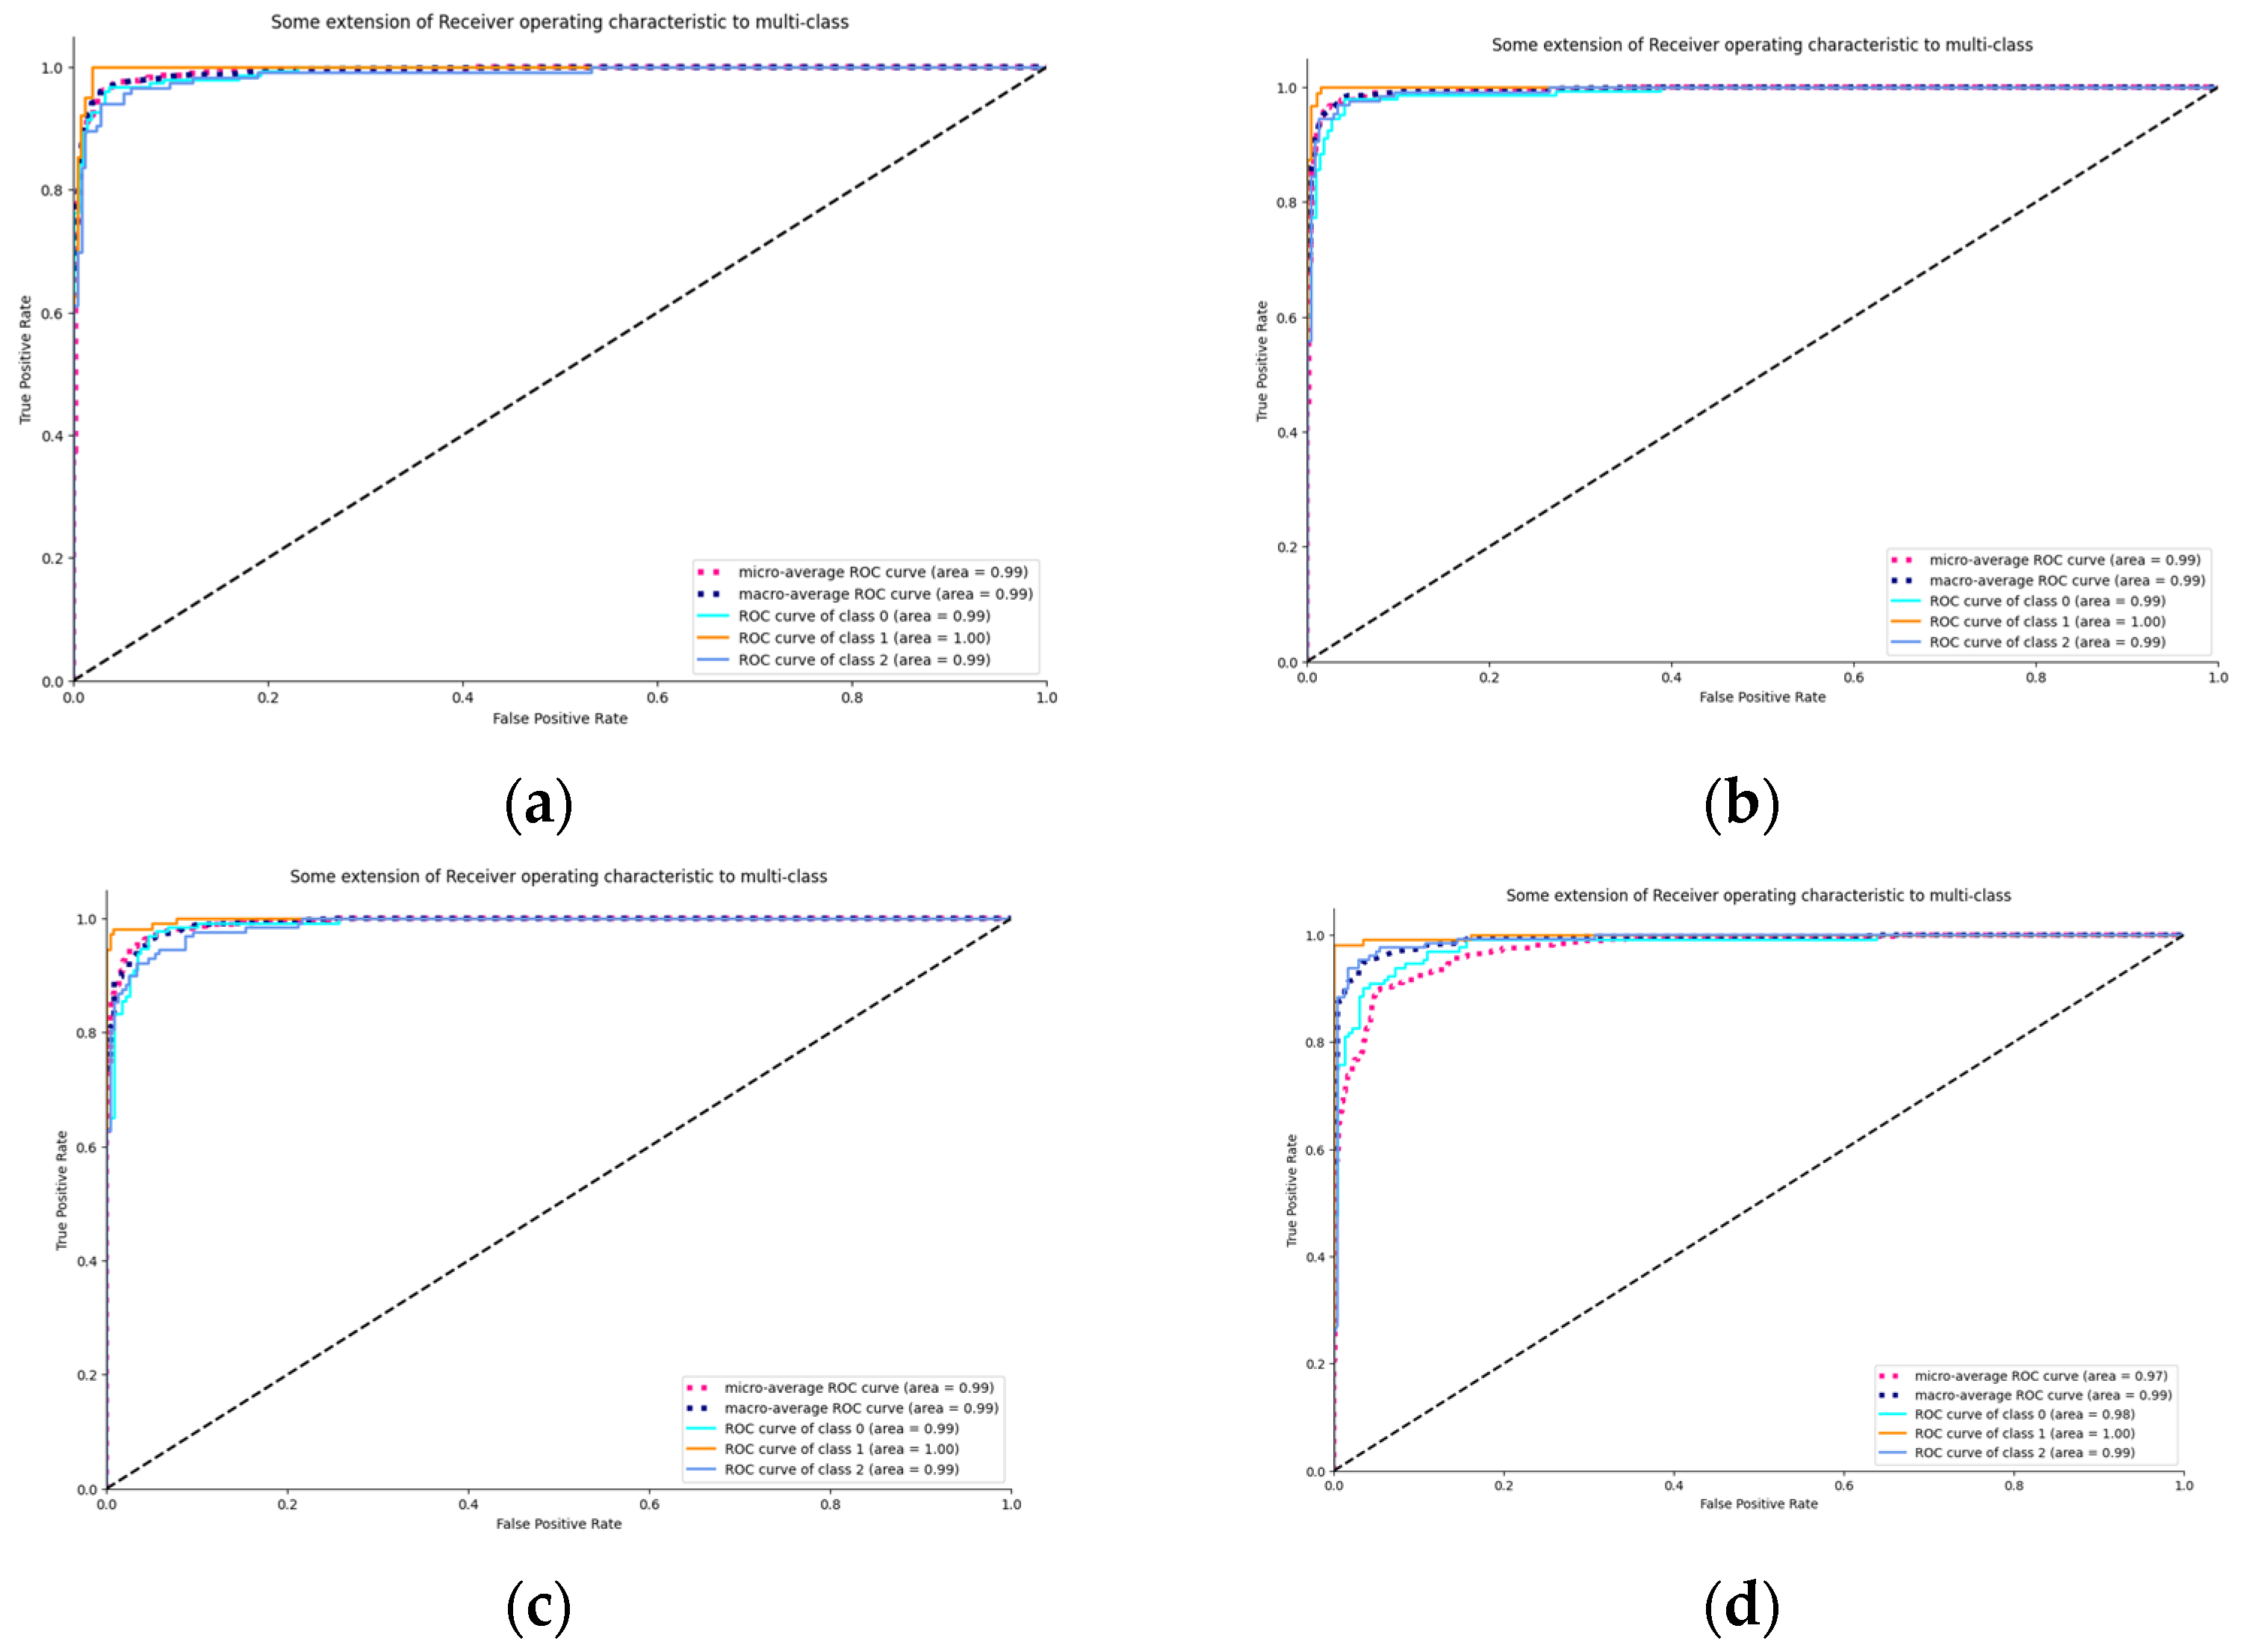
This study evaluated the performance of the models using AUC (area under curve). Evaluation based on AUC can observed to satisfy model development. A feasible model produces a value of 1 or close to 1. The evaluation results are demonstrated in Figure 7, where Figure 7a represents the AUC of AMIKOMNET without Adaboost, Figure 7b represents AMIKOMNET with Adaboost, Figure 7c represents VGG16, and Figure 7d represents DenseNet. The light blue color represents the COVID-19 class, the orange color represents the normal class, and the dark blue color represents the pneumonia class, the black dash line color represents the random guess.
The AUC evaluation report shows that AMIKOMNET and AMIKOMNET with Adaboost achieved satisfactory results, with 0.99 for the COVID-19 class, 1.00 for the normal class, and 0.99 for the pneumonia class. Our proposed model achieved better performance over state-of-the-art deep learning models, including VGG16 (see Figure 7c) and DenseNet (Figure 7d).

4.2. Radiologist Opinion

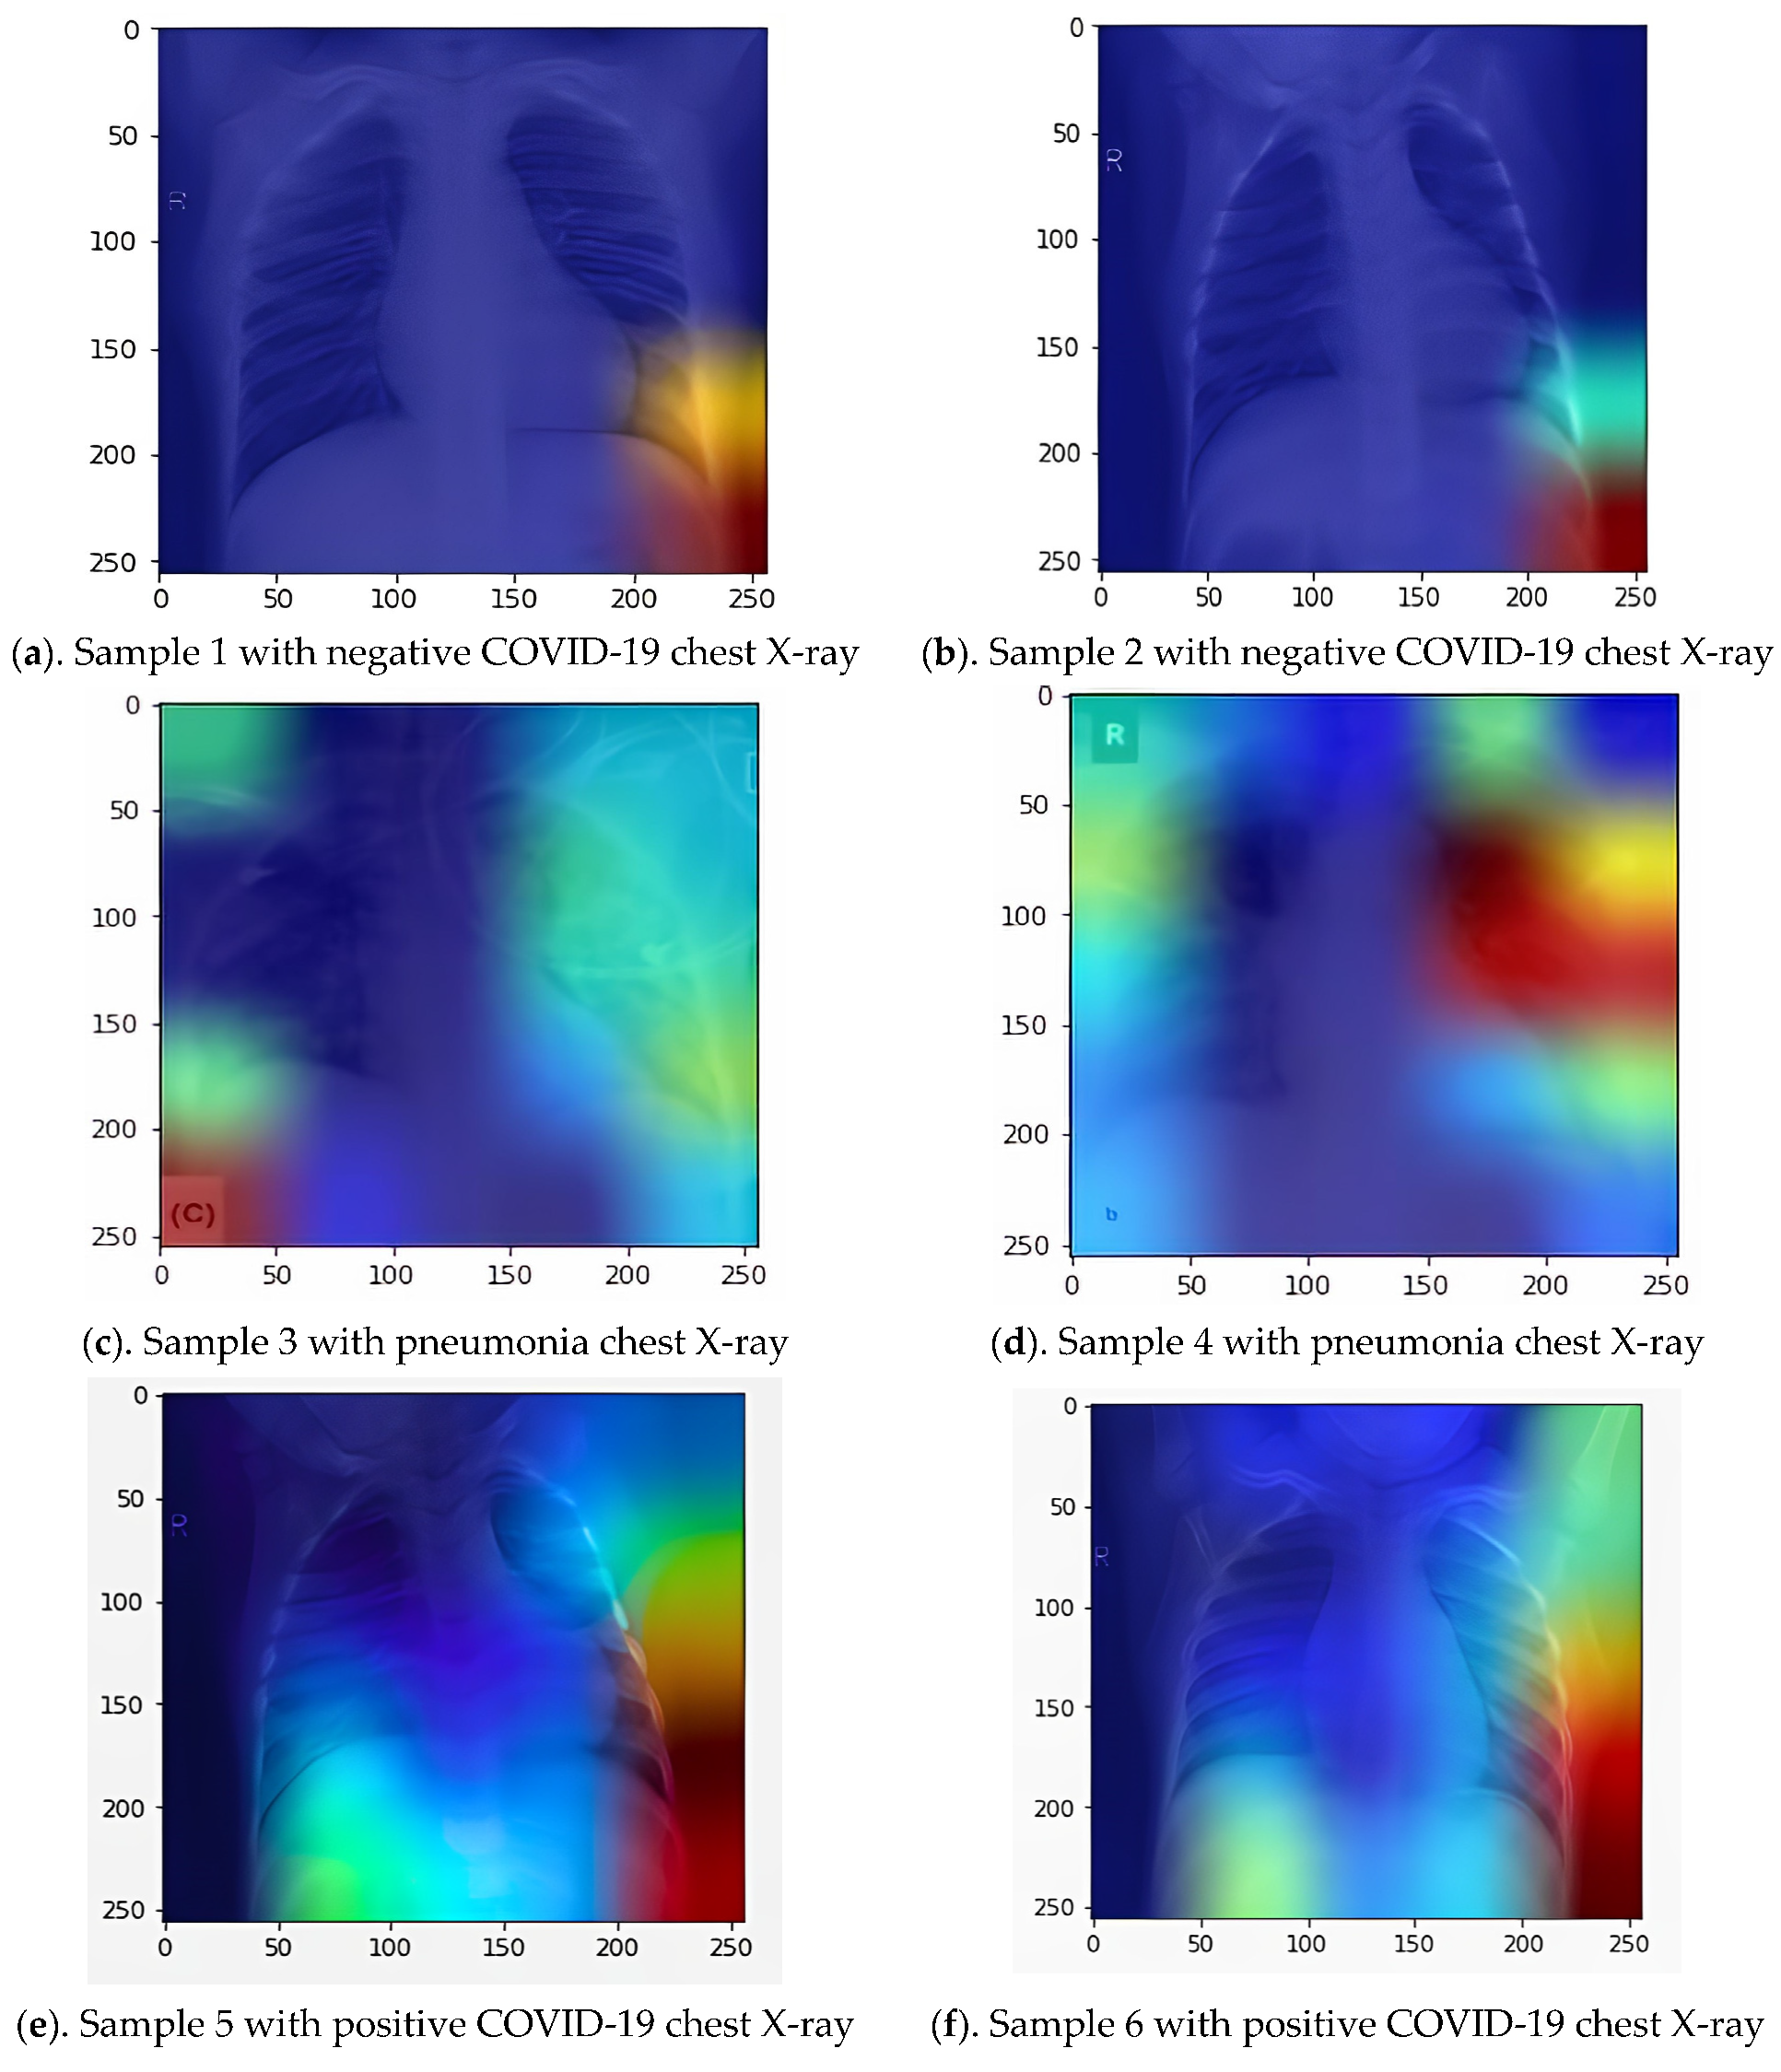
In this part, a radiologist with extensive experience in using the AMIKOMNET model interprets the obtained results. Automatic COVID-19 detection in X-ray images is the goal of the AMIKOMNET model, which does not rely on any human-created feature extraction methods. The created model is useful in giving a second opinion to highly trained radiologists in hospitals. It has the potential to greatly ease doctors’ workloads and aid them in making correct diagnoses in their regular practice. Due to the proposed model’s efficiency (the diagnostic process is quick), doctors can devote their attention to more pressing matters. As part of this effort, we have shown the model’s results to board-certified radiologists for validation. We gave radiologists access to both the model’s worst prediction errors and the dataset’s original labels. We also employed Grad-CAM with heat mapping to graphically represent the deep model’s choices. The model’s focus on particular X-ray features is highlighted by the heat map (see Figure 8). Figure 8a,b represent normal lungs, Figure 8c,d represent pneumonia-infected lungs, and Figure 8e,f represent positive COVID-19-infected lungs. There is an extreme difference in color and pattern for the area heat map between the normal, pneumonia, and positive COVID-19 cases, wherein positive COVID-19 cases dominate the heat map with the colors red, yellow, and green. Moreover, the lung image with positive COVID-19 covers a larger area of the heat map. In this manner, we know that the radiologist has given their stamp of approval to the model’s findings. The medical employee can detect the location of the impact of pneumonia due to COVID-19.
Time consumption is a representation of the computation cost of the CPU to learn the model. The majority of deep learning algorithms were highly time-consuming in reaching convergence. Our experiment tried to analyze time consumption in each experiment with the same datasets and hyperparameters. The detailed results of the time consumption experiment for each deep learning model are shown in Table 9. In general, the more complicated the layer in a deep learning model, the more expensive the computational costs, meaning the time required for learning will be longer. Our model is made using traditional hybrid machine learning, which has a low computational cost. Our model only needs 1020 s to achieve convergence. Our model still produces high accuracy compared to modern deep learning models, which have very high and expensive computing costs.

4.3. Evaluation Using Grad-CAM Heat Map

CNN models are typically regarded as a black-box technique for image processing across different levels. Selvaraju et al. [70] introduced Grad-CAM as a compelling method for diagnosing issues in nearly any CNN model. This methodology offers a heat map that allows us to visualize the model’s processing of the datasets and identify the parts of the images that have the greatest impact on the prediction choice. This is achieved by locating and processing the gradient of the target in the final convolutional layer. This strategy involves monitoring the prediction process by utilizing the last convolutional layer. A weighted summation of the feature maps is conducted for each prediction, with the aim of identifying the primary regions within the original image that have a significant impact on the conclusion made by the model. The outcome is a heat map that can be linked to the original image for visualization purposes. This methodology aids in ascertaining if the model accurately predicts COVID-19 cases by considering the appropriate area of infection in the chest. Figure 8 depicts an authentic X-ray image of a COVID-19 case that was utilized for predictive analysis using several CNN models.
The second research objective is to produce an analysis of a lung image using Grad-CAM to help medical practitioners analyze normal cases, pneumonia, or COVID-19 based on visualization. The DL technique makes it possible to produce the specific location of impact of the disease in terms of the center area of the disease. This Grad-CAM technique is very important in the implementation of this because normal human visualization cannot distinguish between normal cases, pneumonia, and COVID-19. In the first process, we collected six images from the classified results of the AMIKOMNET model with three sample categories, including normal, pneumonia, and COVID-19. We generated six image samples through the Grad-CAM process. The result of the heat map lung visualization with normal, pneumonia, and COVID-19 cases is shown in Figure 8, with Figure 8a,b presenting normal cases, Figure 8c,d presenting pneumonia, and Figure 8e,f presenting COVID-19. On the other hand, the adoption of a CNN to produce a heat map using the Grad-CAM mechanism possibly supports doctors or radiologists in distinguishing between COVID-19 and pneumonia. The heat map represents an area with COVID-19 with different color territory. The different colors dominate, with red, yellow, and light green with a blue background. For instance, Figure 8a,b present a normal patient without COVID-19. The heat map distribution covers a relatively small area. In contrast, Figure 8e,f represent a lung image of COVID-19. The heat map color with red, yellow, and green is distributed around the lung area, where red shows the center of impact, and this can be inferred as the area in the lung that received serious impact from COVID-19. This is evidenced by the appearance of colored spots on the lungs. However, the heat map that appears does not focus on those areas affected by COVID-19 or pneumonia. The distribution of the heat map area is too wide over a large area, even reaching into areas that are not in the lungs, such as outside the area around the chest. A pneumonia chest X-ray is distinguished by the presence of infections or pleural effusion, particularly the accumulation of fluid within the alveoli. This fluid accumulation manifests as areas of increased radiopacity, appearing as white spots in a lung X-ray, as depicted in Figure 8c,d. The possibility exists that pneumonia may occur at an early stage. We attempted to evaluate our Grad-CAM proposed model, where our main concern was to ensure that the model worked properly. The model should have its own ability to detect a correct pattern from a lung image. The Grad-CAM model implemented gradient descent using a convolutional network to generate a raw, coarse area heat map, marking the essential area in the lung image as remarkable.
The bias between the image datasets among the normal, pneumonia, and COVID-19 results causes inaccuracies in the models. The similarity is due to the detection of the disease being too early so that the impact is not too severe, and the differences in the patterns in the images are not very obvious. The next factor is that pneumonia and COVID-19 in acute conditions will experience similar patterns, so the difference between pneumonia and COVID-19 is insignificant. This causes the AMIKOMNET algorithm to experience difficulty in distinguishing between the two classes of image. In some cases, error detections in a classification model, especially those involving images, are caused by the quality of the image. This also occurred in this study, where the data sources were obtained from different sources, and the image producers did not have the same standards in carrying out the X-ray scanning process on lung images. On the other hand, the image data set falls in the bias factor, where the patterns between class areas are almost the same. On the side of correct detection by the AMIKOMNET algorithm, such as Figure 8e,f as a representation of lungs affected by COVID-19, the image shows lung damage concentrated in the lower part of the lungs. In contrast to pneumonia infection, the lung damage is focused on the upper part (see Figure 8c,d).

5. Conclusions

In this study, we demonstrated a novel structure for a deep learning model. Our model incorporated an AE and a CNN to detect normal, pneumonia, and COVID-19 cases. We also implemented ensemble learning in terms of AdaBoost, aiming to increase the effectiveness of the classification result. The results of the experiment demonstrated that our proposed model, named AMIKOMNET, effectively succeeds in classifying normal, pneumonia, and COVID-19 cases using lung X-ray images. From a computation cost point of view, our proposed model with a simple AE and CNN required fewer parameters, which is in contrast to existing deep learning models, which need millions of parameters. The simple AE layer is responsible for extracting the image features, and the CNN is responsible for the finalized classification task. We believe that the simplicity of the AMIKOMNET model is suitable for low computation costs, a low number of epochs to learn data training, and less time for the training process.
In the second study, we proposed a Grad-CAM model to obtain a heat map representation of lung images from X-rays. The Grad-CAM image material was collected from the AMIKOMNET results that determined lung images with COVID-19, pneumonia, and normal conditions. We anticipated that the Grad-CAM application could support medical practitioners in analyzing the impact of pneumonia from COVID-19 infection, clearly showing the localization area of the lung images. Our Grad-CAM application adopted a CNN as its main algorithm for learning the heat map area territory. As a result, the adoption of Grad-CAM succeeded in producing a heat map localization area in relation to the impact of normal, pneumonia, and COVID-19 cases. In a future study, we will implement various schematic hybrid models, such as MLP, LSTM, Attention, and so on. Image preprocessing enhancement, such as contrast enhancement and white balance, will be considered in future work.

Funding

APC was supported by Universitas Amikom Yogyakarta with Grant Number 2FEB2024.

Institutional Review Board Statement

Not applicable.

Informed Consent Statement

Informed consent was obtained from all subjects involved in the study.

Data Availability Statement

X-ray images in this study come from Kaggle; a detailed dataset can be accessed with the following link: https://www.kaggle.com/datasets/sid321axn/covid-cxr-image-dataset-research (accessed on 12 February 2023).

Acknowledgments

The author thanks Universitas Amikom Yogyakarta for supporting this study.

Conflicts of Interest

The author declares no conflicts of interest in this study.

References

  1. Hui, D.S.; Azhar, E.I.; Madani, T.A.; Ntoumi, F.; Kock, R.; Dar, O.; Ippolito, G.; Mchugh, T.D.; Memish, Z.A.; Drosten, C. The continuing 2019-nCoV epidemic threat of novel coronaviruses to global health—The latest 2019 novel coronavirus outbreak in Wuhan, China. Int. J. Infect. Dis. 2020, 91, 264–266. [Google Scholar] [CrossRef] [PubMed]
  2. Lu, H.; Stratton, C.W.; Tang, Y. Outbreak of pneumonia of unknown etiology in Wuhan, China: The mystery and the miracle. J. Med. Virol. 2020, 92, 401. [Google Scholar] [CrossRef] [PubMed]
  3. Pranolo, A.; Mao, Y. CAE-COVIDX: Automatic COVID-19 disease detection based on X-ray images using enhanced deep convolutional and autoencoder. Int. J. Adv. Intell. Inform. 2021, 7, 49. [Google Scholar]
  4. Ruuskanen, O.; Lahti, E.; Jennings, L.C.; Murdoch, D.R. Seminar Viral pneumonia. Lancet 2011, 377, 1264–1275. [Google Scholar] [CrossRef] [PubMed]
  5. Rajaraman, S.; Candemir, S.; Kim, I.; Thoma, G.; Antani, S. Visualization and interpretation of convolutional neural network predictions in detecting pneumonia in pediatric chest radiographs. Appl. Sci. 2018, 8, 1715. [Google Scholar] [CrossRef] [PubMed]
  6. Jaiswal, A.K.; Tiwari, P.; Kumar, S.; Gupta, D.; Khanna, A.; Rodrigues, J.J.P.C. Identifying pneumonia in chest X-rays: A deep learning approach. Measurement 2019, 145, 511–518. [Google Scholar] [CrossRef]
  7. Liu, J.; Liu, F.; Liu, Y.; Wang, H.-W.; Feng, Z.-C. Lung ultrasonography for the diagnosis of severe neonatal pneumonia. Chest 2014, 146, 383–388. [Google Scholar] [CrossRef] [PubMed]
  8. Yang, X.; Yu, Y.; Xu, J.; Shu, H.; Liu, H.; Wu, Y.; Zhang, L.; Yu, Z.; Fang, M.; Yu, T. Clinical course and outcomes of critically ill patients with SARS-CoV-2 pneumonia in Wuhan, China: A single-centered, retrospective, observational study. Lancet Respir. Med. 2020, 8, 475–481. [Google Scholar] [CrossRef] [PubMed]
  9. Islam, M.M.; Karray, F.; Alhajj, R.; Zeng, J. A review on deep learning techniques for the diagnosis of novel coronavirus (COVID-19). IEEE Access 2021, 9, 30551–30572. [Google Scholar] [CrossRef]
  10. Resnick, S.; Inaba, K.; Karamanos, E.; Skiada, D.; Dollahite, J.A.; Okoye, O.; Talving, P.; Demetriades, D. Clinical relevance of the routine daily chest X-ray in the surgical intensive care unit. Am. J. Surg. 2017, 214, 19–23. [Google Scholar] [CrossRef]
  11. King, B.F. Artificial intelligence and radiology: What will the future hold? J. Am. Coll. Radiol. 2018, 15, 501–503. [Google Scholar] [CrossRef] [PubMed]
  12. Lu, J.; Behbood, V.; Hao, P.; Zuo, H.; Xue, S.; Zhang, G. Transfer learning using computational intelligence: A survey. Knowl. Based Syst. 2015, 80, 14–23. [Google Scholar] [CrossRef]
  13. He, K.; Zhang, X.; Ren, S.; Sun, J. Deep residual learning for image recognition. In Proceedings of the IEEE Conference on Computer Vision and Pattern Recognition, Las Vegas, NV, USA, 27–30 June 2016; pp. 770–778. [Google Scholar]
  14. Huang, G.; Liu, Z.; Van Der Maaten, L.; Weinberger, K.Q. Densely connected convolutional networks. In Proceedings of the IEEE Conference on Computer Vision and Pattern Recognition, Honolulu, HI, USA, 21–26 July 2017; pp. 4700–4708. [Google Scholar]
  15. Hwang, E.J.; Park, S.; Jin, K.-N.; Kim, J.I.; Choi, S.Y.; Lee, J.H.; Goo, J.M.; Aum, J.; Yim, J.-J.; Cohen, J.G. Development and validation of a deep learning–based automated detection algorithm for major thoracic diseases on chest radiographs. JAMA Netw. Open 2019, 2, e191095. [Google Scholar] [CrossRef] [PubMed]
  16. Cireşan, D.C.; Giusti, A.; Gambardella, L.M.; Schmidhuber, J. Mitosis detection in breast cancer histology images with deep neural networks. In Medical Image Computing and Computer-Assisted Intervention–MICCAI 2013, Proceedings of the 16th International Conference, Nagoya, Japan, 22–26 September 2013; Proceedings, Part. II 16; Springer: Berlin/Heidelberg, Germany, 2013; pp. 411–418. [Google Scholar]
  17. Mohsen, H.; El-Dahshan, E.-S.A.; El-Horbaty, E.-S.M.; Salem, A.-B.M. Classification using deep learning neural networks for brain tumors. Future Comput. Inform. J. 2018, 3, 68–71. [Google Scholar] [CrossRef]
  18. Fukushima, K. Neocognitron: A hierarchical neural network capable of visual pattern recognition. Neural Netw. 1988, 1, 119–130. [Google Scholar] [CrossRef]
  19. LeCun, Y.; Bottou, L.; Bengio, Y. Haffner, Gradient-based learning applied to document recognition. Proc. IEEE 1998, 86, 2278–2324. [Google Scholar] [CrossRef]
  20. Hammoudi, K.; Benhabiles, H.; Melkemi, M.; Dornaika, F.; Arganda-Carreras, I.; Collard, D.; Scherpereel, A. Deep learning on chest X-ray images to detect and evaluate pneumonia cases at the era of COVID-19. J. Med. Syst. 2021, 45, 75. [Google Scholar] [CrossRef] [PubMed]
  21. Alom, M.Z.; Taha, T.M.; Yakopcic, C.; Westberg, S.; Sidike, P.; Nasrin, M.S.; Van Esesn, B.C.; Awwal, A.A.S.; Asari, V.K. The history began from alexnet: A comprehensive survey on deep learning approaches. arXiv 2018, arXiv:1803.01164. [Google Scholar]
  22. Krizhevsky, A.; Sutskever, I.; Hinton, G.E. ImageNet classification with deep convolutional neural networks. Commun. ACM 2017, 60, 84–90. [Google Scholar] [CrossRef]
  23. Hanafi, H.; Pranolo, A.; Mao, Y.; Hariguna, T.; Hernandez, L. IDSX-Attention: Intrusion detection system (IDS) based hybrid MADE-SDAE and LSTM-Attention mechanism. Int. J. Adv. Intell. Inform. 2023, 9, 121–135. [Google Scholar] [CrossRef]
  24. Sunyoto, A.; Hanafi. Enhance Intrusion Detection (IDS) System Using Deep SDAE to Increase Effectiveness of Dimensional Reduction in Machine Learning and Deep Learning. Int. J. Intell. Eng. Syst. 2022, 15, 121–141. [Google Scholar] [CrossRef]
  25. Hanafi. Enhance Rating Prediction for E-commerce Recommender System Using Hybridization of SDAE, Attention Mechanism and Probabilistic Matrix Factorization. Int. J. Intell. Eng. Syst. 2022, 15, 427–438. [Google Scholar] [CrossRef]
  26. Hanafi; Aboobaider, B.M. Word Sequential Using Deep LSTM and Matrix Factorization to Handle Rating Sparse Data for E-Commerce Recommender System. Comput. Intell. Neurosci. 2021, 1–22. [Google Scholar] [CrossRef]
  27. Sitaula, C.; Hossain, M.B. Attention-based VGG-16 model for COVID-19 chest X-ray image classification. Appl. Intell. 2021, 51, 2850–2863. [Google Scholar] [CrossRef] [PubMed]
  28. Jaiswal, A.; Gianchandani, N.; Singh, D.; Kumar, V.; Kaur, M. Classification of the COVID-19 infected patients using DenseNet201 based deep transfer learning. J. Biomol. Struct. Dyn. 2021, 39, 5682–5689. [Google Scholar] [CrossRef] [PubMed]
  29. Moorthy, J.; Gandhi, U.D. A Survey on Medical Image Segmentation Based on Deep Learning Techniques. Big Data Cogn. Comput. 2022, 6, 117. [Google Scholar] [CrossRef]
  30. Shi, F.; Xia, L.; Shan, F.; Song, B.; Wu, D.; Wei, Y.; Yuan, H.; Jiang, H.; He, Y.; Gao, Y. Large-scale screening to distinguish between COVID-19 and community-acquired pneumonia using infection size-aware classification. Phys. Med. Biol. 2021, 66, 065031. [Google Scholar] [CrossRef] [PubMed]
  31. Uddin, A.; Talukder, B.; Khan, M.M.; Zaguia, A. Study on convolutional neural network to detect COVID-19 from chest X-rays. Math. Probl. Eng. 2021, 2021, 1–11. [Google Scholar] [CrossRef]
  32. Khalif, K.M.N.K.; Seng, W.C.; Gegov, A.; Bakar, A.S.A.; Shahrul, N.A. Integrated Generative Adversarial Networks and Deep Convolutional Neural Networks for Image Data Classification: A Case Study for COVID-19. Information 2024, 15, 58. [Google Scholar] [CrossRef]
  33. Rajinikanth, V.; Biju, R.; Mittal, N.; Mittal, V.; Askar, S.S.; Abouhawwash, M. COVID-19 detection in lung CT slices using Brownian-butterfly-algorithm optimized lightweight deep features. Heliyon 2024, 10, e27509. [Google Scholar] [CrossRef] [PubMed]
  34. Farghaly, O.; Deshpande, P. Texture-Based Classification to Overcome Uncertainty between COVID-19 and Viral Pneumonia Using Machine Learning and Deep Learning Techniques. Diagnostics 2024, 14, 1017. [Google Scholar] [CrossRef] [PubMed]
  35. Srinivas, K.; Sri, R.G.; Pravallika, K.; Nishitha, K.; Polamuri, S.R. COVID-19 prediction based on hybrid Inception V3 with VGG16 using chest X-ray images. Multimed. Tools Appl. 2024, 83, 36665–36682. [Google Scholar] [CrossRef] [PubMed]
  36. Abdullah, M.; Abrha, F.B.; Kedir, B.; Tagesse, T.T. A Hybrid Deep Learning CNN model for COVID-19 detection from chest X-rays. Heliyon 2024, 10, e26938. [Google Scholar] [CrossRef]
  37. Bajaj, N.S.; Yadav, P.; Gupta, N. COVID-19 Detection from CT Scan Images using Transfer Learning Approach. ACM Int. Conf. Proceeding Ser. 2024, 152–157. [Google Scholar] [CrossRef]
  38. Szymborski, T.R.; Berus, S.M.; Nowicka, A.B.; Słowiński, G.; Kamińska, A. Machine Learning for COVID-19 Determination Using Surface-Enhanced Raman Spectroscopy. Biomedicines 2024, 12, 167. [Google Scholar] [CrossRef] [PubMed]
  39. Ekersular, M.N.; Alkan, A. Detection of COVID-19 Disease with Machine Learning Algorithms from CT Images. Gazi Univ. J. Sci. 2024, 37, 169–181. [Google Scholar] [CrossRef]
  40. Malik, H.; Anees, T. BDCNet: Multi-classification convolutional neural network model for classification of COVID-19, pneumonia, and lung cancer from chest radiographs. Multimed. Syst. 2022, 28, 815–829. [Google Scholar] [CrossRef] [PubMed]
  41. Zhang, J.; Xie, Y.; Li, Y.; Shen, C.; Xia, Y. COVID-19 Screening on Chest X-ray Images Using Deep Learning Based Anomaly Detection. 2020. Available online: http://arxiv.org/abs/2003.12338 (accessed on 30 July 2023).
  42. Loey, M.; Smarandache, F.; Khalifa, N.E.M. Within the lack of chest COVID-19 X-ray dataset: A novel detection model based on GAN and deep transfer learning. Symmetry 2020, 12, 651. [Google Scholar] [CrossRef]
  43. El Asnaoui, K. Design ensemble deep learning model for pneumonia disease classification. Int. J. Multimed. Inf. Retr. 2021, 10, 55–68. [Google Scholar] [CrossRef] [PubMed]
  44. Gulakala, R.; Markert, B.; Stoffel, M. Rapid diagnosis of COVID-19 infections by a progressively growing GAN and CNN optimisation. Comput. Methods Programs Biomed. 2023, 229, 107262. [Google Scholar] [CrossRef] [PubMed]
  45. Gulakala, R.; Markert, B.; Stoffel, M. Generative adversarial network based data augmentation for CNN based detection of COVID-19. Sci. Rep. 2022, 12, 19186. [Google Scholar] [CrossRef] [PubMed]
  46. Liang, S.; Liu, H.; Gu, Y.; Guo, X.; Li, H.; Li, L.; Wu, Z.; Liu, M.; Tao, L. Fast automated detection of COVID-19 from medical images using convolutional neural networks. Commun. Biol. 2021, 4, 35. [Google Scholar] [CrossRef] [PubMed]
  47. Madhu, G.; Kautish, S.; Gupta, Y.; Nagachandrika, G.; Biju, S.M.; Kumar, M. XCovNet: An optimized xception convolutional neural network for classification of COVID-19 from point-of-care lung ultrasound images. Multimed. Tools Appl. 2024, 83, 33653–33674. [Google Scholar] [CrossRef]
  48. Prince, R.; Niu, Z.; Khan, Z.Y.; Emmanuel, M.; Patrick, N. COVID-19 detection from chest X-ray images using CLAHE-YCrCb, LBP, and machine learning algorithms. BMC Bioinform. 2024, 25, 1–25. [Google Scholar] [CrossRef] [PubMed]
  49. Althenayan, A.S.; AlSalamah, S.A.; Aly, S.; Nouh, T.; Mahboub, B.; Salameh, L.; Alkubeyyer, M.; Mirza, A. COVID-19 Hierarchical Classification Using a Deep Learning Multi-Modal. Sensors 2024, 24, 2641. [Google Scholar] [CrossRef] [PubMed]
  50. Malik, H.; Anees, T. Multi-modal deep learning methods for classification of chest diseases using different medical imaging and cough sounds. PLoS ONE 2024, 19, e0296352. [Google Scholar] [CrossRef] [PubMed]
  51. Rahimzadeh, M.; Attar, A. A modified deep convolutional neural network for detecting COVID-19 and pneumonia from chest X-ray images based on the concatenation of Xception and ResNet50V2. Inf. Med. Unlocked 2020, 19, 100360. [Google Scholar] [CrossRef]
  52. Oh, Y.; Park, S.; Ye, J.C. Deep learning COVID-19 features on CXR using limited training data sets. IEEE Trans. Med. Imaging 2020, 39, 2688–2700. [Google Scholar] [CrossRef] [PubMed]
  53. Apostolopoulos, I.D.; Mpesiana, T.A. COVID-19: Automatic detection from x-ray images utilizing transfer learning with convolutional neural networks. Phys. Eng. Sci. Med. 2020, 43, 635–640. [Google Scholar] [CrossRef] [PubMed]
  54. Tsiknakis, N.; Trivizakis, E.; Vassalou, E.E.; Papadakis, G.Z.; Spandidos, D.A.; Tsatsakis, A.; Sánchez, J.; López, R.; Papanikolaou, N.; Karantanas, A.H. Interpretable artificial intelligence framework for COVID-19 screening on chest X-rays. Exp. Ther. Med. 2020, 20, 727–735. [Google Scholar] [CrossRef] [PubMed]
  55. Soin, K.S. Detection and Diagnosis of COVID-19 via SVM-based Analyses of X-ray Images and Their Embeddings. Int. J. Innov. Sci. Res. Technol. 2020, 5, 644–648. [Google Scholar]
  56. Wang, L.; Wong, A. COVID-Net: A Tailored Deep Convolutional Neural Network Design for Detection of COVID-19 Cases from Chest X-ray Images. 2020, pp. 1–9. Available online: http://arxiv.org/abs/2003.09871 (accessed on 22 January 2023).
  57. Liu, Y.; Xing, W.; Zhao, M.; Lin, M. An end-to-end framework for diagnosing COVID-19 pneumonia via Parallel Recursive MLP module and Bi-LTSM correlation. 2023. Available online: https://proceedings.mlr.press/v227/liu24a/liu24a.pdf (accessed on 1 November 2023).
  58. Mahmud, T.; Rahman, M.A.; Fattah, S.A. CovXNet: A multi-dilation convolutional neural network for automatic COVID-19 and other pneumonia detection from chest X-ray images with transferable multi-receptive feature optimization. Comput. Biol. Med. 2020, 122, 103869. [Google Scholar] [CrossRef] [PubMed]
  59. Horry, M.J.; Chakraborty, S.; Paul, M.; Ulhaq, A.; Pradhan, B.; Saha, M.; Shukla, N. X-ray Image Based COVID-19 Detection Using Pre-Trained Deep Learning Models. 2020. Available online: http://engrxiv.org/preprint/view/937/2035/ (accessed on 1 November 2023).
  60. Kermany, D.S.; Goldbaum, M.; Cai, W.; Valentim, C.C.S.; Liang, H.; Baxter, S.L.; McKeown, A.; Yang, G.; Wu, X.; Yan, F. Identifying medical diagnoses and treatable diseases by image-based deep learning. Cell 2018, 172, 1122–1131. [Google Scholar] [CrossRef] [PubMed]
  61. Wang, Q.; Yang, D.; Li, Z.; Zhang, X.; Liu, C. Deep regression via multi-channel multi-modal learning for pneumonia screening. IEEE Access 2020, 8, 78530–78541. [Google Scholar] [CrossRef]
  62. Rajpurkar, P.; Irvin, J.; Zhu, K.; Yang, B.; Mehta, H.; Duan, T.; Ding, D.; Bagul, A.; Langlotz, C.; Shpanskaya, K. Chexnet: Radiologist-level pneumonia detection on chest X-rays with deep learning. arXiv 2017, arXiv:1711.05225. [Google Scholar]
  63. Wang, S.; Kang, B.; Ma, J.; Zeng, X.; Xiao, M.; Guo, J.; Cai, M.; Yang, J.; Li, Y.; Meng, X.; et al. A deep learning algorithm using CT images to screen for corona virus disease (COVID-19). medRxiv 2020. [Google Scholar] [CrossRef] [PubMed]
  64. Stephen, O.; Sain, M.; Maduh, U.J.; Jeong, D.-U. An efficient deep learning approach to pneumonia classification in healthcare. J. Health Eng. 2019. [Google Scholar] [CrossRef] [PubMed]
  65. Janizek, J.D.; Erion, G.; DeGrave, A.J.; Lee, S.-I. An adversarial approach for the robust classification of pneumonia from chest radiographs. In Proceedings of the ACM Conference on Health, Inference, and Learning, Toronto, ON, Canada, 2–4 April 2020; pp. 69–79. [Google Scholar]
  66. Dansana, D.; Kumar, R.; Bhattacharjee, A.; Hemanth, D.J.; Gupta, D.; Khanna, A.; Castillo, O. Early diagnosis of COVID-19-affected patients based on X-ray and computed tomography images using deep learning algorithm. Soft Comput. 2020, 27, 2635–2643. [Google Scholar] [CrossRef] [PubMed]
  67. Chouhan, V.; Singh, S.K.; Khamparia, A.; Gupta, D.; Tiwari, P.; Moreira, C.; Damaševičius, R.; De Albuquerque, V.H.C. A novel transfer learning based approach for pneumonia detection in chest X-ray images. Appl. Sci. 2020, 10, 559. [Google Scholar] [CrossRef]
  68. Waheed, A.; Goyal, M.; Gupta, D.; Khanna, A.; Al-Turjman, F.; Pinheiro, P.R. Covidgan: Data augmentation using auxiliary classifier gan for improved COVID-19 detection. IEEE Access 2020, 8, 91916–91923. [Google Scholar] [CrossRef] [PubMed]
  69. Cohen, J.P.; Morrison, P.; Dao, L. COVID-19 image data collection. arXiv 2020, arXiv:2003.11597. [Google Scholar]
  70. Selvaraju, R.R.; Cogswell, M.; Das, A.; Vedantam, R.; Parikh, D.; Batra, D. Grad-cam: Visual explanations from deep networks via gradient-based localization. In Proceedings of the IEEE International Conference on Computer Vision, Venice, Italy, 22–29 October 2017; pp. 618–626. [Google Scholar]
Figure 1. Hybridization scenario of an auto-encoder layer and a convolutional neural network layer.
Bdcc 08 00077 g001
Figure 2. AMIKOMNET framework, experimental scenario, and the adoption of Grad-CAM for lung image analysis.
Bdcc 08 00077 g002
Figure 3. Examples of X-rays of lung diseases: (a) X-ray image of COVID-19; (b) X-ray image of pneumonia; (c) X-ray image of normal condition. The letter R on X-ray represents the right side of lung image.
Bdcc 08 00077 g003
Figure 4. Experimental results evaluation using confusion matrices for binary class classification, including COVID-19 and normal cases: (a) confusion matrix results for AMIKOMNET; (b) confusion matrix result for AMIKOMNET with Adaboost; (c) confusion matrix result for VGG16; (d) confusion matrix result for DenseNet.
Bdcc 08 00077 g004
Figure 5. Experiment results evaluation using confusion matrices on multiclass classification, including normal, COVID-19, and pneumonia cases: (a) confusion matrix results for AMIKOMNET; (b) confusion matrix results for AMIKOMNET with Adaboost; (c) confusion matrix results for VGG16; (d) confusion matrix results for DenseNet.
Bdcc 08 00077 g005
Figure 6. Accuracy and loss tests for AMIKOMNET with and without AdaBoost: (a) graphic of accuracy test of AMIKOMNET; (b) graphic of loss test of AMIKOMNET; (c) graphic of accuracy test of AMIKOMNET with Adaboost; (d) graphic of loss test of AMIKOMNET with Adaboost.
Bdcc 08 00077 g006aBdcc 08 00077 g006b
Figure 7. AUC curve results for the AMIKOMNET model against VGG16 and DenseNet: (a) AUC curve for AMIKOMNET; (b) AUC curve for AMIKOMNET with Adaboost; (c) AUC curve for VGG16; (d) AUC curve for DenseNet. 0: COVID-19 class; 1: normal class; 2: pneumonia class.
Bdcc 08 00077 g007
Figure 8. Sample of Grad-CAM results for image analysis, with two images representing negative COVID-19 (a,b), two images representing pneumonia (c,d), and two images representing positive COVID-19 (e,f).
Bdcc 08 00077 g008
Table 3. Schematic decoder layer of the auto-encoder.
No.Dimension of LayerShapeParameter
1Lung image X-ray256, 256, 31024
2Convolution 2D254, 254, 32896
3Maximum pooling 2D127, 127, 320
4Convolution 2D-1126, 126, 162064
5Maximum pooling 2D-163, 63, 160
6Convolution 2D-262, 62, 8520
7Maximum pooling 2D-231, 31, 80
Total parameters: 3480
Trainable parameters: 3480
Non-trainable parameters: 0
Table 4. Schematic encoder layer of auto-encoder.
No.Dimension of LayerShapeParameter
1sequential31, 31, 83480
2up-sampling2D62, 62, 80
3conv2D-transpose63, 63, 16528
4up-sampling2D-1126, 126, 160
5conv2D-transpose-1127, 127, 322080
6up-sampling2D-2254, 254, 320
7conv2D-transpose-2256, 256, 3867
total parameters: 6955
trainable parameters: 6955
non-trainable parameters: 0
Table 5. Schematic of image dimension on CNN layer.
No.Dimension of LayerShapeParameter
1sequential31, 31, 83480
2conv-2D29, 29, 322336
3max-pooling-2D7, 7, 320
4conv-auto-encoder5, 5, 329248
5flatten1280
6dense12816,512
7dense1128
total parameters: 31,705
trainable parameters: 28,225
non-trainable parameters: 3480
Table 6. X-ray image data class composition for training, testing, and validation.
Splitting DatasetsClasses Datasets
NormalCOVID-19PneumoniaTotal
Training1800180018005400
Testing4004004001200
Validation200200200600
Total2400240024007200
Table 7. Comparison of the AMIKOMNET model with previous work for a binary class setup.
No.Ref.ModelAccuracyRecallF1Prec.
1[32]GAN and VGG1694.74%92.86%100%95%
2[35]Inceptionv3 and VGG1698%98%-98%
3[36]VGG16, VGG19 and NN92%93%92%92%
4[33]Parallel MobileNet84.3%85.5%84.58%84.06%
5[37]RestNet5097.19%---
6[38]Random Forest94%93.7%-93.7%
7[39]Ensemble KNN, SVM, KNN87%82%86%91%
8OurAE-CNN96.90%95.06%94.67%96.03%
9OurAE-CNN-ADA98.45%96.16%95.70%96.87%
Table 8. A comparison of the AMIKOMNET model with previous work for a multiclass setup.
NoRef.ClassModelAcc.RecallF1Precision
1[52]3Patch-based CNN88.9%85.9%84.4%83.4%
2[27]4Attention and CNN-77%83%91%
3[47]3Enhance Xception99.76%99.87%99.89%99.75%
4[48]3CLAHE with KNN, DS3, Naïve Bayes, SVM99.01%100%98.87%97.77%
5[49]3Multimodal, RestNet, VGG93.89% 87.96%87.47%86.98%
6[50]9X-ray + Sound, SMOTE+CNN99.01%---
7[45]3UnetGAN and CNN98.59%98.68%98.50%98.33%
8[44]3GAN+enhance CNN98.46%98.56%98.35%98.16%
9[56]3Enhance CNN layer93.3%--93%
10[43]4Inception+Restnet+Inception95.09%98.31%94.84%98.31%
11[57]3MLP+Bi-LSTM98.10%98.10%98.12%98.13%
12Our3AE-CNN95.13%92.17%91.82%90.67%
13Our3AE-CNN-ADA96.65%94.93%95.76%96.19%
Table 9. A comparison of the AMIKOMNET model with modern deep learning.
No.AlgorithmNumber of EpochTime Consumption (Second)
1AE and CNN20 epoch1020
2InceptionV350 epoch21,631
3RestNet5050 epoch28,816
4VGG1650 epoch18,389
5InceptionRestNet75 epoch3287
6Efficientnet50 epoch39,656
Disclaimer/Publisher’s Note: The statements, opinions and data contained in all publications are solely those of the individual author(s) and contributor(s) and not of MDPI and/or the editor(s). MDPI and/or the editor(s) disclaim responsibility for any injury to people or property resulting from any ideas, methods, instructions or products referred to in the content.