Article

Comparing Hierarchical Approaches to Enhance Supervised Emotive Text Classification

School of Computer Science & Informatics, Cardiff University, Cardiff CF24 4AG, UK
*
Author to whom correspondence should be addressed.
Big Data Cogn. Comput. 2024, 8(4), 38; https://doi.org/10.3390/bdcc8040038
Submission received: 4 March 2024 / Revised: 18 March 2024 / Accepted: 26 March 2024 / Published: 29 March 2024
(This article belongs to the Special Issue Advances in Natural Language Processing and Text Mining)

Abstract

:
The performance of emotive text classification using affective hierarchical schemes (e.g., WordNet-Affect) is often evaluated using the same traditional measures used to evaluate the performance of when a finite set of isolated classes are used. However, applying such measures means the full characteristics and structure of the emotive hierarchical scheme are not considered. Thus, the overall performance of emotive text classification using emotion hierarchical schemes is often inaccurately reported and may lead to ineffective information retrieval and decision making. This paper provides a comparative investigation into how methods used in hierarchical classification problems in other domains, which extend traditional evaluation metrics to consider the characteristics of the hierarchical classification scheme, can be applied and subsequently improve the classification of emotive texts. This study investigates the classification performance of three widely used classifiers, Naive Bayes, J48 Decision Tree, and SVM, following the application of the aforementioned methods. The results demonstrated that all the methods improved the emotion classification. However, the most notable improvement was recorded when a depth-based method was applied to both the testing and validation data, where the precision, recall, and F1-score were significantly improved by around 70 percentage points for each classifier.

1. Introduction

The proliferation of text-based content created by users across the Internet, including product reviews, social media posts, and blogs, offers rich information of public opinion that can influence our own decisions. For example, a negative product review might make us rethink a purchase. However, the vast amount of available text data overwhelms our capacity to sift through and find the most pertinent information. Text mining has been identified as a viable approach to managing this deluge of data, enabling us to efficiently process and understand large volumes of text from various sources [1]. Specifically, sentiment analysis, or opinion mining, is a technique designed to automatically detect, extract, summarise, and categorise the sentiments, evaluations, feelings, and viewpoints expressed in textual content [2,3].
Most research activities in this domain have focused on the problem of sentiment classification, which classifies a text in terms of its polarity: positive, negative, or neutral. However, one of the main problems with classifying texts by their sentiment polarity is that it combines diverse emotions into two classes [4]. Positive polarity conflates, for example, happiness, love, and joy. In response to use cases such as online counselling, where associating finer-grained and specific emotions with appropriate responses is required, recent work investigates the extraction and classification of the types of emotions (the projection or display of a feeling) expressed in text. Several works have classified emotive text using a set of discrete universal categories of basic emotions. Such works often use classification schemes such as Ekman’s six basic emotions [5] (anger, disgust, fear, happiness, sadness, and surprise) or an extension of such emotions (e.g., [6,7,8]).
However, given that basic emotion schemes are limited to a small number of broad categories, such methods do not capture the nuanced spectrum of human emotions. Unlike such schemes that contain a small but manageable set of classes, affective hierarchies capture a richer set of emotions, where primary emotions (love, joy, surprise, anger, and sadness) are further broken down into secondary emotions (e.g., love consists of the secondary emotions affection and longing). The performance of emotive text classification occurs when an emotive hierarchical scheme is often evaluated using the same traditional measures used to evaluate the performance of when a finite set of isolated classes are used. However, this means the full characteristics of the hierarchy and the relationships between the entities within the hierarchy are not considered, thus leading to a potentially misleading assessment of the overall classification performance [9].
To address the aforementioned limitations, to the best of our knowledge, this paper presents the first comparative investigation into how methods used in hierarchical classification problems in other domains (e.g., predicting protein functions [10,11]), which extend traditional evaluation metrics to consider the characteristics of the hierarchical classification scheme, perform when applied in an emotive text classification context. In addition, applying such measures enables classification of fine-grained emotions that are not limited to a finite number of classes. This allows more specific emotions to be identified, which is an important factor to consider in a range of use cases that rely on emotion classification, including decision making. To support the experiments herein, a large representative dataset of emotive tweets provided by Go et al. [12] was used. The main contributions of the work presented in this paper are the empirical investigations into the following:
  • The behaviour of a range of supervised models used for classifying emotions expressed in text distributed as part of a hierarchical scheme;
  • Exploring how extended classification methods can be used to capture the characteristics of a hierarchical emotive scheme and increase the overall performance of popular supervised models.
The study was designed as follows (see Figure 1): (1) automatically map text segments to emotions in WordNet-Affect, a hierarchically structured emotion classification scheme; (2) randomly split a dataset of emotive texts into training, testing, and validation sets, each containing 60%, 20%, and 20% of the data points, respectively; (3) evaluate a range of supervised classification algorithms and train the identified best-performing models; (4) apply the trained model on the testing and validation datasets produced in (2); and (5) apply and evaluate hierarchical classification approaches to the predictions generated in (4).
The remainder of this paper is divided into the following main sections: Section 2 presents the related work, Section 3 discusses the data used to support the classification experiments herein, including automatically mapping text segments to emotions within a hierarchical classification scheme, Section 4 and Section 5 discuss hierarchical classification evaluation metrics and their performance against testing data, respectively, and, finally, Section 6 concludes the paper.

2. Related Work

In the context of classifying emotive texts, there exist only a handful of investigations into hierarchical classification. In the literature, a popular method to address this problem is to divide the class hierarchy into a set of independent classification problems and apply classification at each hierarchical level. For example, Esmin et al. [13], Ghazi et al. [14], Charoensuk and Sornil [15], and Angiani et al. [16] undertook an investigation into a three-level hierarchical classification approach towards classifying emotions expressed in text. The first hierarchical level focused on classifying whether the texts were emotive or not, the second level aimed to classify their sentiment polarity, and, subsequently, the third level aimed to classify whether texts expressed one of Ekman’s six basic emotions.
Keshtkar and Inkpen [17] explored classifying moods expressed in blog posts. They used 132 moods and their hierarchical organisation provided by LiveJournal. They first evaluated the classification performance of a Support Vector Machine (SVM) without considering the hierarchical structure of the emotive scheme as a baseline and achieved 24.73% accuracy. To address the hierarchical classification problem, they trained a classifier to discriminate between the 15 emotions on the first level of the hierarchy. Then, a classifier was trained for each of the emotions in the first level to differentiate among all of its sub-classes. Similarly, Zhang et al. [18] and Xu et al. [19] employed a hierarchical structure to classify 19 emotions in Chinese microblogs. They built an SVM model for each emotion to classify them individually. Such an approach achieved an F1-score of over 80%. However, the aforementioned approaches do not address hierarchical classification in its true form as the full structure of the class hierarchy is ignored.
Mishne [20] also investigated classifying LiveJournal’s 132 moods expressed in blog posts. As well as classifying each mood individually, they aggregated similar moods into an active and passive group and a positive and negative group. The purpose of their experiments was to test whether combining closely related moods improves the classification performance of the model. Their results show that the SVM achieved 50% accuracy. However, aggregating emotions into groups of similar ones does not address the hierarchical nature of the classification problem.
Conclusively, it is evident that there is room to investigate the full characteristics of a hierarchical scheme and the true relationships between the entities within the hierarchy during emotive text classification.

3. Data Annotation and Preparation

To explore the behaviours of extended evaluation metrics that consider the hierarchical characteristics of WordNet-Affect, a popular lexical model was used for classifying emotions regarding the performance of supervised classification when the corresponding data discussed in Section 3.2 were used to train and evaluate a selection of well-known classifiers. Further justification as to why such classifiers were selected is discussed in Section 5. The following sections discuss the text corpus, as well as describing the methodology behind automatically mapping texts to the emotions in the hierarchy and preparing their vector representations using word embeddings.

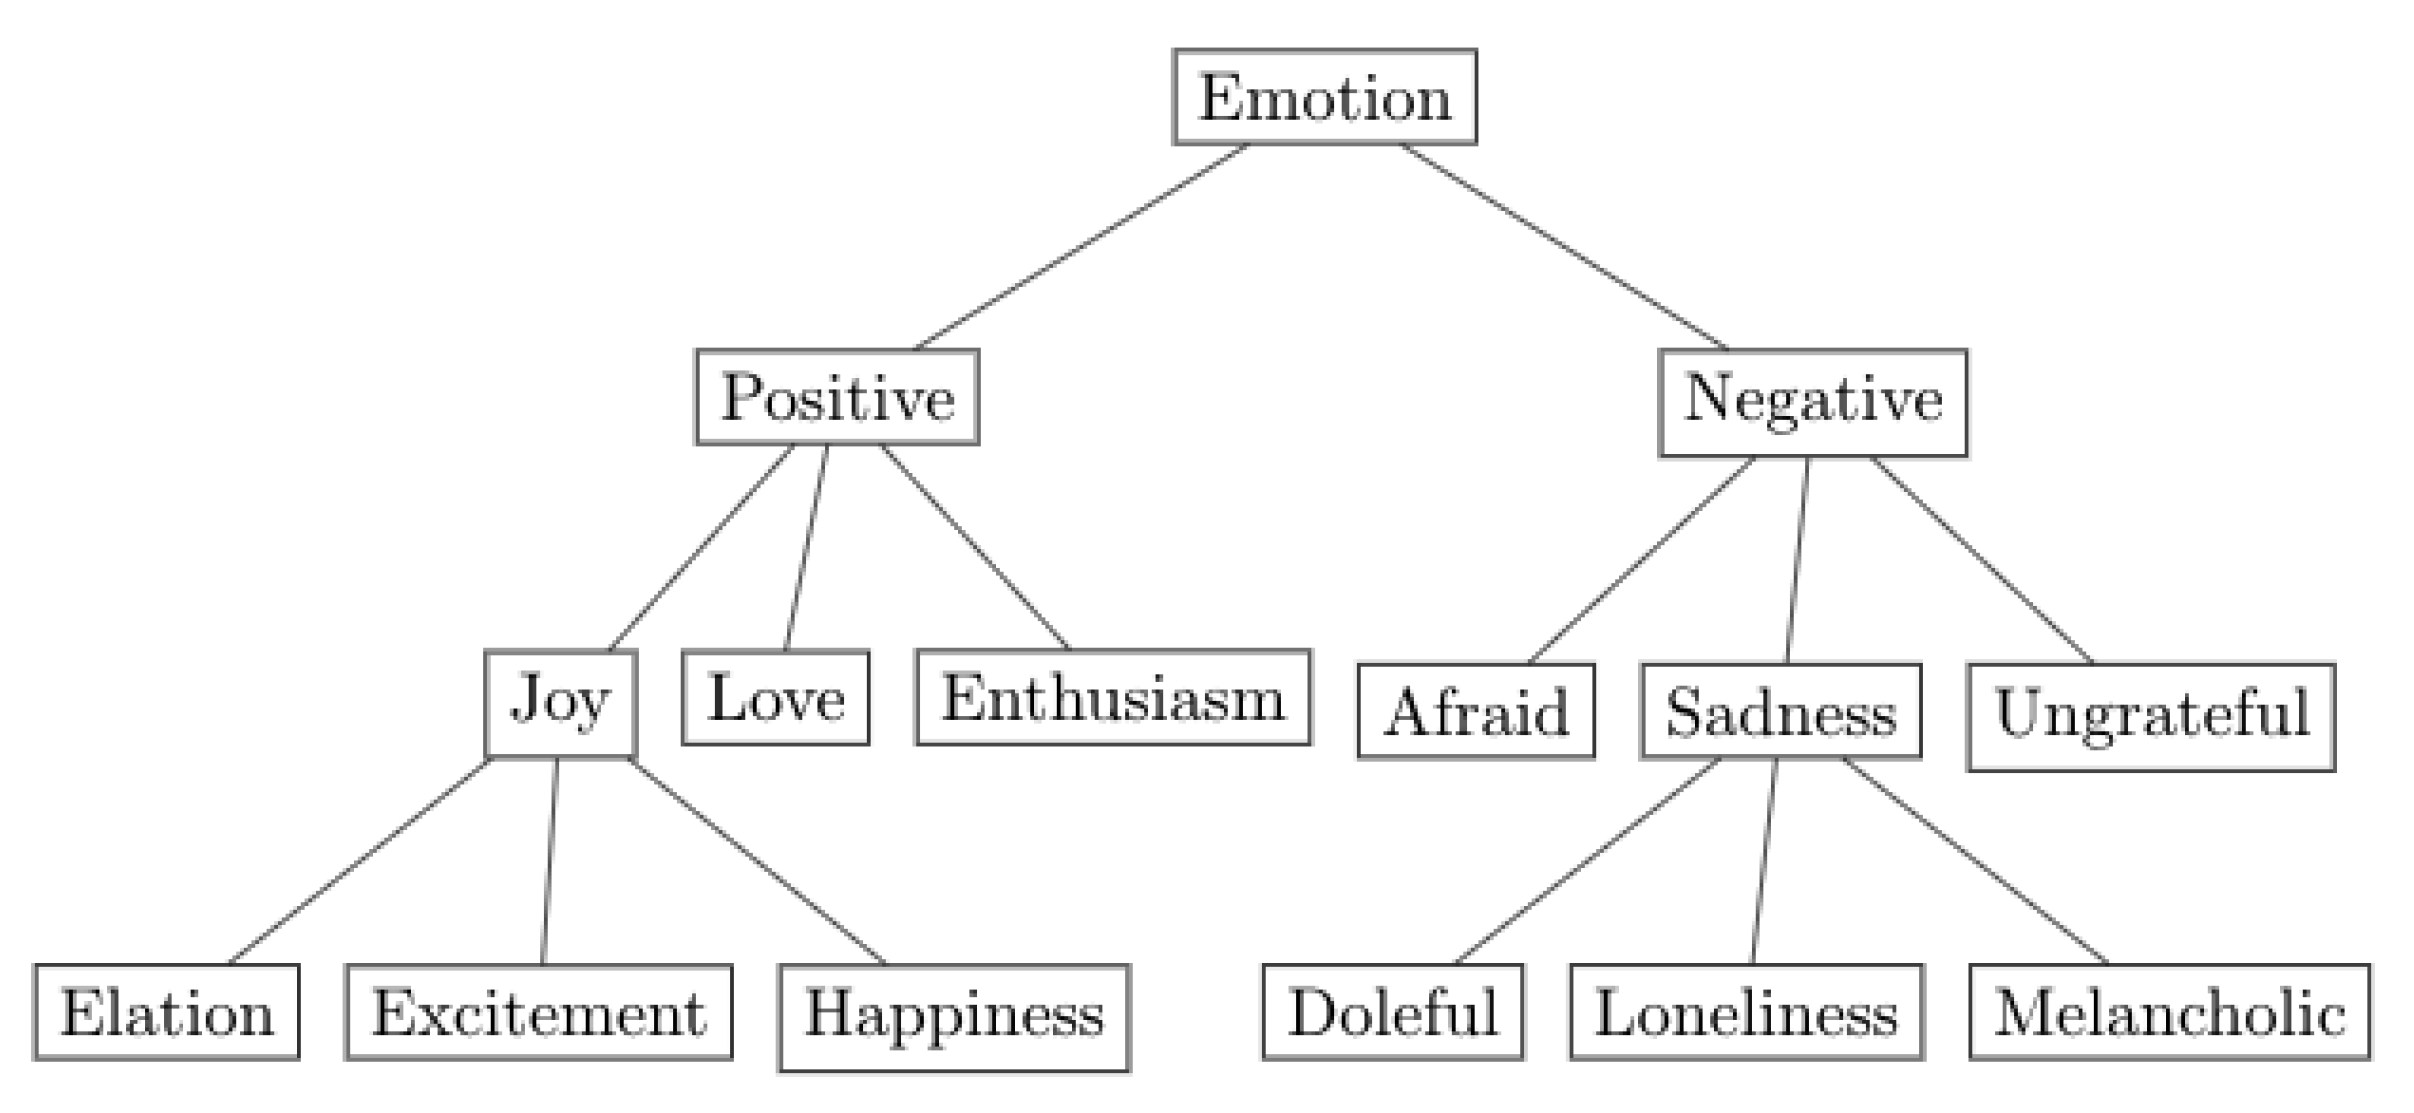
3.1. Hierarchical Classification Framework

Affective hierarchies (e.g., [21,22,23]) provide a rich set of emotions, focusing on lexical aspects that can support text mining applications such as sentiment analysis regarding a detailed structure of emotions, focusing on their lexical characteristics to enhance text mining applications like sentiment analysis [4]. These frameworks categorise related emotions into groups, beginning with sentiment polarity (positive or negative) as the broadest categories. Basic emotions such as happiness, sadness, love, and anger are positioned at a more specific level within these categories. At the most detailed level, emotions are further divided into more nuanced states that correspond to their overarching polarity, for example, optimism (a form of happiness), misery (a form of sadness), and passion (a form of love).
WordNet is a comprehensive English lexical database that organises nouns, verbs, adjectives, and adverbs into sets of cognitive synonyms, or synsets, offering a rich network of meaningfully related words [24]. To extend its utility into the emotional domain, WordNet-Affect was developed [25] as a specialised lexical framework. It serves to categorise emotions and affect, both directly (with words like joy, sad, and happy) and indirectly (with words like pleasure, hurt, and sorry), into an organised hierarchy of synsets. This categorisation facilitates the analysis of moods, situational emotions, and emotional responses. WordNet-Affect has become an invaluable resource for numerous NLP studies, particularly in sentiment analysis (e.g., [8,26]) as it helps in understanding and processing emotional content in text.
Figure 2 shows an excerpt from the WordNet-Affect hierarchy. The local version of the lexicon used in this paper consists of 1532 affective terms, including all derivational and inflectional forms of the 798 word senses originally found in WordNet-Affect. Table 1 shows the distribution of emotions across the seven levels of WordNet-Affect’s hierarchical structure, as well as examples of emotions on each level.

3.2. Text Corpus

Emotive language analysis has been applied to a range of texts from different domains [4]. Studies have focused on emotions expressed in film reviews (e.g., [27,28,29]), product reviews (e.g., [30]), financial data (e.g., [31,32]), political data (e.g., [33]), news articles (e.g., [34,35]), health care texts (e.g., [36]), e-mails (e.g., [37]), etc.
Spurred by the recent growth in microblogging, platforms such as Twitter are a popular source of data for sentiment analysis studies (e.g., [38,39,40,41]). Twitter is a social networking service that enables users to send and read tweets—text messages consisting of up to 280 characters. Given this character limit, classifying the sentiment of tweets is the most similar to sentence-level sentiment analysis [42].
The use of Twitter as a means of self-disclosure makes it a valuable source of emotionally charged text. In particular, Go et al. [12] used distant learning to acquire sentiment data from Twitter. In their approach, sentiment-baring tweets were acquired by using the Twitter Search API to collect tweets using keyword search and whether they included positive emoticons (e.g., “:)” or “:-)” for expressing positive sentiment or negative emoticons (e.g., “:(” or “:-(”) for expressing negative sentiment. Their dataset (https://www.tensorflow.org/datasets/catalog/sentiment140 (accessed on 12 December 2023)) consists of 1,600,000 unique tweets, with 800,000 positive and 800,000 negative data points. Due to the large volume of tweets, as well as the fact that they were collected for sentiment analysis purposes, this dataset was used to support the experiments presented in this paper.

3.3. Mapping Texts to Emotions

The added overhead associated with the manual annotation of large datasets is known as being one of the key obstacles in supervised machine learning. Manual annotation is both labour-intensive and, without specific training, can be highly error-prone [43]. In particular, the task of manually annotating large datasets with large annotation schemes such as WordNet-Affect is tedious for the annotator, and, subsequently, finer-grained emotions may be lost. When its utility from a human perspective was studied by Williams et al. [4], WordNet-Affect demonstrated to be a challenging scheme to use to manually annotate the emotive text. It was reported as being too much information to the users, who could not pinpoint which emotion to choose as there were too many options.
In this case, and inspired by Go et al. [12], a simple string-matching approach was applied to automatically annotate tweets if they contained an emotion that could be mapped to WordNet-Affect. Table 2 reports examples of tweets mapped to emotions.
More specifically, a total of 1,167,995 tweets (73% of the original dataset) did not contain emotions and, therefore, were omitted from the dataset. A total of 431,975 tweets (27% of the original dataset) contained an expression that could be mapped to emotions from the WordNet-Affect lexicon discussed in Section 3.1, with 363,528 tweets containing one emotion. For the 68,447 tweets containing more than one emotion, the following three rules were adopted to break the ties:
  • If all emotions originate from the same root (i.e., Positive, Negative, Neutral, and Ambiguous), assign the emotion that is located the deepest in the hierarchy. The following is an example of a tweet that was allocated the emotion Bored as a consequence of being located on the fourth hierarchical level, as opposed to Hate, which is located on the third: “I hate this time, I am super bored but everyone is sleepin”.
  • If all emotions originate from the same root but are located on the same hierarchical level, assign the root emotion. The following is an example of a tweet that was allocated the emotion Positive as a consequence of containing the emotions Love and Joy, which are both located on the second hierarchical level: “When spreading love and joy to others—also remember yourself!”.
  • Omit the tweet if the emotions it contains do not originate from the same root. The following is an example of a tweet that was omitted from the study as a consequence of containing the emotions Love and Sad, which originate from the root emotions Positive and Negative, respectively: “Ohhh. I love it. Ps I’m sad we didn’t get to hang out”.
A total of 20,783 and 10,248 tweets complied with rules (1) and (2), respectively, whereas 37,416 tweets complied with rule (3) and were therefore omitted from the study. Subsequently, the final dataset contained 394,559 tweets. Table 3 reports the distribution of tweets across the hierarchy.
Figure 3 reports the top 22 most frequently used emotions across the annotated dataset described in Section 3.3. A total of 947 individual emotions from the 1532 in WordNet-Affect were identified as annotations.

3.4. Vector Representation

In automatic text classification, the most traditional vector representation of text is bag-of-words (BOW). The BOW model is used to form a vector representing a document using the frequency count of each term in the document. Others use term-weighting methods to assign appropriate weights to the terms to improve the performance of text classification. However, the high dimensionality of the representation, loss of correlation with adjacent words, and loss of semantic relationship between terms are among their limitations [44].
Recently, words have been represented through dense vectors derived from various training methods, inspired by the modelling of languages through neural networks. Such representations are referred to as word embeddings [45]. Word embeddings make natural language computer-readable. Subsequently, further implementations of mathematical operations on words can be used to detect their similarities. A well-trained set of word vectors places similar words close to each other in that space. For instance, the words ‘women’, ‘men’, and ‘human’ might cluster together, whilst ‘yellow’, ‘red’, and ‘blue’ cluster together. Such representations have proven to be efficient to train, and are highly scalable for large corpora [46].
Word2vec is a popular technique to learn word embeddings using a two-layer neural network. There are two main training algorithms for word2vec: continuous-bag-of-words (CBOW) uses context to predict a target, whilst skip-gram uses a word to predict a target context. Generally, the skip-gram method achieved better performance as it can capture two semantics for a single word (e.g., Apple may have two vector representations, one for the company and another for the fruit).
In this paper, Genism [47], an open-source Python library for representing documents as semantic vectors, was used to develop word embeddings by training a skip-gram word2vec model on the dataset of tweets. The data preparation required for this model was conducted using Python (version 3.7.2), where traditional NLP techniques were applied, including the following:
  • Converting text to lowercase.
  • Removing mentioned usernames and URLs using regular expressions.
  • Removing punctuation and digits using regular expressions.
  • Removing stop words using Python’s natural language package, Natural Language Toolkit (NLTK) [48] (version 3.4.1).
  • Tokenising text using the pre-built tokeniser as part of the NLTK package.
  • Lemmatising tokens using the WordNet Lemmatiser as part of the NLTK package.
To train a word2vec model, the following parameters were set: the size (the number of dimensions of the embeddings) was set to its default, 100, the window (the maximum distance between a target word and words around the target word) was set to 3, the minimum count (the minimum count of words to consider when training the model; words with occurrence less than this count will be ignored) was set to 1 in order to capture all words, the workers (the number of partitions during training) was set to its default of 3, and sg (the training algorithm) was set to 1 to represent the skip-gram model. The time taken to train the word2vec model was reported at 42.78 s. The total number of words in the vocabulary was reported as 144,494. Such training was performed on a MacBook Pro 2019, with 16 GB memory, an Intel Core i9 CPU, and running Ventura macOS.

4. Hierarchical Classification Evaluation Metrics

A vast majority of text classification problems involve assigning data points to a class from a finite number of isolated classes (e.g., classifying sentiment polarity). This is often referred to as flat classification. In contrast, in several other problems, the classes are disposed in a hierarchical structure. Such problems are often referred to as a hierarchical classification problem [49].
The performance of hierarchical classification is often evaluated using measures commonly adopted for evaluating the performance of flat classifiers. However, Sun and Lim [9] argue that such measures are inadequate in evaluating the performance of hierarchical classification as they do not consider the full characteristics of the hierarchical problem, and therefore inaccurately report the overall performance.
As shown in the literature, a popular method in emotive text classification is to divide the class hierarchy into a set of flat classification problems, often treating each class level as an independent classification problem. Flat classification measures may be used to evaluate the performance of each level. One of the disadvantages of this approach is that errors made in higher levels of the hierarchy are propagated down through the more specific levels [49].
Other methods apply the classification model to the whole class hierarchy and apply extended measures to evaluate performance. Those reviewed by Costa et al. [49] and Cerri et al. [50] can be grouped into five measures: relational, distance, depth, semantic, and hierarchical classification measures. The following sections discuss the methods considered in this paper and how the performance of such hierarchical classification methods is evaluated. As the hierarchical-based measure [51] evaluates the performance of each predicted instance and not for each class, the evaluation is not directly comparable to the other measures and is therefore omitted from this study.
The following notations are adopted: C a = actual class, C p = predicted class, T P = True Positives, F P = False Positives, F N = False Negatives, P = Precision, R = Recall, and F = F1-score, where
  • C a —the known input to the classifier.
  • C p —the predicted output from the classifier.
  • T P —tweets are correctly classified as the class of interest.
  • F P —tweets are incorrectly classified as the class of interest.
  • F N —tweets are incorrectly classified as not the class of interest.
  • P—measures the number of retrieved tweets that are relevant.
  • R—measures the number of all the relevant tweets that are successfully retrieved.
  • F—the harmonic mean of P and R, and provides a single weighted metric to evaluate the overall classification performance.

4.1. Flat Hierarchical Classification

Hierarchical problems discussed in the literature often involve flat hierarchical classification, where classes from the class hierarchy are treated in isolation with no definition of the hierarchical relationships among them. Traditional supervised algorithms (e.g., Naive Bayes, Maximum Entropy, and SVM) can be applied and their classification performance evaluated using P, R, and F based on the numbers of correct ( T P ) and incorrect ( F P and F N ) predictions. However, such approaches carry difficulty for classifiers when provided a large hierarchical scheme such as WordNet-Affect as more classes increase the opportunity for misclassification.
P = T P T P + F P R = T P T P + F N F = 2 · ( P · R ) ( P + R )

4.2. Relational-Based Classification

Most hierarchies are designed so that lower-level classes are specialisations of higher level classes, which can be represented by transitive relations such as ‘is-a’ [52]. In this case, it is assumed that a class on any hierarchical level corresponds to its ancestor. For instance, if C p = Positive when C a = Happiness, it is assumed that this is correctly classified as Happiness is a descendant of Positive. Conversely, if C p = Anger when C a = Positive, it is assumed that the classification is incorrect. Classification performance can be evaluated using standard P, R, and F (Equation (1)).
One of the drawbacks of this approach is that it does not address hierarchical classification in its true form. That is, similar to Mishne’s [20] approach, emotions that are aggregated into groups represented by their parent node do not allow for finer-grained or implicit emotions to be directly classified.

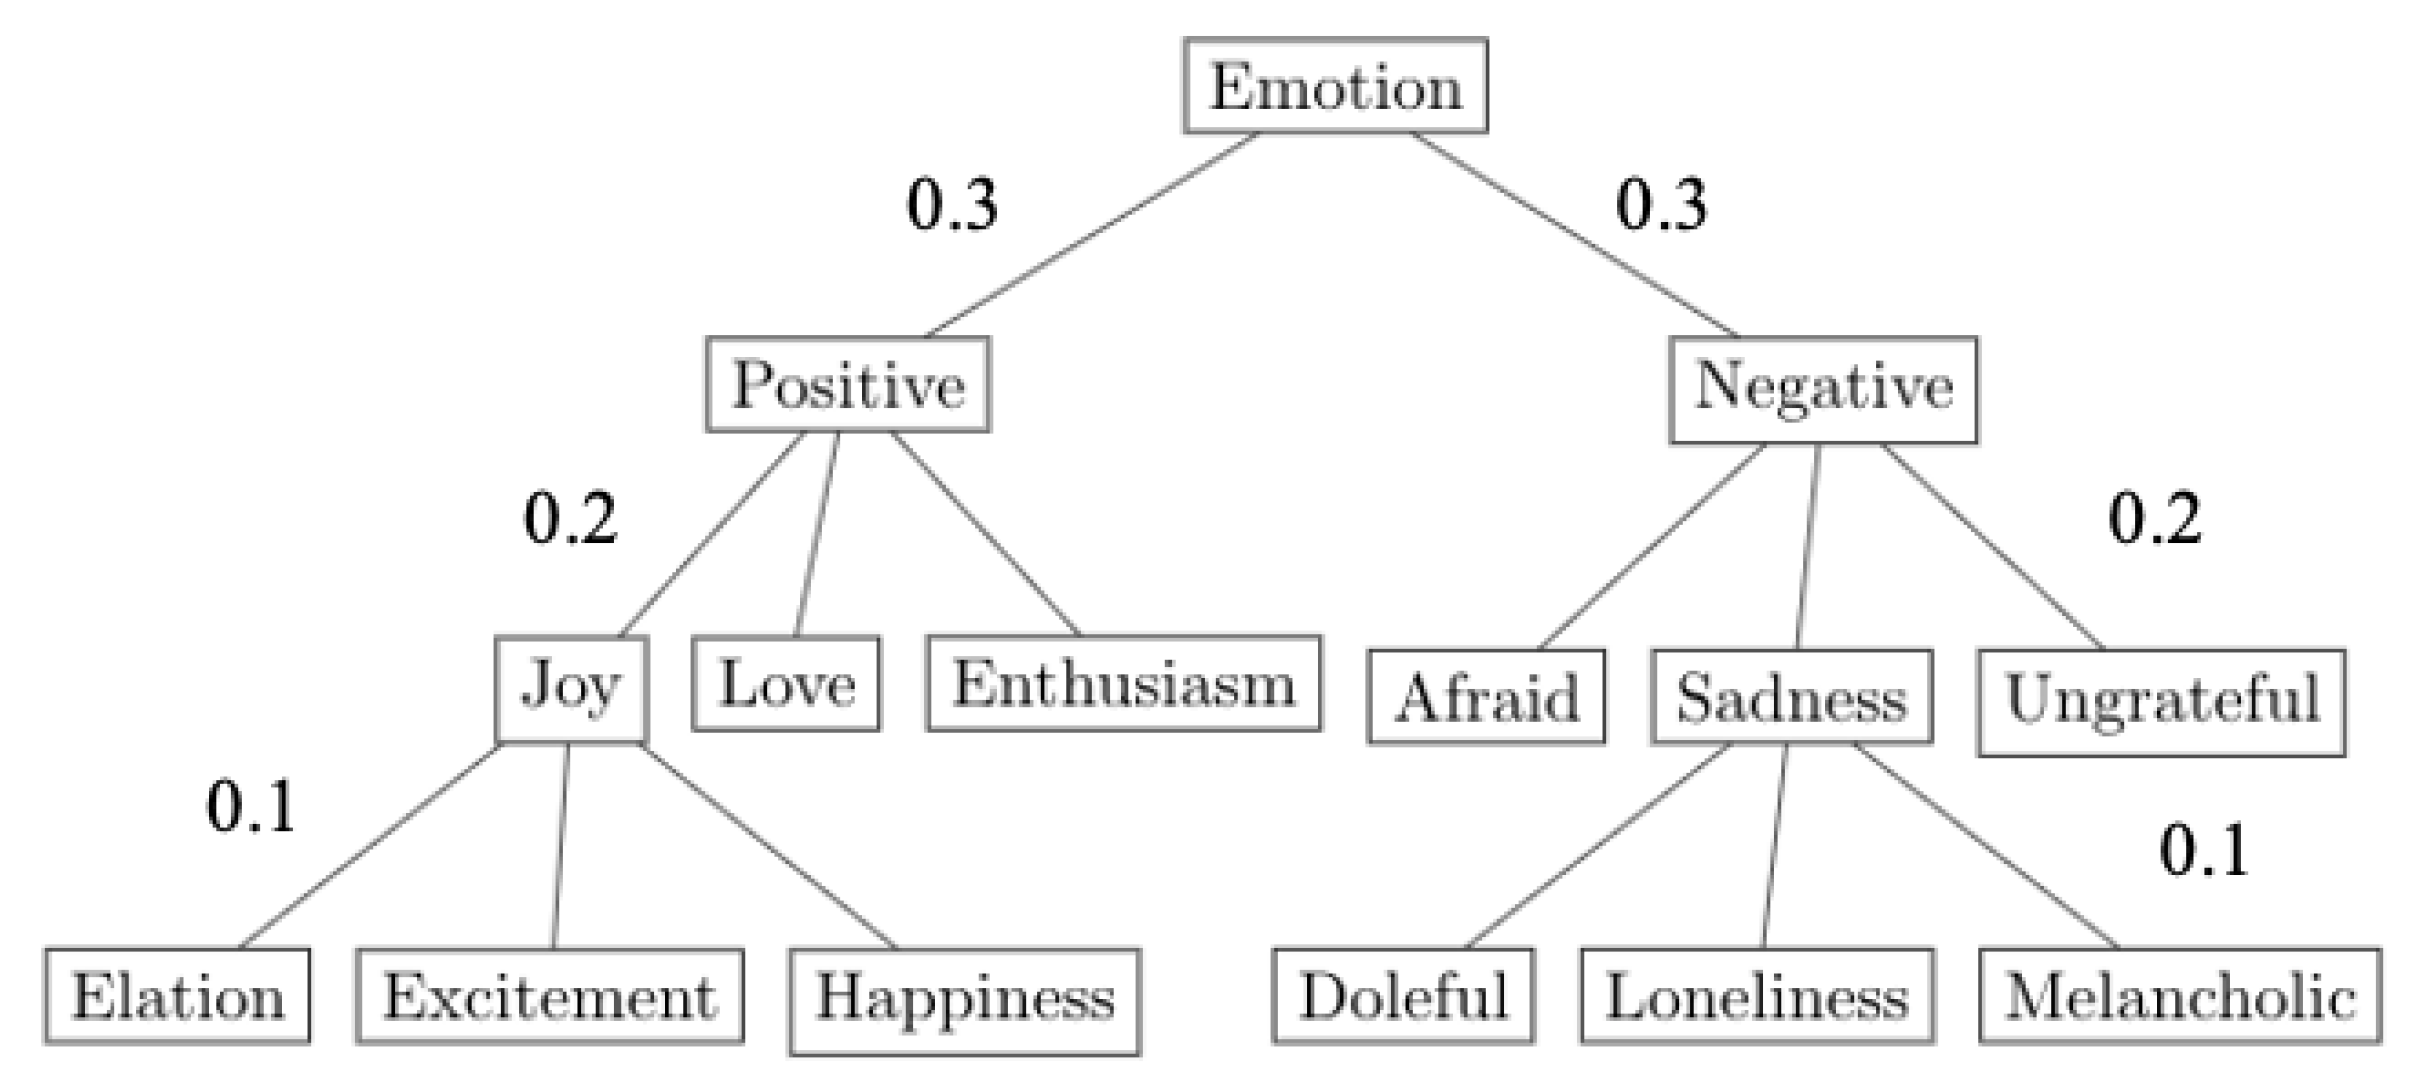
4.3. Distance-Based Classification

Classes that are closer to each other in the class hierarchy tend to be more similar to each other than other classes [49]. In this case, distance-dependent approaches consider the distance between C a and C p in order to compute and evaluate the classification performance.
Sun and Lim [9] extended the conventional flat hierarchical classification measures of P and R for the context of distance-based classification. To consider the contribution of F P and F N , an acceptable distance ( D i s θ ) between C a and C p is determined. With the methodology that it is less forgivable to misclassify classes further away from one another in mind [9,53,54], in this paper, D i s θ = 3.
For each instance, the contribution of each F P ( C o n ( x , C p ) ) is calculated in Equation (2), where D i s ( C p , C a ) denotes the distance between C p and C a , that is, the number of branches between C p and C a . For example, when C a = Joy and C p = Happiness, D i s ( C p , C a ) = 1, but, when C a = Elation and C p = Positive, D i s ( C p , C a ) = 2. Subsequently, D i s ( C p , C a ) is divided by D i s θ . A refined-contribution R C o n ( x , C p ) in Equation (3) normalises C o n ( x , C p ) between the range of −1 and 1. Finally, the contribution of F P for each class ( F P C o n i ) (Equation (4)) is obtained by calculating the sum of R C o n ( x , C p ) for each instance where the C a is wrongly predicted. The contribution of F N ( F N C o n i ) is also obtained for each class by calculating the sum of R C o n ( x , C p ) for each example of F N instances.
C o n ( x , C p ) = 1 D i s ( C p , C a ) D i s θ
R C o n ( x , C p ) = m i n ( 1 , m a x ( 1 , C o n ( x , C p ) ) )
F P C o n i = x F P i R C o n ( x , C p )
The contributions of F P and F N are used in the extended measures of P (Equation (5)) and R (Equation (6)) to evaluate the performance of each class i, where T P i , F P i , and F N i represent the number of T P , F P , and F N , respectively, for each class. The harmonic mean of P i and R i is used to calculate F i (Equation (1)). To derive a comprehensive understanding of the model’s performance across all classes, the overall P, R, and F of the approach may be computed by averaging the individual class-specific measures (i.e., P i , R i , and F i ).
P i = m a x ( 0 , T P i + F p C o n i + F n C o n i ) T P i + F P i + F n C o n i
R i = m a x ( 0 , T P i + F p C o n i + F n C o n i ) T P i + F N i + F p C o n i
One of the drawbacks of distance-based classification is the fact that it does not consider that classification at deeper levels of the hierarchy is more challenging than classification at shallower levels. This is often a consequence of having fewer training examples belonging to deeper classes in comparison to classes at higher levels [10].

4.4. Depth-Based Classification

To address the drawbacks of the distance-based method, depth-based classification considers greater classification costs for higher class levels in comparison to deeper class levels. Holden and Freitas [10] adopted the depth-based method by assigning weights to each level in the class hierarchy. The values of these weights are inversely proportional to the hierarchical level, i.e., a higher level in the class hierarchy has a larger weight in comparison to a deeper level. The hypothesis behind this is that misclassification at a deeper level is more forgivable than misclassifying at a higher level.
Once each level in the class hierarchy has been assigned a weight, the degree of misclassification (M) associated between C a and C p is provided by the summation of the weights of all the levels between them. For example, based on [10], in Figure 4, M = 0.1 when Happiness is misclassified as Joy. However, M = 0.6 when Positive is misclassified as Negative, which is consistent with the fact that this misclassification is less forgivable than the aforementioned example, which shares a similar valence. Intuitively, if C a = C p , then M = 0. The weights 0.3, 0.2, 0.1, 0.08, 0.06, 0.04, and 0.02 were assigned to the seven hierarchical levels of the local WordNet-Affect used in this paper.
The contributions of misclassification of F P and F N can be calculated using a similar approach to distance-based classification, where an acceptable weight between C a and C p is determined. With the methodology that misclassification is less forgivable at higher levels of the hierarchy in mind, M θ = 0.5. This is to ensure that misclassifications from the third level of the hierarchy and upwards incur increased classification punishment. For Equation (2), D i s ( C p , C a ) is replaced by M ( C p , C a ) , denoting the summation of the weighted edges between C a and C p . For example, when C a = Joy and C p = Happiness, M ( C p , C a ) = 0.1, but, when C a = Elation and C p = Positive, M ( C p , C a ) = 0.3.

4.5. Semantic-Based Classification

Sun and Lim [9] also proposed a semantic-based method, which uses the concept of class similarity to evaluate hierarchical classification performance. The hypothesis behind measuring the similarity between C a and C p is that it is more forgivable to misclassify C a as C p with a similar valence, in comparison to C p from a different polarity sub-tree.
The similarity between C a and C p can be calculated using several similarity measures. Sun and Lim [9] used cosine similarity to measure the similarity values between C a and C p , which are subsequently used to define P and R.
Initially, the cosine similarity (Equation (7)) between every pair of classes ( C S ( C x , C y ) ) is computed, where x and y represent two non-zero vectors in an n-dimensional space, with θ denoting the angle between them. Cosine similarity scores can vary from −1 (indicating vectors pointing in opposite directions, equivalent to 180 ) to 1 (indicating vectors pointing in the same direction, equivalent to 0 ), with a score of 0 signifying orthogonal vectors. In our study, vector components are always non-negative, leading to cosine similarity values ranging from 0 to 1, where higher values suggest greater similarity. Within our framework, ’Positive’ and ’Negative’ types of affect are considered orthogonal.
For each emotion listed in the hierarchy, its respective feature in the vector representation is assigned a value of 1, along with the values corresponding to all ancestor emotions in the hierarchy. For instance, if C represents Excitement, then both Positive and Joy categories are set to 1, with all other elements of the vector set to 0. The vector’s length is determined by the total number of emotions covered in the study, including both those in the testing dataset and those predicted.
C S ( C x , C y ) = cos θ = i = 1 n x i y i i = 1 n x i 2 i = 1 n y i 2
These similarities are used to define the average category similarity ( A C S ) in Equation (8), where M is the number of classes. Together, the similarity between C a and C p ( C S ( C p , C a ) ) is used to calculate the contribution of F P and F N for each class using Equations (3), (4), and (9). P and R measures are obtained using the extended measures shown in Equations (5) and (6).
A C S = 2 · i = 1 M k = i + 1 M C S ( C p , C a ) M · ( M 1 )
C o n ( x , C p ) = C S ( C p , C a ) A C S 1 A C S

5. Evaluating Hierarchical Classification Evaluation Metrics

To explore the performance of WordNet-Affect as a class hierarchy, as well as the classification behaviours of the aforementioned supervised hierarchical approaches, the performance of each approach was evaluated when the corresponding data discussed in Section 3.3 were used to train the classification model.
In this paper, Weka [55], a popular suite of machine learning software, was used to support the classification experiments. The “no free lunch” theorem suggests that no single learning algorithm outperforms all the others across all possible problems [56]. This implies that the selection of a learning algorithm should be informed by its effectiveness in addressing the specific problem at hand and the distinctive characteristics of the data associated with that problem.

5.1. Model Identification

Prior to evaluating the hierarchical classification methods, it is necessary to identify which models are to facilitate the experiments herein based on their performance and ability to predict emotions within the text when no hierarchical structure is considered. This also forms the baseline for comparison when extended hierarchical measures are applied in Section 5.2.
As such, a variety of classifiers distributed as part of Weka were applied regarding the final dataset of 394,559 tweets discussed in Section 3.3 and evaluated using 10-fold cross-validation using their default hyper-parameters. The classifiers used herein were chosen for their capability to handle multi-class classification tasks and manage high-dimensional feature spaces effectively. This selection encompassed both generative models, which either account for conditional dependencies within the dataset or operate under the assumption of conditional independence (e.g., Bayesian Network and Naive Bayes), and discriminative models, which focus on maximising information gain or directly assign data points to their respective classes without assuming any underlying probability distribution or data structure (e.g., J48 Decision Tree and Support Vector Machines (SVMs)).
The performance of text classification methods can be measured in several ways. In this paper, we are interested in measuring the performance of the final classification results, i.e., the correctness of assigning categories to a set of documents. Based on the standard P, R, and F for each class (Equation (1)), in this paper, the performance of the class label space is obtained using macro-average metrics. A macro-average independently computes a metric for each class and subsequently treats all classes equally by calculating the overall average. In this case, and as the distance, depth, and semantic-based hierarchical classification methods produce metrics for each class, the results in this paper report macro-average P, R, and F.
Table 4 demonstrates the results following 10-fold cross-validation. From a range of learning methods, the Naive Bayes classifier achieved the highest F of 28.97%. J48 Decision Tree and SVM were also able to achieve F scores of 20.67% and 13.57%, respectively. The Simple Logistic and Random Forest models failed to complete classifications after running for 2 days. This may be because, due to the size of the dataset, the hardware used to run the models may not have been sufficient for the increased computational load. Given the large number of class labels, the poor performance of each classifier is intuitive. The aim of this paper is to maximise the performance of such classifiers by addressing hierarchical classification in its true form by considering the full structure of the class hierarchy. In this case, as Naive Bayes, J48 Decision Tree, and SVM achieved the highest cross-validation results, we proceeded to investigate whether hierarchical classification methods can be used to capture the characteristics of WordNet-Affect.

5.2. Hierarchical Classification Experiments

From the final dataset of 394,559 tweets discussed in Section 3.3, a random subset of approximately 60% (236,735 tweets) of the dataset was selected for training, with the remaining 20% (78,912 tweets) used for testing and 20% (78,912 tweets) used for validating the model. Each aforementioned classifier was trained and first evaluated against the testing and validation datasets using a flat hierarchical approach. The prediction output from the classification method was then used to evaluate the performance of the remaining four classification methods discussed in Section 4.
Table 5, Table 6 and Table 7 report the performance for each hierarchical classification method when applied to the predictions made by the Naive Bayes, J48 Decision Tree, and SVM models against the testing and validation datasets. With F scores of as low as 1.63%, the results demonstrate, for each classifier, that the flat hierarchical classification approach using traditional evaluation metrics achieved the lowest performance.
The extended methods that consider the hierarchical characteristics of WordNet-Affect demonstrate to improve the overall classification performance. In particular, when the depth-based classification approach is applied, the performance of Naive Bayes is significantly improved by 67.46 and 67.25 percentage points (from 7.33% to 74.79% for the testing data and 7.53% to 74.78% for the validation data), J48 Decision Tree by 70.30 and 71.04 percentage points (from 1.69% to 71.99% for the testing data and 1.63% to 72.67% for the validation data), and SVM by 62.30 and 62.45 percentage points (from 10.73% to 73.03% for the testing data and 10.70% to 73.15% for the validation data).
These results are a consequence of both the distribution of tweets annotated with emotions across the WordNet-Affect hierarchy (see Table 1), where a large percentage of the emotions are located on the second, third, and fourth hierarchical levels, as well as the performance of the flat classification approach, which often predicted emotions that were close to one another (e.g., C a = Sad, C p = Upset and C a = Happiness, C p = Exciting). Subsequently, a large percentage of the predictions for each classifier and for both the testing and validation datasets conformed to the threshold of the degree of misclassification set in Section 4.4. Table 8 reports that more than 50% of each dataset did not go beyond this threshold.
The distance-based method also improved the overall classification performance. In particular, the performance of J48 Decision Tree was improved by 56.36 percentage points (from 1.69% to 58.05% for the testing data) and SVM by 48.35 percentage points (from 10.70% to 59.05% for the validation data). As the classification behaviour of the distance-based method is similar to the depth-based approach, the reasoning behind the increase in results is also applicable here. However, this approach did not increase the classification performance as much as the depth-based approach. This may be explained by the threshold of the degree of misclassification set in Section 4.3. For instance, for the depth-based approach, C a = Emptiness, C p = Negative is considered as conforming to the threshold as the summation of the weights between them is less than 0.5. Meanwhile, in the distance-based approach, they do not conform to the threshold as the distance between them in the hierarchy is greater than three. Such behaviour, therefore, contributes to the overall classification performance.
When the relational-based method is applied, the overall classification performance of the Naive Bayes approach is significantly improved by 43.86 and 44.07 percentage points (from 7.33% to 51.19% for the testing data and 7.53% to 51.60% for the validation data), J48 Decision Tree by 34.72 and 34.42 percentage points (from 1.69% to 36.41% for the testing data and 1.63% to 36.05% for the validation data), and SVM by 60.90 and 61.35 percentage points (from 10.73% to 36.41% for the testing data and 10.70% to 36.05% for the validation data). The increase in classification performance is also intuitive as generalising emotions to their parent node reduces the class label space to four classes (Positive, Negative, Ambiguous, and Neutral), and, in turn, reduces the opportunity for misclassification. However, the relational-based method did not achieve as much of an increase in its classification performance in comparison to the depth-based approach. This may be explained by the fact that, although the flat classification approach predicted emotions close to one another, misclassifications often occurred. In particular, Naive Bayes incorrectly predicted 24.47% and 24.78% of the instances from the testing and validation datasets, respectively, and J48 Decision Tree incorrectly predicted 35.99% and 36.48% of the instances from the testing and validation datasets, respectively. Subsequently, such misclassifications negatively affect the overall performance of the classifiers.
The semantic-based approach did not report a significant improvement in the classification performance of each classifier. The SVM incurred the maximum increase of 10.35 percentage points (from 10.73% to 21.08% for the testing data). This may be a consequence of the original flat classification approach, which often predicted emotions that were too dissimilar (e.g., C a = Worried, C p = Hopefully). Subsequently, such dissimilarity negatively affected the average cosine similarity (Equation (8)) and contributed to the overall performance of the classifiers.

6. Conclusions

In the literature, the performance of emotive text classification using affective hierarchical schemes is often evaluated using the same traditional measures used to evaluate the performance when a finite set of isolated classes are used. However, this means the full characteristics of the emotive hierarchical scheme and the relationships between the entities within the hierarchy are not considered, and, thus, the overall classification performance is inaccurately reported.
To address the aforementioned limitation, this paper provided a comparative investigation of how hierarchical classification methods that extend traditional evaluation metrics to consider the hierarchical classification scheme can improve the performance of the classification of emotive texts, as well as classify fine-grained emotions that are not limited to a finite number of classes. This enables more implicit emotions to be identified, which is an important factor to consider in a range of use cases that rely on emotion classification.
To support the experiments presented herein, a dataset of emotive tweets was used to train and test widely used supervised machine learning classifiers. The testing and validation data were presented to a range of popular and widely used classifiers, including Naive Bayes, J48 Decision Tree, and SVM. The prediction output from each classifier was used to evaluate the performance of four extended hierarchical classification evaluation metrics. Overall, the results demonstrated that each hierarchical method improved the emotion classification results. The most notable improvement was recorded when a depth-based method was applied, where, for each classifier, the results improved by around 70 percentage points. This is an indication that such an approach should be adopted when classifying texts with emotions from a hierarchical scheme.

7. Future Work

The research presented herein has laid a foundational framework for evaluating hierarchical classification metrics in the context of emotive text classification. This work has the potential to more accurately reflect the performance of classifiers on datasets with inherent hierarchical structures. As part of future work, there is an opportunity to push the boundaries of this research by not only using hierarchical metrics for evaluation but also by incorporating these metrics directly into the classifiers and training methodologies. This may include modifying classifier architectures to inherently understand and leverage hierarchical relationships within data. By adjusting the model’s last layer or the loss function to account for penalising mistakes in a way that is proportional to their severity in the hierarchical context, classifiers would inherently prioritise the hierarchical structure of the data, leading to improved classification accuracy and more informative error analysis. The training process itself presents an opportunity for improvement. Integrating hierarchical metrics into the training regime could encourage models to prioritise the preservation of hierarchical relationships, possibly leading to more robust generalisation across hierarchy levels. This is particularly impactful when considering emotive hierarchies, where the relationships between classes carry semantic meaning.

Author Contributions

Conceptualization, L.W.; methodology, L.W.; validation, L.W. and E.A.; writing—original draft preparation, L.W. and E.A.; writing—review and editing, L.W., E.A. and P.B.; funding acquisition, P.B. All authors have read and agreed to the published version of the manuscript.

Funding

This work was funded by the Economic and Social Research Council (ESRC), grant ‘Discribe-Digital Security by Design (DSbD) Programme’. REF ES/V003666/1.

Data Availability Statement

The original data used in this study is presented in [12] and is available to access here: https://www.tensorflow.org/datasets/catalog/sentiment140 (accessed on 12 December 2023). The scripting developed to re-create the extended hierarchical classification measures in this study are available to access here: https://github.com/LowriWilliams/Comparing-Hierarchical-Approaches-to-Enhance-Supervised-Emotive-Text-Classification (accessed on 17 March 2024).

Acknowledgments

This work was performed using the computational facilities of the Advanced Research Computing at Cardiff (ARCCA) Division, Cardiff University, Cardiff, UK.

Conflicts of Interest

The authors declare no conflicts of interest.

References

  1. Williams, L.; Bannister, C.; Arribas-Ayllon, M.; Preece, A.; Spasić, I. The role of idioms in sentiment analysis. Expert Syst. Appl. 2015, 42, 7375–7385. [Google Scholar] [CrossRef]
  2. Liu, B. Sentiment analysis and subjectivity. In Handbook of Natural Language Processing; Chapman and Hall: Boca Raton, FL, USA, 2010; Volume 2, pp. 627–666. [Google Scholar]
  3. Munezero, M.; Montero, C.S.; Sutinen, E.; Pajunen, J. Are they different? Affect, feeling, emotion, sentiment, and opinion detection in text. IEEE Trans. Affect. Comput. 2014, 5, 101–111. [Google Scholar] [CrossRef]
  4. Williams, L.; Arribas-Ayllon, M.; Artemiou, A.; Spasić, I. Comparing the utility of different classification schemes for emotive language analysis. J. Classif. 2019, 36, 619–648. [Google Scholar] [CrossRef]
  5. Ekman, P.; Keltner, D. Universal facial expressions of emotion. In Nonverbal Communication: Where Nature Meets Culture; Segerstrale, U., Molnar., P., Eds.; Routledge: Abingdon, UK, 1997; pp. 27–46. [Google Scholar]
  6. Alm, C.O.; Sproat, R. Emotional sequencing and development in fairy tales. In Proceedings of the International Conference on Affective Computing and Intelligent Interaction, Beijing, China, 22–24 October 2005; Springer: Cham, Switzerland, 2005; pp. 668–674. [Google Scholar]
  7. Aman, S.; Szpakowicz, S. Identifying expressions of emotion in text. In Proceedings of the International Conference on Text, Speech and Dialogue, Pilsen, Czech Republic, 3–7 September 2007; Springer: Cham, Switzerland, 2007; pp. 196–205. [Google Scholar]
  8. Strapparava, C.; Mihalcea, R. Learning to identify emotions in text. In Proceedings of the 2008 ACM Symposium on Applied Computing, Fortaleza, Brazil, 16–20 March 2008; pp. 1556–1560. [Google Scholar]
  9. Sun, A.; Lim, E.P. Hierarchical text classification and evaluation. In Proceedings of the 2001 IEEE International Conference on Data Mining, IEEE, San Jose, CA, USA, 29 November–2 December 2001; pp. 521–528. [Google Scholar]
  10. Holden, N.; Freitas, A.A. Hierarchical classification of G-protein-coupled receptors with a PSO/ACO algorithm. In Proceedings of the IEEE Swarm Intelligence Symposium (SIS’06), IEEE, Indianapolis, IN, USA, 12–14 May 2006; pp. 77–84. [Google Scholar]
  11. Eisner, R.; Poulin, B.; Szafron, D.; Lu, P.; Greiner, R. Improving protein function prediction using the hierarchical structure of the gene ontology. In Proceedings of the 2005 IEEE Symposium on Computational Intelligence in Bioinformatics and Computational Biology, IEEE, San Diego, CA, USA, 14–15 November 2005; pp. 1–10. [Google Scholar]
  12. Go, A.; Bhayani, R.; Huang, L. Twitter sentiment classification using distant supervision. CS224N Proj. Rep. Stanf. 2009, 1, 2009. [Google Scholar]
  13. Esmin, A.; De Oliveira, R.L., Jr.; Matwin, S. Hierarchical classification approach to emotion recognition in twitter. In Proceedings of the Machine Learning and Applications (ICMLA), 2012 11th International Conference on Machine Learning and Applications, IEEE, Washington, DC, USA, 12–15 December 2012; Volume 2, pp. 381–385. [Google Scholar]
  14. Ghazi, D.; Inkpen, D.; Szpakowicz, S. Hierarchical approach to emotion recognition and classification in texts. In Proceedings of the Canadian Conference on Artificial Intelligence, Ottawa, ON, Canada, 31 May–2 June 2010; Springer: Cham, Switzerland, 2010; pp. 40–50. [Google Scholar]
  15. Charoensuk, J.; Sornil, O. A Hierarchical Emotion Classification Technique for Thai Reviews. J. ICT Res. Appl. 2018, 12, 280–296. [Google Scholar] [CrossRef]
  16. Angiani, G.; Cagnoni, S.; Chuzhikova, N.; Fornacciari, P.; Mordonini, M.; Tomaiuolo, M. Flat and hierarchical classifiers for detecting emotion in tweets. In Proceedings of the Conference of the Italian Association for Artificial Intelligence, Genova, Italy, 29 November–1 December 2016; Springer: Cham, Switzerland, 2016; pp. 51–64. [Google Scholar]
  17. Keshtkar, F.; Inkpen, D. A hierarchical approach to mood classification in blogs. Nat. Lang. Eng. 2012, 18, 61. [Google Scholar] [CrossRef]
  18. Zhang, F.; Xu, H.; Wang, J.; Sun, X.; Deng, J. Grasp the implicit features: Hierarchical emotion classification based on topic model and SVM. In Proceedings of the 2016 International Joint Conference on Neural Networks (IJCNN), IEEE, Vancouver, BC, Canada, 24–29 July 2016; pp. 3592–3599. [Google Scholar]
  19. Xu, H.; Yang, W.; Wang, J. Hierarchical emotion classification and emotion component analysis on Chinese micro-blog posts. Expert Syst. Appl. 2015, 42, 8745–8752. [Google Scholar] [CrossRef]
  20. Mishne, G. Experiments with mood classification in blog posts. In Proceedings of the ACM SIGIR 2005 Workshop on Stylistic Analysis of Text for Information Access, Salvador, Brazil, 15–19 August 2005; Volume 19, pp. 321–327. [Google Scholar]
  21. Laros, F.J.; Steenkamp, J.B.E. Emotions in consumer behavior: A hierarchical approach. J. Bus. Res. 2005, 58, 1437–1445. [Google Scholar] [CrossRef]
  22. Shaver, P.; Schwartz, J.; Kirson, D.; O’connor, C. Emotion knowledge: Further exploration of a prototype approach. J. Personal. Soc. Psychol. 1987, 52, 1061. [Google Scholar] [CrossRef] [PubMed]
  23. Storm, C.; Storm, T. A taxonomic study of the vocabulary of emotions. J. Personal. Soc. Psychol. 1987, 53, 805. [Google Scholar] [CrossRef]
  24. Miller, G.A. WordNet: A lexical database for English. Commun. ACM 1995, 38, 39–41. [Google Scholar] [CrossRef]
  25. Valitutti, A.; Strapparava, C.; Stock, O. Developing affective lexical resources. PsychNology J. 2004, 2, 61–83. [Google Scholar]
  26. Balahur, A.; Steinberger, R.; Kabadjov, M.; Zavarella, V.; van der Goot, E.; Halkia, M.; Pouliquen, B.; Belyaeva, J. Sentiment Analysis in the News. In Proceedings of the Seventh International Conference on Language Resources and Evaluation (LREC’10), Valletta, Malta, 17–23 May 2010; European Language Resources Association (ELRA): Paris, France, 2010. [Google Scholar]
  27. Pang, B.; Lee, L.; Vaithyanathan, S. Thumbs up? Sentiment classification using machine learning techniques. In Proceedings of the ACL-02 Conference on Empirical Methods in Natural Language Processing—Volume 10; Association for Computational Linguistics: Kerrville, TX, USA, 2002; pp. 79–86. [Google Scholar]
  28. Pang, B.; Lee, L. A sentimental education: Sentiment analysis using subjectivity summarization based on minimum cuts. In Proceedings of the 42nd annual meeting on Association for Computational Linguistics, Barcelona, Spain, 21–26 July 2004; Association for Computational Linguistics: Kerrville, TX, USA, 2004; p. 271. [Google Scholar]
  29. Whitelaw, C.; Garg, N.; Argamon, S. Using appraisal groups for sentiment analysis. In Proceedings of the 14th ACM International Conference on Information and Knowledge Management, ACM, Shanghai, China, 3–7 November 2005; pp. 625–631. [Google Scholar]
  30. Hu, M.; Liu, B. Mining and summarizing customer reviews. In Proceedings of the Tenth ACM SIGKDD International Conference on Knowledge Discovery and Data Mining, ACM, Seattle, WA, USA, 22–25 August 2004; pp. 168–177. [Google Scholar]
  31. O’Hare, N.; Davy, M.; Bermingham, A.; Ferguson, P.; Sheridan, P.; Gurrin, C.; Smeaton, A.F. Topic-dependent sentiment analysis of financial blogs. In Proceedings of the 1st International CIKM Workshop on Topic-Sentiment Analysis for Mass Opinion, ACM, Hong Kong, China, 6 November 2009; pp. 9–16. [Google Scholar]
  32. Koppel, M.; Shtrimberg, I. Good news or bad news? let the market decide. In Computing Attitude and Affect in Text: Theory and Applications; Springer: Cham, Switzerland, 2006; pp. 297–301. [Google Scholar]
  33. Mullen, T.; Malouf, R. A Preliminary Investigation into Sentiment Analysis of Informal Political Discourse. In Proceedings of the AAAI Spring Symposium: Computational Approaches to Analyzing Weblogs, Stanford, CA, USA, 27–29 March 2006; pp. 159–162. [Google Scholar]
  34. Yu, H.; Hatzivassiloglou, V. Towards answering opinion questions: Separating facts from opinions and identifying the polarity of opinion sentences. In Proceedings of the 2003 Conference on Empirical Methods in Natural Language Processing, Sapporo, Japan, 11–12 July 2003; Association for Computational Linguistics: Kerrville, TX, USA, 2003; pp. 129–136. [Google Scholar]
  35. Wiebe, J.; Wilson, T.; Bruce, R.; Bell, M.; Martin, M. Learning subjective language. Comput. Linguist. 2004, 30, 277–308. [Google Scholar] [CrossRef]
  36. Alemi, F.; Torii, M.; Clementz, L.; Aron, D.C. Feasibility of real-time satisfaction surveys through automated analysis of patients’ unstructured comments and sentiments. Qual. Manag. Healthc. 2012, 21, 9–19. [Google Scholar] [CrossRef] [PubMed]
  37. Liu, D. The most frequently used spoken American English idioms: A corpus analysis and its implications. Tesol Q. 2003, 37, 671–700. [Google Scholar] [CrossRef]
  38. Pak, A.; Paroubek, P. Twitter as a corpus for sentiment analysis and opinion mining. In Proceedings of the LREc, Valletta, Malta, 17–23 May 2010; Volume 10, pp. 1320–1326. [Google Scholar]
  39. O’Connor, B.; Balasubramanyan, R.; Routledge, B.; Smith, N. From tweets to polls: Linking text sentiment to public opinion time series. In Proceedings of the International AAAI Conference on Web and Social Media, Washington, DC, USA, 23–26 May 2010; Volume 4. [Google Scholar]
  40. Tumasjan, A.; Sprenger, T.; Sandner, P.; Welpe, I. Predicting elections with twitter: What 140 characters reveal about political sentiment. In Proceedings of the International AAAI Conference on Web and Social Media, Washington, DC, USA, 23–26 May 2010; Volume 4. [Google Scholar]
  41. Agarwal, A.; Xie, B.; Vovsha, I.; Rambow, O.; Passonneau, R.J. Sentiment analysis of twitter data. In Proceedings of the Workshop on Language in Social Media (LSM 2011), Portland, OR, USA, 23 June 2011; pp. 30–38. [Google Scholar]
  42. Kouloumpis, E.; Wilson, T.; Moore, J. Twitter sentiment analysis: The good the bad and the omg! In Proceedings of the International AAAI Conference on Web and Social Media, Barcelona, Spain, 17–21 July 2011; Volume 5. [Google Scholar]
  43. Spasic, I.; Nenadic, G. Clinical text data in machine learning: Systematic review. JMIR Med. Inform. 2020, 8, e17984. [Google Scholar] [CrossRef] [PubMed]
  44. Harish, B.S.; Guru, D.S.; Manjunath, S. Representation and classification of text documents: A brief review. IJCA Spec. Issue RTIPPR (2) 2010, 110, 119. [Google Scholar]
  45. Gutiérrez, L.; Keith, B. A systematic literature review on word embeddings. In Proceedings of the International Conference on Software Process Improvement, Gothenburg, Sweden, 26–27 May 2018; Springer: Cham, Switzerland, 2018; pp. 132–141. [Google Scholar]
  46. Levy, O.; Goldberg, Y. Dependency-based word embeddings. In Proceedings of the 52nd Annual Meeting of the Association for Computational Linguistics (Volume 2: Short Papers), Baltimore, MD, USA, 23–24 June 2014; pp. 302–308. [Google Scholar]
  47. Genism. Available online: https://radimrehurek.com/gensim/intro.html (accessed on 3 March 2021).
  48. Bird, S. NLTK: The natural language toolkit. In Proceedings of the COLING/ACL 2006 Interactive Presentation Sessions, Sydney, NSW, Australia, 17–18 July 2006; pp. 69–72. [Google Scholar]
  49. Costa, E.; Lorena, A.; Carvalho, A.; Freitas, A. A review of performance evaluation measures for hierarchical classifiers. In Proceedings of the Evaluation Methods for Machine Learning II: Papers from the AAAI—2007 Workshop, Vancouver, BC, Canada, 22 July 2007; pp. 1–6. [Google Scholar]
  50. Cerri, R.; Pappa, G.L.; Carvalho, A.C.P.; Freitas, A.A. An extensive evaluation of decision tree-based hierarchical multilabel classification methods and performance measures. Comput. Intell. 2015, 31, 1–46. [Google Scholar] [CrossRef]
  51. Kiritchenko, S.; Matwin, S.; Famili, F. Hierarchical text categorization as a tool of associating genes with gene ontology codes. In Proceedings of the European Workshop on Data Mining and Text Mining in Bioinformatics, Pisa, Italy, 20–24 September 2004; pp. 30–34. [Google Scholar]
  52. Kiritchenko, S.; Matwin, S.; Famili, F. Functional annotation of genes using hierarchical text categorization. In Proceedings of the ACL Workshop on Linking Biological Literature, Ontologies and Databases: Mining Biological Semantics, Detroit, MI, USA, 24 June 2005. [Google Scholar]
  53. Kiritchenko, S.; Matwin, S.; Nock, R.; Famili, A.F. Learning and evaluation in the presence of class hierarchies: Application to text categorization. In Proceedings of the Conference of the Canadian Society for Computational Studies of Intelligence, Québec City, QC, Canada, 7–9 June 2006; Springer: Cham, Switzerland, 2006; pp. 395–406. [Google Scholar]
  54. Kosmopoulos, A.; Partalas, I.; Gaussier, E.; Paliouras, G.; Androutsopoulos, I. Evaluation measures for hierarchical classification: A unified view and novel approaches. Data Min. Knowl. Discov. 2015, 29, 820–865. [Google Scholar] [CrossRef]
  55. Hall, M.; Frank, E.; Holmes, G.; Pfahringer, B.; Reutemann, P.; Witten, I.H. The WEKA data mining software: An update. ACM SIGKDD Explor. Newsl. 2009, 11, 10–18. [Google Scholar] [CrossRef]
  56. Wolpert, D.H. The supervised learning no-free-lunch theorems. In Soft Computing and Industry; Springer: Cham, Switzerland, 2002; pp. 25–42. [Google Scholar]
Figure 1. An overview of the study design.
Bdcc 08 00038 g001
Figure 2. An excerpt from the WordNet-Affect hierarchy.
Bdcc 08 00038 g002
Figure 3. Top 22 most frequently used emotions across the dataset.
Bdcc 08 00038 g003
Figure 4. An excerpt from the WordNet-Affect hierarchy with weighted edges for computing the degree of misclassification.
Bdcc 08 00038 g004
Table 1. Distribution of emotions across the WordNet-Affect hierarchy.
LevelExamples of EmotionsNo. of Emotions
1Positive, Negative, Neutral, Ambiguous4
2Love, Surprise, Sad, Fear162
3Adore, Amusement, Distress, Embarrassed582
4Jolly, Peaceful, Annoyed, Confused527
5Pride, Fulfilment, Aggressive, Livid198
6Remorse, Contrite, Guilt, Woeful46
7Covet, Jealousy, Greedy, Green-eyed12
Table 2. Examples of tweets mapped to emotions.
TweetEmotion
I wish I had someone to talk to. I’m so upset.Upset
I hate when I have to call and wake people upHate
Is strangely sad about Lilo and Samro breaking up.Sad
Leanne is angry at me.Angry
I’m glad ur doing well.Glad
Love your tattoo!Love
My cluster is back and I’m a happy man.Happy
Is excited for the day.Excited
Table 3. Distribution of emotions across the WordNet-Affect hierarchy.
LevelNo. of TweetsPercentage of Tweets
111,2132.8
284,14921.3
3200,71150.9
446,43211.8
547,32112.0
613470.3
733850.9
Table 4. 10-fold cross-validation results (N/A indicates no results were able to be reported).
ClassifierPRF
Naïve Bayes27.7942.1128.97
J48 Decision Tree33.4817.3520.67
SVM26.3411.3513.57
One R3.360.430.48
Bayesian Network0.020.110.03
ZeroR0.020.110.03
Random ForestN/AN/AN/A
Simple LogisticN/AN/AN/A
Table 5. Classification results using Naive Bayes.
TestingValidation
MethodPRFPRF
Flat hierarchical8.309.747.338.469.837.53
Relational-based52.2250.8551.1952.9251.1951.60
Distance-based46.4241.7834.8238.6371.8638.75
Depth-based77.4577.4974.7977.7077.1974.78
Semantic-based18.7821.4213.0320.2623.0813.45
Table 6. Classification results using J48 Decision Tree.
TestingValidation
MethodPRFPRF
Flat hierarchical1.981.721.691.861.691.63
Relational-based36.3837.0936.4136.0936.7336.05
Distance-based48.3887.0858.0626.8858.6533.52
Depth-based64.6986.2871.9965.4686.2672.67
Semantic-based21.0220.4912.5117.7919.6411.03
Table 7. Classification results using SVM.
TestingValidation
MethodPRFPRF
Flat hierarchical17.889.1810.7317.359.2210.70
Relational-based72.0771.3671.6372.4771.8472.05
Distance-based76.7537.5038.2538.6827.2159.05
Depth-based61.2394.9773.0361.3894.8973.15
Semantic-based34.9829.5021.0833.9029.9420.71
Table 8. Distribution of predictions conforming to the threshold of the degree of misclassification for the depth-based method.
TestingValidationTestingValidation
ClassifierNo. of TweetsPercentage of Tweets
Naive Bayes49,98549,77763.3463.08
J48 Decision Tree42,35741,85753.6853.04
SVM61,15361,27877.5077.65
Disclaimer/Publisher’s Note: The statements, opinions and data contained in all publications are solely those of the individual author(s) and contributor(s) and not of MDPI and/or the editor(s). MDPI and/or the editor(s) disclaim responsibility for any injury to people or property resulting from any ideas, methods, instructions or products referred to in the content.

