Article

AI-Based User Empowerment for Empirical Social Research

Faculty of Mathematics and Computer Science, University of Hagen, Universitätsstrasse 1, D-58097 Hagen, Germany
*
Author to whom correspondence should be addressed.
Big Data Cogn. Comput. 2024, 8(2), 11; https://doi.org/10.3390/bdcc8020011
Submission received: 26 December 2023 / Revised: 18 January 2024 / Accepted: 18 January 2024 / Published: 23 January 2024
(This article belongs to the Special Issue Big Data and Cognitive Computing in 2023)

Abstract

:
Manual labeling and categorization are extremely time-consuming and, thus, costly. AI and ML-supported information systems can bridge this gap and support labor-intensive digital activities. Since it requires categorization, coding-based analysis, such as qualitative content analysis, reaches its limits with large amounts of data and could benefit from AI and ML-based support. Empirical social research, its application domain, benefits from Big Data’s ability to create more extensive human behavior and development models. A range of applications are available for statistical analysis to serve this purpose. This paper aims to implement an information system that supports researchers in empirical social research in performing AI-supported qualitative content analysis. AI2VIS4BigData is a reference model that standardizes use cases and artifacts for Big Data information systems that integrate AI and ML for user empowerment. Thus, this work’s concepts and implementations try to achieve an AI2VIS4BigData-compliant information system that supports social researchers in categorizing text data and creating insightful dashboards. Thereby, the text categorization is based on an existing ML component. Furthermore, it presents two evaluations that were conducted for these concepts and implementations: a qualitative cognitive walkthrough assessing the system’s usability and a quantitative user study with 18 participants revealed that though the users perceive AI support as more efficient, they need more time to reflect on the recommendations. The research revealed that AI support increased the correctness of the users’ categorizations but also slowed down their decision-making. The assumption that this is due to the UI design and additional information for processing requires follow-up research.

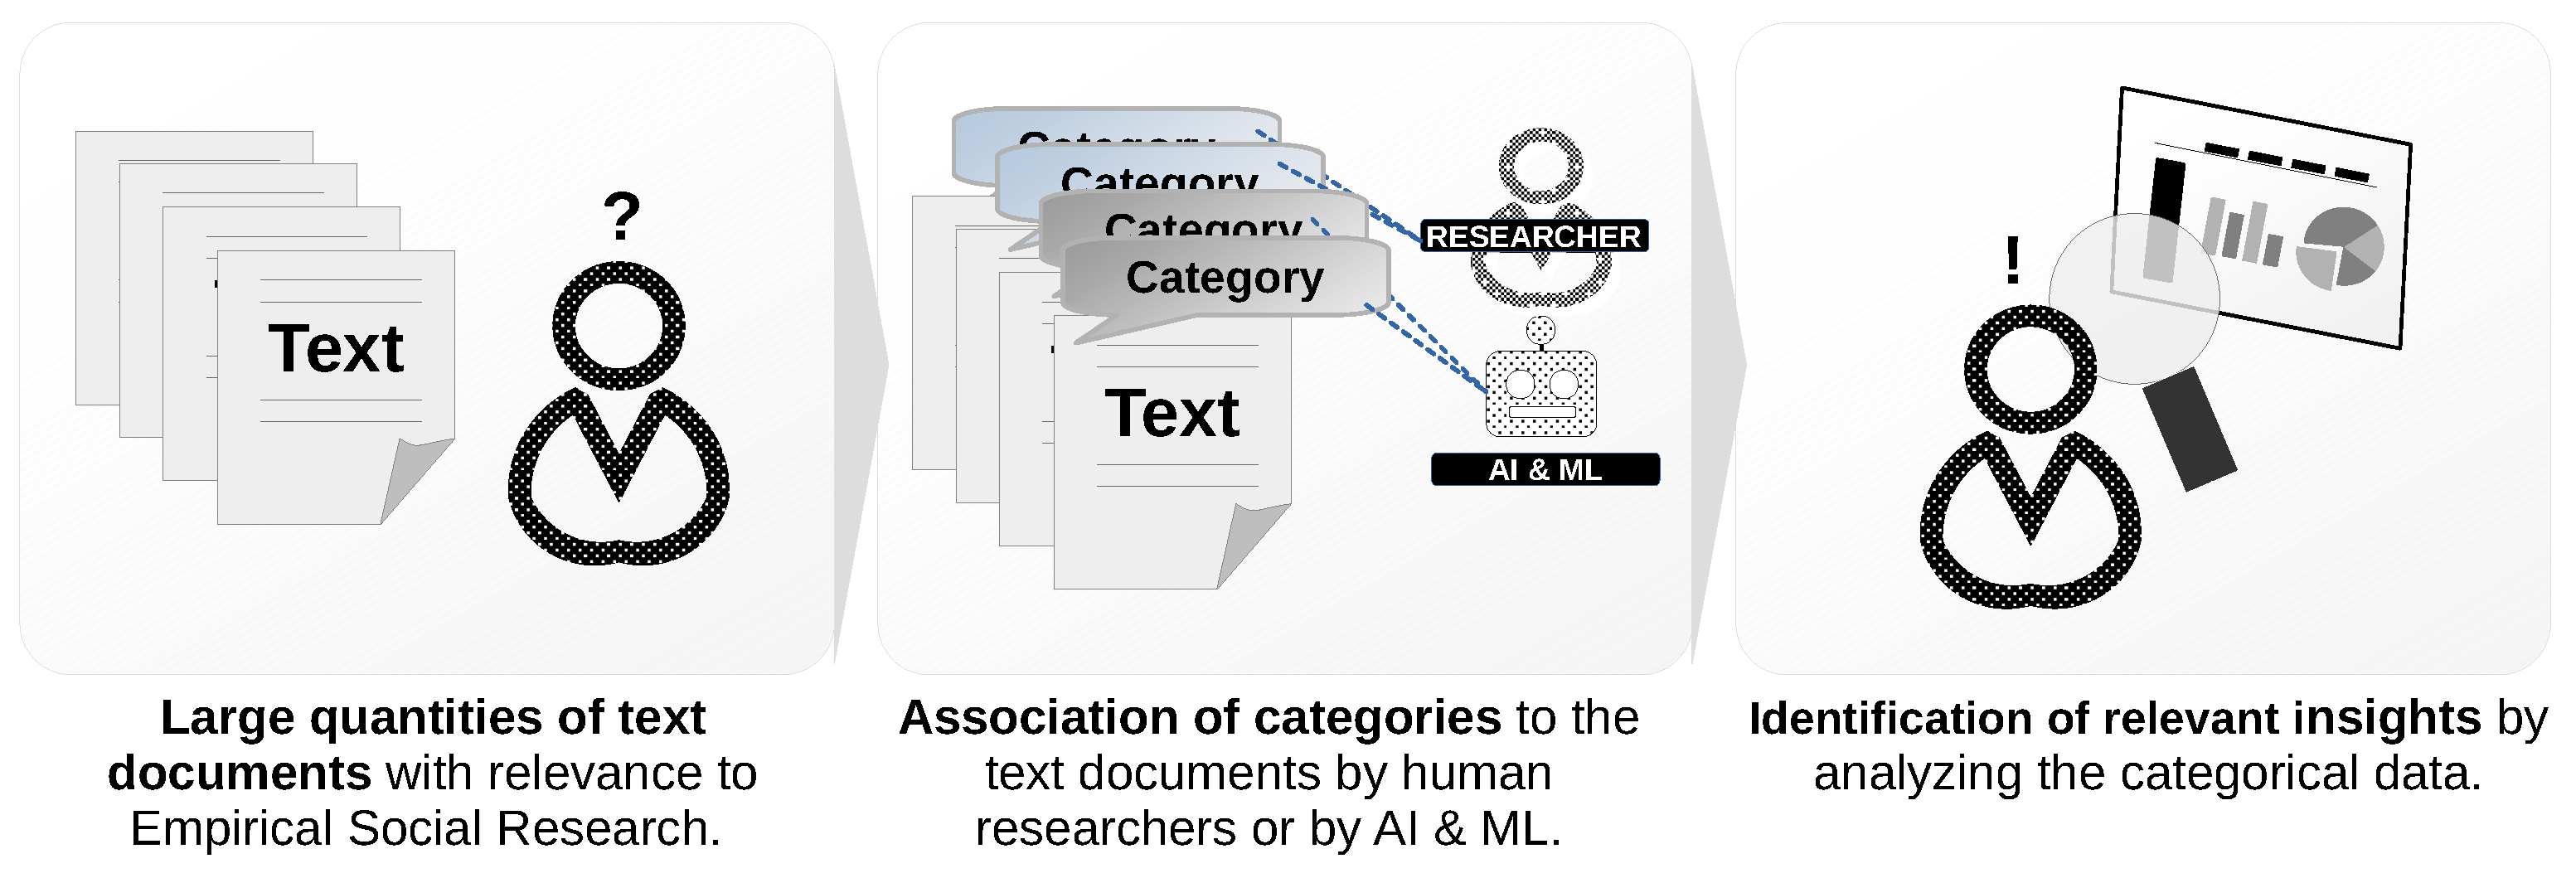
1. Introduction and Motivation

Global data quantity is growing rapidly [1,2]: growing populations, increasing usage of digital devices [2], and internet services [1] lead to huge quantities of data and opportunities for science and almost all industries. Analyzing these data can help improve efficiency by supporting human users or creating new business models. Empirical social science is one domain that benefits from more and more available data. The growing relevance of social media [1,2] enables researchers to assess human behavior and developments on a large scale. The vast quantities of data must be transformed in a processable way to exploit this potential. Qualitative content analysis enables social researchers to do that: it is a “very systematic way of making sense of the large amount of material that would invariably emerge in the process of doing qualitative research” [3].
Large quantities of data immediately call for AI and its data-driven sub-domain of ML: more data enables training more precise models and predict, e.g., categories of documents relevant to empirical social research [4]. However, the application of AI and ML raises certain requirements for skills in computer science and statistics that not all researchers from empirical social research have. A second application area of AI and ML can be helpful to bridge that knowledge gap: using AI and ML to empower users in using Information Systems by supporting them in lowering entry barriers and providing relevant information [5]. Qualitative content analysis can benefit from empowering its users in two areas: supporting the categorization of data and supporting the visual analysis of data.
This work aims to systematically assess these two use contexts and define a conceptual model, implement a prototype, and evaluate the prototype and the underlying hypothesis. The following sections comprise a state-of-the-art review (Section 2), the conceptual modeling following the user-centered system design approach (Section 3), a description of the implementations (Section 4), a comprehensive evaluation (Section 5), and a conclusion that summarizes this paper’s achievements and further action areas for future research (Section 6).

2. Related Work and Remaining Challenges

Empowering users in using information systems requires a profound understanding of their background. Consequently, state-of-the-art research in this paper starts with an overview of empirical social research and the specific task of qualitative content analysis. One task of this qualitative content analysis is the association of categories with uncategorized material [3]. Since ML-based text categorization solutions exist, the second sub-section introduces such a component. The third sub-section introduces the AI2VIS4BigData reference model, intended for modeling within this paper. It provides guidelines and structure for implementing information systems that provide AI-based user empowerment to its end users. The fourth sub-section concludes with a summary of relevant findings and remaining challenges for the remainder of this paper.

2.1. Empirical Social Research and Qualitative Content Analysis

The availability of Big Data, e.g., from social media, greatly impacts empirical social sciences [6]. This research domain uses and analyzes available information about people’s social behavior and interaction. More data enables the study of highly complex social situations but also introduces new challenges [6]. Big Data calls for new skills for social scientists: “The British Academy is calling for […] skills that are not only valuable for the future of empirical social science research but also for the training of social scientists to meet the analytic questions, demands, and requirements of industry, business, and governments” [6].
Qualitative Content Analysis, devised by Philipp Mayring, is a methodology for examining symbolic data (especially text-based data), particularly in empirical social research [7]. In contrast to clearly defined research methods, qualitative content analysis deals with ambiguity and subjective interpretation [3]: “Qualitative researchers are comfortable with the idea that there can be multiple meanings, multiple interpretations and that these can shift over time and across different people” [3]. An example of qualitative content analysis is assessing content on social media platforms like Reddit (e.g., about people’s emotional experience) [8].
The process can be divided into a preparation and an application phase [3]. Preparation commences with defining a research question, selecting material [3], and formulating a coding guide encompassing the categories to which the document can be allocated [7]. These categories may be derived from a pre-established catalog, such as Ekman’s fundamental emotions, or formulated during the text-based categorization process [7]. The application phase consists of applying the coding guide to the selected material and analyzing the resulting data [3].
Defining the analyzing unit, a metric that determines the size of text segments, is mandatory before categorizing the text data [7]. This parameter defines the size of segments in which the text is divided for assignment to specific categories [7]. One potential analyzing unit could be sentence-based, where each sentence is assigned to a distinct category [7]. Another commonly employed analyzing unit in social media research is an entire post allowing only one category assignment [7]. The subsequently assigned categories can be examined using statistical methods like frequency analysis [7].
Figure 1 summarizes the Qualitative Content Analysis process and highlights the challenges associated with the evolving digital data foundation. The question mark refers to an end user challenged with large quantities of uncategorized data. The exclamation mark expresses the end user’s capability to assess the data confidently.
The substantial volume of textual documents in digital media necessitates support from software systems. These systems can be enhanced by AI and ML algorithms, aiding users in the categorization of text data. Systems with such support, particularly focusing on the whole user journey of qualitative content analysis, do not exist in the current state-of-the-art.

2.2. Machine Learning-Based Text Categorization (MLTC)

Text categorization is a method to assign content-related attributes to text-based digital documents [9]. It aims to master the increasing complexity due to the confrontation with more and more information. These attributes support various applications, e.g., information retrieval, spam mail detection, the management of scientific documents in virtual research environments, or “argument mining, the finding of pro- and contra- arguments in large text corpora” [9].
Various implementations of automated text categorization methods exist [10]. Until the 1990s, the common approach was text categorization by expert-defined rules [10]. Since then, ML-based text categorization has become increasingly popular [10]. Therefore, approaches like text filtering or word-sense disambiguation were replaced by ML-based approaches based on indexing methods and classifying ML algorithms [10]. Popular indexing methods comprise TFIDF or the Darmstadt indexing approach [10]. The Support Vector Machine (SVM) [10] is a common ML classifier for text categorization. It is “fairly robust to overfitting” [10], does not require manual tuning [10], and is not very computationally intensive [9]. MLTC is an ML-based text categorization framework developed by a researcher from the same research group as this paper’s authors [9]. Since MLTC supports common text categorization methods (e.g., TFIDF-SVM [9]), it was selected for this work.
MLTC utilizes ML algorithms that detect patterns within a training data corpora [9] (e.g., news website articles with specific keywords). Emergent, developing, and changing knowledge complicates the detection of such attributes and the application of MLTC since it might imply changing categorizations that ML or statistics-based methods cannot detect to as the “necessary examples are missing” [9].
To master the lack of training data, Tobias Eljasik-Swoboda proposes in his dissertation [9] a system architecture that utilizes unsupervised ML within a novel algorithm (“No Target Function Classifier”) to detect categories without relying on test data [9]. However, MLTC supports multiple other text categorization ML algorithms that are based on target functions [9]. Since existing solutions struggle with a high “technical integration effort”, he introduces a concept that utilizes microservices that are deployable within containers (e.g., Docker) to cloud-based execution environments [9] that do not require detailed installations (e.g., to meet library requirements).
To allow multiple MLTC executions at a time (and thereby reach scalability), a “Trainer/Athlete” pattern is presented that consists of a trainer microservice that is “responsible for computing the utilized model” and multiple athlete microservices that are responsible for “inference using the computed model” [9]. A big advantage of the “microservice oriented architecture is the ability to compose applications by combining different microservices” [9]. In addition, Eljasik-Swoboda [9] introduces an API with a detailed data model description of an ML model, its configuration, and its parameter choices to enable the communication of trainer and athlete microservices with each other and with different entities such as load balancing systems or with the end user.

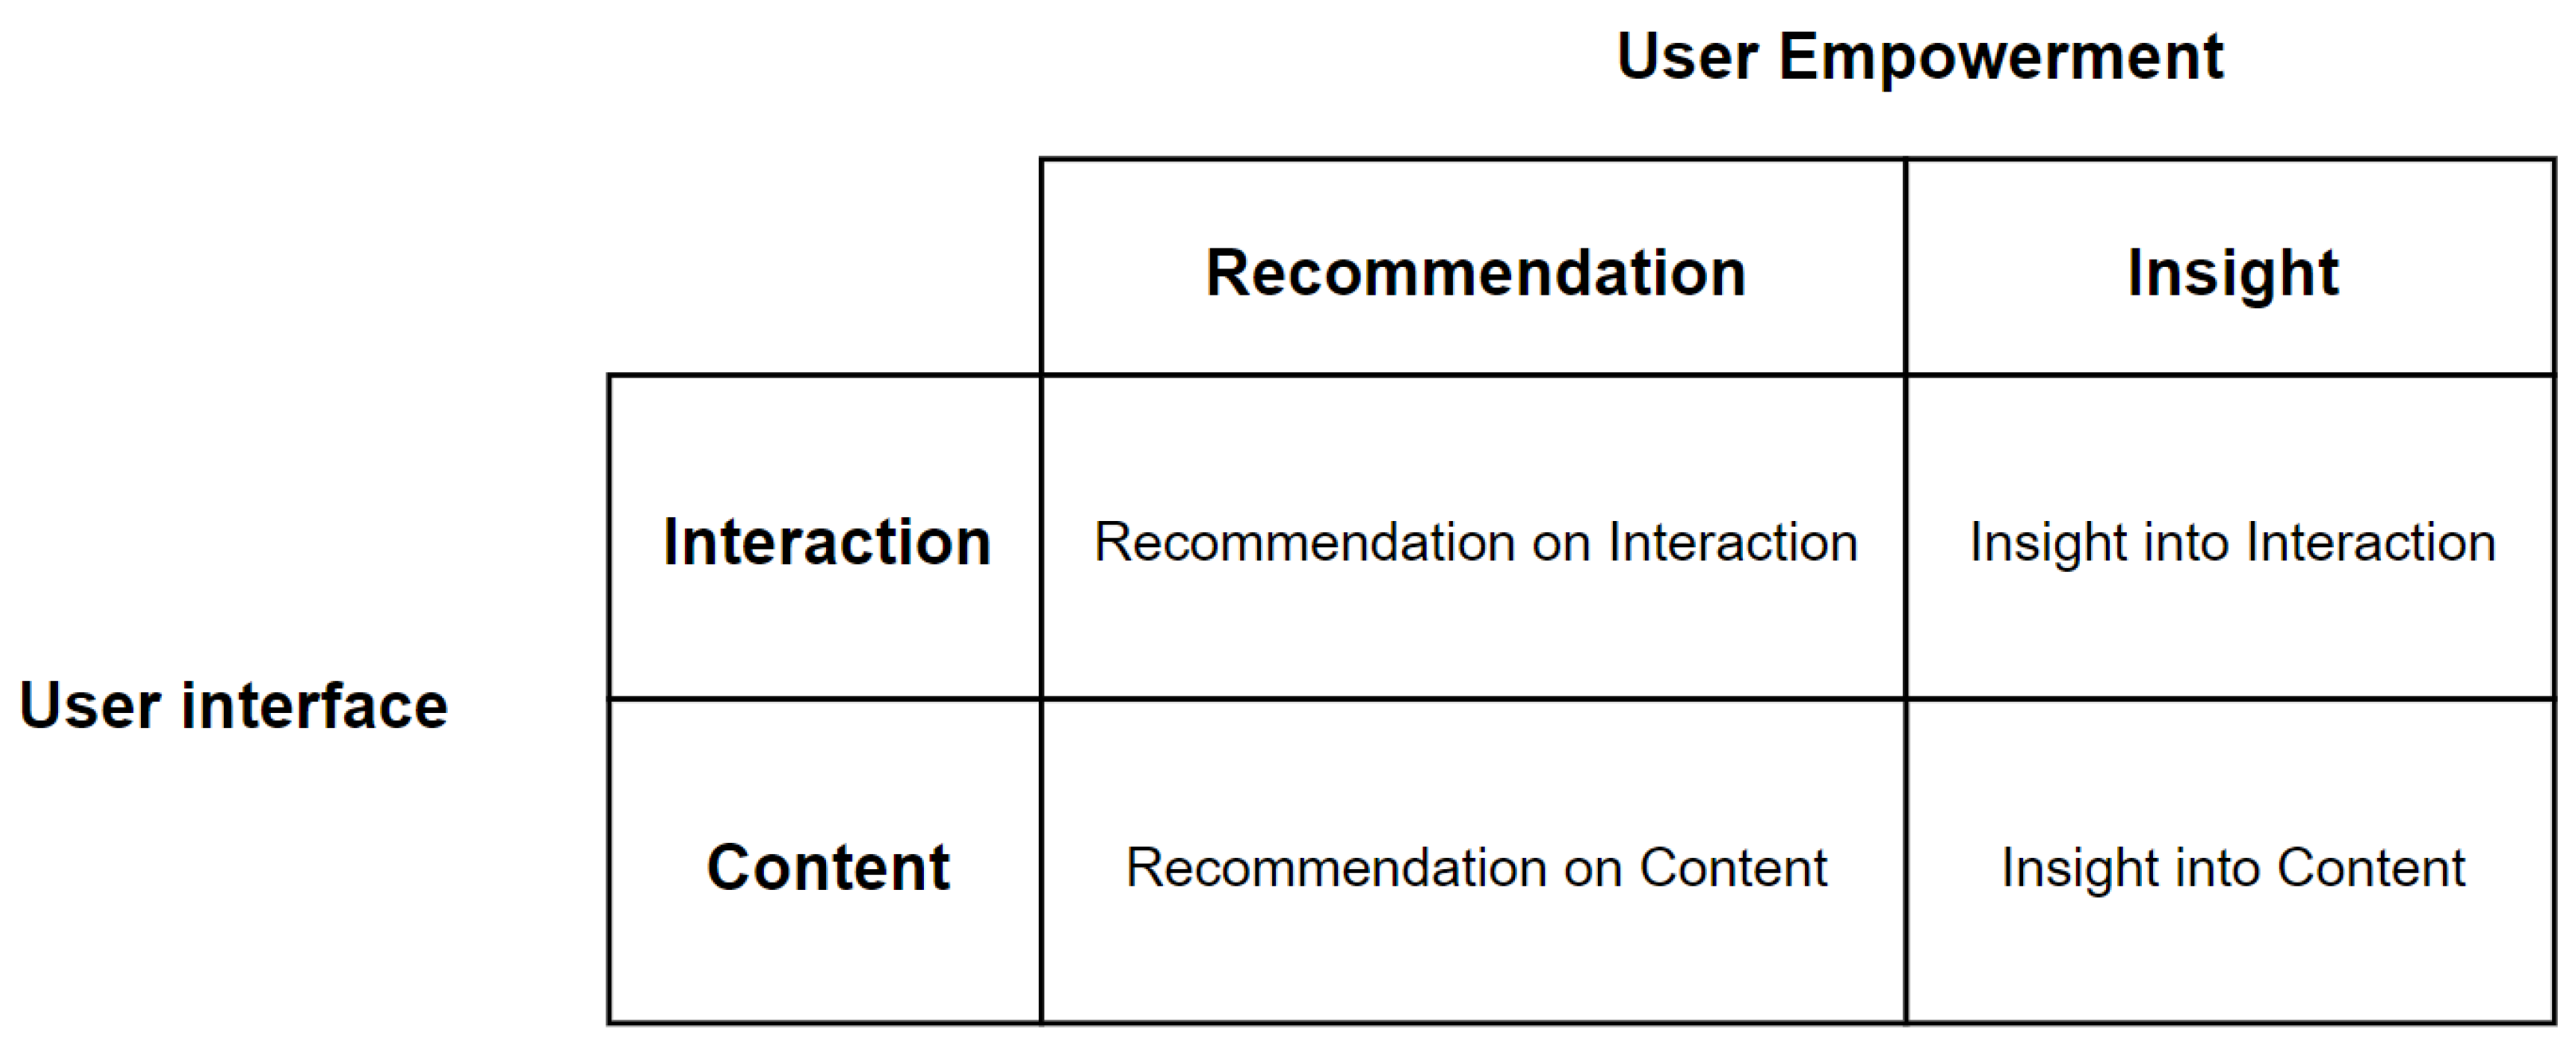
2.3. AI2VIS4BigData and User Empowerment

Addressing the growing importance of visual Big Data analysis and the immense opportunities of AI and ML, some authors of this paper introduced a reference model for Information Systems (IS) [11]. It standardizes terminology, information artifacts, and user stereotypes for AI and ML applications within the IVIS4BigData data analysis pipeline, originally introduced by Bornschlegl in 2016 [11]. This analysis pipeline contains four data transformation processing steps: data integration, data analysis, data visualization, and data exploration [11]. AI and ML can be applied for every processing step [11]. AI2VIS4BigData extends IVIS4BigData with AI and ML-based user empowerment for non-technical user stereotypes that could benefit from Big Data insights within these four processing steps [5]. Figure 2 displays these two orthogonally arranged principles of AI and ML (user empowerment and data transformation) to be applied during visual Big Data analysis.
Figure 2 shows that AI and ML-based user empowerment can be applied for every Big Data analysis pipeline processing step. To systematically assess this, some authors of this paper introduced a use case taxonomy demonstrating exemplary user-empowering scenarios for each processing step [5]. Examples comprise the recommendation for suitable data wrappers while integrating data or information on potential anomalous data samples while analyzing data [5]. The use case taxonomy differentiates two different targets of user empowerment: informing users about potential system interactions or the information system’s content [5]. This information can further be divided into active recommendations and pure communication of insights. Figure 3 displays these user empowerment applications within a two-by-two matrix.
The user-empowering recommendations in Figure 3 comprise active suggestions for interacting with the system or handling the content. The insights comprise passive information on potential interaction and non-suggestive content descriptions. An example of AI and ML-based user-empowering recommendations is GitHub Copilot [12]. It is an “AI pair programmer” [12] based on OpenAI’s GPT-3 trained on large quantities of code in Microsoft’s GitHub repositories [12]. It enables programmers to create code by providing tasks and context via prompts. Based on this content (prompts), Copilot recommends code fragments the users can work with [12]. A study with students confirmed ChatGPT’s helpfulness “for programmers and computer engineering in their professional life” [13] yet highlights the need to be careful due to potentially unreliable results [13]. An example of user-empowering insight is the automatic detection of anomalies within information systems handling the workflow of insurance analysts [11].
Previous works related to AI2VIS4BigData introduced examples for user empowerment within data integration, data analysis, and data visualization [11]. However, an exemplary concept and prototype implementation for the data exploration processing step does not yet exist.

2.4. Discussion and Remaining Challenges

This section introduces the empirical research domain and its task of qualitative content analysis. Big Data brings a lot of opportunities but also challenges to this domain. The MLTC component by Tobias Eljasik-Swobody [9] enables researchers to increase their efficiency by providing AI and ML-based text categorizations. AI2VIS4BigData is a reference model that standardizes the integration and application of AI and ML within visual Big Data analysis with a special focus on empowering its users. The state-of-the-art review revealed three Remaining Challenges (RCs) that are addressed in the remainder of this work:
  • (RC1) Application Domain: neither text categorization nor other social research-related application domains were assessed for AI2VIS4BigData or IVIS4BigData-related research.
  • (RC2) MLTC: the MLTC component is not yet integrated into a user-empowering IS.
  • (RC3) Data Exploration User Empowerment: there exists no example application for empowering users for the data exploration process step of the AI2VIS4BigData reference model.
This publication aims to address these three challenges within the following sections by designing an IS for the qualitative content analysis use context (RC1) that uses the MLTC component (RC2) and complies with the AI2VIS4BigData reference model (RC3).

3. Conceptual Modeling

Analyzing target users and their requirements is the starting point of every concept design for user-empowering applications relevant to the AI2VIS4BigData reference model [11]. Norman and Draper’s User-Centered Design (UCD) methodology [14] is applied for exactly this purpose. It divides system design into four phases [14]: context definition, requirements analysis, concept design, and evaluation [14]. This section follows the UCD approach, details use context, specifies requirements in use cases, and creates relevant conceptual models. It will also address the identified remaining challenges from Section 2:
  • (For RC1) Section 3.1 will derive the requirements and Section 3.4 will design a conceptual architecture for an IS that uses AI and ML for empowering its users in categorizing data and analyzing categorized data.
  • (For RC2) Section 3.2 describes the design of an MLTC-based component for integration into a user-empowering IS.
  • (For RC3) Section 3.3 describes the design of user-empowering data exploration component as exemplary AI2VIS4BigData reference implementation.
This section concludes with a summary of the remaining challenges, designed conceptual models, and their impact on the remainder of this work.

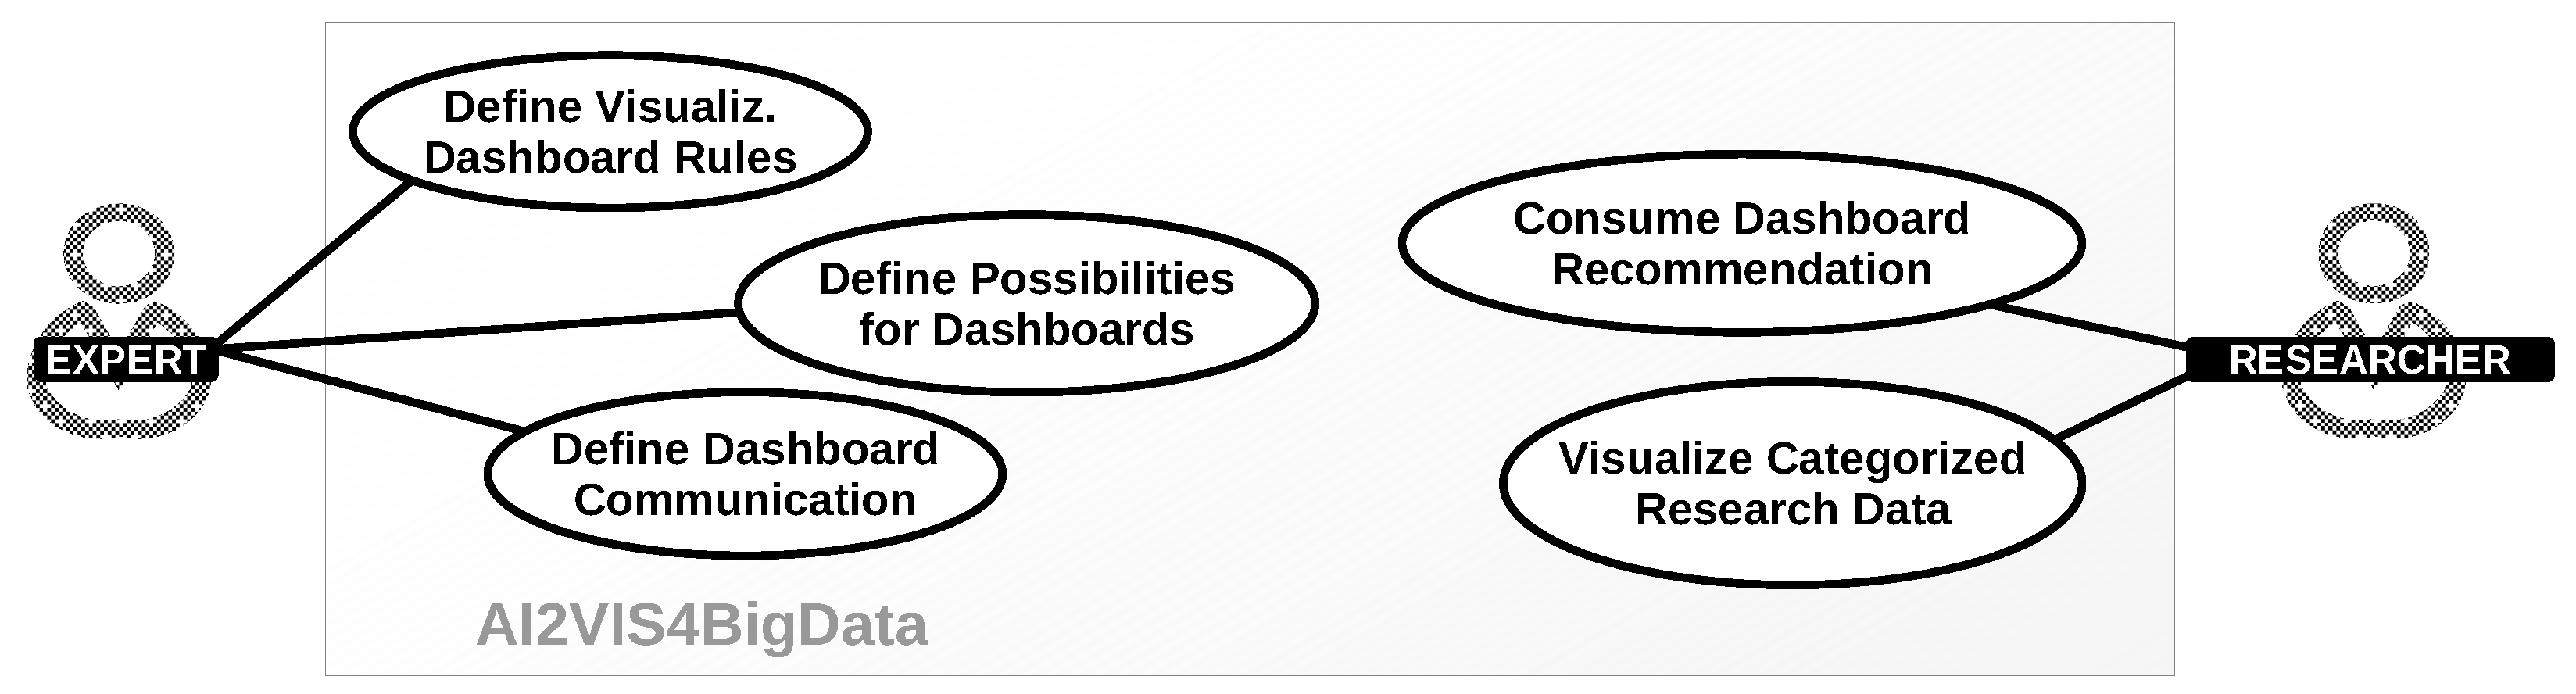
3.1. Use Context and Use Cases

Qualitative content analysis assesses documents’ metadata relevant to a certain research domain (e.g., papers, historical documents, or websites). It can be divided into two steps: the categorization of content and the analysis of the results of this categorization.
The categorization is a labeling process (assign one or many labels as metadata) and can be conducted by human researchers supported or complemented by ML-based methods (refer to Section 2.2 with Eljasik-Swoboda’s MLTC [9]).
The analysis identifies interesting patterns, gaps, or outliers in the categorized content. This activity can become enormously challenging and feel like “looking for a needle in a haystack” if the dataset of interest becomes very large. Systems that provide researchers with a proposal of what visualizations on a dashboard might interest them could empower them to be more efficient and use the system more confidently. Figure 4 displays five use cases for a system that empowers researchers within the analysis step of qualitative content analysis.
All of the use cases in the use context diagram in Figure 4 can be broken down into single activities performed by expert users and researchers and automatically performed system computations. The use case diagram in Figure 5 illustrates this for the use case “Consume Dashboard Recommendation”.
The use case in Figure 5 contains four different system boundaries: a user interface used by the end user (researcher), a repository component that contains all available recommendations, a scorer component that scores the information content of visualization methods for certain data, and a selector component that uses these scores to provide recommendations to the end user. Table 1 displays a tabular description of this exemplary use case, enabling derivation of requirements. This exemplary use case serves as a basis for deriving a conceptual architecture within the remainder of this section.

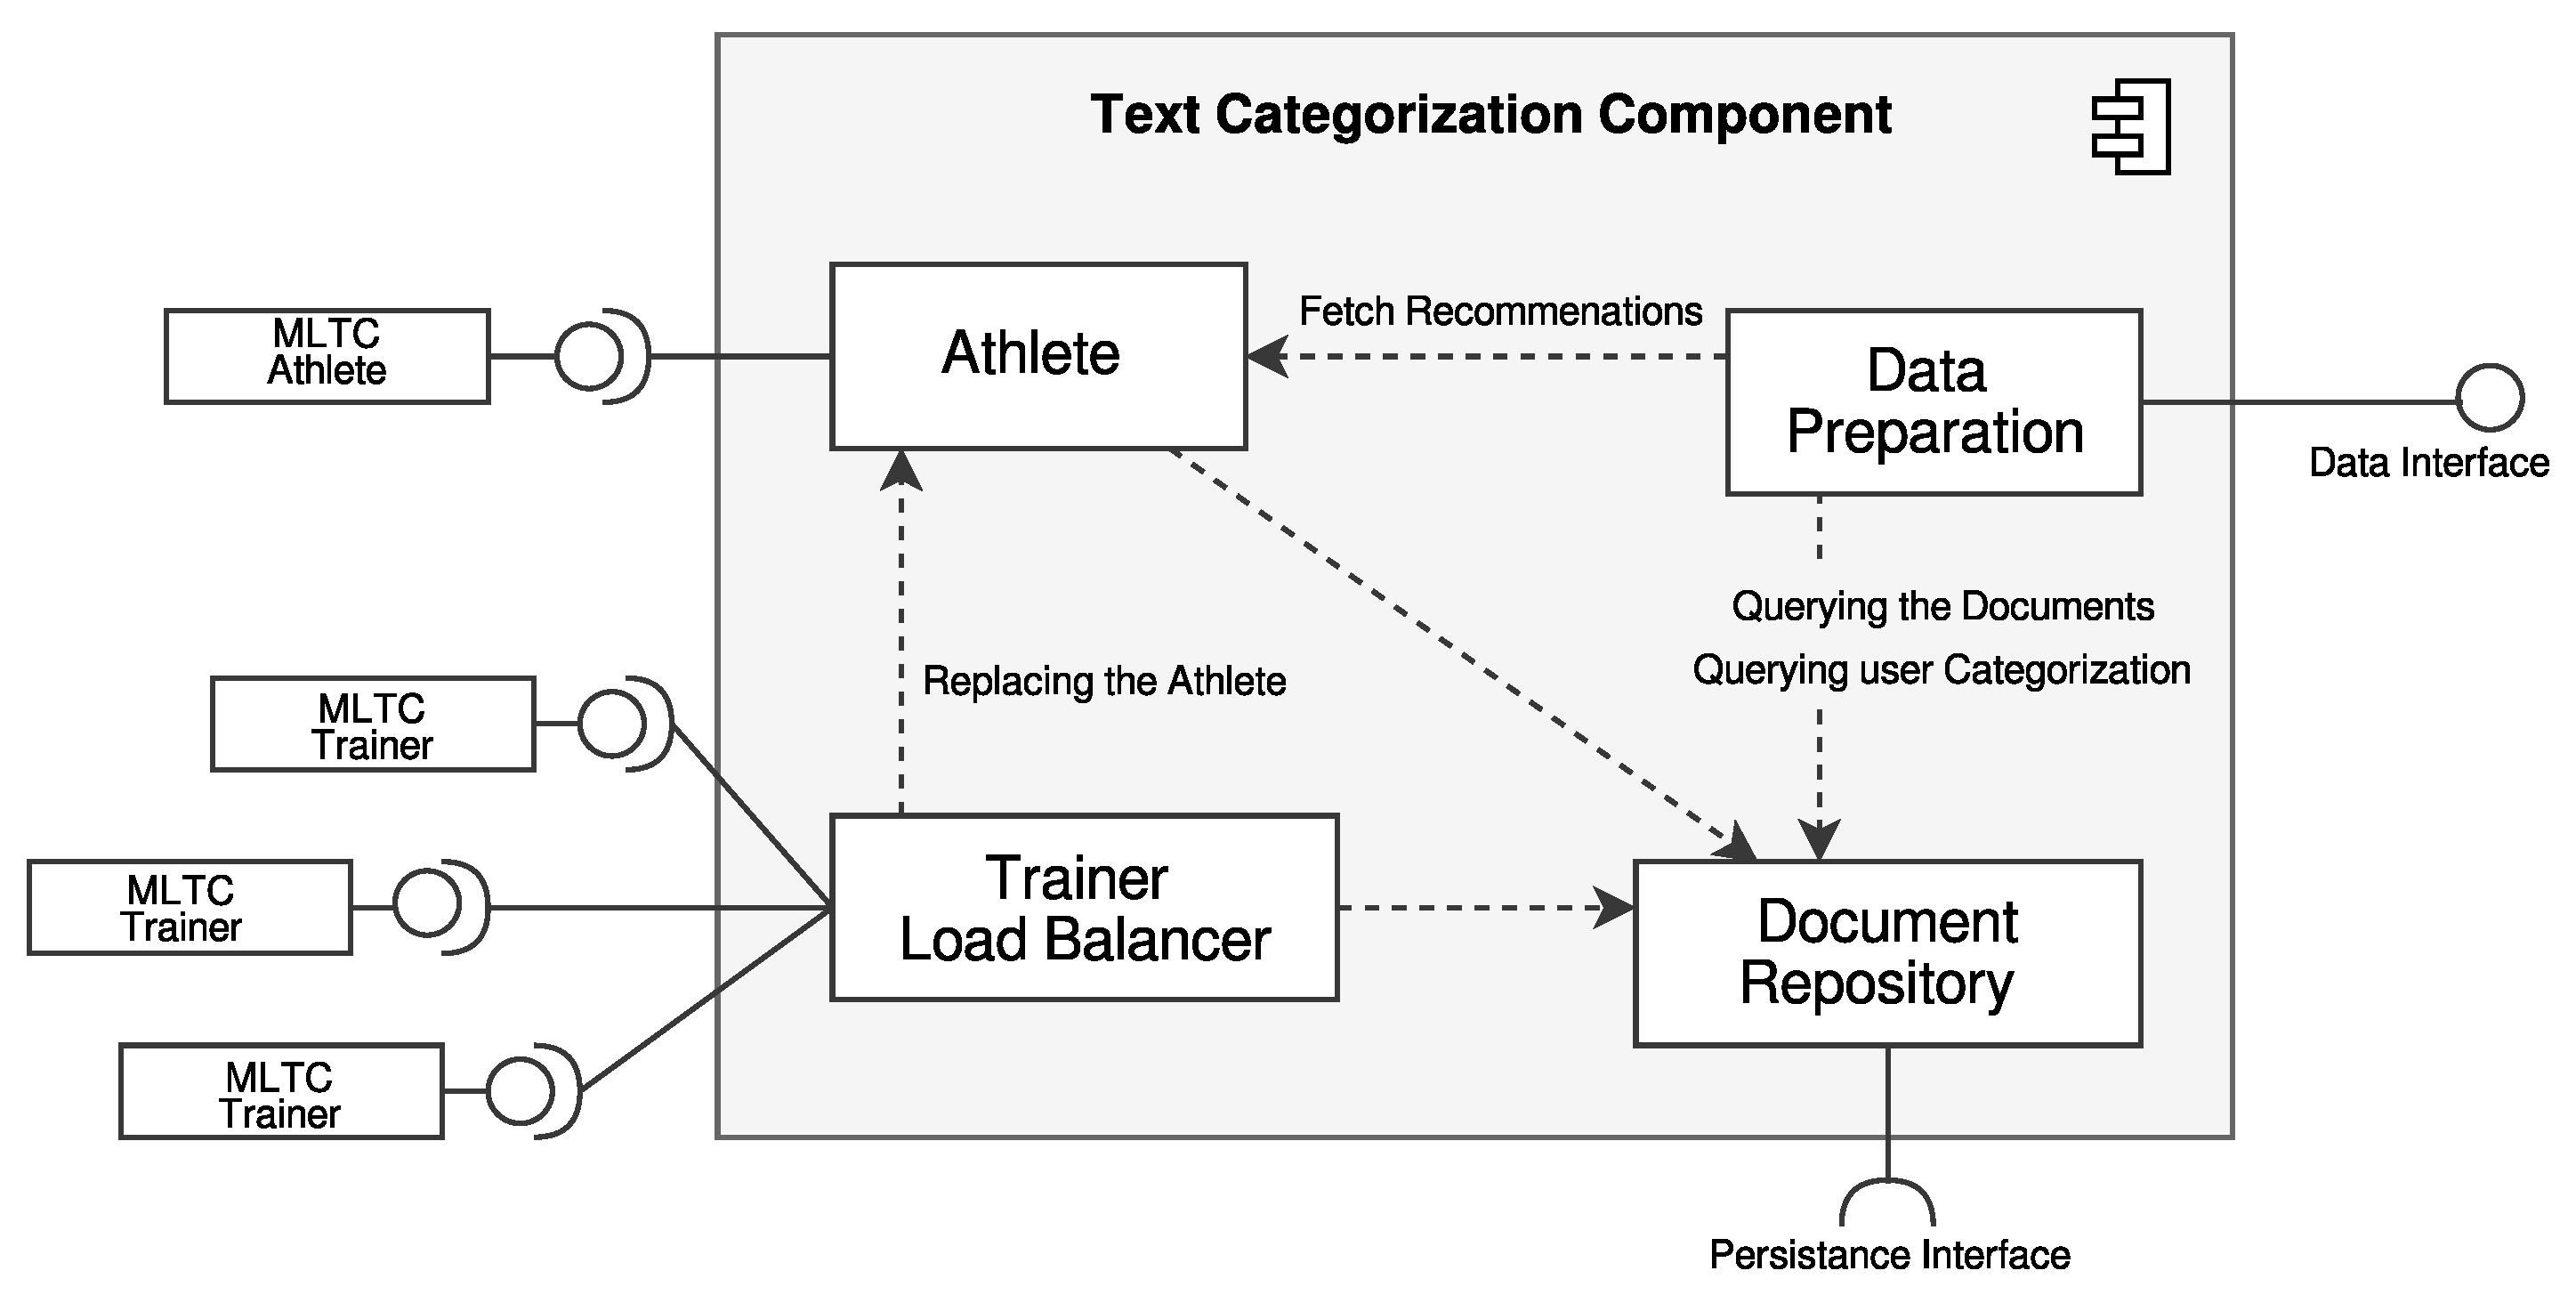
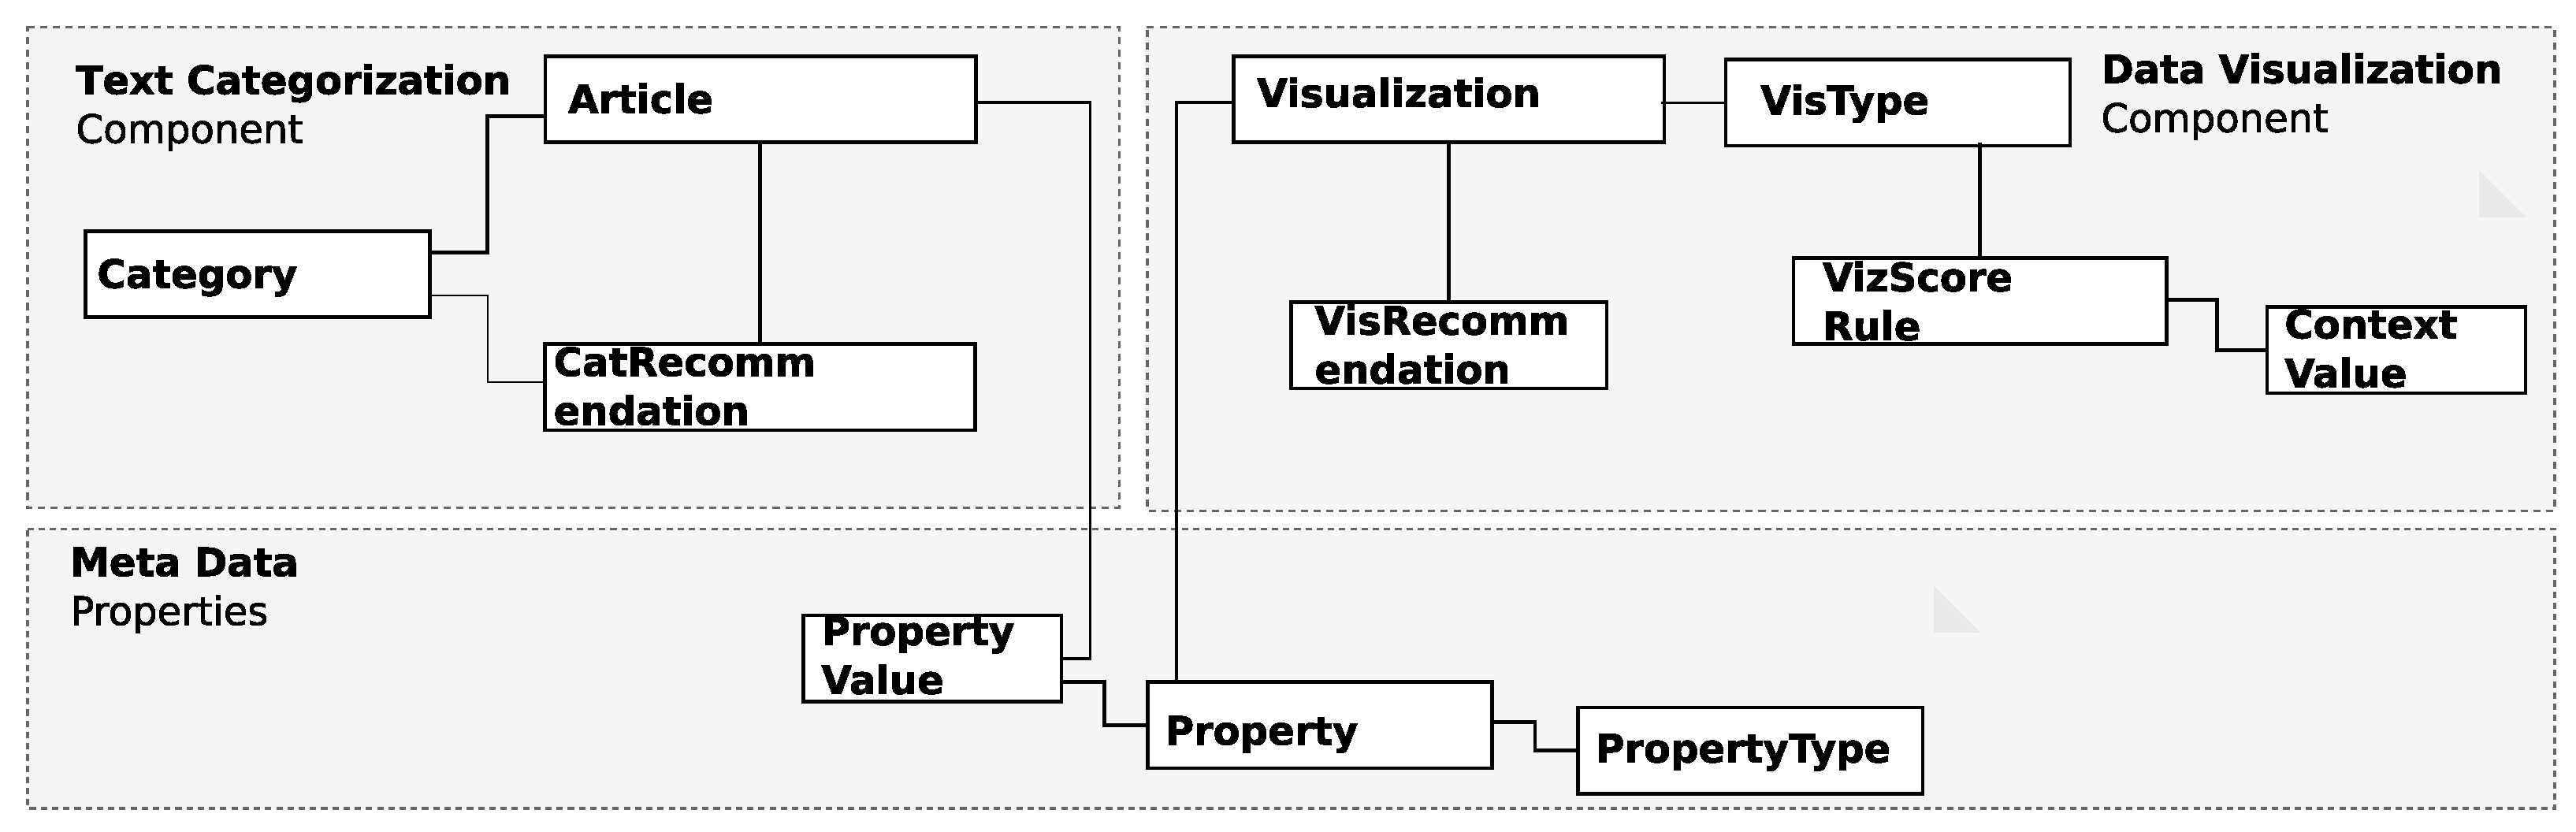
3.2. ML-Based Text Categorization Component

The Text Categorization component consists of a backend and a frontend application. The backend application connects to Eljasik-Swobodas’s MLTC component [9] for providing AI and ML-based category recommendations. Therefore, it implements the concept of trainer and athlete components. A trainer load balancer component connects to several MLTC microservice-based trainers selects the most suitable ML model from these trainers, and forwards it to an athlete component for replacement. The athlete executes this model via an MLTC athlete (also microservice-based) on documents from a document repository and provides generated category recommendations to a data preparation component upon request. The data preparation component collects the recommendations and documents from the document repository and provides them to the user interface. The internal conceptual architecture of this component is shown in Figure 6. When using the MLTC trainer proposed by Eljasik-Swoboda [9], the system cannot generate new categories [9]. This disadvantage is considered because this is not a requirement of qualitative content analysis.
Figure 6 shows that the backend application of the Text Categorization component consumes interfaces from the MLTC trainer and athletes, from persistency and provides an interface to the frontend application (data interface).
The frontend application is structured in a title bar and text categorization-specific content. The title bar displays the name of the current component and the currently logged-in users across all components. The text categorization-specific content is structured into a display of the textual document and a category and AI recommendation pane. The resulting UI and UX concept is displayed in Figure 7.
AI and ML-based recommendations are visualized in Figure 7 via blue highlighting in the category pane and a textual explanation in the AI recommendation pane.

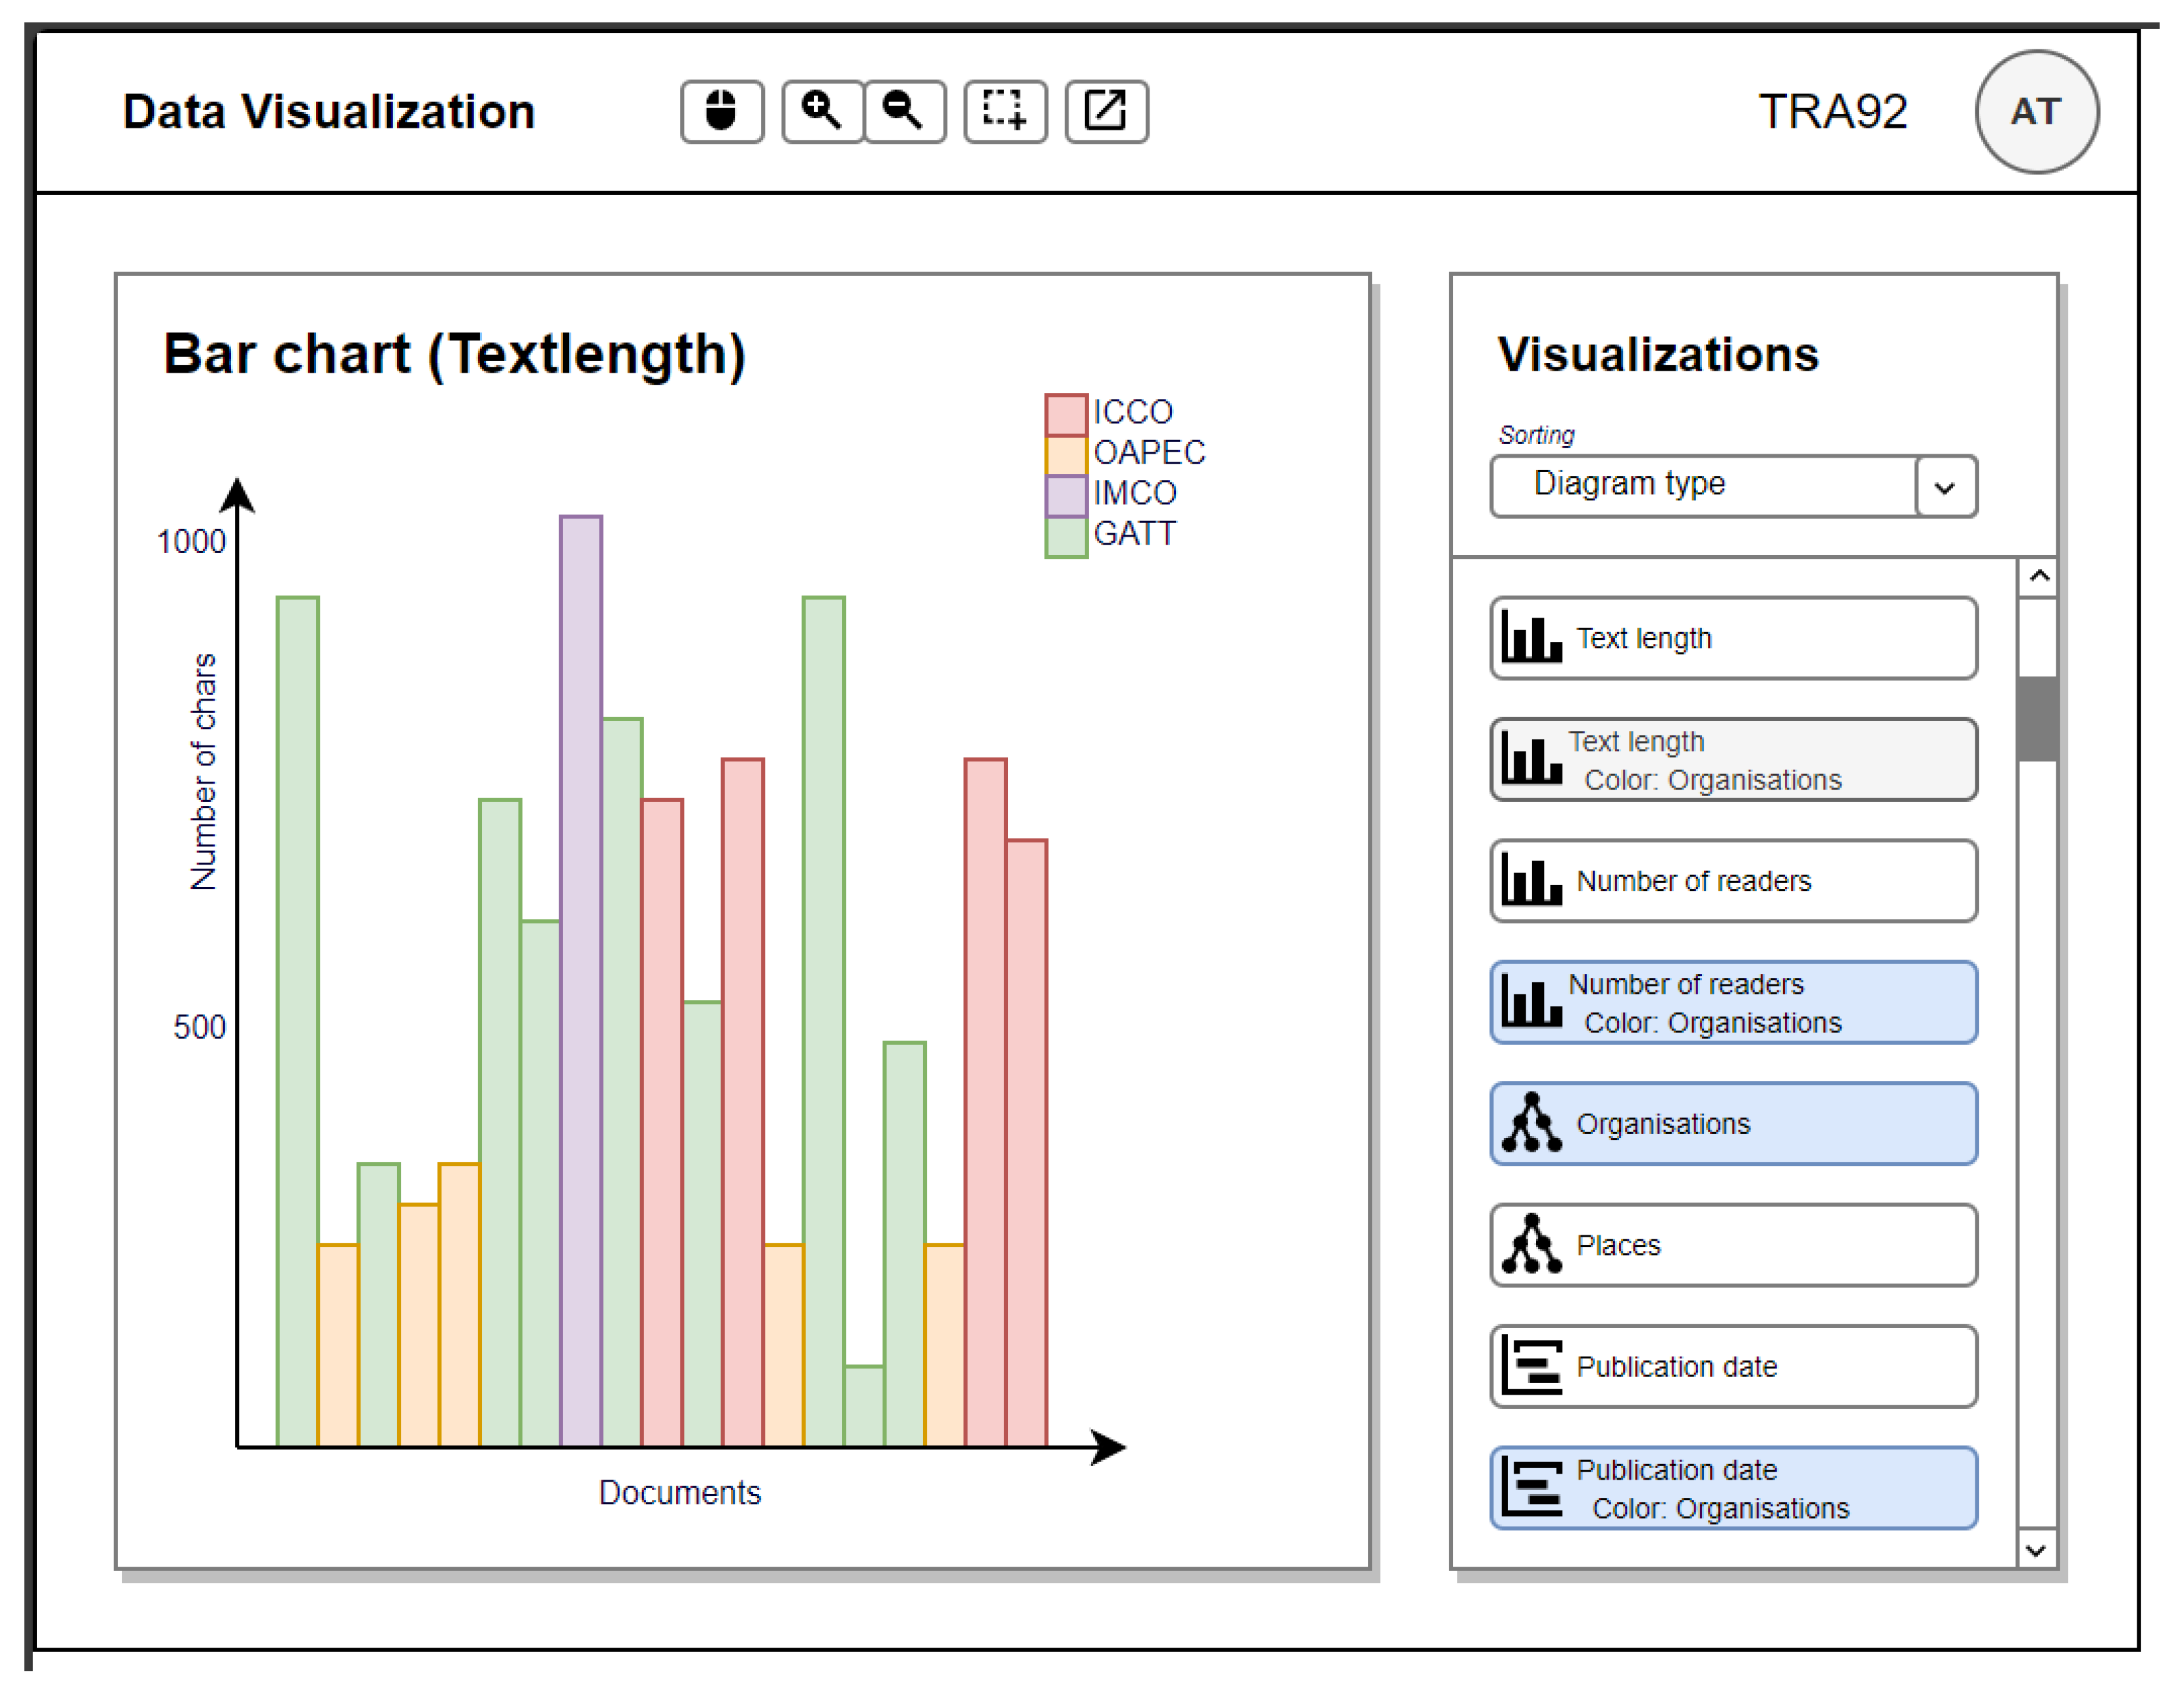
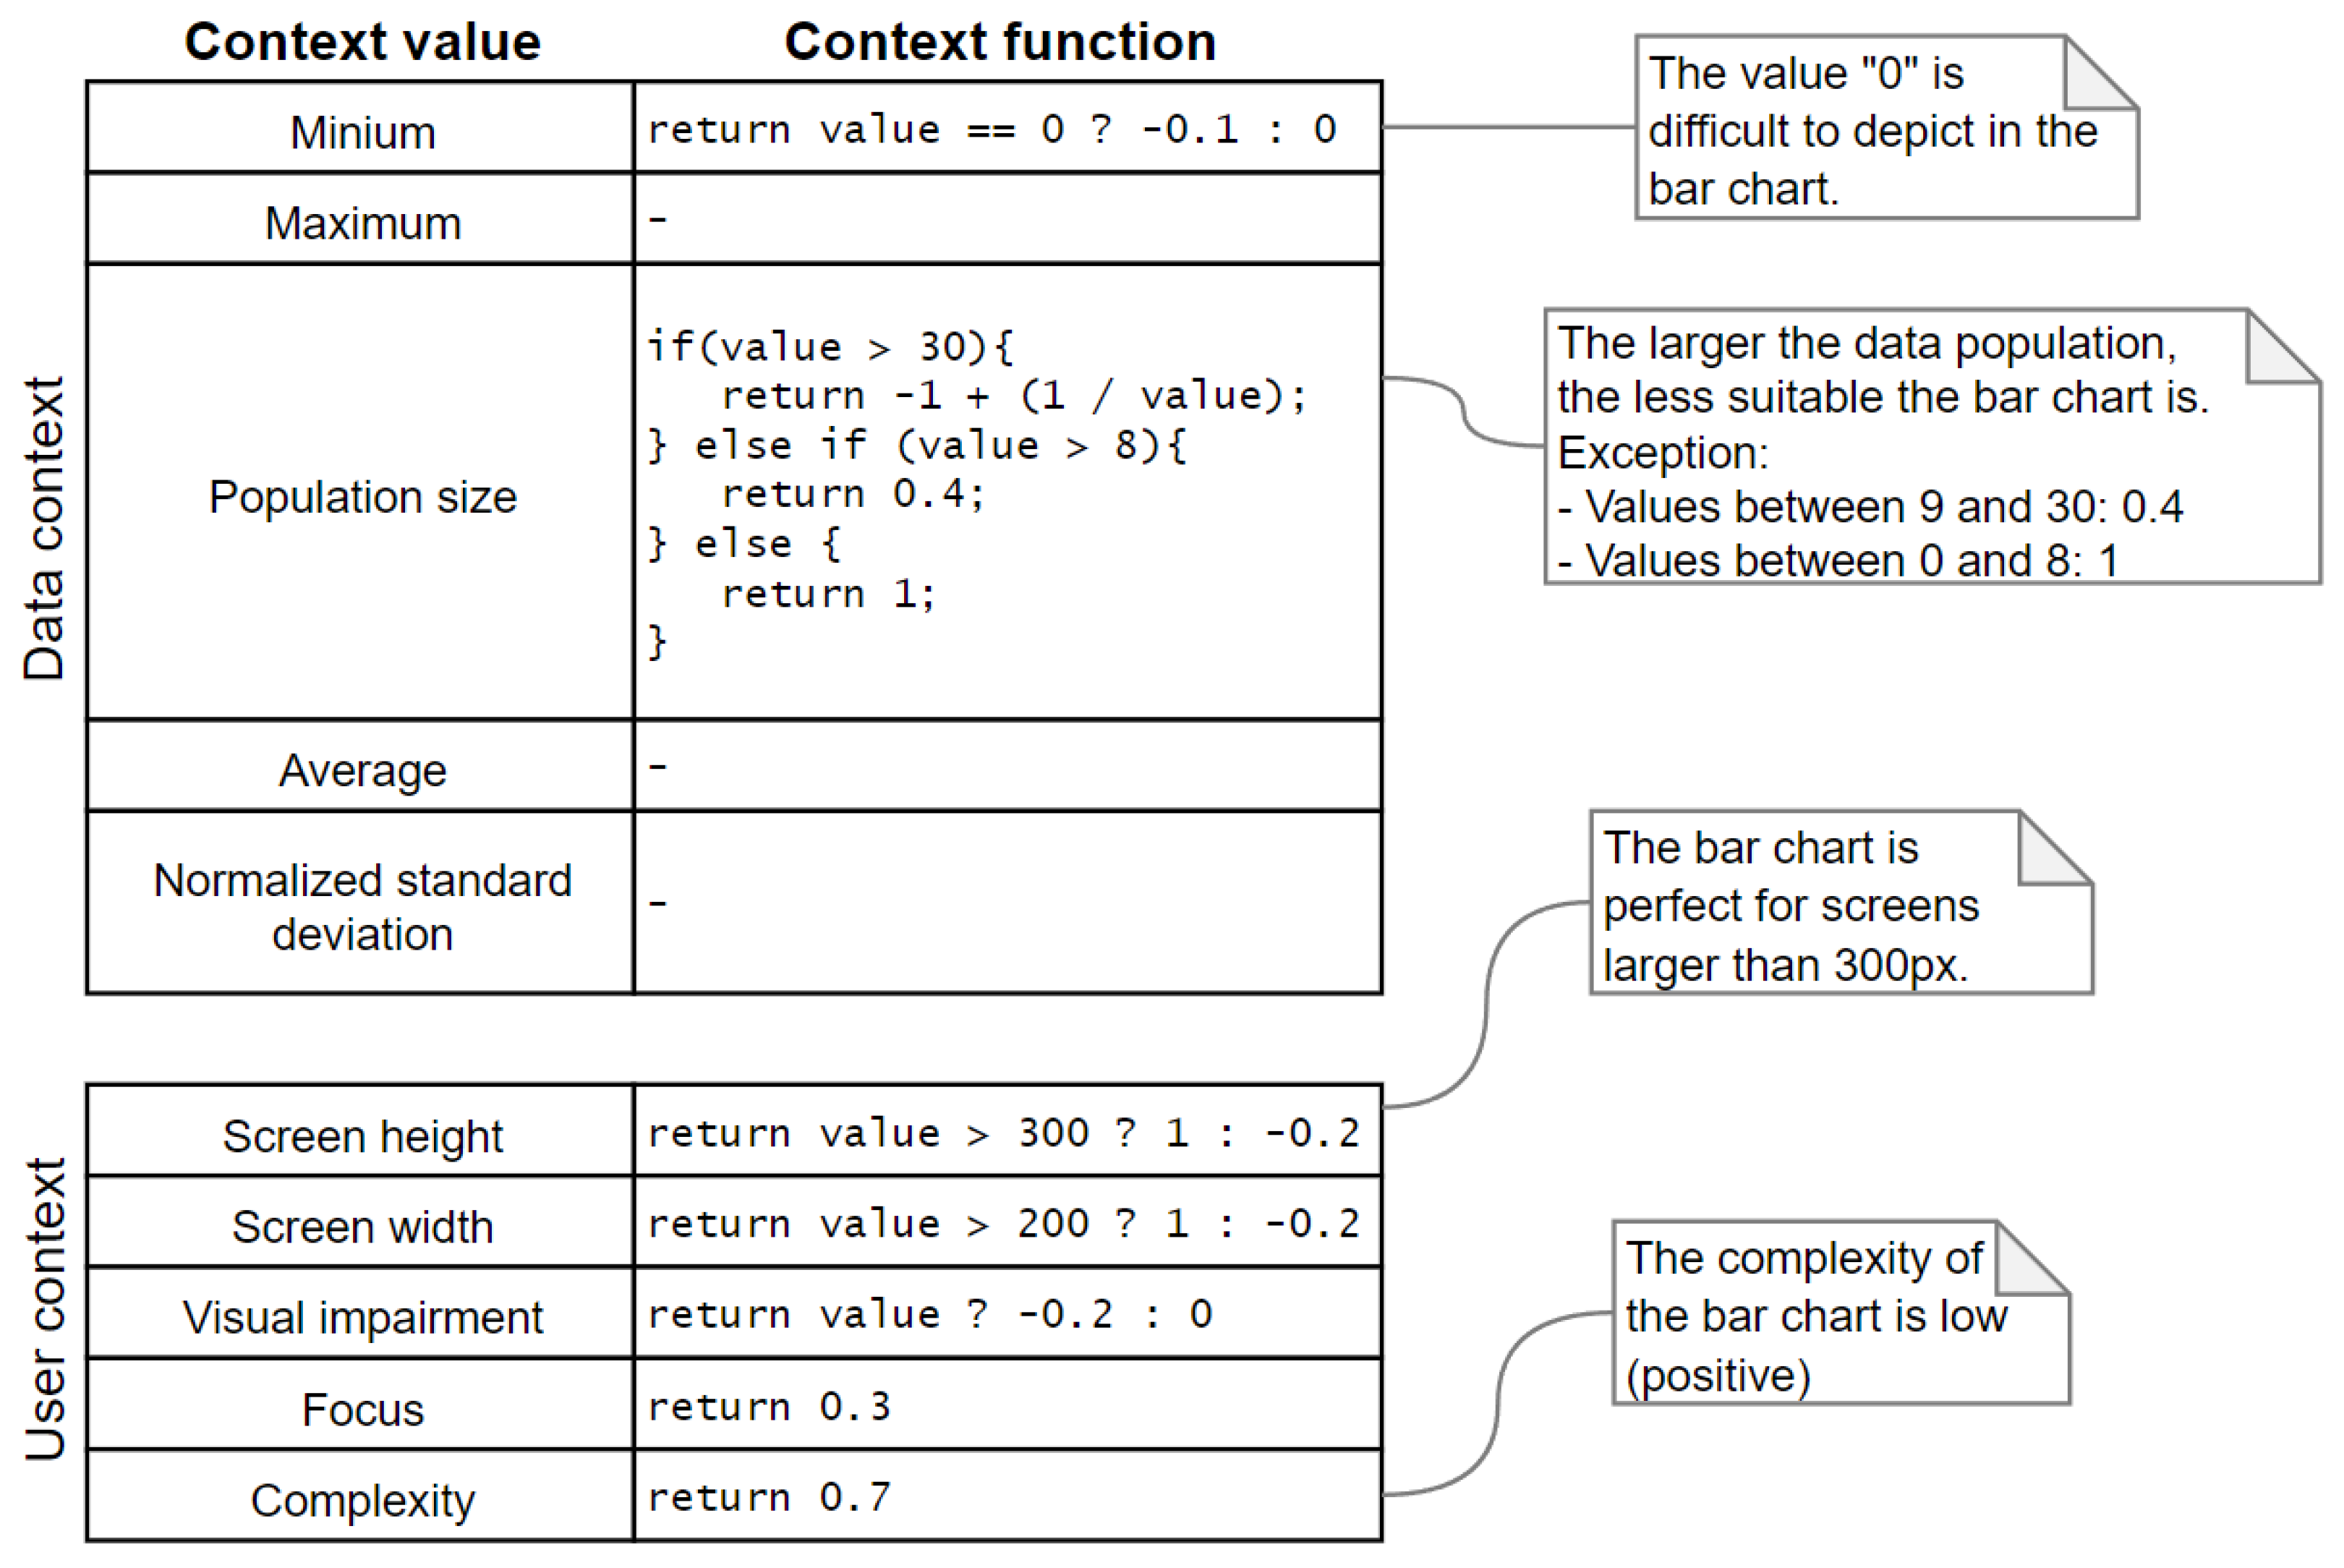
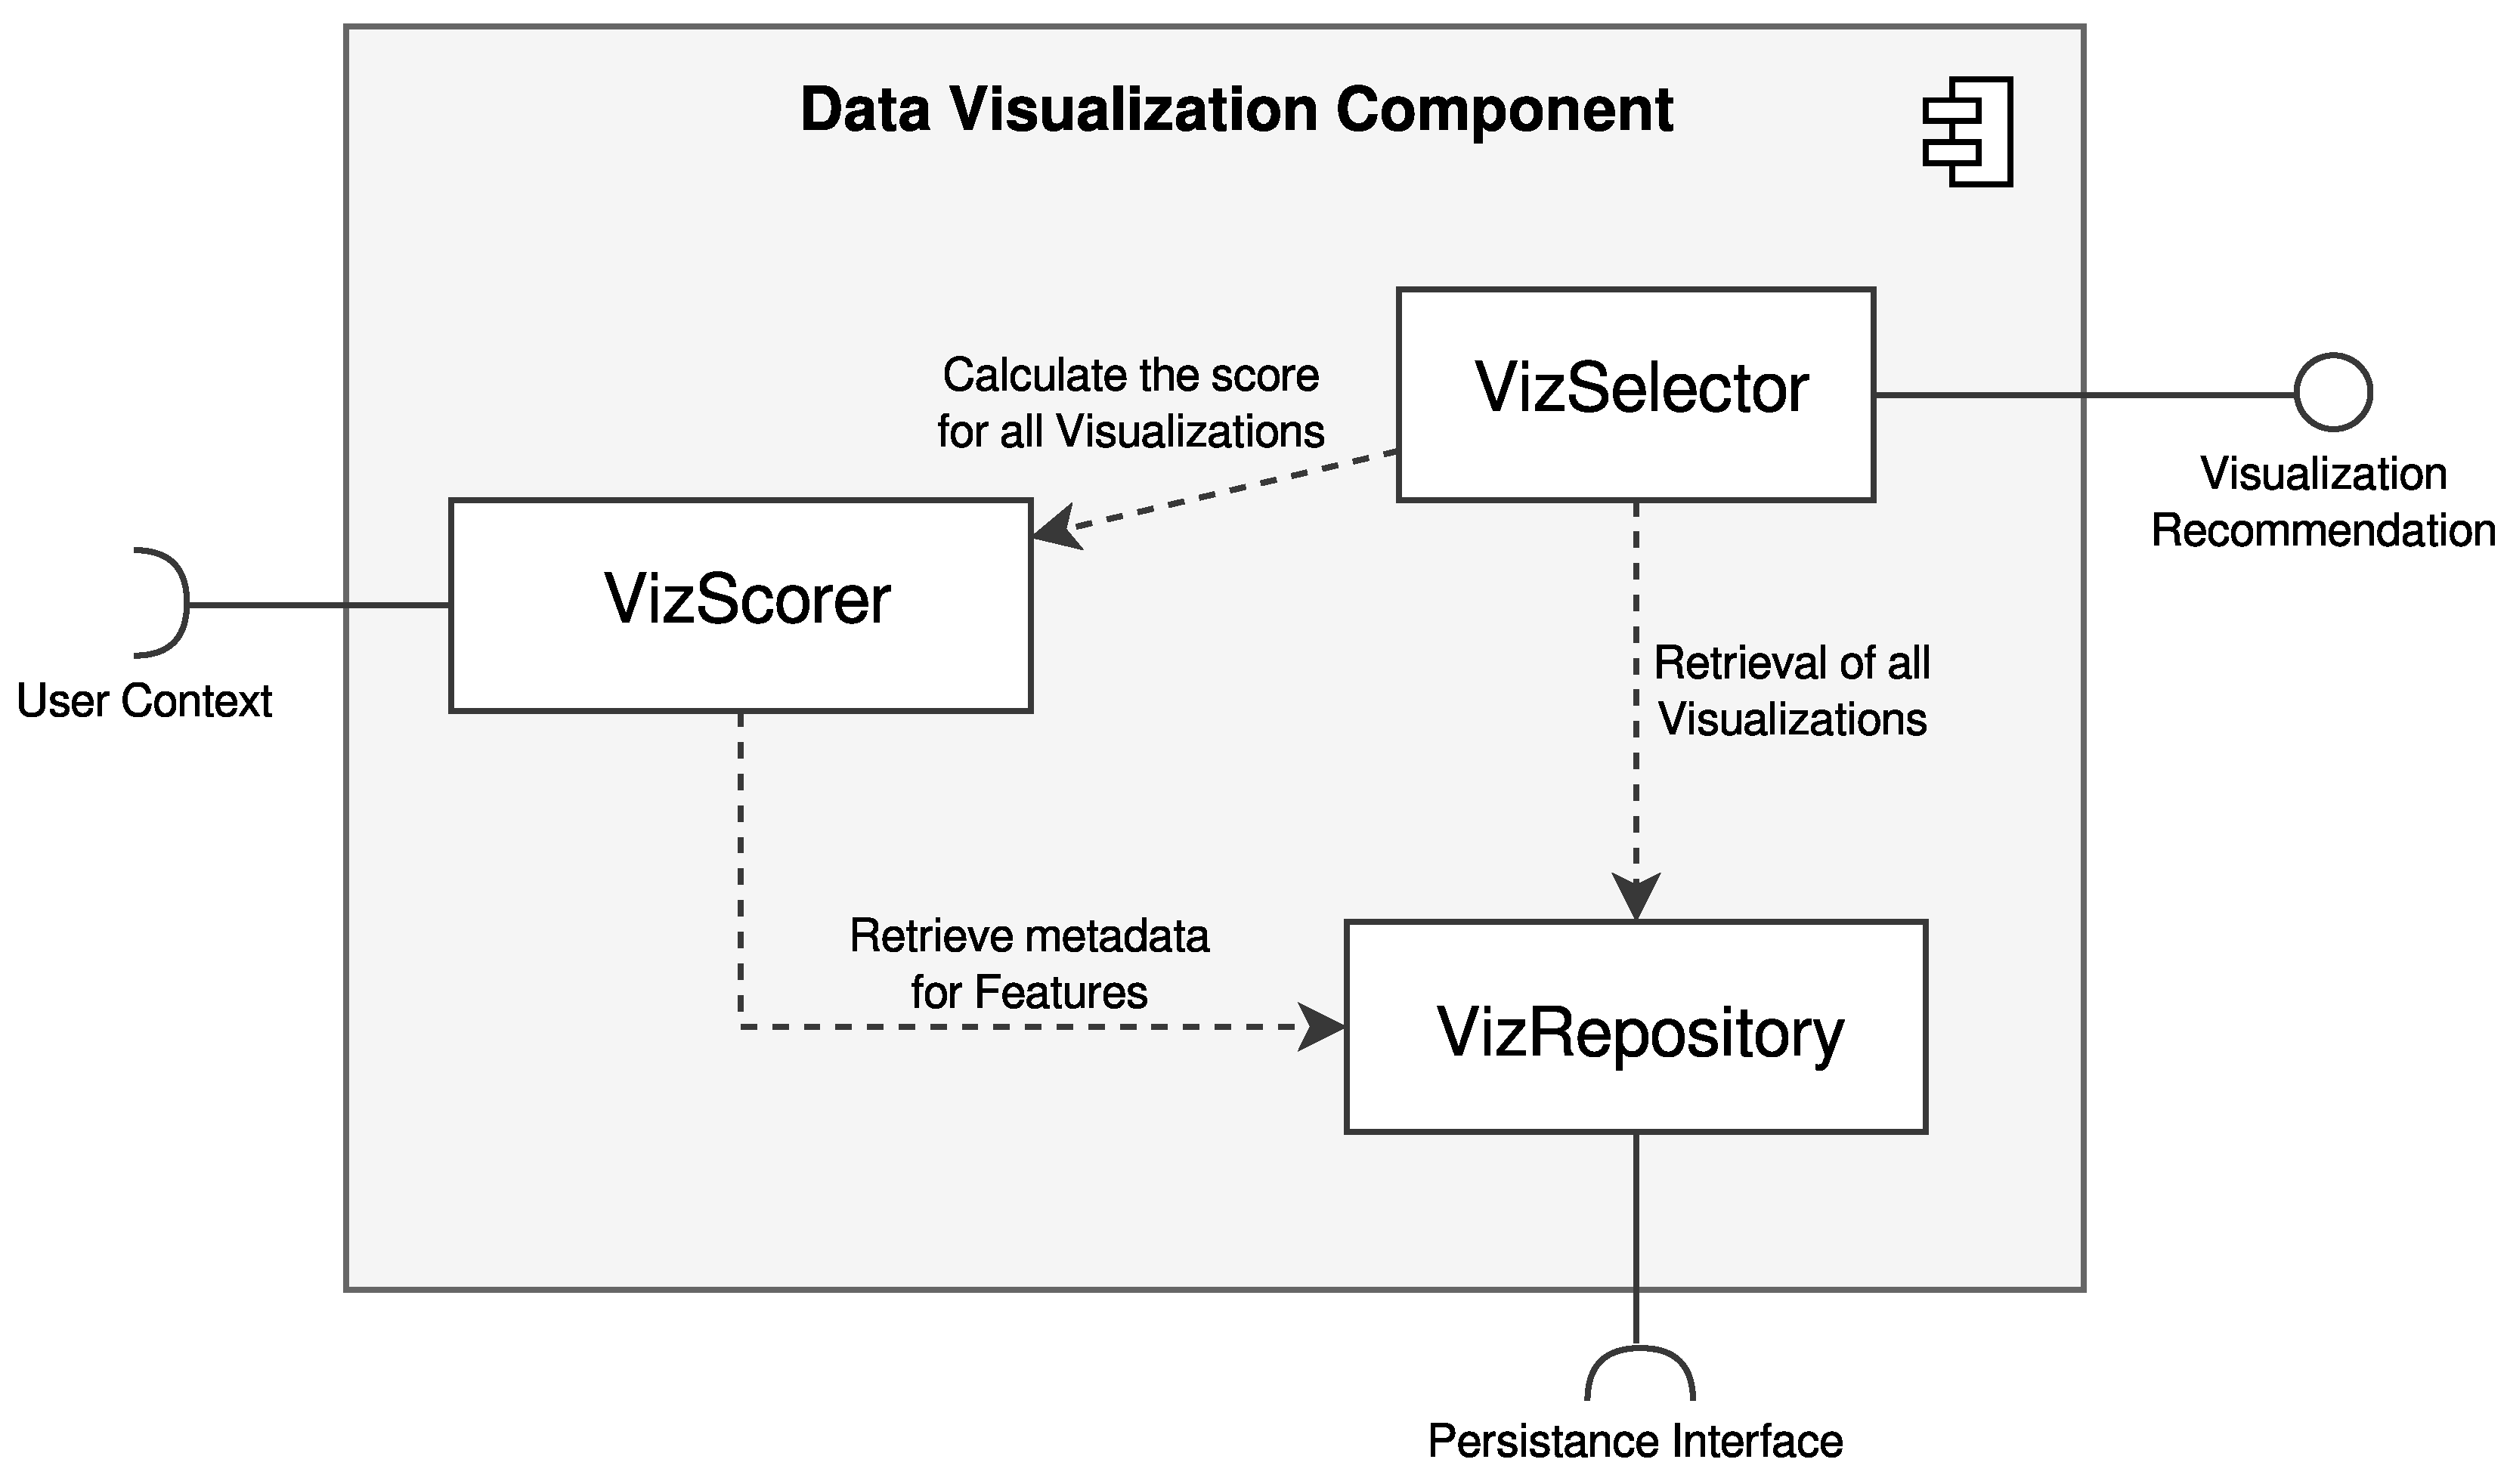
3.3. Expert System-Based Data Visualization Component

The Data Visualization component is also structured into a backend and a frontend application. The backend application is visualized in Figure 8. It consists of three components: a visualization repository, a selector, and a scorer. The repository queries available visualizations from persistency and provides them to the two other components. The selector component is triggered from another component with data that should be visualized. It uses the visualizations from the repository and triggers the visualization scoring component. The scorer component accesses metadata on the repository’s visualizations and context information on the user and its system to determine a score for given data.
The user interface (shown in Figure 9) consists of a title bar, a dashboard pane, and a visualization pane. The title bar displays the component’s name and available tools to interact with the visualizations (e.g., zooming). The dashboard pane contains selected charts (e.g., a bar chart displaying the text length). The visualization pane displays available visualizations. The user can click on the visualizations to select them for display on the dashboard.
Recommendations by the expert system are highlighted via blue background color or sorted as first options (if the user selected AI and ML-based recommendation as sorting criteria in the dropdown menu) as Figure 9 shows.
Figure 10 displays exemplary rules of the expert system for bar charts that determine recommendations for suitable visualizations. These recommendations are created based on data context (e.g., is the input data for visualization suitable for certain visualizations) and user context (e.g., screen height). Similar rules are defined for every available visualization type in the information system. These rules calculate a “fitness score” for each visualization type by accumulating the results for all data and user context values. The rules have been determined by reusing existing heuristics or measuring user behavior in a prototype implementation. This approach is limited by the ability of a human expert to balance the different context functions with the different visualization types. We found a good balance with six visualization types and seven context functions.

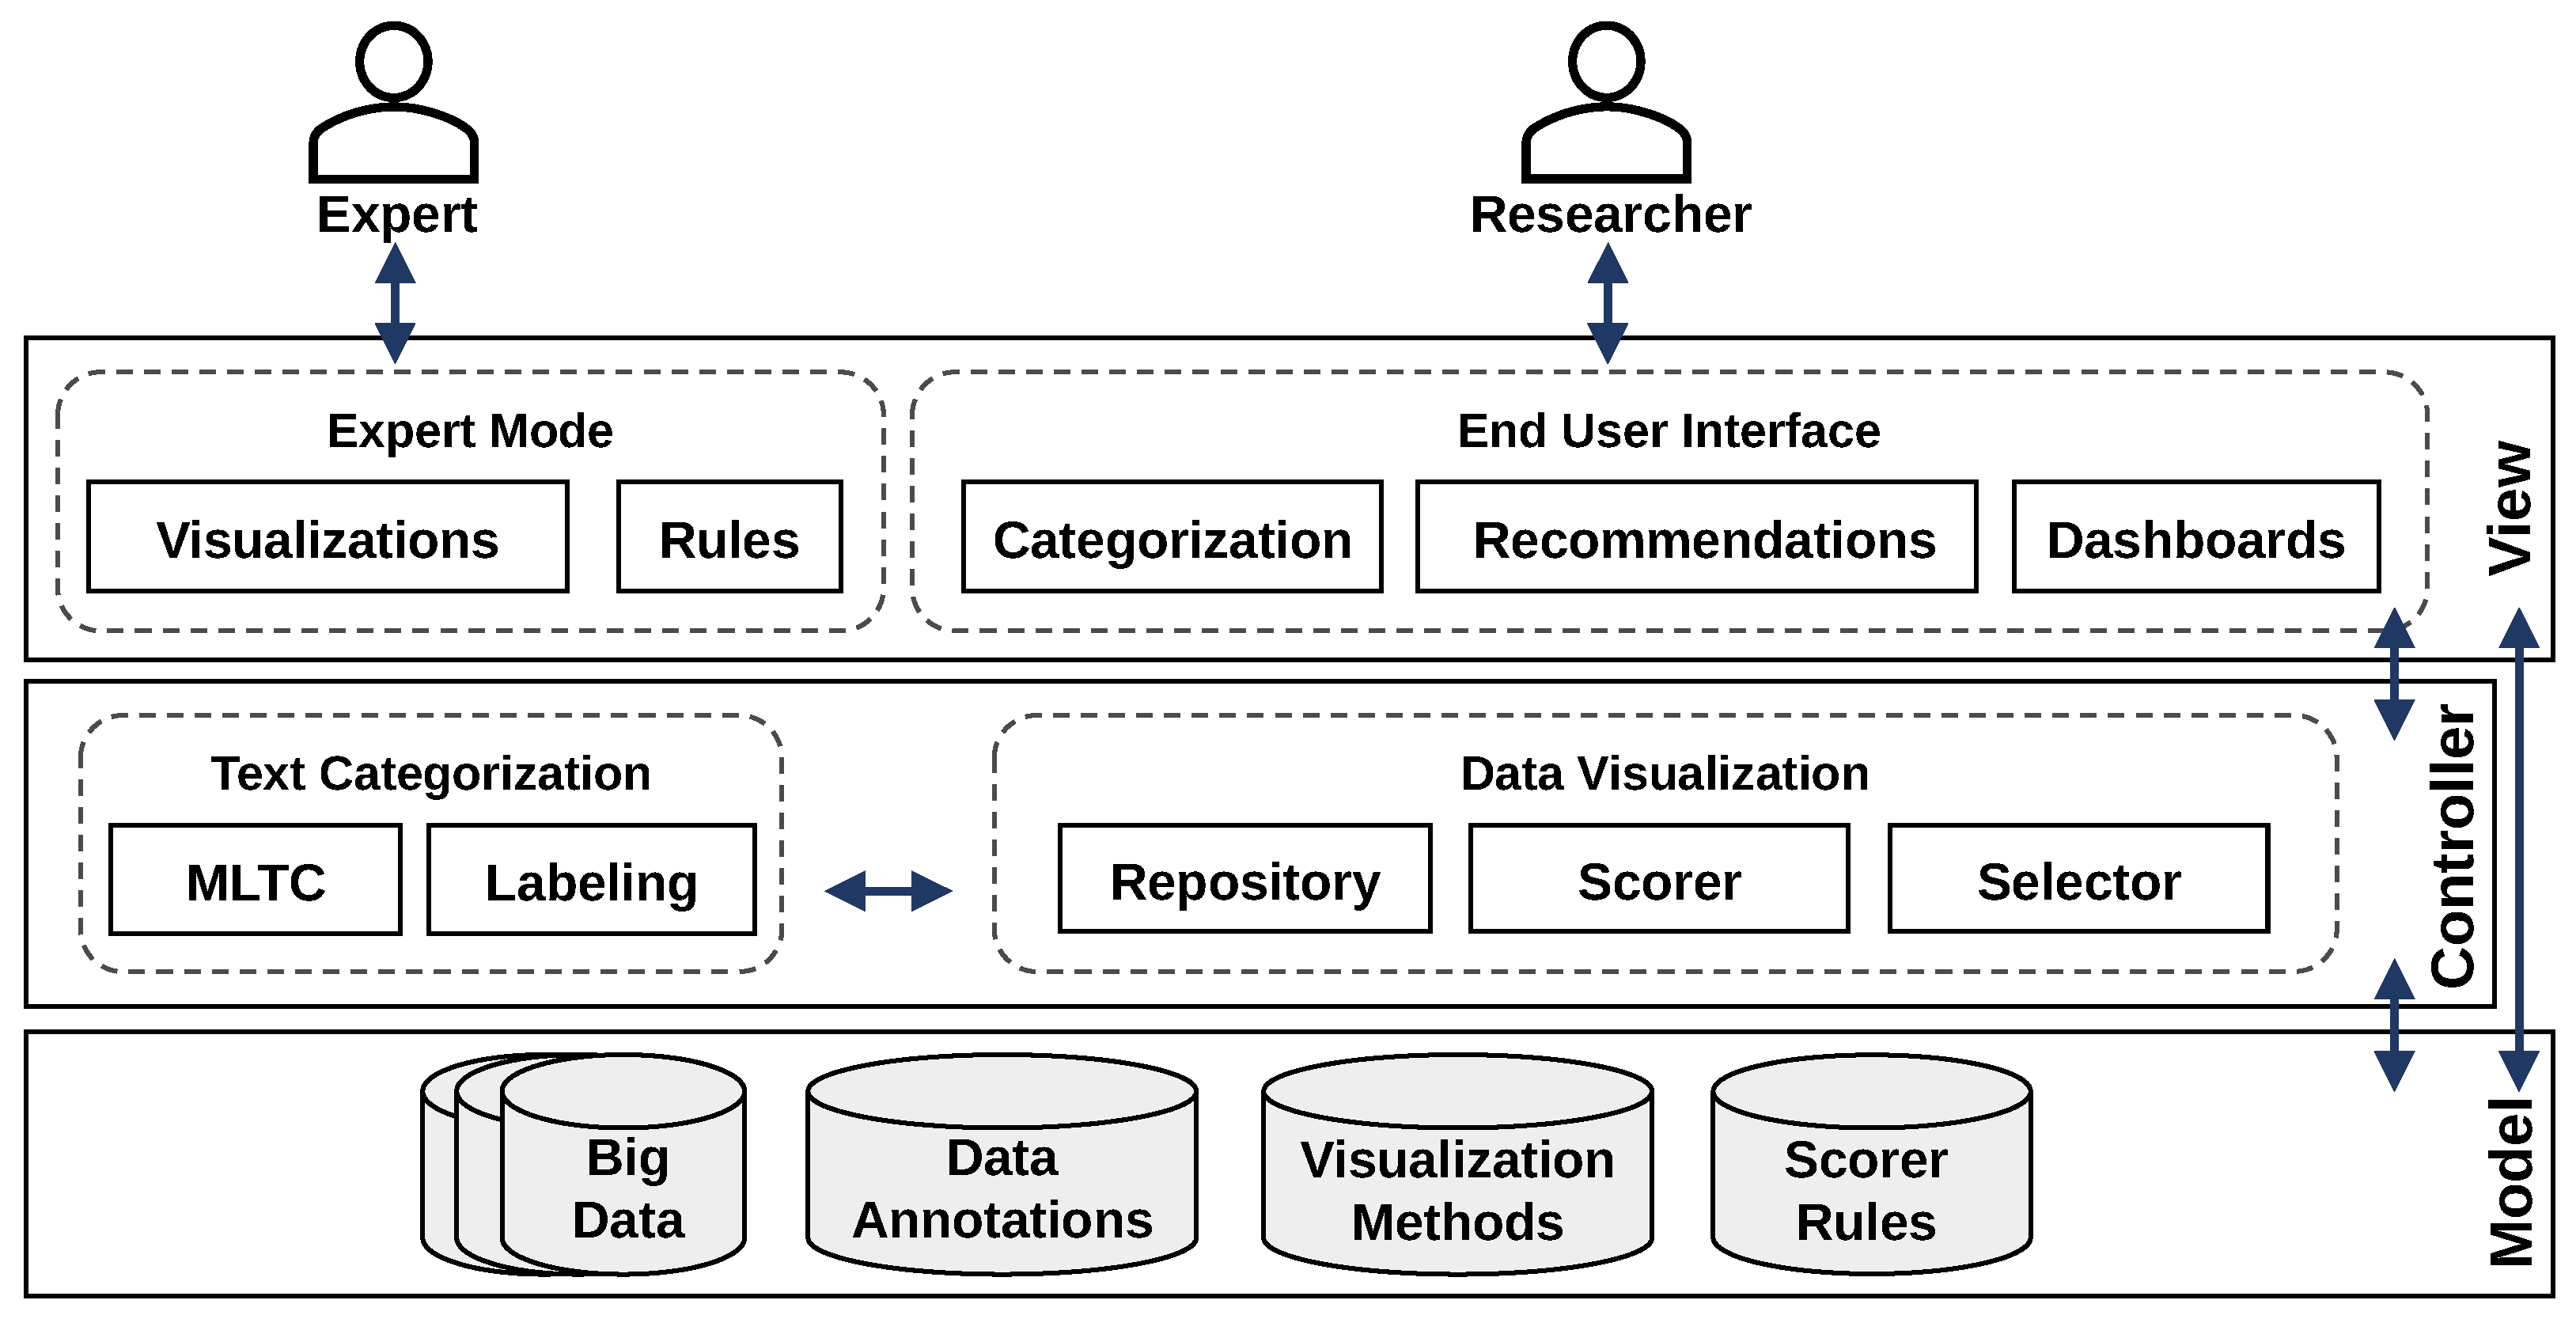
3.4. Conceptual Architecture

The conceptual architecture of the information system is shown in Figure 11. It shows two different views within the view layer of the architecture: an expert mode to add new visualizations and rules to the system and an end user interface with the frontend components for text categorization and data visualization. The controller contains the components introduced in the previous sub-sections. The model layer contains the symbolic data (Big Data), annotations (categories), visualization methods, and rules for the expert system.
The system’s data model is shown in Figure 12. It contains 11 entities across three components: text categorization, data visualization, and a connecting metadata component. It displays that each article can be assigned to one category (direct relationship) and associated with a category via a category recommendation (indirect relationship). For visualizations, the same pattern is repeated and extended on visualization score rules and their content value (refer to Figure 10). The metadata connects articles and visualizations.

3.5. Discussion and Remaining Challenges

Since this work strictly follows the UCD development paradigm, this section commenced with modeling the use context of expert and end users in the target application domain. Following the modeled use cases, two-component architectures and one conceptual system architecture were derived, including UI/UX concepts and a data model. The immediate next step (presented in the next sections) will be the prototypical implementation and evaluation of these concepts.

4. Proof-of-Concept Implementation

This section describes the implementation of a proof-of-concept prototype for the created conceptual modeling. Initially, the technical architecture of the prototype is outlined, encompassing the choice of appropriate technologies for both backend and frontend development. Subsequent subsections concentrate on realizing the Text Categorization and Data Visualization components. The concluding subsection discusses the remaining challenges in the implementation process.

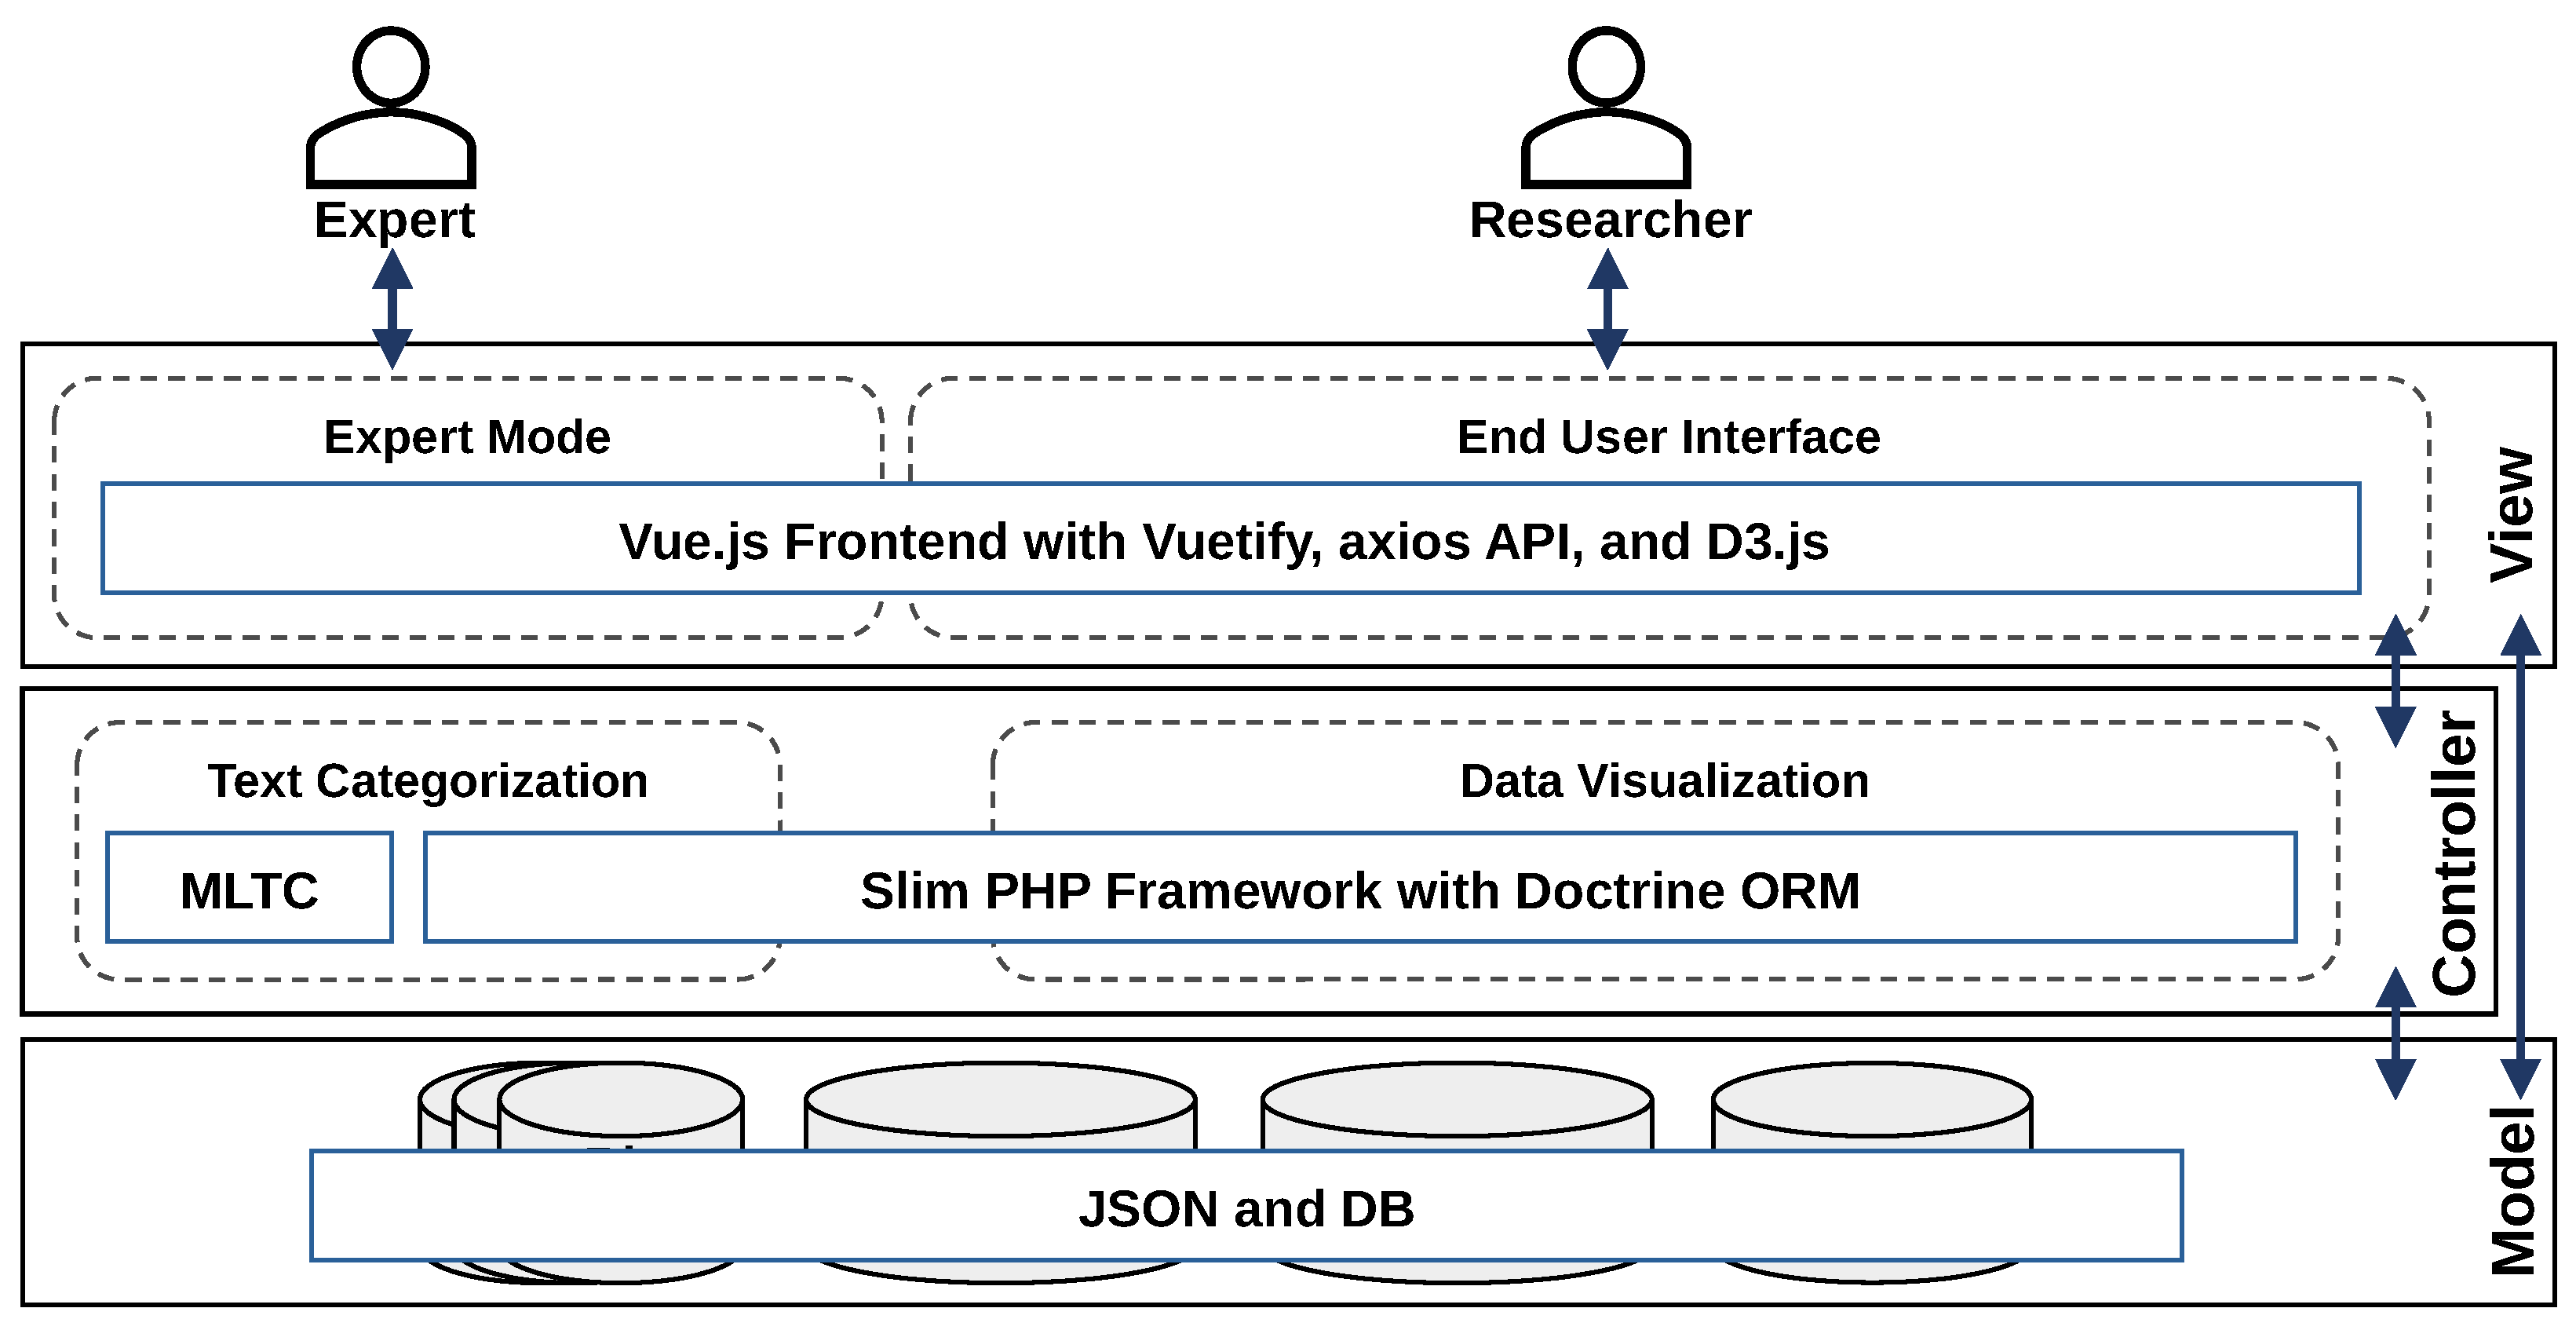
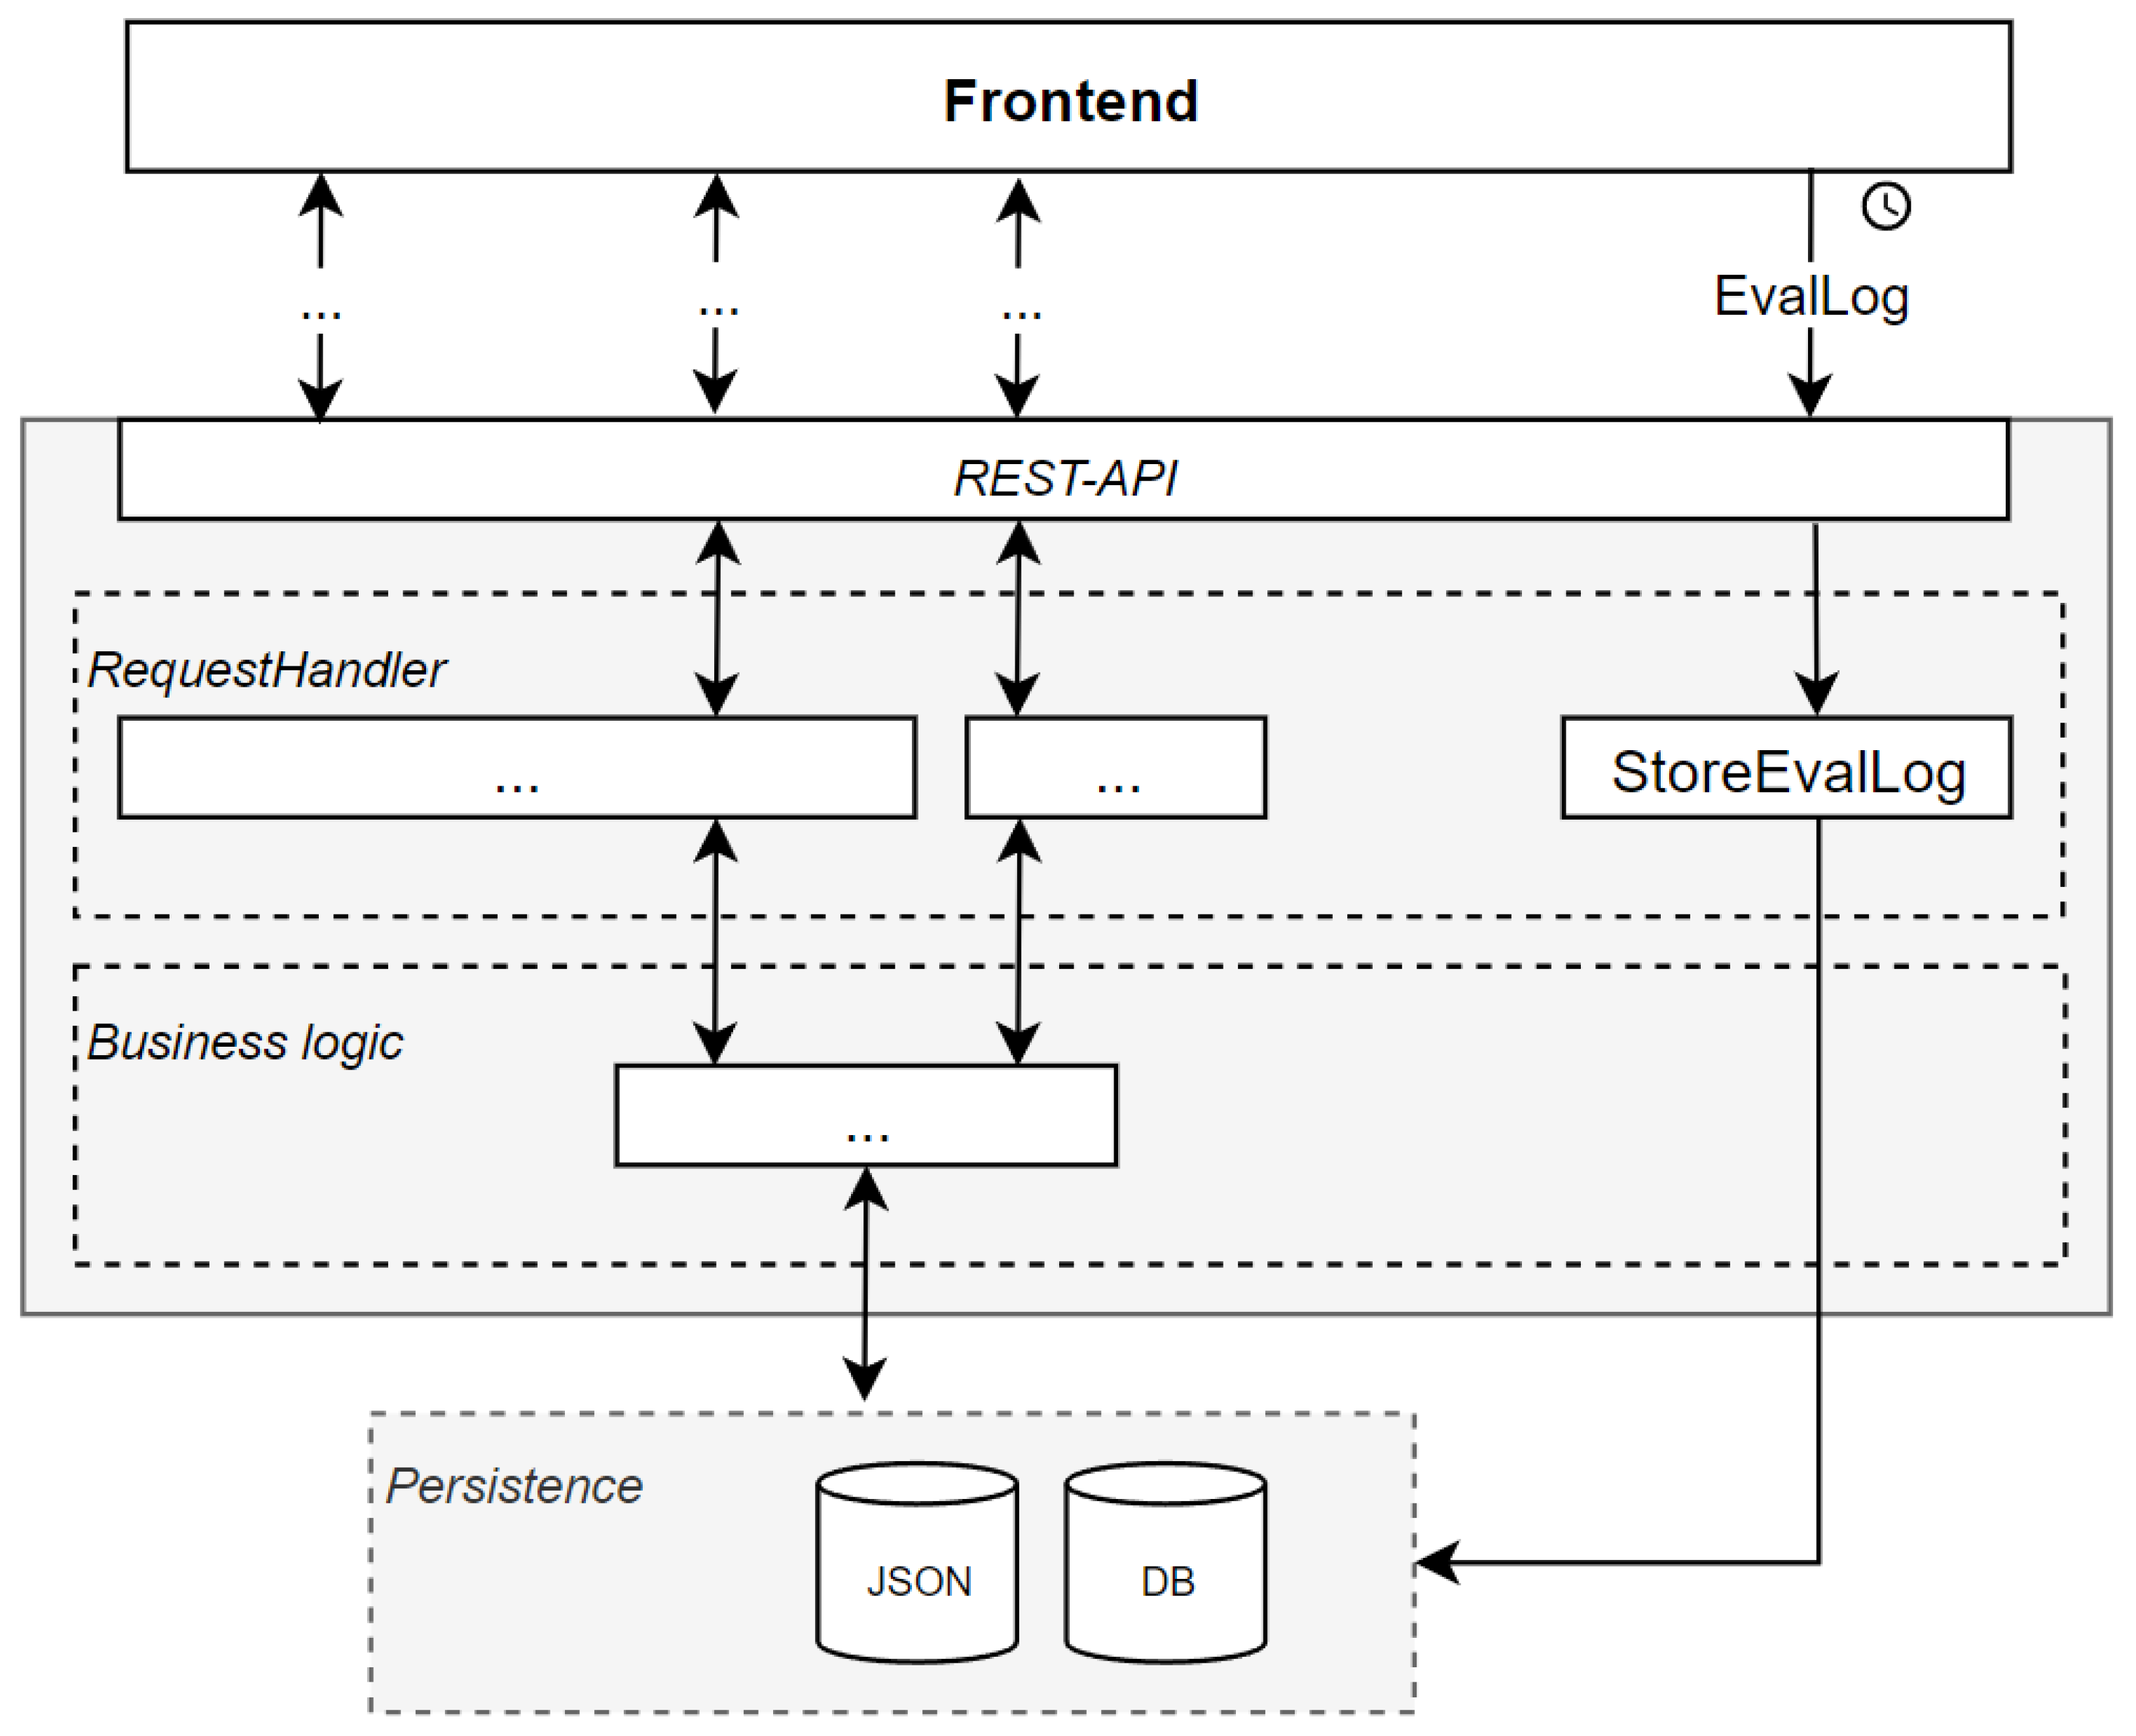
4.1. Technical Architecture

A primary goal for the prototype is to implement the necessary features, coupled with the need for real-time interpretation and execution of the defined VizScorer rules in JSON format. Consequently, the backend is developed in PHP, which enables this real-time interpretation. The frontend demands a rapid and uncomplicated design to facilitate user interaction. This requirement aligns with adopting the Vuetify library (https://vuetifyjs.com/en/, (accessed on 10 January 2024)), which extends Vue.js with a comprehensive set of commonly used design components for modern information systems. The chosen technology is visualized in Figure 13.
The implemented communication architecture of the prototype is depicted in Figure 14. The frontend communicates with the backend through HTTP requests via a REST API. Within the backend, a request handler processes the incoming requests, facilitating input validation and interaction with the business logic, retrieving data from the persistence layer.
A notable feature of the communication architecture in Figure 14 is the EvalLog, designed to track and log every user interaction with the frontend. This capability allows for the reproduction of user behavior. The recorded data is transmitted and stored in the backend through the REST API, ultimately stored in the database. This logging mechanism plays a pivotal role in generating metrics for evaluation purposes.

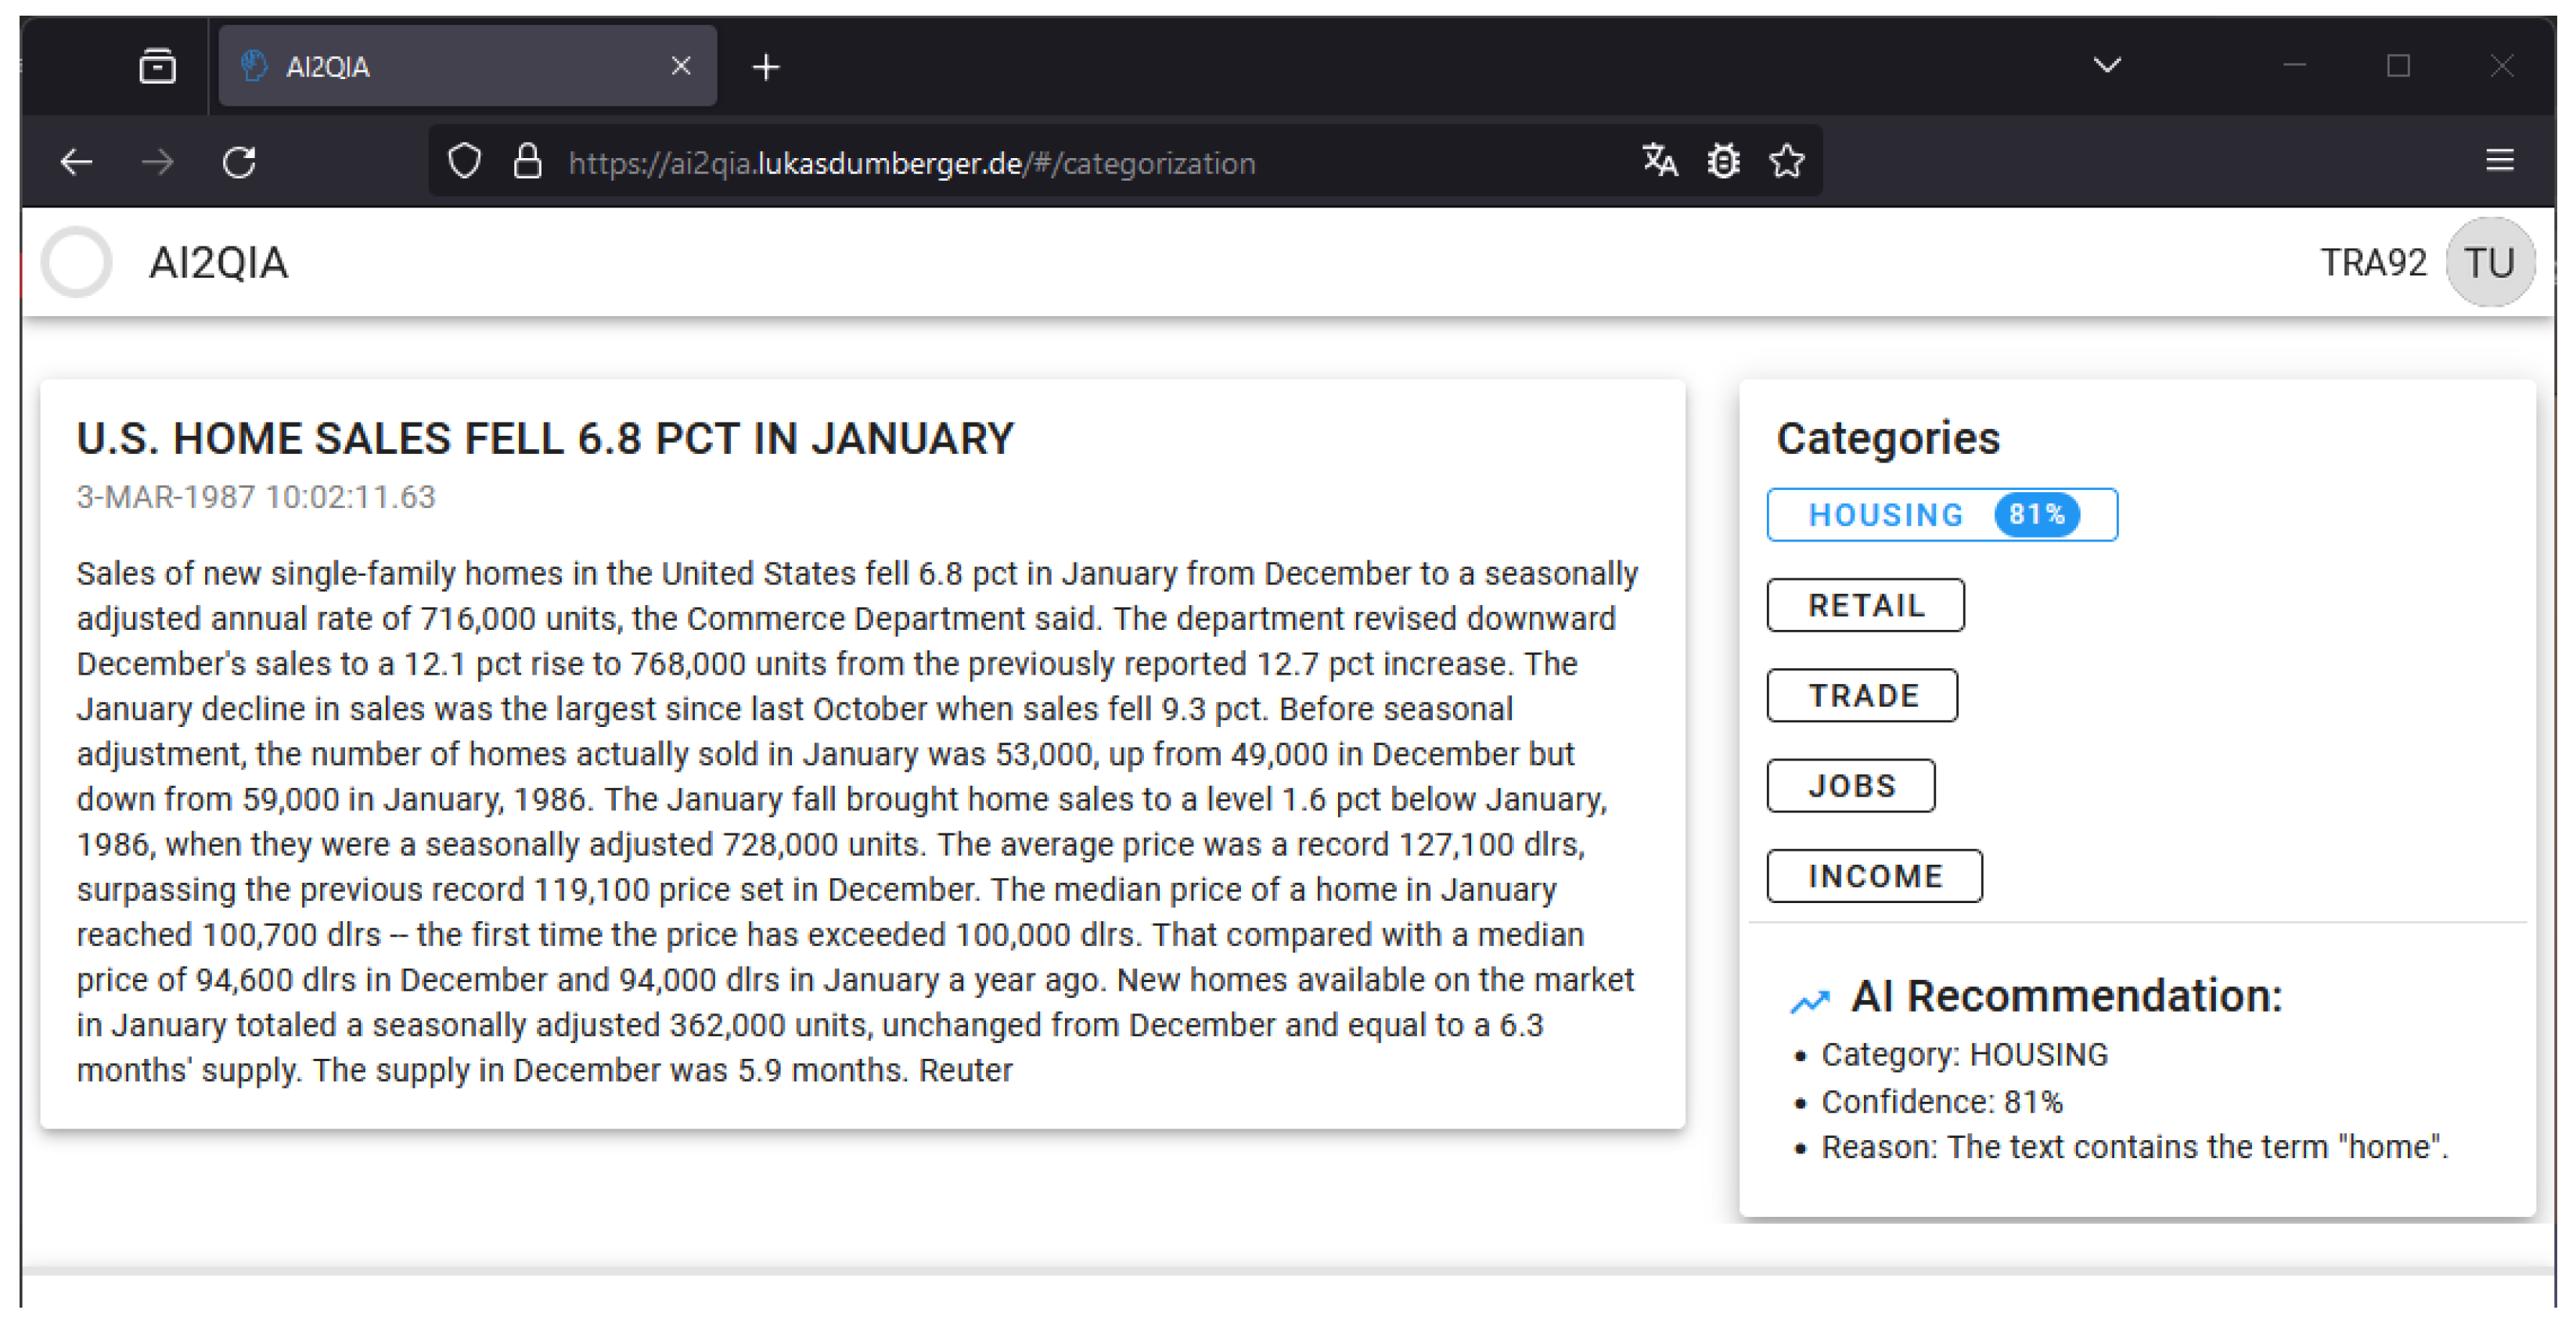
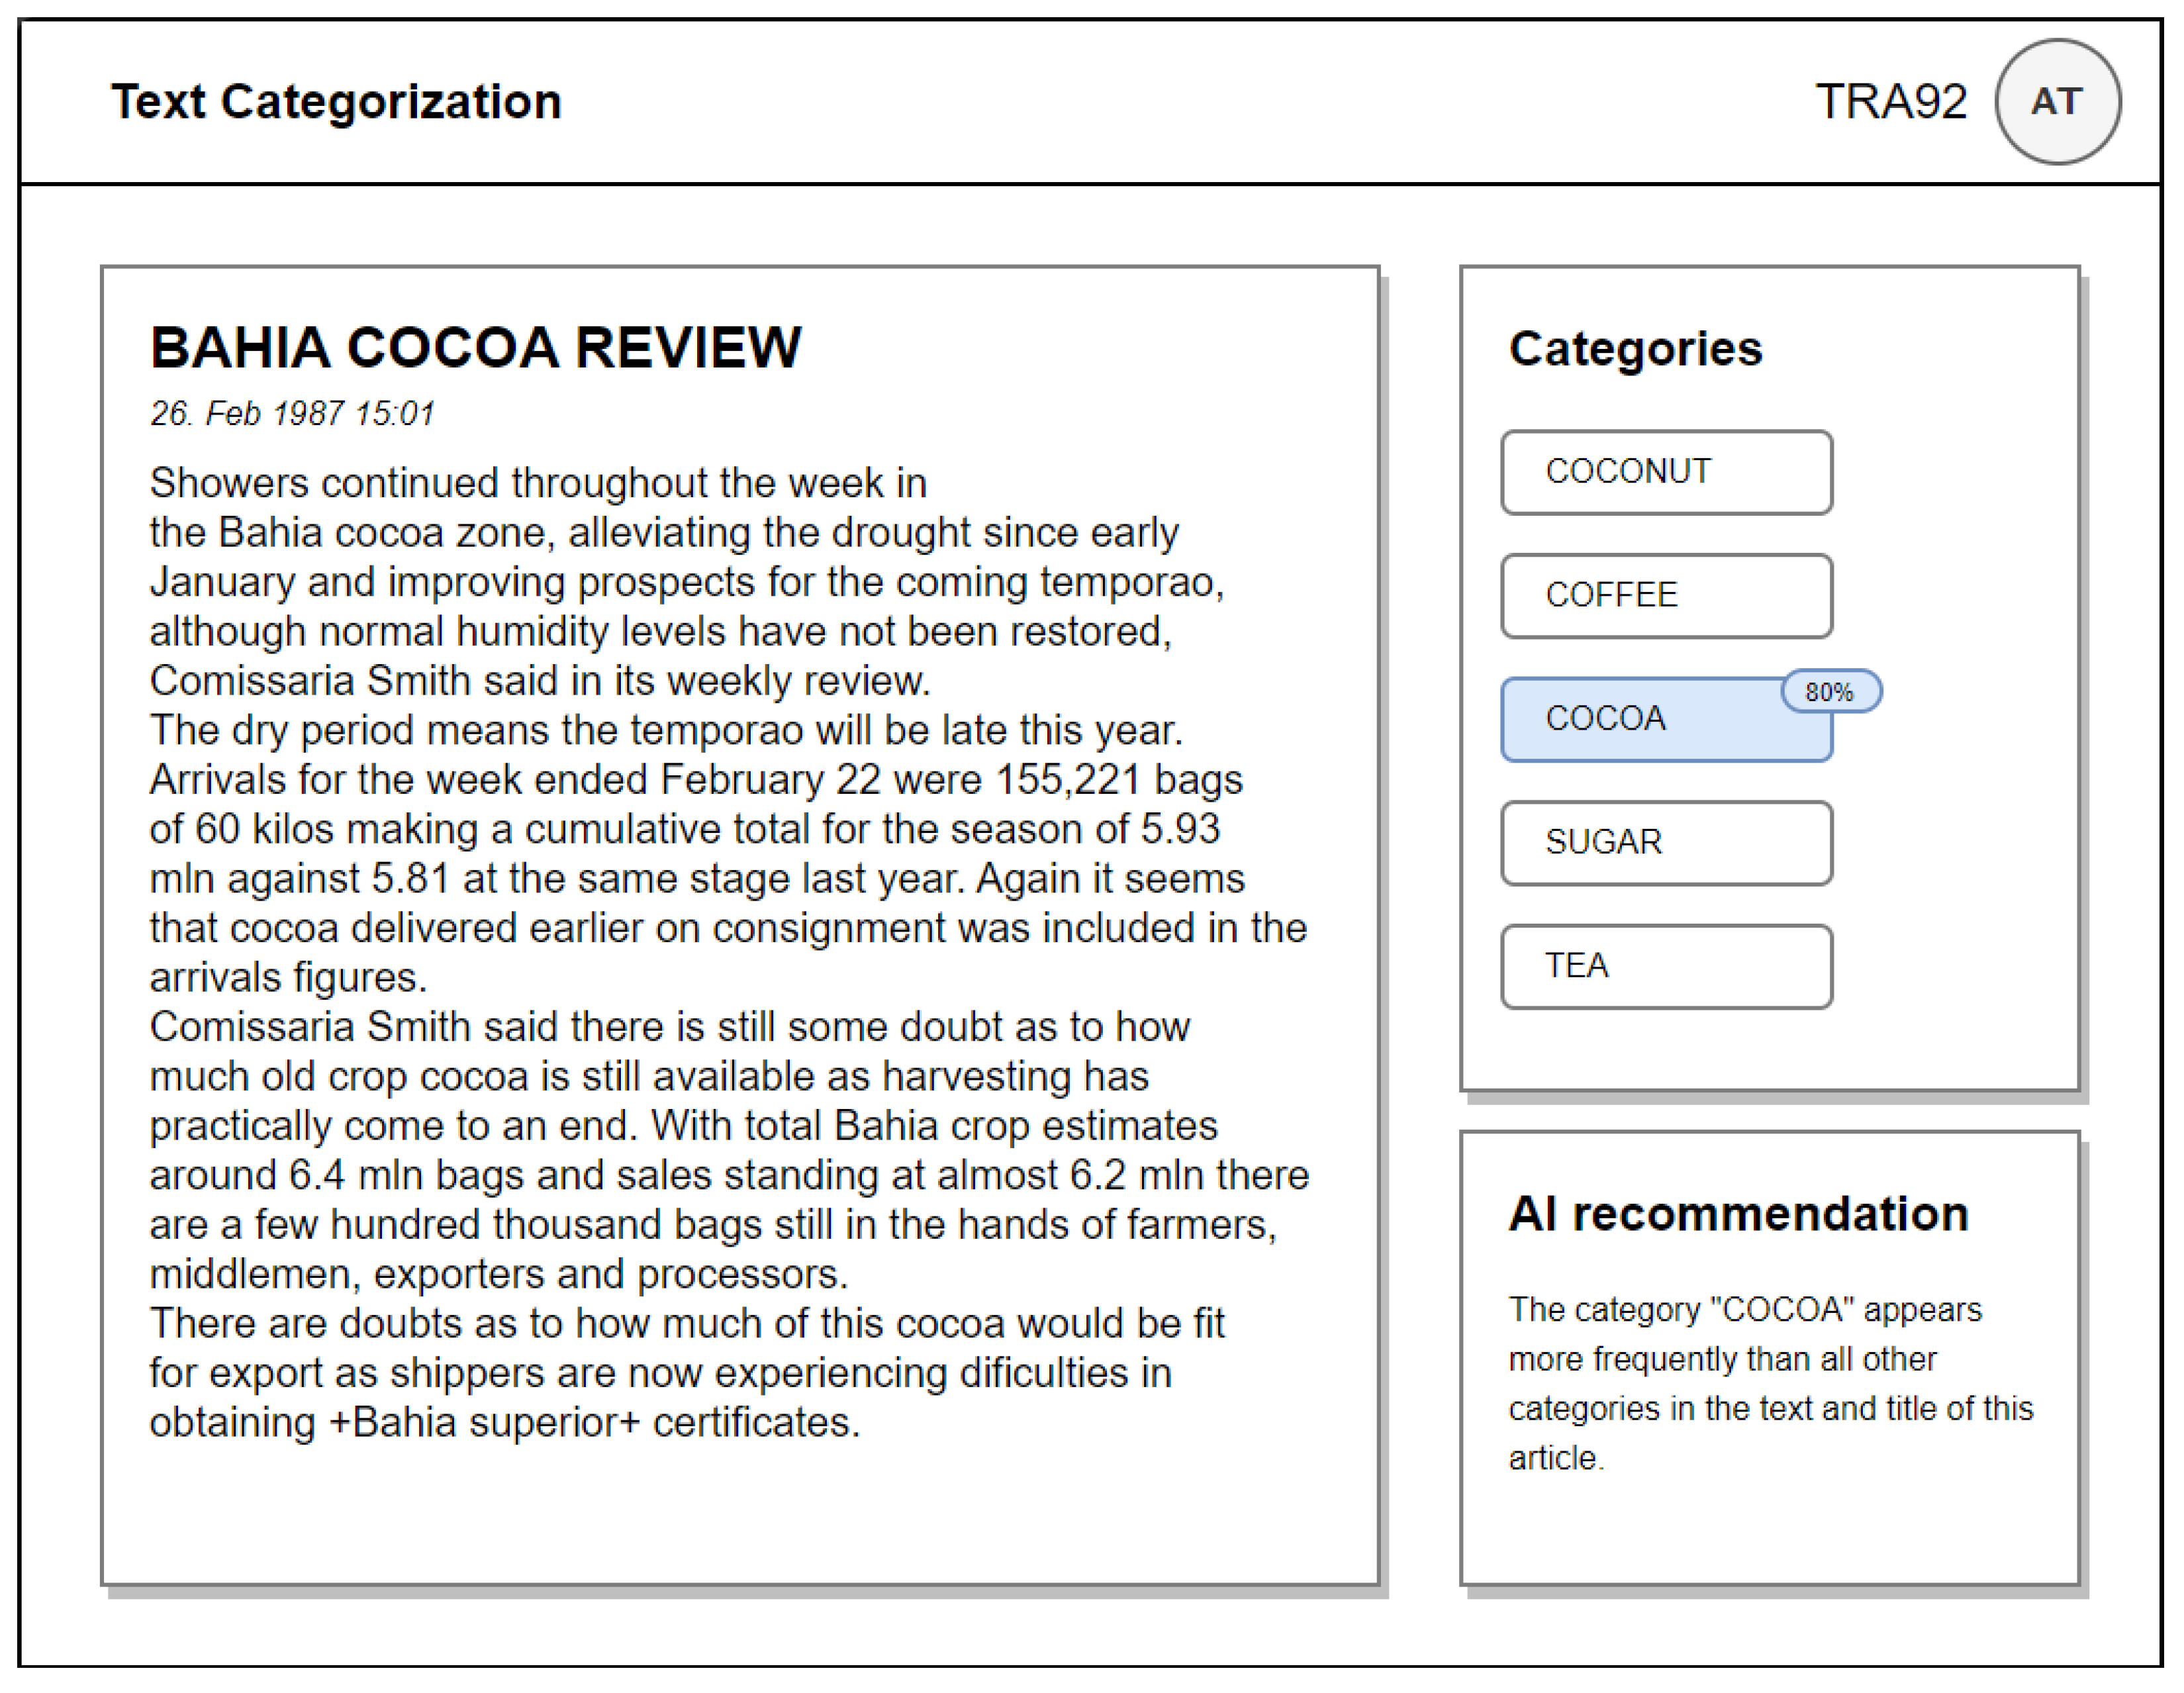
4.2. Implemented Text Categorization Component

Figure 15 illustrates the practical implementation of the Text Categorization component, closely aligned with the conceptual model. A progress circle appears in the upper left corner for enhanced user orientation. The available categories are shown on the right side.
To optimize loading time, the article and its corresponding categories are transmitted without the AI recommendation initially. The AI recommendation is subsequently fetched from the backend. Users can peruse the article and contemplate an appropriate category during this loading phase. Once available, the AI recommendation is presented below the categories, highlighted in blue, accompanied by a confidence percentage and a brief reasoning for the choice.
The connectivity among MLTC microservices is established through a JSON-formatted configuration file, illustrated in Listing 1. This configuration encompasses the network address and name of the trainer instances. The “interruptTraining” flag determines whether the training process is interrupted when there are changes in the database.
Listing 1. MLTC trainer example configuration.
Bdcc 08 00011 i001
The initiation of ML model training is scheduled through cron jobs, operating in a parallel process alongside the production environment to prevent any degradation in application performance. The training process algorithm is outlined in Listing 2. All trainer microservice instances are initially retrieved, and the current database hash is generated. For each trainer instance, the algorithm first verifies if the trainer has completed its training task. If so, the athlete is replaced if the trainer demonstrates superior performance. Subsequently, the trainer data is compared with the current database. If the trainer is permitted to be interrupted and the data differs, the trainer recommences training and retrieves the latest data from the database.
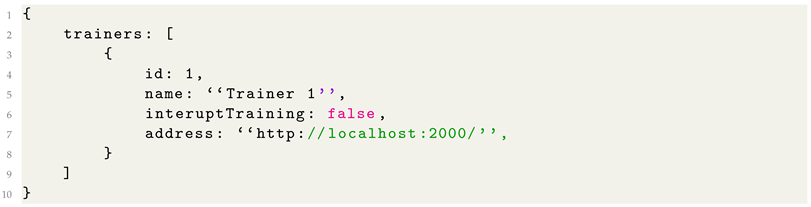
Listing 2. MLTC trainer training algorithm.
Bdcc 08 00011 i002
The athlete and trainer microservices are connected over the same API specification defined by Eljasik-Swoboda [9]. The predefined categories are created over the categories endpoint. Then, the documents are loaded via the documents endpoint, which receives the whole document population in junks. The athlete then receives the trained model to perform the categorization. With a specific endpoint, the Text Categorization component can retrieve the recommended category for any document. Inside the microservice, the model is executed and finds the correct category.

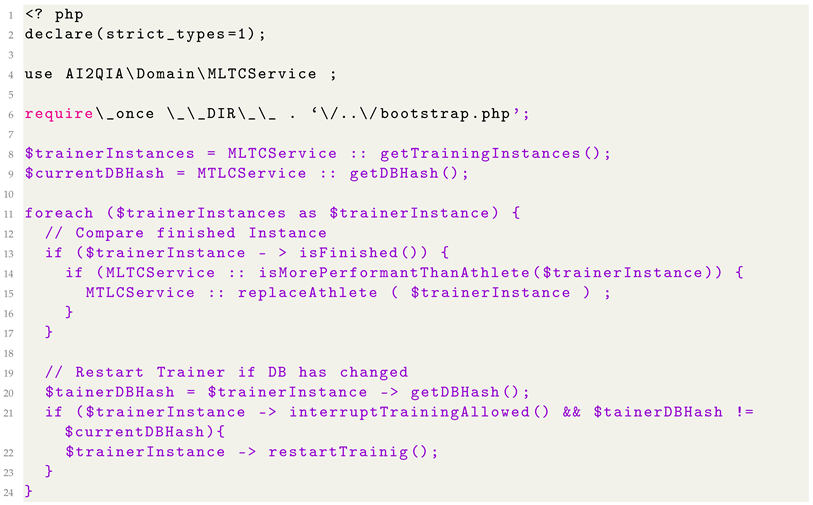
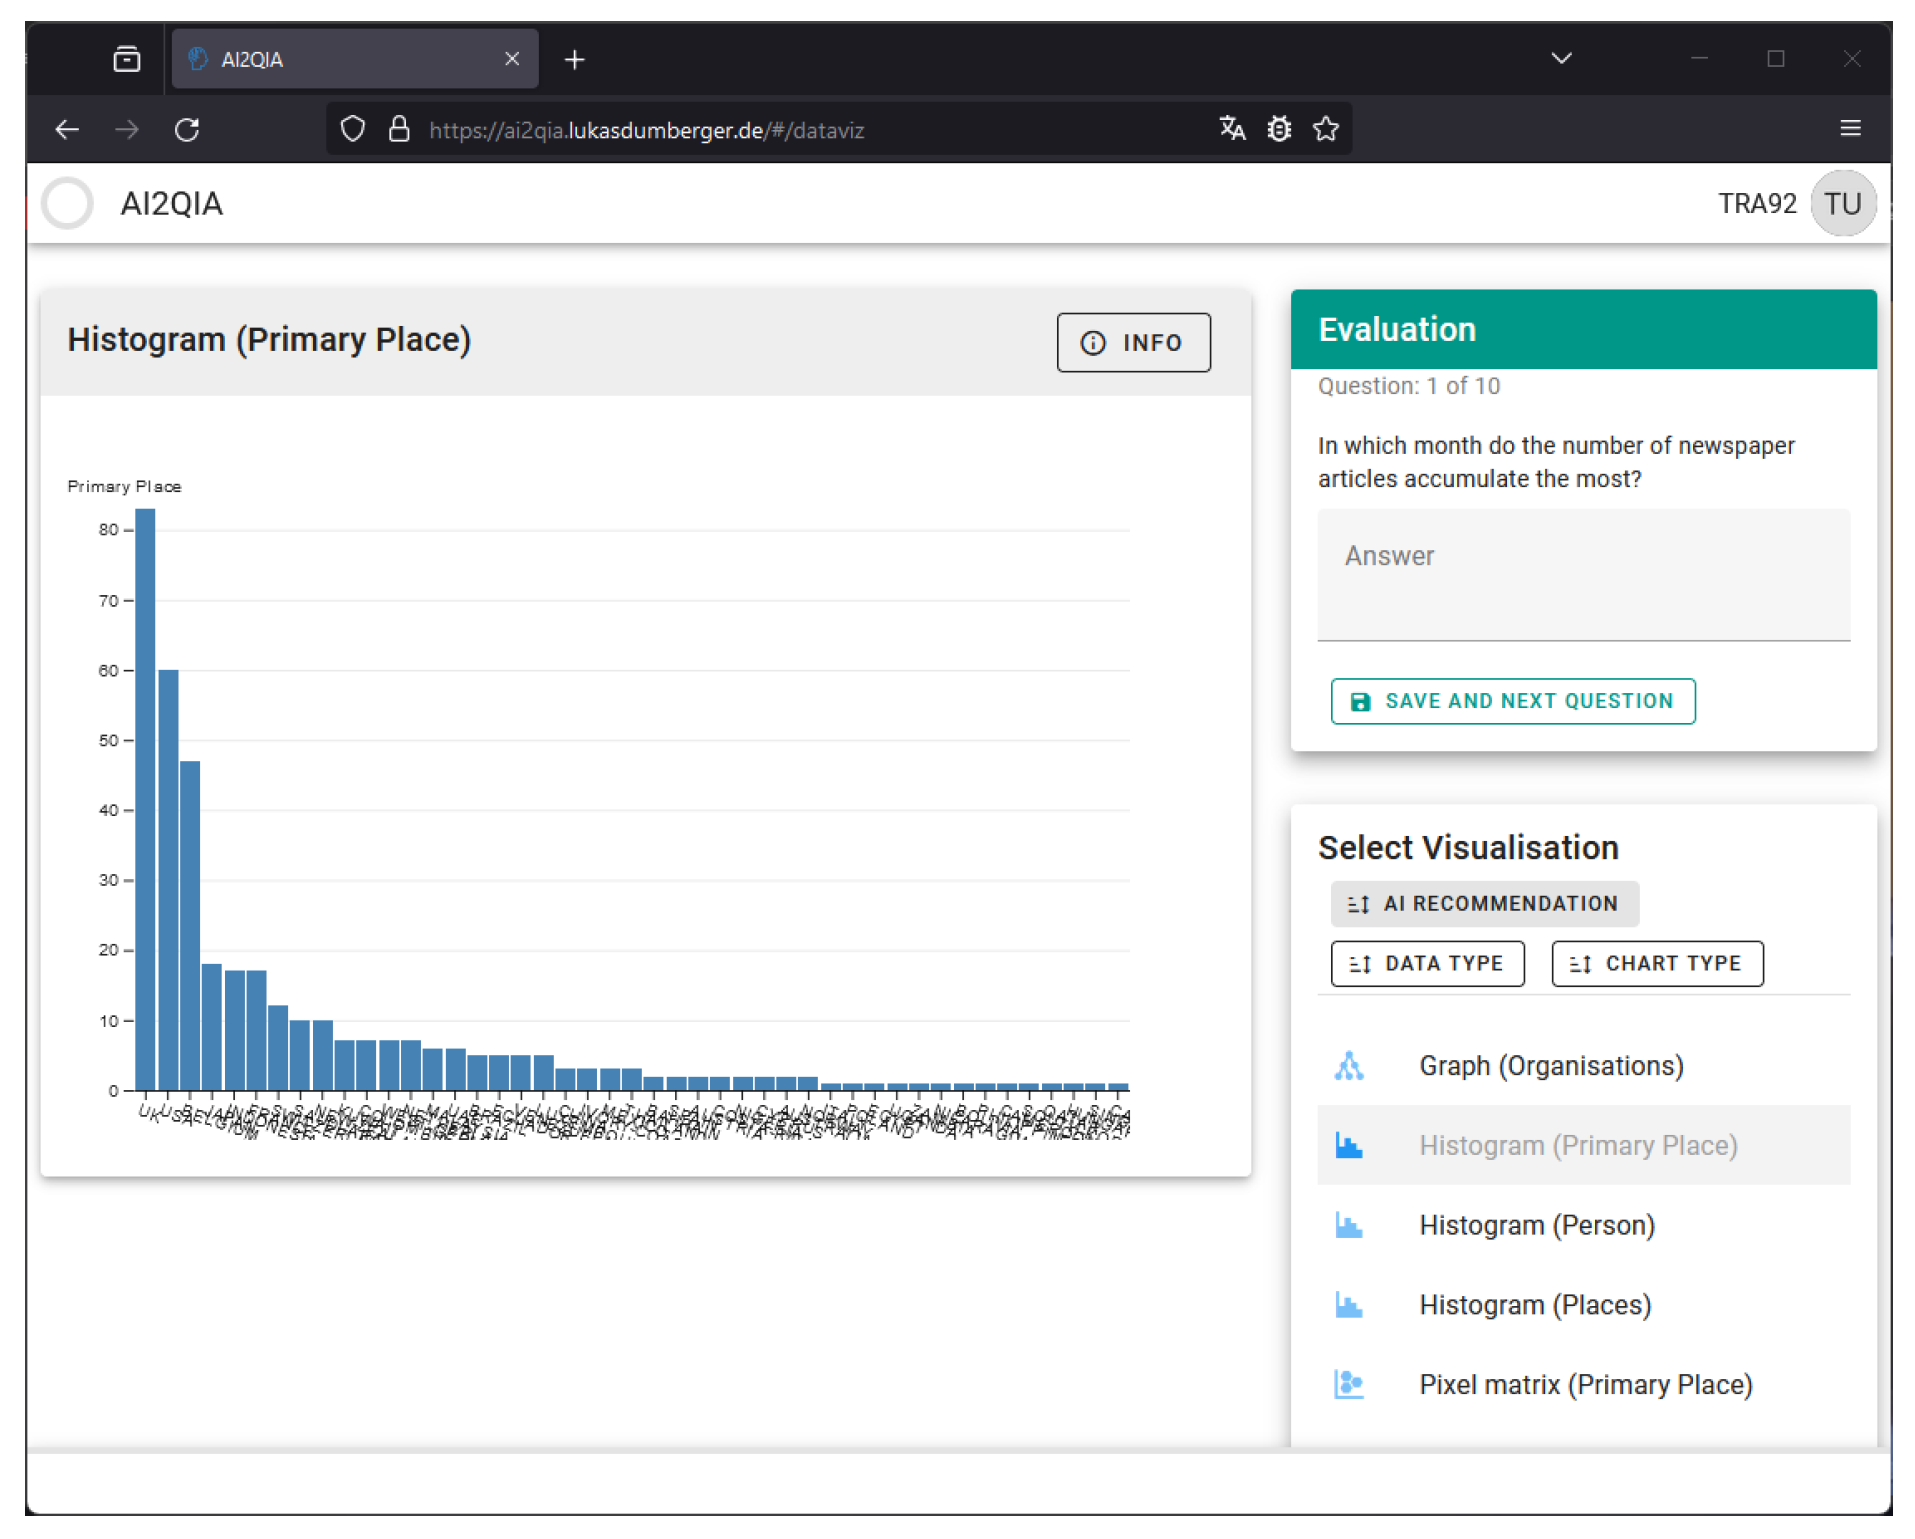
4.3. Implemented Data Visualization Component

The UI/UX concept of the Data Visualization component aligns with the presented Text Categorization component to maximize user comprehensibility. It is similarly structured with a content area on the left and an interaction area on the right, as shown in Figure 16. In the upper right column, the evaluating user encounters questions to be answered using the provided visualizations. Below this section, the user can choose visualizations. AI-recommended visualizations are accentuated with a blue hue to maintain consistency with the prototype’s color scheme.
Within the backend, recommendations are computed by collaborating with the VizScorer and VizSelector components. The VizScorer component processes the context functions by executing them to determine the score for each provided visualization. Subsequently, the VizSelector employs its selection strategy to determine the recommended visualizations. This rule-based expert system provides results within milliseconds. As a result, there is no requirement for asynchronous retrieval of the AI recommendation; the recommendation data is calculated and delivered with the initial page visit.

4.4. Discussion and Remaining Challenges

Leveraging the outlined technologies facilitated the development of a stable and well-structured prototype. The subsequent phase involves evaluating this information system with users to gather feedback on the implemented design. A key challenge is addressing usability issues that may impact the evaluation outcomes. Usability issues can manifest in various forms, diverting users from their intended goals. An example of such an issue could be a button that the user does not recognize as such or unclear error messages. Identifying and minimizing such usability issues constitutes a crucial objective in the evaluation process.

5. Evaluation

The evaluation unfolds in two stages. Initially, a qualitative evaluation in the form of a cognitive walkthrough [15] was conducted to identify and rectify as many usability issues as possible, ensuring an optimized prototype for the subsequent step: the quantitative evaluation. In the quantitative phase, users independently evaluate without guidance from a tutor or an evaluation conductor. All information is derived from the simulation environment, which underlines the need to address and eliminate usability issues. This evaluation section concludes with a summary of the results and a reflection on the remaining challenges.

5.1. Qualitative Evaluation Using a Cognitive Walkthrough

Before the cognitive walkthrough, participants were briefed on the topic and received an explanation of the fundamental rules, emphasizing the importance of staying focused on the prototype to avoid digression. The cognitive walkthrough process description to the users comprised the various tasks users encounter during operation. Each task consists of a series of action steps that must be worked through using the prototype. The evaluation of each action step is conducted separately, guided by four questions from [16]:
  • Do users identify the correct result to achieve? [16]
  • Do users identify correct available actions? [16]
  • Do users correctly link actions with their target result? [16]
  • Do users perceive progress while getting closer to their goal? [16]
Each action could be either successfully identified or contain problems. Table 2 illustrates the four defined tasks that probands must perform: registering, categorizing text data, visualizing categorized data, and responding to an integrated survey. For each task, the necessary actions are categorized into identified actions and actions that encountered problems. The problem rate is then calculated by dividing the problematic and required steps.
A key finding from the evaluation suggests disabling buttons when they should not be in the focus. This approach provides users with gentler guidance towards the next required interaction element. Another significant result recommends swapping the result and interaction areas on the text categorization and data visualization pages. Aligning with common application design principles (e.g., Outlook, Overleaf, Slack, etc.), the control area should be positioned on the left side to attract the participant’s attention and lead to the results on the right side.
The other problematic action steps are scrutinized and revised to eliminate usability issues, aiming to create a more user-friendly interface for the upcoming quantitative evaluation.

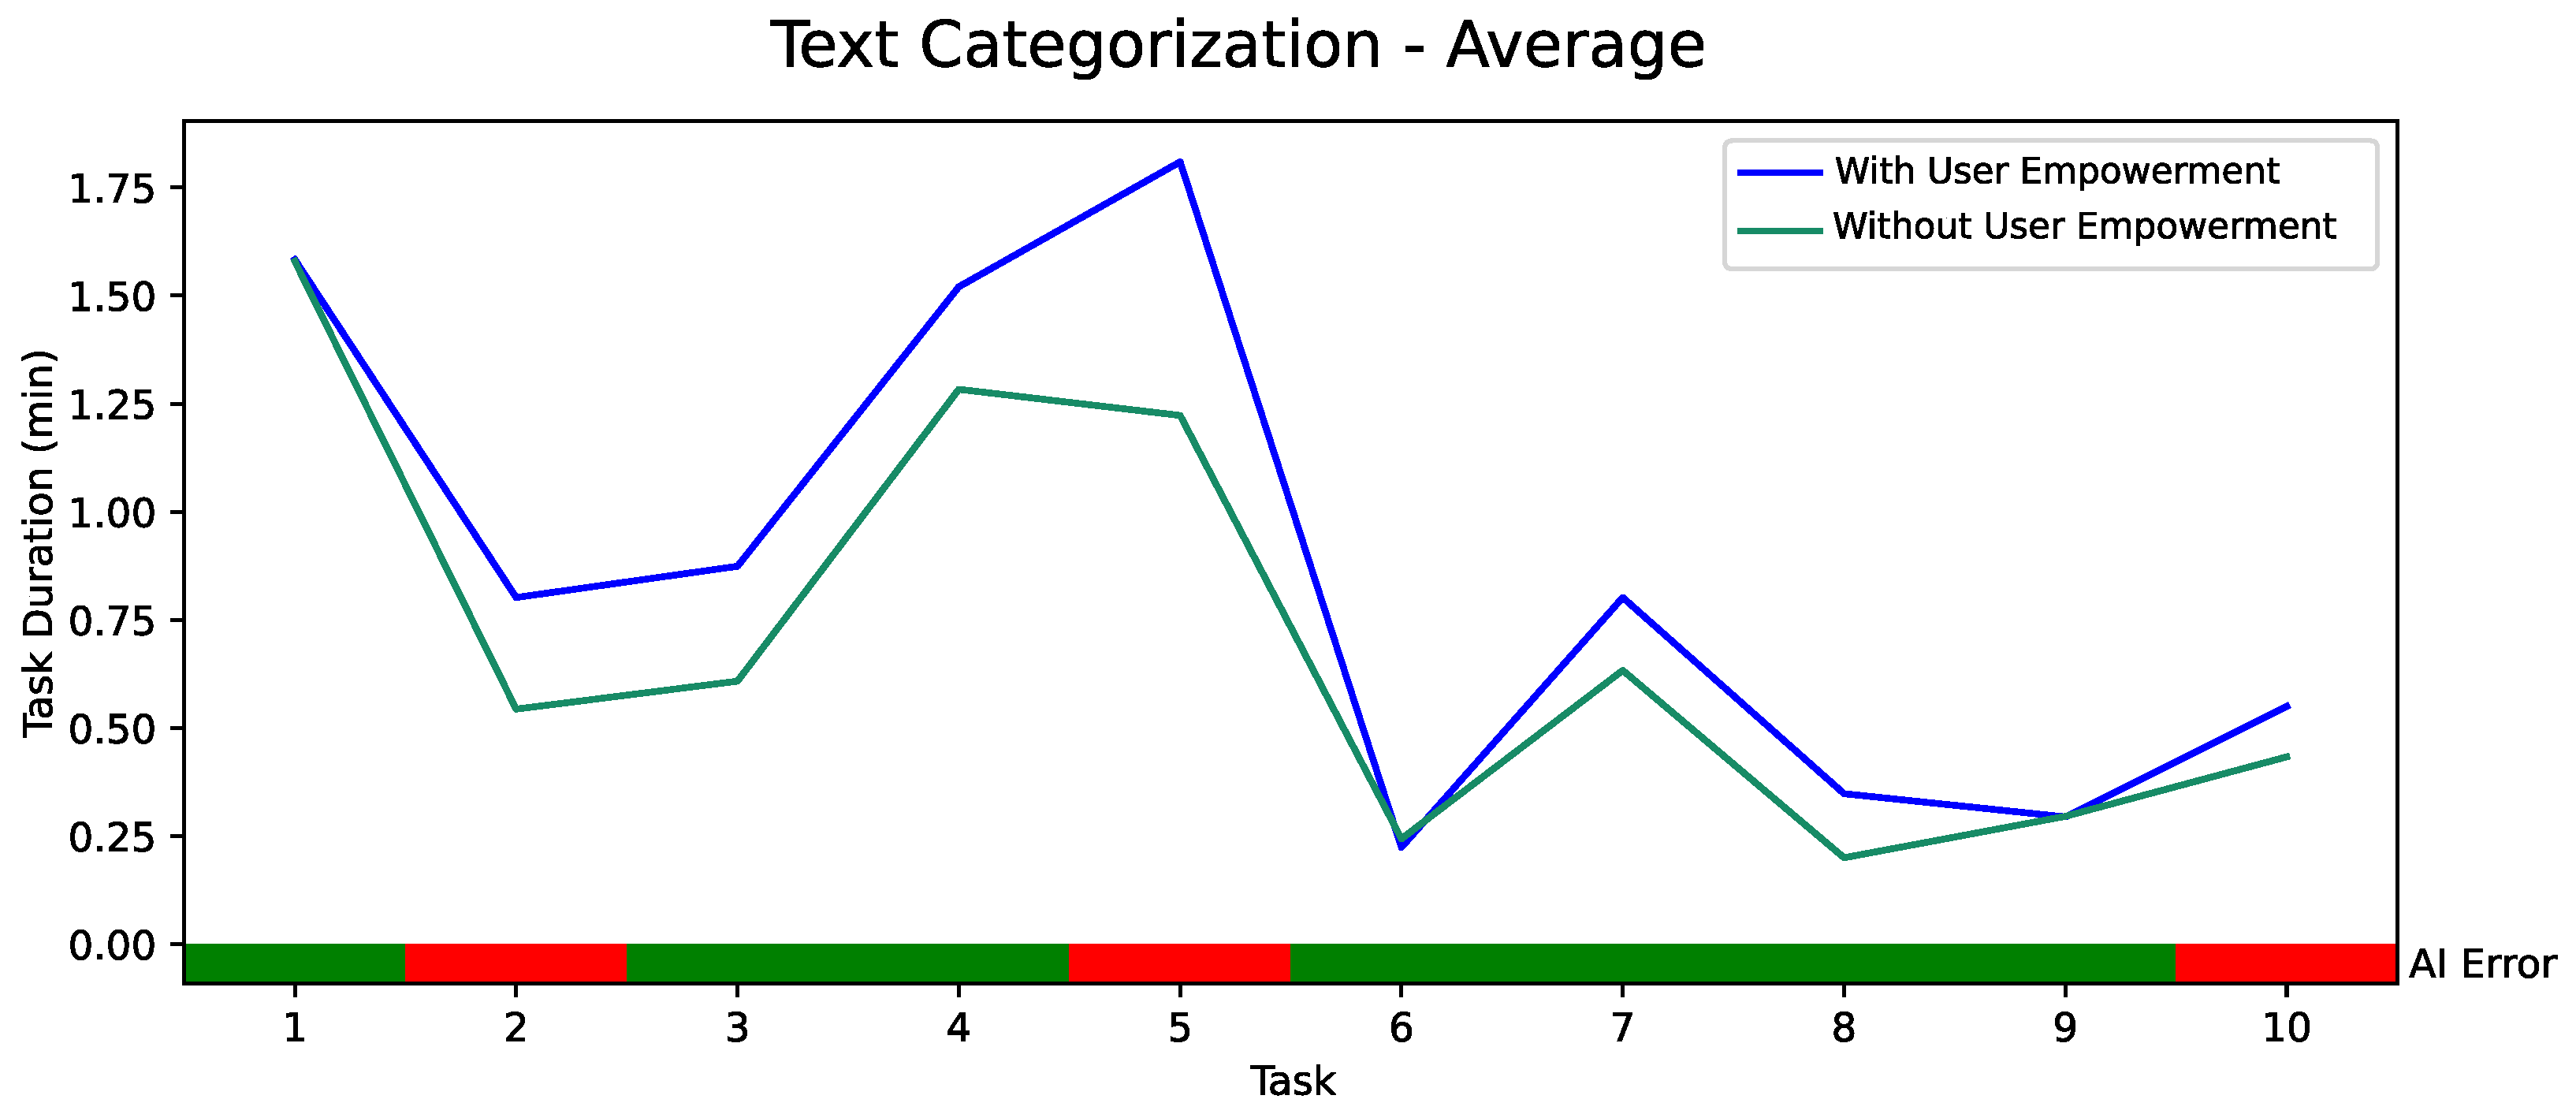
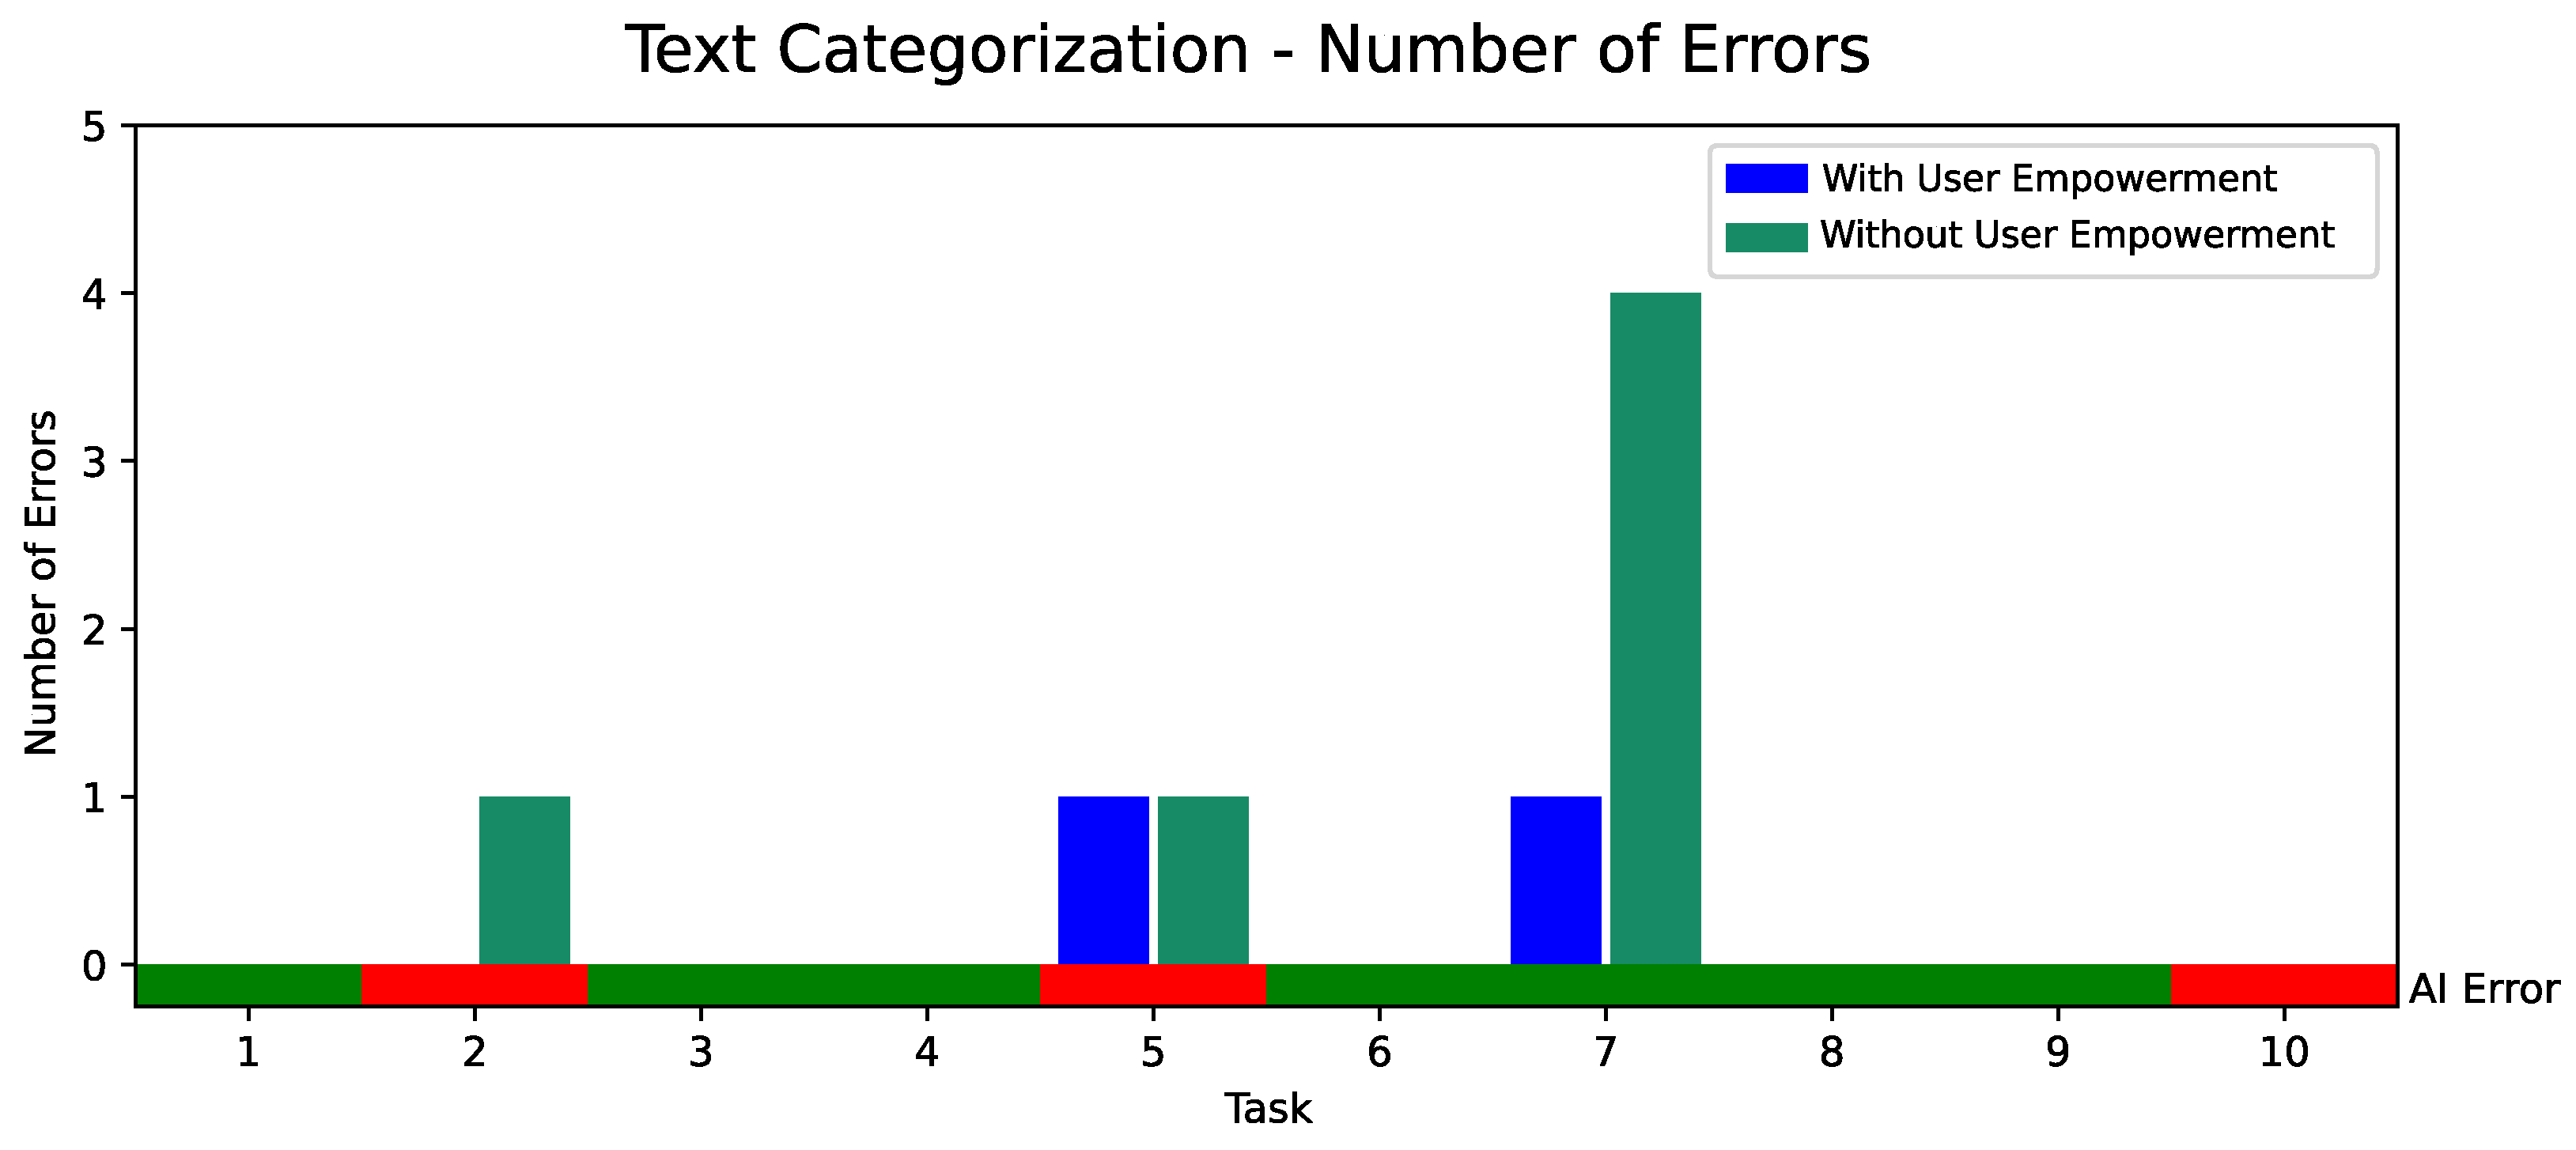
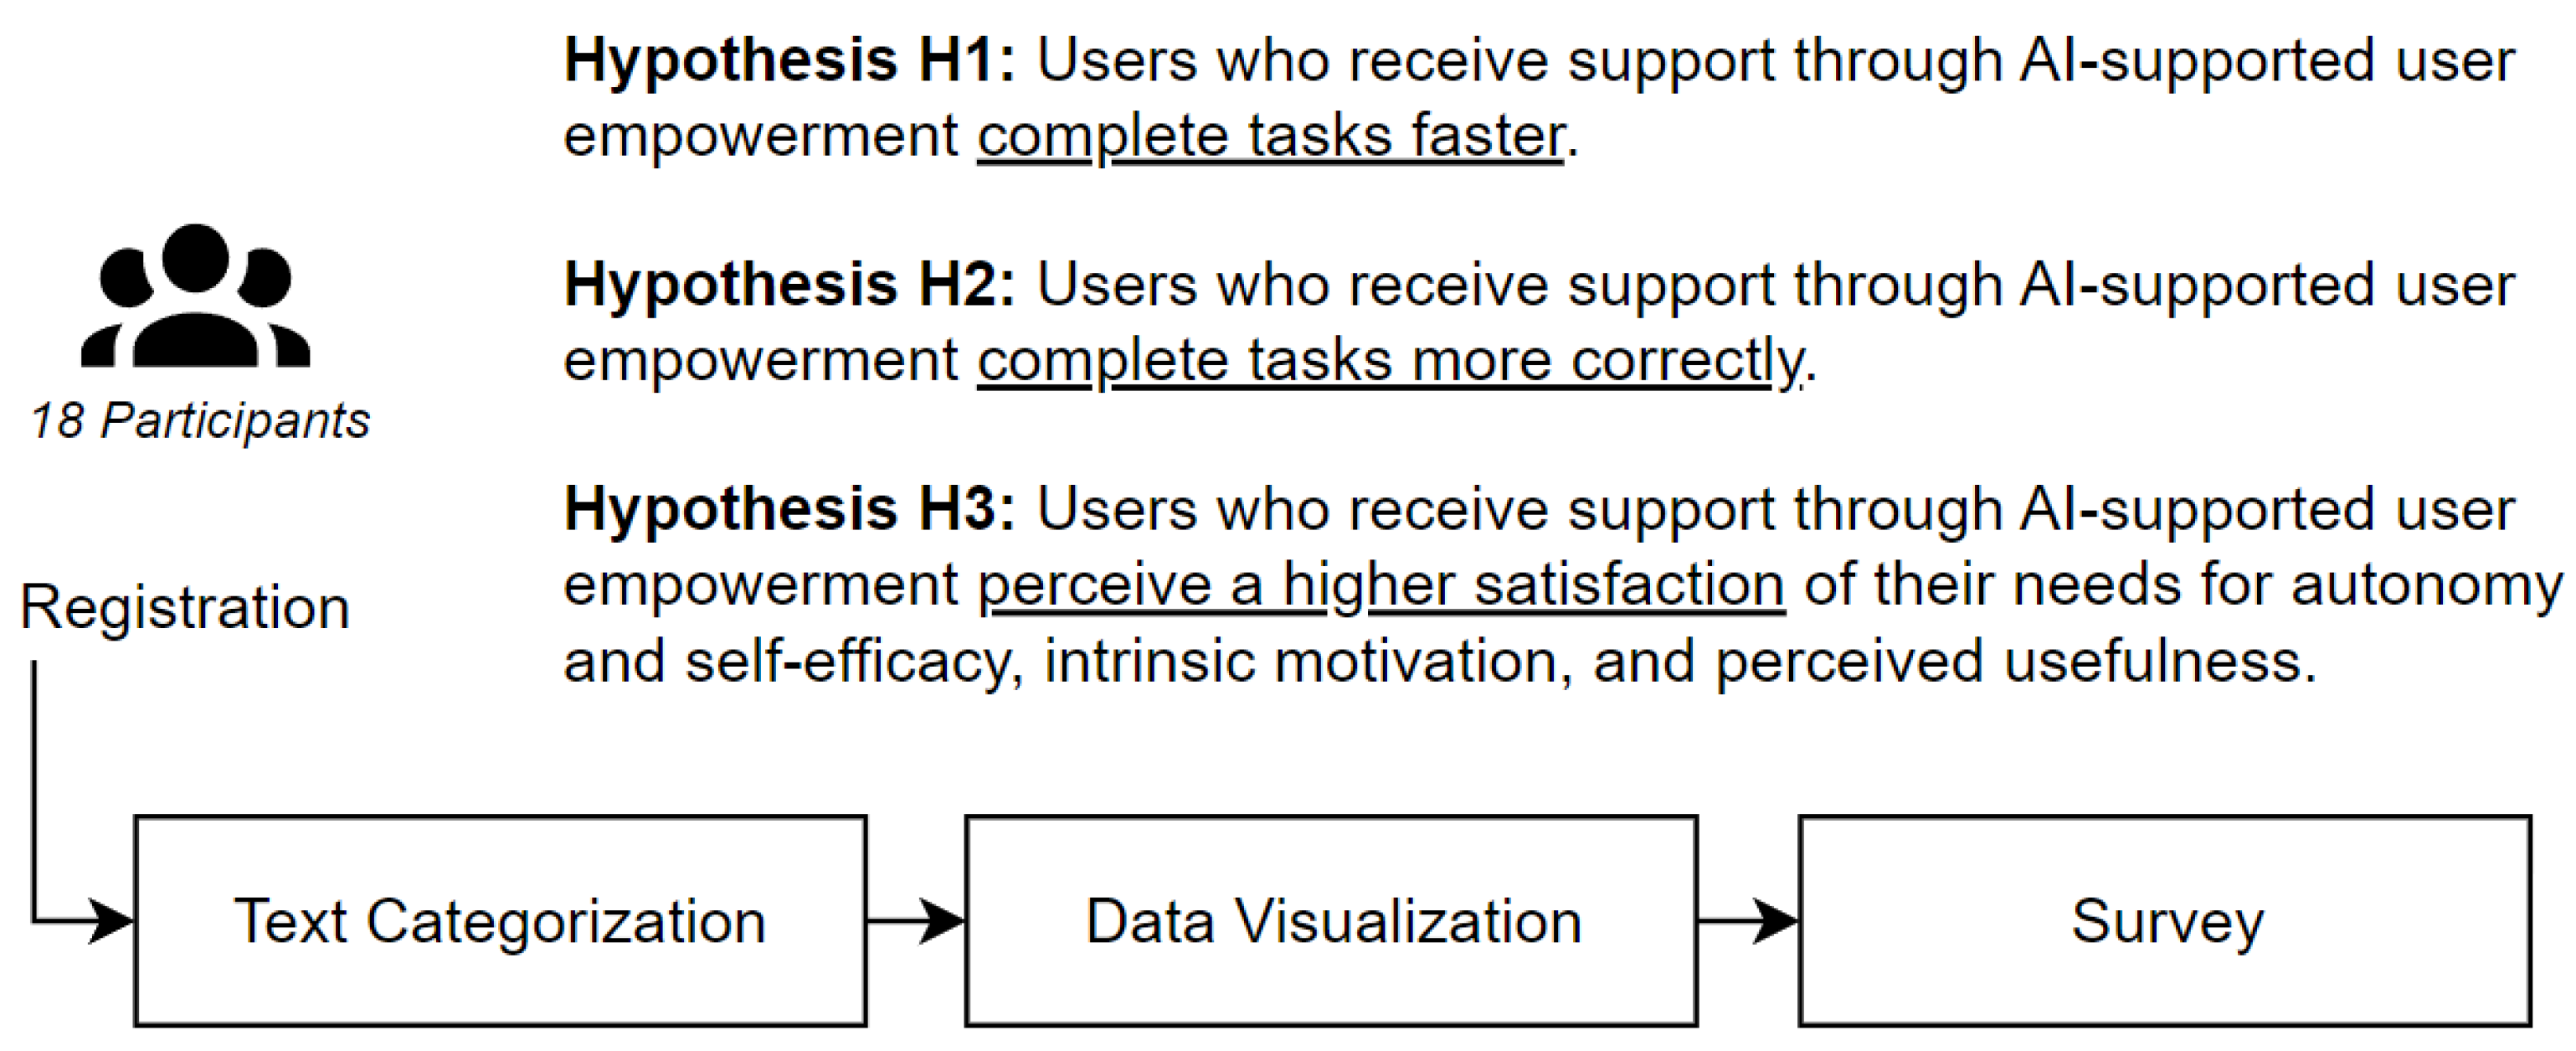
5.2. Quantitative Evaluation of AI-Based User Empowerment with 18 Participants

Figure 17 summarizes the quantitative evaluation. Three research hypotheses guide the design of the evaluation. The 18 participants initiated the evaluation by registering and then proceeding through the various stages following the evaluation.
Three research hypotheses, H1, H2, and H3, displayed in Figure 17 have been formulated to guide and orient the quantitative evaluation. These hypotheses play a crucial role in shaping the evaluation process and its underlying concept, providing a focal point to ensure the evaluation process adheres to the intended course.
The evaluation of the Text Categorization and Data Visualization components involved distinct tasks that users had to perform. These tasks are illustrated with the provided AI support and the simulated AI failure in Table 3.
The research design is derived from these hypotheses. The evaluation group is split into two segments to compare the difference between AI-supported and non-AI-supported users: one with AI support and one without. In this evaluation, there are two independent variables to examine—the text categorization and data visualization components. Opting for a between-group factorial design would result in four groups combining each AI and non-AI support case with text categorization and data visualization components. This approach is not chosen due to the constraints of a small group of test subjects. Therefore, a more realistic approach was selected: the split-plot design, where both AI and non-AI groups assess the text categorization and data visualization components.
Each group undertook the same ten tasks for both tested components. Three of the ten tasks include a simulated AI failure to present a realistic state-of-the-art that acknowledges fallible AI. In this scenario, the AI provides an incorrect recommendation. This failure is essential for testing hypothesis H2. If the AI only offered accurate recommendations, it would be challenging to discern whether an AI-supported user is genuinely assisted by the AI or follows recommendations blindly without reflection.
The tasks for evaluating Text Categorization component involved categorizing ten newspaper articles, each of which needed to be assigned to one of five categories. The AI support provided a recommendation for one category. The simulated AI failure was implemented with three AI recommendations pointing to the incorrect category.
When evaluating the Data Visualization component, users were tasked with answering ten questions based on the provided visualizations. The AI recommended ten out of 25 visualizations by highlighting them in blue. The recommended visualizations addressed seven out of the ten questions. The remaining three questions must be answered using a non-recommended visualization, representing the simulated AI failure.
To evaluate hypothesis H3, the evaluation concludes with a survey that inquires about the users’ empowerment needs. This survey is based on the UEQ-Plus questionnaire (https://ueqplus.ueq-research.org/, (accessed on 10 January 2024)), specifically designed to gauge user experience in applications.
The quantitative evaluation involved 18 participants, all familiar with digital media. Participants were given a link to the application, where they completed the registration process. The overview page is displayed in Figure 18. It served as the starting point for evaluating the Text Categorization and Data Visualization components and the final survey.
At this point, a comprehensive examination of all evaluation results is not feasible. Instead, the most significant findings for the three stated research hypotheses are highlighted:
Hypothesis 1 (Task completion time (H1)).
The hypothesis states that AI-supported users might complete tasks more quickly than those without support. Figure 19 illustrates the average time (y-axis) the two evaluation groups needed to complete the ten tasks (x-axis). The tasks marked in red included the simulated AI failure; the ones in green relate to correct AI predictions.
The results for the Text Categorization component show that the AI-supported group required more time to make decisions for categorization. This can be explained by the fact that users not only had to form their own opinions but also needed to reflect on these opinions in light of the AI recommendations.
The task completion time for the Data Visualization component, as shown in Figure 20, does not yield a directly comparable result. Nevertheless, it is noteworthy that users with AI support also require more time for tasks containing a simulated AI failure.
It is plausible to assume that users initially attempted all AI-recommended visualizations before exploring the non-recommended ones. While this might not lead to an increase in completion time, it is important to acknowledge that the AI approach functions in a way that limits users to a subset of visualizations, thereby reducing the complexity for the user. If this is the case, it should be reflected in the results of Hypothesis 3.
Hypothesis 2 (Processing errors (H2)).
If this hypothesis holds, AI-supported users may provide more accurate answers than those without support. This hypothesis is indeed confirmed in the case of the Text Categorization component. Figure 21 illustrates, on the y-axis, the number of errors each group encountered during task processing.
Particularly in task seven, non-AI-supported users made more mistakes. The users’ confusion may have been triggered by the title of the newspaper article: “French Household Consumption Falls In February”. Including the word “household” misled many participants into assigning the article to the category “Housing” rather than the correct category, “Retail”. The longer processing time of the AI-supported users, coupled with the correct recommendation from the AI, significantly reduced errors in this group. In this instance, the AI genuinely assisted in error reduction. The results of the Data Visualization component are not entirely reliable in this regard.
Hypothesis 3 (User empowerment needs (H3)).
The UEQ-Plus questionnaire assesses six dimensions: efficiency, usefulness, perspicuity, adaptability, dependability, and intuitive use. Summarizing the results, the two groups perceived two main needs differently. The AI-supported group rated efficiency more positively. This finding is surprising, considering that the AI group worked slower and, therefore, was less efficient in completing many tasks quickly. The disparity between perception and reality underscores the importance of evaluating the facts and speed of AI models but also the needs and perceptions of end users. On the other hand, adaptability is ranked less positively by AI-supported users. These users perceived the AI as tending to be more obstructive than supportive. This user feedback is crucial and should be considered in future application designs.
Certain factors that should have been mitigated influenced the reported evaluation results. To assess hypothesis H1, user completion time was monitored. To prevent placing users under time pressure, the evaluation description deliberately omitted mentioning the time tracking of tasks. However, this led to users pausing the task processing. In some extreme cases, completion times reached up to 10 min. These outliers were subsequently excluded from the data results. Another factor that confused some participants was the format of user feedback. While users were required to click on the correct category on the text categorization page, they had to answer questions by typing in a text form on the data visualization page. This difference in user feedback methods proved perplexing for some users who anticipated only clicking on the correct visualization to complete their responses.

5.3. Discussion and Remaining Challenges

The prototype evaluation indicates that the integration of AI positively impacts the application’s usability and functionality. While AI did not accelerate the task process, it contributed to more reliable results in the quality of user responses. The analysis of the UEQ-Plus questionnaire provided insights into user perceptions, highlighting the positive influence AI can have on applications. However, it is crucial to emphasize that this evaluation process must be conducted regularly. Not all AI applications yield positive outcomes, and each use case must be carefully examined and tested with end users. Certain user needs may be interdependent or conflicting; for instance, users desire an efficient tool but not at the expense of their self-efficacy.
The prototype’s evaluation had limitations in that relying solely on the quantitative data from user interactions recorded in the EvalLog led to the loss of many aspects of the interaction process. The final survey included an open-text field for comments on the entire evaluation. It was utilized by numerous participants and provided a more detailed insight into their perceptions and emotions. Furthermore, assessing the statistical relevance of the evaluation results remains a challenge for further research.
A promising approach could involve logging even more interaction steps and, in the end, supplementing the quantitative analysis of all users with a qualitative analysis of individually selected users. The logged data could be assessed by tracking the paths of individually chosen users through the application, resulting in a deeper understanding of the user experiences. An alternative approach could be observing individual users in action, but this would be more time-intensive and compromise the convenience of a locally distributed evaluation.

6. Summary and Outlook

This paper investigated the possibilities for applying AI and ML from empirical social research to empower users. The important research activity of qualitative content analysis was analyzed in more detail. It consists of categorizing symbolic data (mostly text documents) and analyzing them visually. AI and ML could be applied to determine the correct categories and to recommend visualizations for a dashboard that maximizes the likelihood of relevant insights.
Conceptual modeling in this paper followed the UCD approach. It defined an information system that uses the existing MLTC component for text categorization and introduced a novel expert system for visualization recommendation. The developed models were prototypically implemented using Vue.js for the frontend and Slim PHP together with Doctrine ORM for the backend.
The prototypical implementation was assessed and improvised by conducting a cognitive walkthrough with two probands. The cognitive walkthrough revealed two major challenges for the evaluating users: inactive interaction elements were not perceivable, and the layout (menu on the right, visualizations on the left) was counter-intuitive to the probands. Both findings were addressed in the prototype. Finally, a comprehensive user study with 18 participants assessed three AI and ML-based user empowerment hypotheses concerning speed, correctness, and perceived satisfaction. The results revealed that AI and ML-based user empowerment can improve correctness and perceived satisfaction for qualitative content analysis. However, the speed declined when additional AI recommendations were shown for the probands. An initial explanation for this phenomenon could be the probands’ required time for additional reflection.
As demonstrated in the paper, a user might perceive increased efficiency, yet the actual interaction with the AI could result in a slower process. Further research should investigate the cause of this behavior. It is imaginable that using the term “AI” for the assistant causes some users to question the results even more critically. A successful AI is not only characterized by speed and precision in its responses but also by its usability and the enjoyment it brings to the user. In the early 90s, Fisher and Nakakoji emphasized that artificial intelligence should empower humans rather than replace them [17]. Embracing this user-centered AI perspective will lead to developing AI applications that can empower human users more efficiently. Consequently, future research should not only focus on AI improvements regarding metrics on their predictions, such as precision, recall, or F-score but also involve users’ perspectives. Another potential research direction is following up on the introduced AI and ML-based user empowerment quadrant (Figure 3).

Author Contributions

Conceptualization, formal analysis, investigation, resources, validation, and visualization T.R. and L.D.; methodology, T.R.; software and data curation, L.D.; writing—original draft preparation, T.R. and L.D.; writing—review and editing, T.R., L.D., S.B., T.K., V.S. and M.X.B.; supervision, M.X.B. and M.L.H. All authors have read and agreed to the published version of the manuscript.

Funding

This research received no external funding.

Institutional Review Board Statement

Ethical review and approval were waived for this study, as formative evaluation during software development did not include the collection of any personal data.

Informed Consent Statement

Informed consent was obtained from all subjects involved in the study.

Data Availability Statement

The data presented in this study are available on request from the corresponding author.

Conflicts of Interest

The authors declare no conflict of interest.

References

  1. Hariri, R.H.; Fredericks, E.M.; Bowers, K.M. Uncertainty in big data analytics: Survey, opportunities, and challenges. J. Big Data 2019, 6, 1–16. [Google Scholar] [CrossRef]
  2. Berisha, B.; Mëziu, E.; Shabani, I. Big data analytics in Cloud computing: An overview. J. Cloud Comput. 2022, 11, 24. [Google Scholar] [CrossRef] [PubMed]
  3. Schreier, M. Qualitative Content Analysis in Practice; Sage Publications: Los Angeles, LA, USA, 2012; pp. 1–280. [Google Scholar]
  4. OECD. Artificial Intelligence in Society; OECD: Paris, France, 2019. [CrossRef]
  5. Reis, T.; Bruchhaus, S.; Freund, F.; Bornschlegl, M.X.; Hemmje, M.L. AI-based User Empowering Use Cases for Visual Big Data Analysis. In Proceedings of the 7th Collaborative European Research Conference (CERC 2021), Cork, Ireland, 9–10 September 2021. [Google Scholar]
  6. Ruppert, E. Rethinking empirical social sciences. Dialogues Hum. Geogr. 2013, 3, 268–273. [Google Scholar] [CrossRef]
  7. Baur, N.; Blasius, J. Methoden der empirischen Sozialforschung: Ein Überblick. In Handbuch Methoden der Empirischen Sozialforschung; Springer: Berlin/Heidelberg, Germany, 2014; pp. 41–62. [Google Scholar]
  8. Cauteruccio, F.; Kou, Y. Investigating the emotional experiences in eSports spectatorship: The case of League of Legends. Inf. Process. Manag. 2023, 60, 103516. [Google Scholar] [CrossRef]
  9. Eljasik-Swoboda, T. Bootstrapping Explainable Text Categorization in Emergent Knowledge-Domains. Ph.D. Thesis, FernUniversität in Hagen, Hagen, Germany, 2021. [Google Scholar] [CrossRef]
  10. Sebastiani, F. Machine learning in automated text categorization. ACM Comput. Surv. (CSUR) 2002, 34, 1–47. [Google Scholar] [CrossRef]
  11. Reis, T.; Kreibich, A.; Bruchhaus, S.; Krause, T.; Freund, F.; Bornschlegl, M.X.; Hemmje, M.L. An Information System Supporting Insurance Use Cases by Automated Anomaly Detection. Big Data Cogn. Comput. 2023, 7, 4. [Google Scholar] [CrossRef]
  12. Dakhel, A.M.; Majdinasab, V.; Nikanjam, A.; Khomh, F.; Desmarais, M.C.; Jiang, Z.M.J. Github copilot ai pair programmer: Asset or liability? J. Syst. Softw. 2023, 203, 111734. [Google Scholar] [CrossRef]
  13. Shoufan, A. Exploring Students’ Perceptions of CHATGPT: Thematic Analysis and Follow-Up Survey. IEEE Access 2023, 11, 38805–38818. [Google Scholar] [CrossRef]
  14. Abras, C.; Maloney-Krichmar, D.; Preece, J. User-Centered Design; Sage Publications: Los Angeles, LA, USA, 2004. [Google Scholar]
  15. Mahatody, T.; Sagar, M.; Kolski, C. State of the art on the cognitive walkthrough method, its variants and evolutions. Int. J. Hum. Comput. Interact. 2010, 26, 741–785. [Google Scholar] [CrossRef]
  16. Salazar, K. How to Conduct a Cognitive Walkthrough Workshop; Nielsen Norman Group: Fremont, CA, USA, 2022. [Google Scholar]
  17. Fischer, G.; Nakakoji, K. Beyond the macho approach of artificial intelligence: Empower human designers—Do not replace them. Knowl. Based Syst. 1992, 5, 15–30. [Google Scholar] [CrossRef]
Figure 1. User story for Qualitative Content Analysis in empirical social research.
Bdcc 08 00011 g001
Figure 2. Data transformation and user empowerment as AI and ML application principles.
Bdcc 08 00011 g002
Figure 3. AI2VIS4BigData user empowerment applications.
Bdcc 08 00011 g003
Figure 4. Use context diagram for categorized research data exploration.
Bdcc 08 00011 g004
Figure 5. Use case diagram for “Consume Dashboard Recommendations”.
Bdcc 08 00011 g005
Figure 6. Conceptual architecture of the ML-based Text Categorization component.
Bdcc 08 00011 g006
Figure 7. UI and UX concept of the ML-based Text Categorization Component.
Bdcc 08 00011 g007
Figure 8. Conceptual architecture of the expert system-based Data Visualization component.
Bdcc 08 00011 g008
Figure 9. UI and UX concept of the expert system-based Data Visualization component.
Bdcc 08 00011 g009
Figure 10. Exemplary visualization context-based rule definition for bar charts.
Bdcc 08 00011 g010
Figure 11. Conceptual architecture of the information system.
Bdcc 08 00011 g011
Figure 12. Data model of the information system.
Bdcc 08 00011 g012
Figure 13. Technical architecture of the information system.
Bdcc 08 00011 g013
Figure 14. Communication architecture of the information system.
Bdcc 08 00011 g014
Figure 15. UI/UX concept implementation of the Text Categorization component.
Bdcc 08 00011 g015
Figure 16. UI/UX concept implementation of the Data Visualization component.
Bdcc 08 00011 g016
Figure 17. Overview of the quantitative evaluation.
Bdcc 08 00011 g017
Figure 18. Overview page for evaluation.
Bdcc 08 00011 g018
Figure 19. Task completion time for the Text Categorization component.
Bdcc 08 00011 g019
Figure 20. Task completion time for the Data Visualization component.
Bdcc 08 00011 g020
Figure 21. Processing errors for the Text Categorization component.
Bdcc 08 00011 g021
Table 1. Use case “Consume Dashboard Recommendation”.
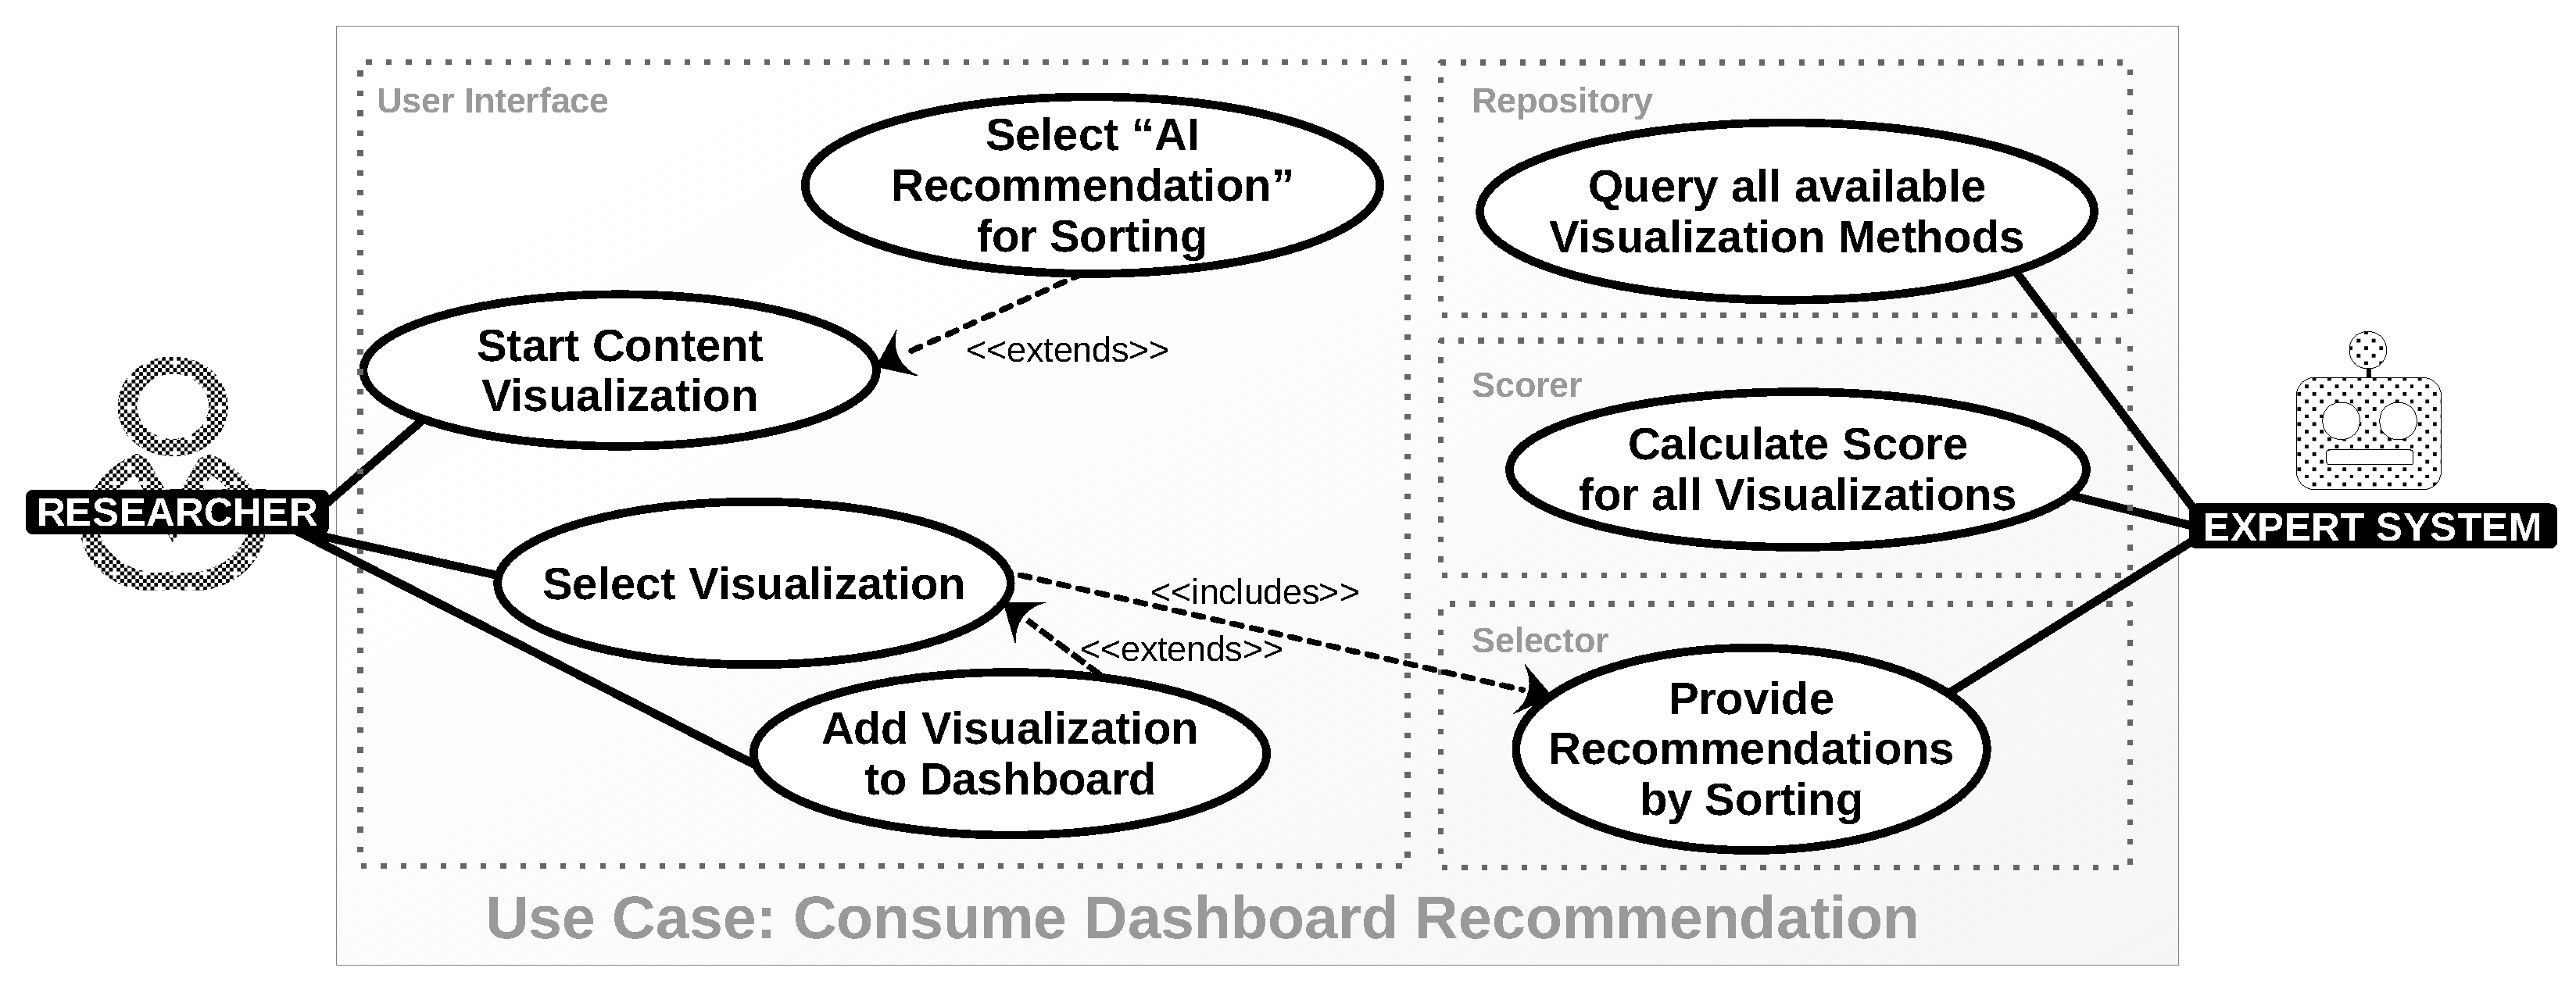
Use Case: Consume Dashboard Recommendation
Brief DescriptionCommunicate AI-created recommendations regarding visualization methods that are suitable for the present data via the system’s user interface.
ActorsResearcher (end user), Expert System
TriggerEnd user chooses to start the content visualization (button in the system’s UI).
PreconditionsThere is at least one visualization method in the system. There is at least one scoring rule in the system. The system has categorized data upon which the recommendation can be applied.
ResultsVisualization methods in the system’s UI are sorted according to the expert system’s recommendation and communicated as such to the end user.
Sequence DescriptionCreate recommendations by the expert system. Then start end-user activities: Start Content Visualization. Select “AI Recommendation” for Sorting (if not selected). Select available visualization. Add it to the dashboard.
Table 2. Cognitive walkthrough results for two probands with tasks for the researcher user stereotype.
TaskEvaluation
DescriptionRequired ActionsIdentified Actions (Avg.)Problems (Total)Problem Rate
(1) Perform a registration53240%
(2) Categorize text data32133%
(3) Visualize categorized data86225%
(4) Respond to an integrated survey54120%
Total2115625.6%
Table 3. User tasks for evaluating the implemented system.
Text Categorization ComponentData Visualization Component
Task:Categorize newspaper articles.Create visualizations to answer given questions.
AI support:AI-created category recommendations are provided to the user.AI selects ten of 25 visualizations as most suitable for the user.
Simulated AI failure:AI recommends wrong category.Non-recommended visualizations are required to answer a certain question.
Disclaimer/Publisher’s Note: The statements, opinions and data contained in all publications are solely those of the individual author(s) and contributor(s) and not of MDPI and/or the editor(s). MDPI and/or the editor(s) disclaim responsibility for any injury to people or property resulting from any ideas, methods, instructions or products referred to in the content.

