Systematic Review

Bias and Unfairness in Machine Learning Models: A Systematic Review on Datasets, Tools, Fairness Metrics, and Identification and Mitigation Methods

by
Tiago P. Pagano
1,
Rafael B. Loureiro
1,
Fernanda V. N. Lisboa
2,
Rodrigo M. Peixoto
3,
Guilherme A. S. Guimarães
3,
Gustavo O. R. Cruz
3,
Maira M. Araujo
2,
Lucas L. Santos
1,
Marco A. S. Cruz
4,
Ewerton L. S. Oliveira
4,
Ingrid Winkler
5 and
Erick G. S. Nascimento
1,6,*
1
Computational Modeling Department, SENAI CIMATEC University Center, Salvador 41650-010, BA, Brazil
2
Computing Engineering Department, SENAI CIMATEC University Center, Salvador 41650-010, BA, Brazil
3
Software Development Department, SENAI CIMATEC University Center, Salvador 41650-010, BA, Brazil
4
HP Inc. Brazil R&D, Porto Alegre 90619-900, RS, Brazil
5
Management and Industrial Technology Department, SENAI CIMATEC University Center, Salvador 41650-010, BA, Brazil
6
Surrey Institute for People-Centred AI, School of Computer Science and Electronic Engineering, Faculty of Engineering and Physical Sciences, University of Surrey, Guildford GU2 7XH, UK
*
Author to whom correspondence should be addressed.
Big Data Cogn. Comput. 2023, 7(1), 15; https://doi.org/10.3390/bdcc7010015
Submission received: 2 December 2022 / Revised: 16 December 2022 / Accepted: 28 December 2022 / Published: 13 January 2023

Abstract

:
One of the difficulties of artificial intelligence is to ensure that model decisions are fair and free of bias. In research, datasets, metrics, techniques, and tools are applied to detect and mitigate algorithmic unfairness and bias. This study examines the current knowledge on bias and unfairness in machine learning models. The systematic review followed the PRISMA guidelines and is registered on OSF plataform. The search was carried out between 2021 and early 2022 in the Scopus, IEEE Xplore, Web of Science, and Google Scholar knowledge bases and found 128 articles published between 2017 and 2022, of which 45 were chosen based on search string optimization and inclusion and exclusion criteria. We discovered that the majority of retrieved works focus on bias and unfairness identification and mitigation techniques, offering tools, statistical approaches, important metrics, and datasets typically used for bias experiments. In terms of the primary forms of bias, data, algorithm, and user interaction were addressed in connection to the preprocessing, in-processing, and postprocessing mitigation methods. The use of Equalized Odds, Opportunity Equality, and Demographic Parity as primary fairness metrics emphasizes the crucial role of sensitive attributes in mitigating bias. The 25 datasets chosen span a wide range of areas, including criminal justice image enhancement, finance, education, product pricing, and health, with the majority including sensitive attributes. In terms of tools, Aequitas is the most often referenced, yet many of the tools were not employed in empirical experiments. A limitation of current research is the lack of multiclass and multimetric studies, which are found in just a few works and constrain the investigation to binary-focused method. Furthermore, the results indicate that different fairness metrics do not present uniform results for a given use case, and that more research with varied model architectures is necessary to standardize which ones are more appropriate for a given context. We also observed that all research addressed the transparency of the algorithm, or its capacity to explain how decisions are taken.

1. Introduction

Prediction-based decision algorithms are being widely adopted by governments and organizations [1], and are already commonly used in lending, contracting, and online advertising, as well as in criminal pre-trial proceedings, immigration detention, and public health, among other areas [2].
However, as these techniques gained popularity, concerns arose about the bias embedded in the models and how fair they are in defining their performance for issues related to sensitive social aspects such as race, gender, class, and so on [3].
Systems that have an impact on people’s lives raise ethical concerns about making fair and unbiased judgments. As a result, challenges to bias and unfairness have been thoroughly studied, taking into consideration the constraints imposed by corporate practices, legislation, societal traditions, and ethical commitments [4]. Recognizing and reducing bias and unfairness are tough undertakings because unfairness differs between cultures. As a consequence, the unfairness criteria are influenced by user experience, cultural, social, historical, political, legal, and ethical factors [5].
Injustice is “systematic and unfair discrimination or prejudice of certain individuals or groups of individuals in favor of others” [6]. The author also explains that social or statistical biases are frequently to blame for injustice, with the former referring to the disparity between how the world should be and how it really is and the latter to the discrepancy between how the world is and how it is encoded in the system.
A distinction was made between the concepts of bias and unfairness, pointing out that most authors in the field use the two terms interchangeably [7].
The author described justice as a social idea of value judgment—therefore, a subjective concept—that varies among cultures and nations as well as inside institutions such as schools, hospitals, and companies. Bias, on the other hand, is a systematic mistake that modify human behaviors or judgements about others due to their belonging to a group defined by distinguishing features such as gender or age.
As a result, new methodologies from data science, artificial intelligence (AI), and machine learning (ML) are necessary to account for algorithms constraints [8].
The issue becomes more challenging if key technological applications do not yet have ML models associated with the explainability of decisions made, or if those models can only be evaluated by the developers that created them, leaving researchers unable to obtain these explanations and conduct experiments [9]. Obtaining a transparent algorithm is difficult given the millions of parameters analyzed by the machine. Another method is to understand it without knowing each stage of the algorithm’s execution [10].
Because analyzing bias and unfairness combined with model explainability, explainability is included in the research. Explainability entails (1) defining model explainability, (2) devising explainability tasks to understand model behavior and providing solutions to those tasks, and (3) designing measurements to evaluate model performance [11]. Thus, evaluating bias and unfairness tackles these issues directly, much as explainability increases transparency.
Some solutions, such as AIF360 [12], FairLearn [13], Tensorflow Responsible AI [5,14,15] and Aequitas [16] are designed specifically to address bias and unfairness. However, the approach to identifying and mitigating bias and unfairness in ML models is entirely left to the developer, who frequently lacks adequate knowledge of the problem and must also consider aspects of fairness as a key element for the quality of the final model, proving the need for a methodology to assist address the problem [9].
Another issue is that most existing solutions to mitigate bias and unfairness are applied to a specific problem or use case (UC). There are several techniques to recognizing bias and unfairness, known as fairness metrics, and the variety makes it difficult to choose the appropriate assessment criteria for the issue one wishes to mitigate [17,18].
Identifying and separating the vast quantity of visual information in the environment, for example, is an issue in computer vision (CV). Machines can classify objects, animals, and humans using algorithms, optical and acoustic sensors, and other techniques [19]. However, because biases can originate in a variety of ways, such machines may struggle to discern between various faces, skin tones, or races [20]. Typically, this occurs when the context is ignored while developing a model, such as not accounting for user demographics that may be underrepresented in the training data.
Similarly, natural language processing (NLP) applications are essential for the operation of systems that interact with people, such as in tasks like language translation [21] and the automatic removal of offensive comments [22]. Recent techniques use Transformer architectures to understand implicit meanings through long sentences [23]. Nevertheless, one major problem with such models is the propagation of social and representational biases propagated by a negative generalization of words that should not contain a harmful meaning general context, such as Gender identities like gay or woman [24,25].
Recommendation Systems (RecSys) are already prevalent in daily life through catalog streaming systems and the user’s perception of product order in online retailers. These programs fall under the category of rankers, whose job it is to determine the existing preferences in the input and produce a list of suggestions as output [26]. Their method of learning necessitates qualitative interactions between consumers and products in order to assess a specific product or service, as in a ’likes’, and ’dislikes’ system, for example. Recommender systems in Amazon’s catalogs profile customers, mapping their interests to present related products [27]. Another feature of RecSys is the ability to relate similar profiles, understanding that if one user has positively rated a product, another similar user is likely to give that item a positive rating. However, such systems depend on huge amounts of historical data, which might contain unrealistic training samples or reflect historical inequalities [28]. Furthermore, biased systems that favor particular groups might produce vicious cycles for recommendations and strengthen negative biases.
Despite these concerns, according to our knowledge, there is no recent review on this topic. Other reviews did not specify a recent timeframe [29,30,31,32,33,34,35], allowing for surveys that are now outdated. Our review, on the other hand, excluded studies that were published before 2017, so that we could give a more up-to-date examination at bias and unfairness in machine learning models. As demonstrated in Figure 1, there was an increase in publications in 2018 compared to previous years; consequently, research conducted after this time should provide more recent overviews correlating with the most effective and less embryonic solutions to the issue.
Some works only addressed datasets for bias and unfairness research, without diving into mitigating issues [29]. In addition, there is more unpacking of mitigating features [33], but the focus is on data management, stressing the unfairness problems for this domain in comparison to the others provided. While there were primary focus on classification problems [30], emphasizing that other techniques should emerge in the coming years, research on algorithmic fairness concentrates on single classification tasks [34], a finding that was also identified by our review; however, the authors do not go into detail on bias mitigation methods. Additionally, Suresh and Guttag [35] does not relate to recent works, with just one article from 2019 and all others before this date.
In certain cases, a more simplified analysis of fairness metrics and mitigation techniques was performed, without addressing issues related to reference datasets for studies in the field [32]. Mehrabi et al. [31] emphasizes the need for fairness by providing examples of potential consequences in the actual world, and examines the definitions of fairness and bias offered by researchers in other domains, such as general machine learning, deep learning, and natural language processing, albeit the strategy for selecting the articles was not provided. The algorithmic bias literature was also examined by Kordzadeh and Ghasemaghaei [18], but solely on theoretical issues of fairness. According to the authors, the processes through which technology-driven biases transfer into judgments and actions have largely gone unnoticed. The authors also include definitions for how a context classifies, which might be person, task, technological, organizational, or environmental, and can impact the model’s perceptual and behavioral expressions of bias. The study considers the behavior of persons touched by model decisions in order to use it as an influencing factor in model decisions.
On the other hand, our review concentrated on extracting the concepts and techniques presented during the era when the topic was most widely discussed within the scientific community. We focused on methods of bias and unfairness identification and mitigation for ML technologies, including fairness metrics, bias mitigation techniques, supporting tools, and more common datasets, with work addressing bias and unfairness identification and mitigation with binary and multiclass targets. The development of each of these characteristics will be covered in the sections that follow.
Thus, this study examines the current knowledge on bias and unfairness in machine learning models.
This work is organized as follows. In Section 2, we describe the research method and the advantages of using systematic reviews. In Section 3, we examine the results and addresses elements such as the types of bias, the identified datasets, the fairness metrics for measuring the models’ bias and unfairness in different ways, and how to approach the techniques and models for bias and unfairness mitigation, either by manipulating the data (preprocessing), the model itself (in-processing) or the prediction (postprocessing). In Section 4, we compare techniques, case studies, datasets, metrics, and application. In Section 5, we present our final considerations and suggestions for further research.

2. Methods

A systematic review (RS) aims to consolidate research by bringing together elements for understanding it [4]. Systematic reviews are a widely used method to gather existing findings into a research field [36].
This systematic review followed the preferred reporting items for systematic reviews and meta-analyses (PRISMA) guidelines [37] (Supplementary Materials) and was conducted using a method which encompasses five steps: planning, scoping, searching, assessing, and synthesizing [38,39]. This study is registered on open science framework, number https://osf.io/q3h2a accessed on 2 December 2022.
To assess the risk of bias in the included studies, as per PRISMA item five establishes [37], the preliminary search strategy was designed by a team of five machine learning model researchers. Then, the candidate strategy was peer-reviewed by three senior ML researchers. The developed method is explained in the following sections.
During the planning step, the knowledge bases that will be explored are defined [39]. The search for document patents was undertaken in the following knowledge bases:
These bases were chosen because they are reliable and multidisciplinary knowledge databases of international scope, with comprehensive coverage of citation indexing, allowing the best data from scientific publications.
The scope definition step ensures that questions relevant to the research are considered before the actual literature review is carried out [39]. A brainstorming session was held with an interdisciplinary group composed of eleven experts on machine learning models, which selected two pertinent research questions to this systematic review address, namely:
Q1: What is the state of the art on the identification and mitigation of bias and unfairness in ML models?
Q2: What are the challenges and opportunities for identifying and mitigating bias and unfairness in ML models?
The literature search step involves exploring the databases specified in the planning step in a way that aims to solve the questions defined in the scope [39].
Initially, the keywords were used to search the knowledge bases noted in Figure 2. In addition to studies on bias or sensitive attributes using fairness or mitigation strategies for machine learning, it should include studies using the AIF360, Aequitas or FairLearn tools for ML. This inclusion in the initial search aims to relate tools for identifying and mitigating bias and unfairness to the optimized search criteria, including the most important tools in the literature. These criteria defined the initial search, with 99 publications selected. Only review works, research, and conferences were considered.
These works were used to optimize the search criteria using the litsearchr [40] library, which assembles a word co-occurrence network to identify the most relevant words. The optimized search yielded 16 selected works, which can also be seen in Figure 2.
In addition, a Google Scholar search was performed, and 29 publications were selected based on their title and abstract fields. The search was based on the string used in the databases, applying the same keywords in the advanced search criteria, as can be seen in Figure 2. The search in Google Scholar aims to select works that might not have been indexed in the knowledge bases.
The assessing the evidence base step selects the most relevant articles based on bibliometric analysis and reading the article abstracts.
Initially, searches in the four knowledge bases retrieved 128 articles, with the fields title, abstract, and keywords serving as search criteria, as can be seen in Figure 3. Only review articles, research articles, and conference proceedings published between 2017 and 2022 were included, as shown by the bibliometric analysis in Figure 1. The black line indicates the number of references each year, and the red line represents the average difference in the number of articles over the previous five years, with a decrease in the final year due to the time span covered by the search.
The relationship between the keywords obtained in the search was plotted using the biblioshiny tool [41], from the bibliometrix package [42] in the R programming language. Figure 4 illustrates some clusters that exemplify themes addressed in the SR works. The red cluster relates to “machine learning” and decision-making in models, the green cluster considers fairness and its economic and social impacts. It is worth highlighting aspects related to transparency, interpretability, and the relationship of these keywords with the state of the art.
The 128 works were screened for their abstracts, identifying key aspects that relate to the proposed research, and were thus selected as important for the present work. Each work was screened by three reviewers, which annotated key aspects to be discussed among each other and decide whether the work was eligible.
As a result of the final search, 45 articles were selected for discussion as shown in Figure 2.
The synthesis and analysis step consists of reading and evaluating the selected articles to identify patterns, differences, and gaps that might be studied in future research on bias and unfairness in machine learning models.

3. Results

In this section, we present and analyze the 45 selected studies, which are included in Table 1, according to the research questions Q1 and Q2 set in the scope definition step. The results are organized into five sections: types of bias, identified datasets, mitigation techniques and models, technique for identification of the sensitive attribute, and fairness metrics. Those sections represent fundamental aspects of the discussion of bias and fairness.
The studies revealed issues that support concerns about bias and impartiality in ML models. One work addressed issues such as the lack of transparency of ML models, organizations such as Facebook and Telegram’s lack of commitment to disclose the steps being taken and even the limitations, whether human or computer [9]. The authors also criticize the complexity of understanding ML models, which can only be examined by the team that developed them, and which often does not understand most of the features and judgments of the model. Moreover, the more complex the model, the more difficult it is to analyze its decision-making process. At the same time, the importance of responsible AI is highlighted [6], although there is still no clear and globally accepted definition of responsibility for AI systems. This should include fairness, safety, privacy, explainability, security, and reproducibility.
The authors of Mitchell et al. [2] corroborates the argumentation of Ammar [9], emphasizing that when dealing with people, even the finest algorithm will be biased if sensitive attributes are not taken into consideration. One of the first issues raised is that bias and fairness literature is often confined to addressing the situation of a group or individual experiencing unfairness in the present time. In this case, one must broaden the search and analyze how the individual’s effect impacts his or her community and vice versa. Dataset and people behavior is fluid and can diverge dramatically over a few years, but the algorithm may retain a bias in its training and be unable to adapt to this shift. A group that is mistreated in the actual world would almost certainly be wronged by the algorithm, and that this type of bias just reflects reality rather than being a biased dataset.
Transparency in machine learning models, defining bias and fairness is extremely difficult to obtain, given the millions of parameters analyzed by a machine [10]. Transparency must be analyzed and understood without having to understand every step taken by the algorithm. To define transparency, two categories have been defined: process transparency and result transparency [10]. The term process transparency refers to an understanding of the underlying characteristics of the algorithm, such as the attributes it weighs in its decisions. The term results transparency refers to the ability to understand the decisions and patterns in the responses of the classification process. In addition, the model must meet two requirements: global and local explanation. Local explanation includes a detailed examination of which features were most important in arriving at a particular decision, while global explanation evaluates all decisions based on certain metrics. The author suggests a mental model of the main system for this evaluation, and if he can predict what the rating of the main model is, he is on the correct path to transparency. Finally, models can contain implicit and explicit features, in the chaos of being white-box or black-box, making it easier for auditors [10].
Also in an attempt to elucidate these issues, security and transparency issues with automated decision systems are addressed and data engineers are warned and urged to develop a more fair and inclusive procedure [73]. For the authors, automated decision systems must be responsible in areas such as development, design, application and use, as well as strict regulation and monitoring, so as not to perpetuate inequality.
Regulation should emphasize obligations to “[...] minimize the risk of erroneous or biased decisions in critical areas [...]” [6], such as education and training [47,55], employment [46,68], important services [77], law enforcement, and the judiciary [43,47,58]. The author points out that fairness in recommender systems [6,27] requires a variety of methodologies and studies, the most essential factors being gender, age, ethnicity, or personality.
A systemic overview addresses recent criteria and processes in the development of machine learning and conduct empirical tests on the use of these for credit scoring [77]. The authors selected the fairness metrics that best fit these scores and cataloged state-of-the-art fairness processors, using them to identify when loan approval processes are met. Using seven credit score datasets, they performed empirical comparisons for different fairness processors.
ML models, whether classification or regression, can be of type white-box or black-box, depending on their availability and constraints:
  • White-box: these are machine learning models that deliver easy-to-understand outcomes for application domain specialists. Typically, these models provide a fair balance between accuracy and explainability [78] and hence have less constraint and difficulties for structural adjustments. The structure and functioning of this model category are simple to grasp.
  • Black-box: ML models that, from a mathematical perspective, are extremely difficult to explain and comprehend by specialists in practical areas [78]. Changes to the structure of models in this category are restricted, and it is difficult to grasp their structure and functioning.
Some works examine the use or nonuse of ML models for decision-making, emphasizing the existence of advantages and disadvantages, assisting in strategic governance aspects with concern about ethical aspects to the use of sensitive attributes of individuals [1,7,43,46,57,71,72].
There is a concern about a model that uses automated video interviews to assess patients’ personalities [46]. If men score higher than women, this could be considered a bias; on the other hand, if the concordance notes indicate higher scores for men than for women, the model reproduces this pattern and cannot be considered biased. There is an ambiguity that the model would be fair because its measures reflect observable reality and simultaneously unfair because it gives unequal results to the group. This confusion occurs because of the lack of knowledge about identifying the group bias of the model, which uses right and wrong prediction criteria on the target provided by the data set. Therefore, the right and wrong rates of the model should be the same for different groups.
With a similar concern, there is opposition on the use of models for decision-making [43], defining the use of tools for risk assessment in models for prejudgment as a justification. The authors argue that the implementation of these tools can introduce new uncertainties, disruptions, and risks into the judgment process. By conducting empirical experiments with unfair models, the authors conclude that the process of implementing these tools should be stopped.
Furthermore, while there are various fair models for classification tasks, these are restricted to the present time, and because they embed the human bias, there is a propensity to repeat and escalate the segregation of particular groups through a vicious cycle [57]. Whereas a classifier that gives a group a higher number of good ratings will give it an advantage in the future, and vice versa for negative ratings. Meanwhile, claims were also made that algorithms frequently disregard uncommon information [9], framing the act as censorship, such as Islamism and terrorist content. Because of this issue, decision-making algorithms tend to be biased toward more common occurrences in their case-specific databases.
Finally, the perspectives of various experts were presented by the authors of Ref. [1], emphasizing opportunities from the usage of AI, evaluating its impact, challenges, and the potential research agenda represented by AI’s rapid growth in various fields of industry and society in general. Tastes, anxieties, and cultural proximity seem to induce bias in consumer behavior, which will impact demand for AI goods and services, which is, according to the study, an issue that is yet under research. Inferring patterns from large datasets in an unbiased environment and developing theories to explain those patterns can eliminate the need for hypothesis testing, eradicating the bias in the analysis data and, consequently, in the decisions.
The literature address general issues around ML, where governments are increasingly experimenting with them to increase efficiency in large-scale personalization of services based on citizen profiles, such as predicting viral outbreaks and crime hotspots, and AI systems used for food safety inspections [1]. Bias in this context implicates governance issues, which pose dangers to society because algorithms can develop biases that reinforce historical discrimination, and undesirable practices, or result in unexpected effects due to hidden complexities. Other related themes include ethics, transparency and audits, accountability and legal issues, fairness and equity, protection from misuse, and the digital divide and data deficit. The discussion should expand to include technology diplomacy as a facilitator of global policy alignment and governance, for developing solutions to avian flu, for example [71]. It also discusses the importance of implementing fundamental ethical concepts in AI, such as beneficence, nonmaleficence, decision-making, fairness, explainability, reliable AI, suggested human oversight, alternative decision plans, privacy, traceability, nondiscrimination, and accountability.
Finally, there is key concern about data privacy, as well as other ethical challenges related to big data research, such as transparency, interpretability, and impartiality of algorithms [72]. It is critical to explore methods to assess and quantify the bias of algorithms that learn from big data, particularly in terms of potential dangers of discrimination against population subgroups, and to suggest strategies to rectify unwarranted bias. It also addresses the difference between individual fairness and group fairness, where the former states that individuals who are similar except for the sensitive attribute should be treated similarly and receive similar decisions.
This issue relates to the legal concept of unequal treatment when the decision-making process is based on sensitive attributes. However, individual fairness is only relevant when the decision-making process causes discrimination and cannot be used when the goal is to address biases in the data. Group fairness, on the other hand, depends on the statistics of the outcomes of the subgroups indexed in the data and can be quantified in various ways, such as DP and EO metric, and thus can have bias addressed in the data [72]. Group fairness considers that groups contain useful information to adjust predictions, making them more accurate, highlighted that the metrics statistical parity, group fairness, and adverse impact are all concerned with equality of acceptance rates across groups [7].

3.1. Types of Bias

Pre-existent bias exist independently of an algorithm itself and have their origin in society, referring to the data that reflect the inequalities absorbed by the algorithm [73]. Technical bias, on the other hand, occurs due to the systems developed, and can be treated, measured, and its cause understood, as to internal decision processes of the algorithm. He also defined the so-called emergent type of bias, which occurs when a system is designed for different users or when social concepts change. For example, if a manager assigns higher performance to male employees, it is likely that the algorithm will start favoring them and/or incorrectly ranking women in the same division of the organization.
Bias can be classified into data bias, algorithm bias, and user interaction [31]. The first considers that bias is present in the data, such as unbalanced data, for example. The second one addresses the bias caused exclusively by the algorithm, caused by optimization functions, and regularization, among other causes. The third type of bias is caused by the interaction with the user since the interface allows it to impose his/her behavior for a self-selected biased interaction.
Iterated algorithmic bias, which is a feature of RecSys, is defined as filtering bias, active learning bias, and random-based bias. The first occurs when the goal is to provide relevant information or preferences [52]. The second occurs when it aims to predict the user’s preferences. The last one is based on an unbiased approach and used as a baseline for no user preference.
Going further in this concept, the 23 most common sources of bias are listed and divided into three categories organized in order to consider the feedback loop, they are: data, algorithm, and user interaction [31]. Here are some examples of biases:
  • Historical and social: coming from the data;
  • Emerging and popularity: coming from the algorithm;
  • Behavioral and presentation bias: caused by interaction with the user.
A framework is proposed to analyze bias and concluded that filtering bias, prominent in personalized user interfaces, can limit the discoverability of relevant information to be presented [52]. In addition, they address the importance and damage caused by feedback loops and how algorithm performance and human behavior influence each other by denying certain information to a user, impacting long-term performance.
Another work proposed a methodology to identify the risks of potentially unintended and harmful biases in ML [45]. The authors, therefore, developed a practical risk assessment questionnaire to identify the sources of bias that cause unfairness and applied it to cases such as criminal risk prediction, health care provisions, and mortgage lending. The questionnaire was validated with industry professionals, and 86% agreed it was useful for proactively diagnosing unexpected issues that may arise in the ML model. Note that this work allows you to identify causes that may theoretically bias the models.

3.2. Identified Datasets

A survey of the datasets used in the works was conducted, listed in Table 2. These datasets mostly are known to include demographic annotations, allowing for assessing unfairness and bias in their data, and can be used to test and validate techniques aimed at resolving these issues. Other datasets do not have demographic data, as it aims to identify bias and unfairness in image generation, reconstruction, enhancement, and super-resolution, not necessarily associated with demographic sensitive issues [44]. Some datasets address crime-related issues such as Propublica Correctional Offender Management Profiling for Alternative Sanctions (COMPAS), Communities and Crime (Communities), and Florida Department of Corrections (FDOC).
The COMPAS [79] dataset describes a binary classification task, which shows whether an inmate will re-offend within two years, has sensitive attributes such as race, age, and gender. This is one of the most widely used datasets for bias and fairness experiments, with a controversial and relevant topic.
Similar to COMPAS, the Communities dataset [80] compares socioeconomic situations of US citizens in the 1990s and crime rate, identifying the per capita rate of violent crime in each community.
The FDOC [62] dataset, on the other hand, contains sentences with the types of charges, which can be violent charges (murder, manslaughter, sex crimes, and other violent crimes); robbery; burglary; other property charges (including theft, fraud, and damage); drug-related charges; and other charges (including weapons and other public order offenses). The dataset uses Florida Department of Law Enforcement (FDLE) criminal history records for recidivism information within 3 years. They have the attributes such as the major crime category, the offender’s age of admission and release, time served in prison, number of crimes committed prior to arrest, race, marital status, employment status, gender, education level, and if recidivist whether they were supervised after release.
Addressing issues concerning the selection process and approval of individuals, the Student [81] dataset has the data collected during 2005 and 2006 in two public schools in Portugal. The dataset was built from two sources: school reports, based on sheets of work including some tributes with the three grades of the period and number of school absences; and questionnaires, used to complement the previous information. It also includes demographic data with mother’s education, family income, social/emotional situation, alcohol consumption, and variables that can affect student performance.
Another theme found in the selected datasets involves financial issues of bank credit such as Bank marketing (Bank), German credit (German), and Credit. Wage forecasting was found with the Adult dataset and product pricing was found with the Boston housing price (Boston) dataset.
The Bank dataset is related to the marketing campaigns of a Portuguese bank between the years 2008 to 2013. The goal of the classification is to predict whether a customer will make a deposit subscription [50].
Similarly, the German [80] dataset has 1000 items and 20 categorical attributes. Each entry in this dataset represents an individual who receives credit from a bank. According to the set of attributes, each individual is evaluated on his or her credit risk.
The Credit [82] dataset, on the other hand, contains payment data from a Taiwanese bank (a cash and credit card issuer) for identifying the bank’s credit card holders who would potentially receive a loan, including demographic annotations such as education level, age, and gender.
One of the most prominent datasets, Adult [80] includes 32,561 full cases representing adults from the 1994 US census. The task is to predict whether an adult’s salary is above or below $50,000 based on 14 characteristics. The sensitive attribute ’gender’ is embedded in the samples.
For real estate pricing, the Boston dataset has data extracted from the Boston Standard Metropolitan Statistical Area (SMSA) in 1970 and each of the 506 samples represents data obtained on 14 characteristics for households. The classification of this model aims to predict the property value of the region using attributes such as crime rate, proportion of residential land, and average number of rooms per household, among others [76].
The datasets found also highlights applications in the health domain, either to predict patients’ financial expenses, as in the dataset Medical Expenditure Panel Survey (MEPS), or to identify possible health risks for patients as in the datasets: MEPS, Heart Disease (Heart), Multiparameter Intelligent Monitoring in Intensive Care (MIMIC II), Weight, and Drugs.
The MEPS [83] dataset contains data on families and individuals in the United States, with their medical providers and employers, with information on the cost and use of health care or insurance.
To identify and prevent diseases, the Heart [76] dataset contains 76 attributes, but all published experiments refer to the use of a subset of 14 of them. The target attribute refers to the presence of heart disease in the patient and can be 0 (no presence) to 4. Experiments aim to classify the presence or absence of heart disease.
Similarly to Heart, the MIMIC II [54] dataset contains vital signs captured from patient monitors and clinical data from tens of thousands of Intensive Care Unit (ICU) patients. It has demographic data such as patient gender and age, hospital admissions and discharge dates, room tracking, dates of death (in or out of hospital), ICD-9 codes, unique code for healthcare professional and patient type, as well as medications, lab tests, fluid administration, notes, and reports.
The Weight [84] dataset contains data for estimating obesity levels in individuals from the countries of Mexico, Peru, and Colombia, based on their eating habits and physical condition. It has 17 attributes and 2111 samples, labeled with the level of obesity which can be Low Weight, Normal Weight, Overweight Level I, Overweight Level II, Obesity Type I, Obesity Type II and Obesity Type III. The sensitive attributes are gender, age, weight, height, and smoking, among others.
To predict narcotic use, the Drug [85] dataset was collected from an online survey including personality traits (NEO-FFI-R), impulsivity (BIS-11), sensation seeking (ImpSS), and demographic information. The dataset contains information on the use of 18 central nervous system psychoactive drugs such as amphetamines, cannabis, cocaine, ecstasy, legal drugs, LSD, and magic mushrooms, among others, including demographic attributes such as gender, education level, and age group.
In the image enhancement and face recognition domain, bias may not be associated with demographic features, the datasets that have demographic information were identified, among them: Labeled Faces in the Wild (LFW), Large-scale CelebFaces Attributes (CelebA), MORPH Longitudinal Database (MORPH), MovieLens 1M and Visual Question Answering (VQA). The dataset Animal FacesHQ (AFHQ) deals with the identification of animals, and the bias is associated with implicit features of the images, as well as the dataset Correlated and Imbalanced MNIST (CI-MNIST). Synthetic datasets were also found as an alternative.
The LFW [63] dataset contains 13,233 images of faces of 5749 distinct people and 1680 individuals are in two or more images. LFW is applied to face recognition problems and the images were annotated for demographic information such as gender, ethnicity, skin color, age group, hair color, eyeglass wearing, among other sensitive attributes.
The CelebA [86] dataset contains 202,599 face images with 10,177 individuals and 40 annotated attributes per image such as gender, Asian features, skin color, age group, head color, and eye color, among other sensitive attributes, just as LFW is also used for face recognition problems.
The MORPH dataset contains over 400,000 images of almost 70,000 individuals. The images are 8-bit color and sizes can vary. MORPH has annotations for age, sex, race, height, weight, and eye coordinates.
The MovieLens 1M [28] dataset contains a set of movie ratings from the MovieLens website, a movie recommendation service of 1 million reviews from 6000 users for 4000 movies, with demographics such as gender, age, occupation, and zip code, plus data from the movies and the ratings.
The VQA [48] dataset contains natural language questions about images. It has 250,000 images, 760,000 questions, and about 10 million answers. The questions have a sensitive criterion from the point of view of the questioner and can be a simple question or a difficult one, creating a bias. The images can also be very complex, making it difficult to identify the question element. The VizWiz dataset has the same proposal as the VQA for object recognition and assistive technologies, collected from users with visual impairment. CLEVR has a similar proposal to VQA and VizWiz but was generated automatically by algorithms containing images with three basic shapes (spheres, cubes, and cylinders) in two different sizes (small and large) and eight different colors and includes questions and answers with the elements contained in the images. The combination of VQA, VizWiz, and CLEVR gave origin to another dataset of questions and answers, annotated with the sensitive attribute of the visual conditions of the user who asked the question, which could be normal vision, visually impaired, or robot.
The AFHQ [44] dataset consists of 15,000 high-quality images of animal faces at 512 × 512 resolution. It includes three domains of cat, dog, and wildlife, each providing 5000 images, it also contains three domains and several images of various breeds (larger than eight) for each domain. All images are aligned vertically and horizontally to have the eyes in the center. Low-quality images were discarded. The work by Jalal et al. [44] used only images of cats and dogs.
The CI-MNIST [75] dataset is a variant of the MNIST dataset with additional artificial attributes for eligibility analysis. For an image, the label indicates eligibility or ineligibility, respectively, given that it is even or odd. The dataset varies the background colors as a protected or sensitive attribute, where blue denotes the nonprivileged group and red denotes the privileged group. The dataset is designed to evaluate bias mitigation approaches in challenging situations and address different situations. The dataset has 50,000 images for the training set, 10,000 images for validation and testing, with the eligible images representing 50 percent of each of these. Various background colors, colored boxes added at some top of the image of varying sizes were used to allow the impact of the colors, positions, and sizes of the elements contained in the image to be analyzed.
The dataset might also be generated synthetically [67] using a normal distribution of the data. It created an attribute that was binary-sensitive and had the Bernouilli distribution.
The use of the datasets examined in this Section can be seen in the Section 3.5 associated with mitigation techniques.

3.3. Fairness Metrics

Machine learning models increasingly provide approaches to quantify bias and inequality in classification operations as a methodology for measuring bias and fairness [57]. While many metrics have been developed, when it comes to long-term decisions, the models and scientific community have produced poor outcomes. Some existing metrics for measuring model bias are insufficient, either because they only evaluate the individual or the group, or because they are unable to predict a model’s behavior over time. The authors offer the metric DP as a solution, which, when applied to a model, ensures that the average classification of individuals in each group converges to the same point, achieving a balance between accuracy, bias, and fairness for the groups classified by the model.
One of the metrics used to evaluate the model was DP, which assures that decisions are unrelated to sensitive attributes [58]. EO metric was used to guarantee parity between positive and negative evaluations, and Equality of Opportunity metric was employed to ensure that individuals meet the same criteria and are treated equally. Each of these metrics assures that groups are treated fairly and that the model’s quality does not deteriorate or become biased over time [57].
The metrics for assessing fairness should apply the same treatment to multiple groups; however, if one of the metrics identifies bias, other metrics can charge that the model is fair.
Five metrics for assessing fairness were established from the review of the works: EO, Equality of Opportunity, DP, Individual Differential Fairness, and MDFA.
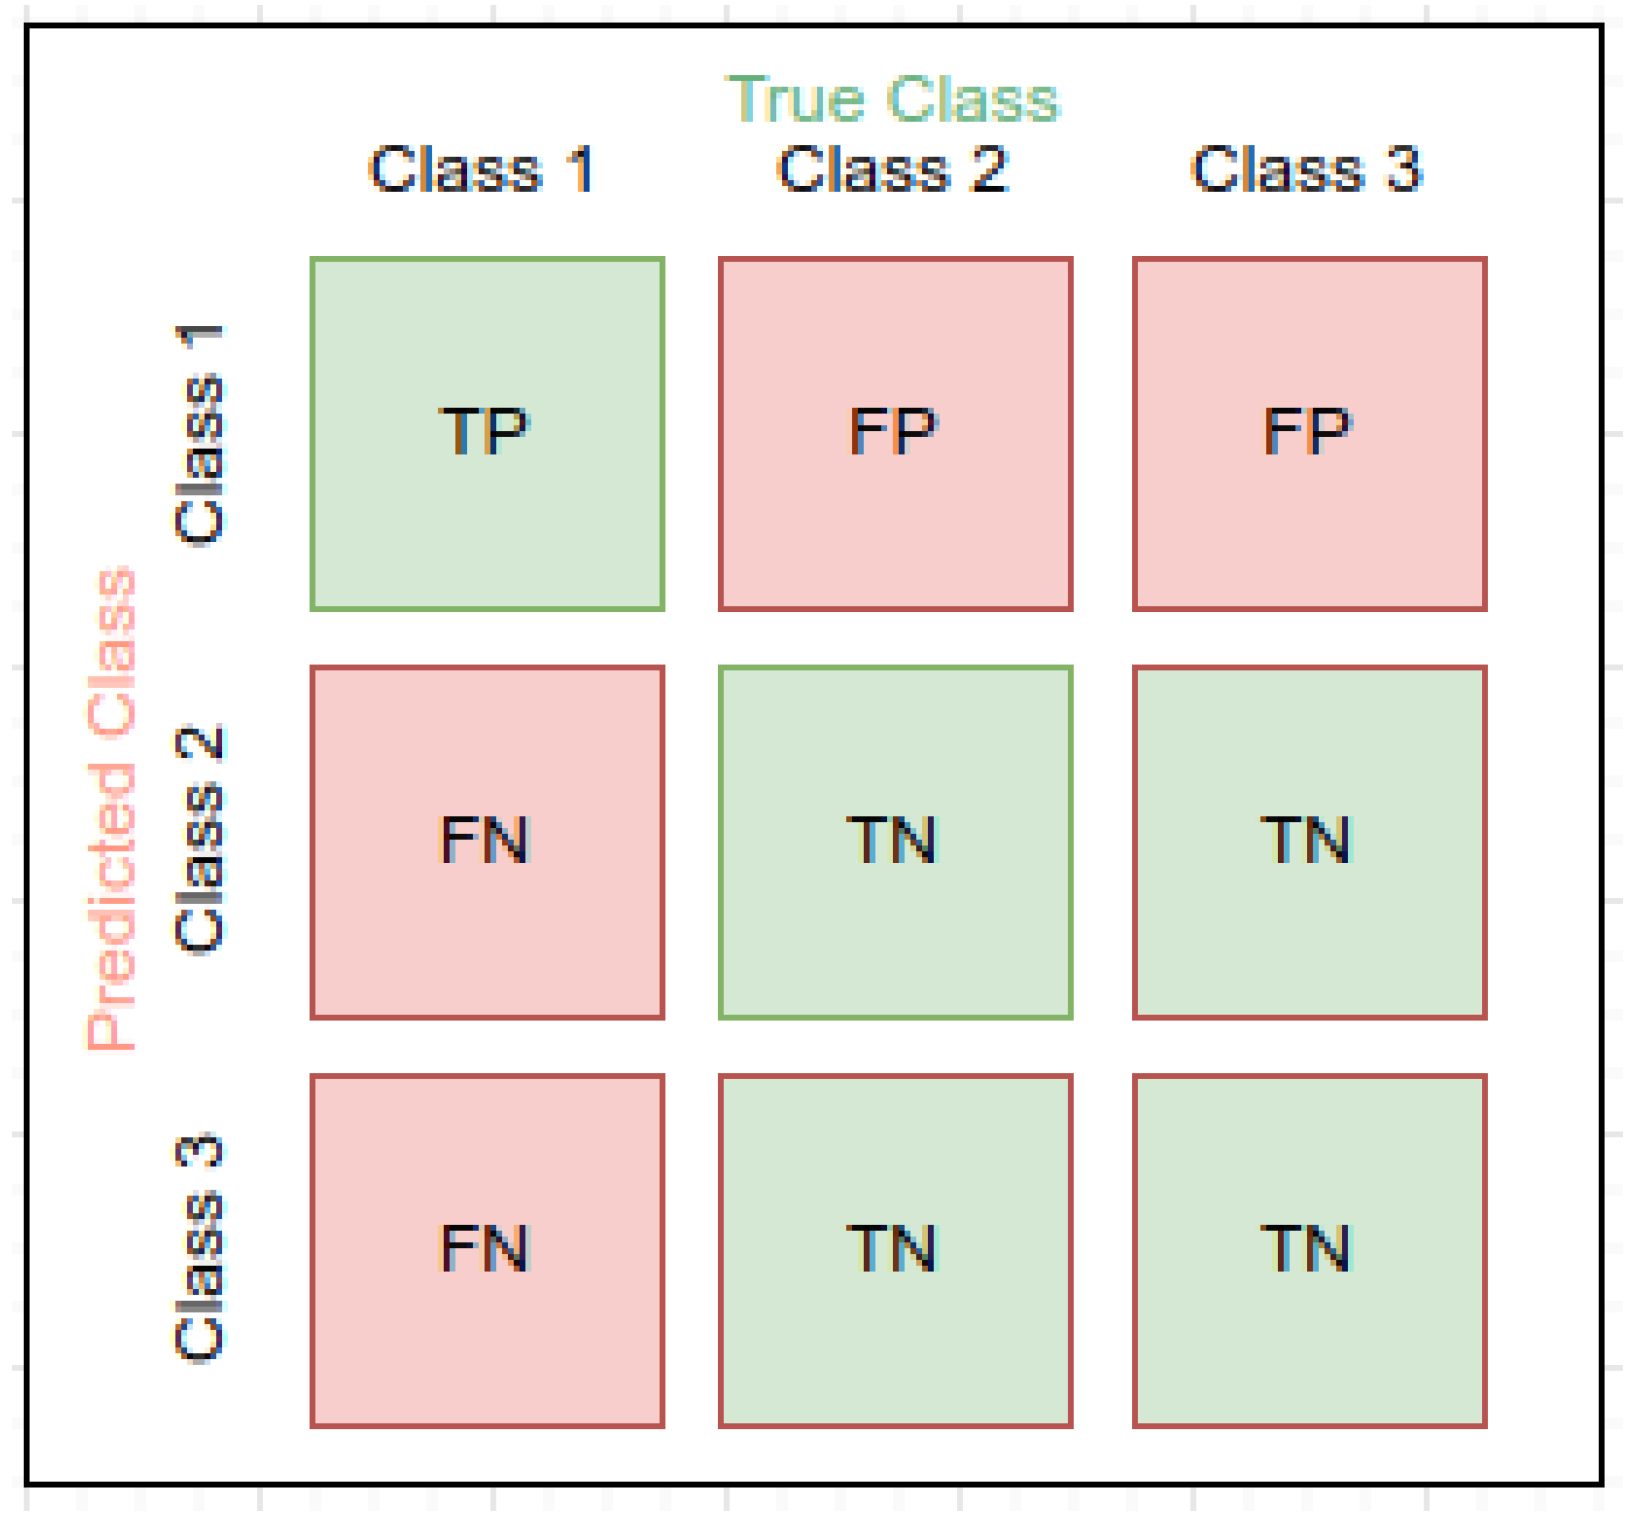
As a basis for the fairness metrics, it is important to define true positive (TP), false positive (FP), true negative (TN), and false negative (FN). These values are obtained from the rights and wrongs of the model’s prediction relative to the target or ground truth provided by the dataset. Positive values are defined as the positive class that the model should predict, as opposed to negative values. For example, if the model should predict whether an individual will reoffend, the positive class will be 1, which indicates that the individual will reoffend, and the negative class will be 0. Therefore, if the positive classes are correct, they will be computed in TP, while the errors will be computed in FP. On the other hand, hits for negative classes will be computed in TN and errors in FN.
For a multiclass problem there is no positive and negative class, just consider the values for each individual class, observe Figure 5.
In the example, the scenario for calculating the values of Class 1 is illustrated, TP is the value of the correct prediction, consistent with the target. The TN are the sum of the classes that do not involve Class 1, neither in the prediction nor in the target. The FP is the sum of the classes falsely predicted as Class 1, while the FN are the sum of the classes predicted as other classes that should have been predicted as Class 1.
This process should be performed for all classes and the overall TP, FP, TN, and FN of the model should be averaged over the individual values.
To understand the fairness metrics, which use the TP, FP, TN, and FN, the statistical metrics must also be defined as per Table 3.
The objective of the metric EO is to ensure that the probability that an individual in a positive class receives a good result and the probability that an individual in a negative class wrongly receives a positive result for the protected and unprotected groups are the same. That is, the TPR and FPR of the protected and unprotected groups must be the same [31].
E O = 1 2 | F P p F P p + T N p F P u F P u + T N u | + | T P p T P p + F N p T P u T P u + F N u |
In contrast, the metric Equality of Opportunity must satisfy equal opportunity in a binary classifier (Z). As a result, the probability of an individual in a positive class receiving a good outcome must be the same for both protected and unprotected groups. That is, the TPR for both the protected and unprotected groups must be the same [31].
E O O = T P p T P p + F N p T P u T P u + F N u
According to the fairness metric Demographic Parity (DP), also known as Statistical Parity, the probability of an outcome being positive [31]. For this, the formula below should be applied.
D P = T P + F P N
The Disparate Impact (DI) fairness metric compares the proportion of individuals who receive a favorable outcome for two groups, a protected group and an unprotected group. This measure must equal to 1 to be fair.
D I = T P p + F P p N p T P u + F P u N u
The K-Nearest Neighbors Consistency (KNNC) fairness metric, on the other hand, is the only individual fairness metric used by the authors of Ref. [64]; it measures the similarity of sensitive attribute labels for similar instances [50].
K N N C = 1 1 n i = 1 n y ^ i 1 k j N k ( x i ) y ^ j
Different metrics were used as fairness metrics by the authors of Ref. [64], including Absolute Balanced Accuracy Difference (ABAD), Absolute Average Odds Difference (AAOD), Absolute Equal Opportunity Rate Difference (AEORD) and Statistical Parity Difference (SPD). The Differences metrics are calculated from the difference of the ’Disparity’ metrics between two classes.
The ABAD is the difference in balanced accuracy in protected and unprotected groups, defined by Equation (6).
A B A D = 1 2 T P R p + T N R p T P R u + T N R u
The AAOD is the absolute difference in TPR and FPR between different protected groups, defined by Equation (7).
A A O D = F P R u + F N R p T P R u + T P R p 2
AEORD is the difference in recall scores (TPR) between the protected and unprotected groups. A value of 0 indicates equality of opportunity, defined by Equation (8).
A E O R D = T P R p T P R u
Finally, SPD is the difference in SD between a protected and an unprotected group, defined by Equation (9).
S P D = T P p + F P p N p T P u + F P u N u
In addition to fairness metrics, some works use classification metrics such as accuracy, precision, recall and F1-score [48] as criteria for identifying bias. In addition to fairness metrics, some works use classification metrics such as accuracy, precision, recall and F1-score [48] as criteria for identifying bias. Measures of bias linked to the accuracy of model predictions are designed to check for unexpected differences in accuracy between groups. A less accurate prediction for one group compared to another contains systematic error, which disproportionately affects one group over the other [7].
Accuracy is the ratio between the number of true negatives and true positives to the total number of observations. Precision is the proportion of correct positive identifications. Recall is the proportion of true positives correctly identified. The F1-score is the weighted average of Precision and Recall. The formulas for each can be seen in Equations (10)–(13)
a c c u r a c y = T N + T P T N + T P + F N + F P
p r e c i s i o n = T P T P + F P
r e c a l l = T P T P + F N
F 1 - score = 2 r e c a l l p r e c i s i o n r e c a l l + p r e c i s i o n
Other cases used the number of positive (NIP) and negative (NIN) instances as the criteria for fairness metrics, as well as the base rate (BR) also known as prior probabilities are the unconditional probabilities, it is a probability with respect to all samples (N) [50]. The formulas for each can be seen in Equations (14)–(16)
N I P = T P + F P
N I N = T N + F N
B R = N I P / N
All reported fairness metrics can be seen in Table 4.

3.4. Techniques for Bias Analysis

For bias analysis and identification, is proposed a method for models trained with federated learning with the HOLDA architecture, checking the influence of biased individuals on unbiased individuals [49]. Whenever a user updates its internal state by replacing the previous best model, when that model has a better generalization performance on the local validation data, the system evaluates the fairness of that new model. The authors performed an experiment training an ANN with 200 neurons in the hidden layer. The sensitive attribute used was Gender. They concluded that local models trained with unbiased customers have little influence on the model, while biased customers impact the model unfairness. In this way, the biased customers end up influencing the unbiased ones, but local models trained only with an unbiased customer tend to be slightly unfair. The dataset used was Adult and the fairness metrics used were DP, EO, and EOO.
Also aiming to identify unfairness and promote explainability of model decisions, another technique includes a model that combines white-box and black-box features for local and global explanations, respectively [10]. Local explanation involves determining which features contributed the most to the classification of a given data sample, which can be achieved with a visualization tool or algorithm that can simulate and explain the decisions of the original model. In terms of overall explanation, the model decisions perform comparisons with the classifications obtained by each group, using decile risk scores to demonstrate whether there is bias in the model. The experiments were performed with the COMPAS dataset.

3.5. Mitigation Techniques and Models

As previously noted, bias and unfairness mitigation techniques can be of the types: preprocessing, in-processing, and postprocessing. While preprocessing mitigation techniques focus on rebalancing the data, in-processing mitigation focuses on the model and its regularization with a bias correction term in the loss function or implicit in the model as with adversarial networks, where the model predicts the sensitive attribute [6].
The preprocessing mitigation technique aims to alter the dataset in a way that positively impacts the fairness metrics, and FairDAGs library is proposed as an acyclic graph generator that describes the data flow during preprocessing [53]. The purpose is to identify and mitigate bias in the distribution and distortions that may arise with protected groups, while allowing direct observation of changes in the dataset. The four types of treatment are: bias by filtering the data, standardizing missing values, changes in the proportion of the dataset after replacement of NaN values, and, for NLP systems, filtering out extraneous names or words that the computer may not recognize. The results showed that DAG was able to identify and represent differences in the data that occurred during preprocessing, as well as correct imbalances in the datasets examined.
Preprocessing may have a different purpose, such as removing sensitive data from the model for a banking system, ensuring the removal of customer data after the output without affecting the ML model [50]. The goal is the generation of synthetic data from the representation of the original data in order to preserve privacy while maintaining the usefulness of that original data. The synthetic data is generated by the Trusted Model Executor (TME), which is an AIF360 tool. At the end, the bias in the synthetic dataset was evaluated by comparing it with the original datasets in order to validate the TME.
Also using AIF360 to perform preprocessing operations, a study examined that smartwatches distinguish between men and women in the identification of cardiovascular problems, evaluating more characteristics of the former group than the latter [54]. In view of the above, there should be a correction to fit the needs of both genders the removal of sensitive data, with the rebalancing of the dataset distribution and processing operations. It also adjusts nonrepresentative data for accurate assessment of user health. The mitigation technique in preprocessing used was Reweighting. At the end, the Vital-ECG was developed, a watchlike device that detects heart rate, blood pressure, skin temperature and other body variables without distinction of gender and with superior predictions.
Still in the area of data generation, another study generated a new dataset that has no disparity of distribution, quality or noise, ensuring that all classes are treated equally [64]. To do this, it used the VAE-GAN architecture which, although it showed great improvements in model impartiality, the use of synthetic data during training limited its ability to generalize real data, reducing accuracy and precision. To minimize the trade-off, the model trained with artificial data used transfer learning techniques to perform an adjustment of the weights with real data.
In the area of computer vision, face recognition and analysis models generally exhibit demographic biases, even in models where accuracy is high [63]. The reason is usually due to datasets with under-represented categories, whether for identifying identity, gender, or expressions of the human face. Biases can be in relation to age, gender, and skin tone. Therefore, a bias mitigation technique was proposed with a dataset of facial images, where to increase demographic diversity, a style transfer approach using Generative Adversarial Networks (GANs) was used to create additional images by transferring multiple demographic attributes to each image in a biased set. Two literature reviews highlighted preprocessing techniques to mitigate data bias, such as Synthetic Minority Oversampling Technique (SMOTE) and uses Data Augmentation [63,76]. The authors defined open questions on the topic, such as the fact that metrics can be conflicting, indicating a model that is fair in one metric and unfair in another. Also dealing with bias in face recognition, another research assessed the performance of diversity in Lenovo’s internal facial recognition system, named LeFace [70]. The algorithm developed is a semiautomatic data collection, cleaning, and labeling system. The training data is diverse in terms of race, age, gender, poses, lighting, and so on. This data system cleans and labels the face data with an algorithm that evaluates data balancing before applying data augmentation to obtain a balanced training dataset. Furthermore, LeFace employs an attention method to provide balanced data to the network during the training phase. The Racial Faces in the Wild (RFW) database was used to assess the algorithm’s capacity to recognize different races. It is divided into four classes: African, Asian, Caucasian, and Indian.
Also in the domain of computer vision, the authors of Ref. [44] present several intuitive notions of group fairness, applied to image enhancement problems. Due to the uncertainty in defining the clusters, since, for the author, there are no ground truth identities in the clusters, and the sensitive attributes are not well-defined.
Concerning the impacts of fairness metrics on the preprocessing mitigation process, the metric Demographic Parity is strongly dependent on clusters, which is problematic for generating images of people in the data augmentation process, because the classes of the sensitive attribute ’race’ are ill-defined [44]. In CPR, implemented using Langevin dynamics, this phenomenon does not occur, and it can be seen in the results obtained that, for any choice of protected clusters, the expected properties are displayed.
The fairness metrics identified in the works that addressed preprocessing are in Table 5, as are the datasets in Table 6.
The in-processing mitigation technique was identified in a larger number of works [28,55,56,58,59,60,62,65,75].
One study proposes an in-processing solution in the holistic and often subjective methods that may contain biases in the student selection process in schools [55]. From this perspective, learning algorithms capable of admitting a diverse student population were developed, even for groups with historical disadvantages. The study examined the impact of characteristics such as income, color, and gender on student admission rates.
Another in-process mitigation solution for group bias used the logistic regression technique to develop the model [65]. The solution used was Pareto Optimal, which aims to ensure a better accuracy loss function while keeping the fairness metrics at the threshold set at 80%. The author states that the in-processing solution, where the algorithm is adjusted during learning, would be a natural solution, because the preprocessing algorithms would be altering the original data, hurting ethical norms; however, it is possible to work with data balance without altering the users’ data.
Table 6. Datasets used in preprocessing techniques.
DatasetsReferences
Heart[76]
Adult[50,53,64,76]
Bank[50,76]
Boston[76]
COMPAS[53,64,76]
German[64,76]
MEPS[64,76]
FlickrFaces[44]
AFHQ Cats and Dogs[44]
LFW[63]
CelebA[63]
MOPRH[63]
MIMIC II[54]
One in-processing mitigation model used a new classification approach for datasets based on the sensitive attribute ’race’, with the aim of increasing prediction accuracy and reducing racial bias in crime recidivism [62]. The recidivism prediction models were evaluated by the type of crime, including ’violent crimes’, ’property’, ’drug’, and ’other’. For the ’all crimes’, ’Caucasian data set’, and ’African American data set’ groups, the results still contained bias, although lower than the baseline data. The ratios obtained were 41:59, 34:66, and 46:54.
A study focused on bias mitigation in deep learning models for classification and the need for a systematic analysis of different bias mitigation techniques in-processing with MLP and CNN [75]. Using a dataset that allows the creation of different bias sets, the authors performed an analysis of the mitigation models recently proposed in the literature. Then, they showed the correlation between eligibility and sensitive attributes, the possible presence of bias even without sensitive attributes, and the importance of the initial choice of architecture for model performance.
In contrast, another work focused on the ways in which bias can occur in recommender systems, while addressing the lack of systematic mapping to address unfairness and bias in the current literature [28]. In the experiments, sources of unfairness that can occur in recommendation tasks were mapped, while evaluating whether existing bias mitigation approaches successfully improve different types of fairness metrics. It also presents a mitigation strategy in which the algorithm learns the difference between predicted and observed ratings in subgroups, identifying which is biased and correcting the prediction. The results show that fairness increased in most use cases, but performance for MSE and MAE vary in each case.
Some studies have in common the fact that their models were trained in order to mitigate bias from only adjusting the weights of their proposed models [28,55,62,65,69,75]. An attempt to mitigate the bias by neutralizing the sensitive attribute in the model showed to be possible to make a classification model fairer by removing bias only in its output layer, in a process that occurs during its construction [66]. To this end, a technique was developed where training samples with different sensitive attributes are neutralized, causing the model’s dependence on sensitive attributes to be reduced. The main advantage demonstrated by the method is the small loss of accuracy in exchange for improved fairness metrics, without requiring access to the sensitive attributes in the database. In addition, the authors argue that it is possible to increase the quality of the technique by combining it with others, for example, by using a fairer basis than the one used in the experiments.
In another work, the classification detects the item with the highest probability of belonging to the ’target’ class of the model; however, there are cases where numerous items have very close probabilities and bias the model, causing an error to propagate across multiple levels [69]. To avoid this, there is a need for a threshold with a minimum degree for the data to be classified and triggers a recalculation of the maximum node probability. The sensitive cost then performs its own probability calculation on the data with the highest degree of membership. These calculations avoid bias caused by using a single probability or overoptimal adjustment caused by using data with no prior context. Hierarchical Precision and Hierarchical Precision, which evaluates the relationship between all descendants of the class and includes Hierarchical F1, Hierarchical Recall, and Hierarchical Precision, were used as metrics. The threshold is adaptive, without requiring user parameters, since metrics exist throughout the classification. Even with fewer samples, it produced results that were superior to the state of the art.
In other works, the neutralization of sensitive attributes in an attempt to mitigate model bias is more direct [56,58,59,60] by identifying it beforehand, similar to the investigation of the authors Chiappa and Isaac [51], which addresses a new perspective on the concept of fairness by determining whether an attribute is sensitive by evaluating it in a Causal Bayesian Networks model. This model examines the direct effects of one characteristic on another and determines whether a sensitive attribute ’A’ influences the output ’Y’ of a model, producing correlation plots that strive to understand whether decisions made were made fairly.
A pre-existing biased model must be updated to become fair, minimizing unfairness without causing abrupt structural changes [56]. The study uses an adversarial learning technique with the distinction that the generating model is the original network; however, the adversarial model comprises an extra hidden layer, rather than a second model, to predict which sensitive attribute influenced the generator’s decision. The main element of this competition model is that if the discriminator finds the sensitive attribute that influenced the decision the most, it demonstrates dependence on the generator model, suggesting bias. The generator moves away from the sensitive attributes and performs a classification that does not depend on them, eventually lowering the discriminator’s hit rate until it completely loses its predictive ability. The network architecture has three parts: adding an adversarial layer on top of the network, balancing the distribution of classes across the minisets, and adapting sensitive attributes until they are no longer present.
The technique was developed for classification tasks but can be used for any neural network with biases starting with sensitive attributes [56], and it achieved better results compared to the state of the art with the metrics addressed.
In the same way as Adel et al. [56], Amend and Spurlock [59] also uses adversarial network for sensitive attribute identification and examines metrics and combinations of techniques for bias mitigation. The study was conducted using basic ANN models and a Split model, which forms the basic model by permuting attribute classes as training criteria in order to identify which one is sensitive. Another model is based on the Classifier-Adversarial Network (CAN) architecture; in that model, the adversarial network predicts the sensitive attribute based on the output of the basic model. Finally, there is the CAN with Embedding (CANE) architecture, which takes as input the output of the basic model as well as the weights created in the penultimate layer. They demonstrated that the models from the Basic RNA architecture can improve accuracy, but not bias. Meanwhile, the models of the CAN and CANE architectures improved accuracy and reduce bias, with CANE being better than CAN.
Still involving adversarial network, the Adversarial Fairness Local Outlier Factor (AFLOF) method is proposed for outlier detection, combining adversarial algorithms with the Local Outlier Factor (LOF) algorithm, which returns a value indicating whether an instance is an outlier, aiming to achieve a fairer and more assertive result than LOF and FairLOF [47]. It works with the sensitive attributes Gender, Age, and Race. It also uses the AUC-ROC score to measure outlier detection. It results in a fairer and more assertive performance for outlier detection than the previous methods cited, thus achieving a breakthrough in the study of fairness. Research on fairness and bias in machine learning focuses only on neural networks, with few publications for other classification techniques [61]. As a result, the author investigated Adversarial Gradient Tree Boosting to rank data and noted that while the adversary progressively loses the reference of the sensitive attribute that led to that prediction.
Another contribution is the adversarial learning method for generic classifiers, such as decision trees [61]. Comparing numerous state-of-the-art models with the one provided in the work, which covers two fairness metrics. They used varied decision trees in the model given that they make rankings, which are then sent through a weighted average to an adversary, who predicts which sensitive attribute was significant to the final decision. While the adversary is able to detect the sensitive attribute, a gradient propagation occurs, updating the weights in the decision trees and trying to prevent the sensitive attribute from having a direct impact on the ranking.
The model called FAGTB performed well on accuracy and fairness metrics for the COMPAS, Adult, Bank, and Default datasets, outperforming other state-of-the-art models on several of them and considerably outperforming the network adversary Grari et al. [61]. The study leaves certain questions unanswered for future research, such as an adversary using Deep Neural Decision Forests. If this method were used to retrieve the gradient, theoretically, the transparency of the model for the algorithm’s decision would be apparent because it consists only of trees. As a final caveat, they acknowledge that the algorithm handles distinct groups well, but the EO and DP fairness metrics do not measure bias between individuals, and is an aspect for improvement.
Following varied work with adversarial learning, the model Privileged Information is a technique that trains the model with all the features of the original dataset, including sensitive attributes, and then tests it without these attributes [58]. The model is an in-processing type adjusted with the goal of mitigating unfairness and independent of sensitive attributes, while maintaining its ability to produce accurate predictions, thus respecting the protected information for decision-making. Note that in this case, the model fully fits the dataset in an attempt to mitigate bias. The author emphasizes the strength of his model in identifying the best predictor relative to other state-of-the-art work, having the sensitive attributes as optional, and still using Privileged Information.
In contrast, model bias is avoided by using only data with minimal or, if possible, no sensitive attributes by applying a noise conditioning operation to the data provided in the model, inducing the model to ignore sensitive attributes, reducing bias [60]. The goal of the model is to create as accurate a representation as possible in the prediction, with fairness. The models used the techniques of logistic regression and Random Forest.
The fairness metrics identified in the works that addressed in-processing are in Table 7, as are the datasets in Table 8.
Mitigation solutions for post-processing were also found [48,67]. A study proposes a solution for an already formed model, seeking to identify whether certain groups receive discriminatory treatment due to their sensitive attributes [67]. With the identification of discrimination for a group, it is verified whether the sensitive attributes are impacting the model, even if indirectly. The model has a neural network with four fully connected layers of 8 neurons, expressing the weights as a function of the features in order to minimize the maximum average discrepancy function between the sensitive attribute classes promoting unfairness mitigation. He applied his mitigation model to a Logistic Classification model. The work allows black-box type models to be mitigated for unfairness, but there is also understanding of the assigned treatment.
Other study uses the identification of biases in models developed to recognize the user, where the user can be a human with normal vision, a blind person, or a robot [48]. The identification takes place when answering a question, so NLP is applied. Its bias can be seen in the most frequently asked question what is this object?, as well as the low image quality compared to the others. Initially, annotations were assigned to the content of the images such as boy, package, grass, airplane, and sky. Random Forest, KNN, Nave Bayes, and Logistic Regression techniques were used to develop the models. Logistic Regression produced the best results, with 99% on all metrics. The authors found that the algorithms readily recognized the bias in each dataset and provided a means of tracing the origin of the questions and images.
Table 7. Fairness metrics used in in-processing techniques.
Fairness MetricReferences
DP[44,47,58,59,61,66,70,75]
EOO[47,58,59,65,70,75]
EO[28,44,58,61,63,65,66,68,70,75]
Accuracy[58,59,62,70,75]
DI[56]
TPR[58,63]
FPR[56,58,61,62]
FNR[56,61,62]
Race-Blind[70]
AAOD[64]
ABAD[64]
AEORD[64]
SPD[64]
SP[28]
Equal Opportunity Difference[28]
Table 8. Datasets used in the in-processing techniques.
DatasetsReferences
CI-MNIST[75]
Adult[47,56,58,59,60,65,66,75]
COMPAS[56,58,60,65]
German[60]
Bank[60]
FDOC[62]
FDLE[62]
MovieLens 1M[28]
MEPS[66]
CelebA[66]
Weight[47]
Drug[47]
Crime[47]
Student[47]
Credit[47]
The fairness metrics identified in the works that addressed postprocessing are in Table 9, as are the datasets in Table 10.
Table 9. Fairness metrics used in postprocessing techniques.
Fairness MetricReferences
DI[67]
precision[48]
recall[48]
accuracy[48]
F1-score[48]
Table 10. Datasets used in postprocessing techniques.
DatasetsReferences
Synthetic (normal distribution)[67]
COMPAS[67]
VQA[48]
VizWiz[48]
CLEVR[48]

4. Discussion

All 45 studies examined addressed comparable techniques, case studies, datasets, metrics, and applications.
Adult datasets and COMPAS were used to address the most frequently reported bias identification and unfairness mitigation.
The sources and implications of various types of bias, either in the datasets or in the model, are examined [76]. The study investigates bias, offering methods for eliminating it, as well as constructing groups and subgroups that help understand the problem, and discusses general categories such as temporal, spatial, behavioral, posterior, transcendental, and group bias. Specific cases, such as the Simpsons paradox or social behavior bias, are grouped within these categories.
The forms of bias observed by the authors of Ref. [76] are categorized as follows: dataset bias, model bias, and emergent bias, or preprocessing, in-processing, and postprocessing, as previously described. In order to go deeper into these categories, the study splits them into eight broad and 18 particular categories, as well as providing metrics and strategies for resolving each of them.
A frequent concern about the individual-group interaction is that few ML models address it. if a model is biased in rejecting loans to black males, for example, it will increase its database with rejections for this group, reinforcing the bias and initiating a vicious spiral that will reassert itself with each loan denial [2].
One work focuses on the topic of vicious loops in machine learning, claiming that models may be free of bias in the present but may be biased in the future [57]. To overcome this, he suggests that the model fulfill the DP metric, which ensures that the classification of varied groups is constantly converging and that no group is disadvantaged over time.
With a few exceptions [10,67], the model proposals were primarily white-box classification. The former proposes a model for bias elimination using Multidifferential Fairness by integrating in-processing and postprocessing, whereas the latter proposes that the focus of algorithm transparency should be on the output rather than the whole decision-making process of the algorithm.
According to the works reviewed, sensitive attributes are defined as elements that should not directly affect the prediction of a model, such as color, race, sex, nationality, religion, and sexual preference, among others. According to US laws such as the Fair Housing Act (FHA) and the Equal Credit Opportunity Act (ECOA) [87], sensitive attributes should never favor, harm, or alter the outcome of individuals and groups in decision-making processes such as hiring or a court sanction. There is also the fact that all techniques and tools confirm the importance of sensitive attributes in mitigating biases, because for the identification of bias there is the need for the indication of a sensitive attribute, and the mitigation of bias will be based on this identification, remembering that the identification is done through a fairness metric.
As for the datasets, 25 datasets were identified, most of them with sensitive attributes such as demographic data, and the ones that did not have any were for studies in the area of image enhancement, when not associated with face recognition. The datasets address aspects related to criminality, the selection, and approval process of individuals, financial issues of bank credit, product pricing, health and medical diagnosis, face recognition and image enhancement, and synthetic datasets.
About the fairness metrics, the most used are EO, EOO, and DP, as observed in Table 4. Highlighting the importance of statistical metrics, difference metrics, and classification metrics, as several works have used them as criteria for fairness.
Among the bias mitigation and identification tools: FairLearn and AIF360, were not used in any practical studies. The topic of identifying bias in the data and the model was also addressed, with the Aequitas tool being the most frequently mentioned.
As for the mitigation techniques, preprocessing techniques for rebalancing the data were addressed, identifying the sensitive attribute [53] for removal, or canceling its effect on the model [50], the cancellation may be with a balance of the data in order to favor fairness [63,64,70]. Bias can also be used to identify the gender of the [54] system user.
In the in-processing techniques, such as regularizing the model [65,75], addressing levels of elimination of the sensitive attribute [51,66,69], with some possible approaches, training with all attributes so that the model can adjust itself through a loss function. Some work has used Adversarial Network for identifying sensitive attributes [56,59], as well as for adjusting model weights [58,61]. The postprocessing techniques [48,67], on the other hand, aim to discover which sensitive attribute had an impact on the model result, rebalancing the prediction.
Some research gaps were highlighted, such as the wide varieties of fairness metrics as a factor hindering which one best fits each case, lacking a comprehensive formal and comparative study of the strengths and limitations of each of the metrics [6]. It also highlights that a formal study of the techniques with the strengths and limitations of each is lacking. It also addresses the need for state-of-the-art recommendation system techniques. It highlights that there is still an absence of studies on the economic and social consequences of biases in high-risk systems. Another work attempts to elucidate some of these gaps, from the point of view of organizations and individuals, but without addressing the technical aspects of such solutions, when it highlights the importance of the sociotechnical nature of biases in algorithms, the need to understand the social processes and contexts impacted by the use of biased information and algorithmic technologies [18].
Finally, all studies have addressed the algorithm’s transparency, or the capacity to explain the decision-making process that caused the model to classify a certain individual or group the way it did. This method must fundamentally explain either the local decision, which includes the classification of a single individual, or the global decision, which verifies the whole algorithm process. The relevance of transparency is to make it explicit to a customer, company, or court that the model does not consider sensitive attributes and does not discriminate against a specific group, just as it becomes possible to attribute responsibility to the model’s developers if the model is biased.

5. Conclusions

The findings revelead that there is a focus on bias and unfairness identification methods for ML technologies, with well-defined metrics in the literature, such as fairness metrics, featured in tools, datasets, and bias mitigation techniques. This diversity ends up not defining the most appropriate approach for each context given that different solutions can be observed for the same problem, leading to a lack of definition about which one would be the most appropriate, without a generic solution for the identification and mitigation of biases.
Concerning current opportunities, we observed that there is very limited support for black-box models, which contrasts with the abundance of information for white-box models. The need for transparency and explainability of ML algorithms, as well as the defining and preservation of sensitive attributes was also emphasized, with the selected datasets acting as a basis for research addressing the identification and mitigation of bias and unfairness.
As for future research, we suggest that more study is needed to identify the techniques and metrics that should be employed in each particular case in order to standardize and ensure fairness in machine learning models. For a definition on which metric should be used for each use case, more specific studies should be conducted under different architectures and sensitive attributes. This analysis would allow the context to define the most appropriate metric to identify bias in protected groups, and whether the sensitive attribute can be a relevant element in defining the fairness metric for a given context. It was observed that, in a given dataset, the metrics do not present uniform results, pointing to different categories of bias and their context-related particularities.

Supplementary Materials

The following supporting information can be downloaded at: https://www.mdpi.com/article/10.3390/bdcc7010015/s1, PRISMA 2020 Checklist and PRISMA 2020 for Abstracts Checklist.

Author Contributions

Conceptualization, T.P.P., R.B.L., F.V.N.L., R.M.P., G.A.S.G., G.O.R.C., M.M.A., L.L.S., M.A.S.C., E.L.S.O., I.W. and E.G.S.N.; methodology, T.P.P., I.W. and E.G.S.N.; validation, T.P.P., I.W. and E.G.S.N.; formal analysis, I.W. and E.G.S.N.; investigation, T.P.P., R.B.L., F.V.N.L., R.M.P., G.A.S.G. and G.O.R.C.; data curation, T.P.P., I.W. and E.G.S.N.; writing—original draft preparation, T.P.P., R.B.L., F.V.N.L., R.M.P., G.A.S.G., G.O.R.C., M.M.A., L.L.S., M.A.S.C., E.L.S.O., I.W. and E.G.S.N.; writing—review and editing, T.P.P., R.B.L., F.V.N.L., R.M.P., G.A.S.G., G.O.R.C., E.L.S.O., I.W. and E.G.S.N.; visualization, T.P.P., R.B.L., F.V.N.L., R.M.P., G.A.S.G., G.O.R.C., E.L.S.O., I.W. and E.G.S.N.; supervision, T.P.P., I.W. and E.G.S.N.; project administration, I.W. and E.G.S.N. All authors have read and agreed to the published version of the manuscript.

Funding

This publication is the result of a project regulated by the Brazilian Informatics Law (Law No. 8248 of 1991 and subsequent updates) and was developed under the HP 052-21 between SENAI/CIMATEC and HP Brasil Indústria e Comércio de Equipamentos Eletrônicos Ltda. or Simpress Comércio, Locação e Serviços Ltda.

Institutional Review Board Statement

Not applicable.

Informed Consent Statement

Not applicable.

Data Availability Statement

Not applicable.

Acknowledgments

We gratefully acknowledge the support of SENAI CIMATEC AI Reference Center for the scientific and technical support and the SENAI CIMATEC Supercomputing Center for Industrial Innovation. The authors would like to thank the financial support from the National Council for Scientific and Technological Development (CNPq). Ingrid Winkler is a CNPq technological development fellow (Proc. 308783/2020-4).

Conflicts of Interest

There are no conflict of interest associated with this publication.

Abbreviations

The following abbreviations are used in this manuscript:
AIArtificial Intelligence
MLmachine learning
UCUse Case
CVComputer Vision
NLPNatural Language Processing
RecSysRecommendation Systems
RSsystematic review (RS)
PRISMAPreferred Reporting Items for Systematic Reviews and Meta-Analyses
COMPASCorrectional Offender Management Profiling for Alternative Sanctions
CommunitiesCommunities and Crime
FDOCFlorida Department of Corrections
FDLEFlorida Department of Law Enforcement
BankBank marketing
GermanGerman credit
BostonBoston housing price
SMSAStandard Metropolitan Statistical Area
MEPSMedical Expenditure Panel Survey
HeartHeart Disease
MIMIC IIMultiparameter Intelligent Monitoring in Intensive Care
ICUIntensive Care Unit
LFWLabeled Faces in the Wild
CelebALarge-scale CelebFaces Attributes
MORPHMORPH Longitudinal Database
VQAVisual Question Answering
AFHQAnimal FacesHQ
CI-MNISTCorrelated and Imbalanced MNIST
TPtrue positive
FPfalse positive
TNtrue negative
FNfalse negative
PPVPositive Predictive Value
FDRFalse Discovery Rate
FORFalse Omission Rate
NPVNegative Predictive Value
TPRTrue Positive Rate
FPRFalse Positive Rate
FNR False Negative Rate
TNRTrue Negative Rate
DPDemographic Parity
DIDisparate Impact
KNNCK-Nearest Neighbors Consistency
ABADAbsolute Balanced Accuracy Difference
AAODAbsolute Average Odds Difference
AEORDAbsolute Equal Opportunity Rate Difference
SPDStatistical Parity Difference
NIPnumber of positive
NINnumber of negative
BRbase rate
TMETrusted Model Executor
GANsGenerative Adversarial Networks
SMOTESynthetic Minority Over-sampling Technique
RFWRacial Faces in the Wild
CANClassifier-Adversarial Network
CANECAN with Embedding
AFLOF Adversarial Fairness Local Outlier Factor
LOFLocal Outlier Factor
FHAFair Housing Act
ECOAEqual Credit Opportunity Act

References

  1. Dwivedi, Y.K.; Hughes, L.; Ismagilova, E.; Aarts, G.; Coombs, C.; Crick, T.; Duan, Y.; Dwivedi, R.; Edwards, J.; Eirug, A.; et al. Artificial Intelligence (AI): Multidisciplinary perspectives on emerging challenges, opportunities, and agenda for research, practice and policy. Int. J. Inf. Manag. 2021, 57, 101994. [Google Scholar] [CrossRef]
  2. Mitchell, S.; Potash, E.; Barocas, S.; D’Amour, A.; Lum, K. Algorithmic Fairness: Choices, Assumptions, and Definitions. Annu. Rev. Stat. Its Appl. 2021, 8, 141–163. [Google Scholar] [CrossRef]
  3. Verma, S.; Rubin, J. Fairness definitions explained. In Proceedings of the 2018 IEEE/ACM International Workshop on Software Fairness (Fairware), Gothenburg, Sweden, 29 May 2018; pp. 1–7. [Google Scholar]
  4. Jones, D.; Snider, C.; Nassehi, A.; Yon, J.; Hicks, B. Characterising the Digital Twin: A systematic literature review. CIRP J. Manuf. Sci. Technol. 2020, 29, 36–52. [Google Scholar] [CrossRef]
  5. Mitchell, M.; Wu, S.; Zaldivar, A.; Barnes, P.; Vasserman, L.; Hutchinson, B.; Spitzer, E.; Raji, I.D.; Gebru, T. Model cards for model reporting. In Proceedings of the Conference on Fairness, Accountability, and Transparency, Atlanta, GA, USA, 29–31 January 2019; pp. 220–229. [Google Scholar]
  6. Di Noia, T.; Tintarev, N.; Fatourou, P.; Schedl, M. Recommender systems under European AI regulations. Commun. ACM 2022, 65, 69–73. [Google Scholar] [CrossRef]
  7. Booth, B.M.; Hickman, L.; Subburaj, S.K.; Tay, L.; Woo, S.E.; D’Mello, S.K. Integrating Psychometrics and Computing Perspectives on Bias and Fairness in Affective Computing: A case study of automated video interviews. IEEE Signal Process. Mag. 2021, 38, 84–95. [Google Scholar] [CrossRef]
  8. Schumann, C.; Foster, J.S.; Mattei, N.; Dickerson, J.P. We need fairness and explainability in algorithmic hiring. In Proceedings of the 19th International Conference on Autonomous Agents and MultiAgent Systems, Auckland, New Zealand, 9–13 May 2020; pp. 1716–1720. [Google Scholar]
  9. Ammar, J. Cyber Gremlin: Social networking, machine learning and the global war on Al-Qaida-and IS-inspired terrorism. Int. J. Law Inf. Technol. 2019, 27, 238–265. [Google Scholar] [CrossRef]
  10. Seymour, W. Detecting bias: Does an algorithm have to be transparent in order to Be Fair? Jo Bates Paul D. Clough Robert Jäschke 2018. Available online: https://www.cs.ox.ac.uk/files/11108/process-outcome-transparency.pdf (accessed on 1 December 2022).
  11. Gade, K.; Geyik, S.C.; Kenthapadi, K.; Mithal, V.; Taly, A. Explainable AI in industry. In Proceedings of the 25th ACM SIGKDD International Conference on Knowledge Discovery & Data Mining, Anchorage, AK, USA, 4–8 August 2019; pp. 3203–3204. [Google Scholar]
  12. Bellamy, R.; Mojsilovic, A.; Nagar, S.; Ramamurthy, K.; Richards, J.; Saha, D.; Sattigeri, P.; Singh, M.; Varshney, K.; Zhang, Y.; et al. AI Fairness 360: An extensible toolkit for detecting and mitigating algorithmic bias. IBM J. Res. Dev. 2019, 63, 4:1–4:15. [Google Scholar] [CrossRef]
  13. Bird, S.; Dudík, M.; Edgar, R.; Horn, B.; Lutz, R.; Milan, V.; Sameki, M.; Wallach, H.; Walker, K. Fairlearn: A toolkit for assessing and improving fairness in AI. Microsoft Tech. Rep. MSR-TR-2020-32 2020. Available online: https://www.scinapse.io/papers/3030081171 (accessed on 1 December 2022).
  14. Wexler, J.; Pushkarna, M.; Bolukbasi, T.; Wattenberg, M.; Viégas, F.; Wilson, J. The what-if tool: Interactive probing of machine learning models. IEEE Trans. Vis. Comput. Graph. 2019, 26, 56–65. [Google Scholar] [CrossRef] [Green Version]
  15. Tenney, I.; Wexler, J.; Bastings, J.; Bolukbasi, T.; Coenen, A.; Gehrmann, S.; Jiang, E.; Pushkarna, M.; Radebaugh, C.; Reif, E.; et al. The language interpretability tool: Extensible, interactive visualizations and analysis for NLP models. arXiv 2020, arXiv:2008.05122. [Google Scholar]
  16. Saleiro, P.; Kuester, B.; Hinkson, L.; London, J.; Stevens, A.; Anisfeld, A.; Rodolfa, K.T.; Ghani, R. Aequitas: A bias and fairness audit toolkit. arXiv 2018, arXiv:1811.05577. [Google Scholar]
  17. Nielsen, A. Practical Fairness: Achieving Fair and Secure Data Models; O’Reilly Media, Incorporated: Sebastopol, CA, USA, 2020. [Google Scholar]
  18. Kordzadeh, N.; Ghasemaghaei, M. Algorithmic bias: Review, synthesis, and future research directions. Eur. J. Inf. Syst. 2022, 31, 388–409. [Google Scholar] [CrossRef]
  19. Gad, A.F.; Gad, A.F.; John, S. Practical Computer Vision Applications Using Deep Learning with CNNs; Springer: Berlin/Heidelberg, Germany, 2018. [Google Scholar]
  20. Yang, Y.; Gupta, A.; Feng, J.; Singhal, P.; Yadav, V.; Wu, Y.; Natarajan, P.; Hedau, V.; Joo, J. Enhancing fairness in face detection in computer vision systems by demographic bias mitigation. In Proceedings of the 2022 AAAI/ACM Conference on AI, Ethics, and Society, Oxford, UK, 19–21 May 2021; pp. 813–822. [Google Scholar]
  21. Rishita, M.V.S.; Raju, M.A.; Harris, T.A. Machine translation using natural language processing. MATEC Web Conf. 2019, 277, 02004. [Google Scholar] [CrossRef]
  22. Alkomah, F.; Ma, X. A Literature Review of Textual Hate Speech Detection Methods and Datasets. Information 2022, 13, 273. [Google Scholar] [CrossRef]
  23. Vaswani, A.; Shazeer, N.M.; Parmar, N.; Uszkoreit, J.; Jones, L.; Gomez, A.N.; Kaiser, L.; Polosukhin, I. Attention is All you Need. In Proceedings of the NIPS, Long Beach, CA, USA, 4–9 December 2017. [Google Scholar]
  24. Andročec, D. Machine learning methods for toxic comment classification: A systematic review. Acta Univ. Sapientiae Inform. 2020, 12, 205–216. [Google Scholar] [CrossRef]
  25. Liang, P.P.; Wu, C.; Morency, L.P.; Salakhutdinov, R. Towards understanding and mitigating social biases in language models. In Proceedings of the International Conference on Machine Learning (PMLR), Virtual, 18–24 July 2021; pp. 6565–6576. [Google Scholar]
  26. Cheng, H.T.; Koc, L.; Harmsen, J.; Shaked, T.; Chandra, T.; Aradhye, H.; Anderson, G.; Corrado, G.; Chai, W.; Ispir, M.; et al. Wide & deep learning for recommender systems. In Proceedings of the 1st Workshop on Deep Learning for Recommender Systems, Boston, MA, USA, 15 September 2016; pp. 7–10. [Google Scholar]
  27. Smith, B.; Linden, G. Two decades of recommender systems at Amazon.com. IEEE Internet Comput. 2017, 21, 12–18. [Google Scholar] [CrossRef]
  28. Ashokan, A.; Haas, C. Fairness metrics and bias mitigation strategies for rating predictions. Inf. Process. Manag. 2021, 58, 102646. [Google Scholar] [CrossRef]
  29. Le Quy, T.; Roy, A.; Iosifidis, V.; Zhang, W.; Ntoutsi, E. A survey on datasets for fairness-aware machine learning. Wiley Interdiscip. Rev. Data Min. Knowl. Discov. 2022, 12, e1452. [Google Scholar] [CrossRef]
  30. Pessach, D.; Shmueli, E. A Review on Fairness in Machine Learning. ACM Comput. Surv. (CSUR) 2022, 55, 1–44. [Google Scholar] [CrossRef]
  31. Mehrabi, N.; Morstatter, F.; Saxena, N.; Lerman, K.; Galstyan, A. A survey on bias and fairness in machine learning. arXiv 2019, arXiv:1908.09635. [Google Scholar] [CrossRef]
  32. Bacelar, M. Monitoring bias and fairness in machine learning models: A review. ScienceOpen Prepr. 2021. [Google Scholar] [CrossRef]
  33. Balayn, A.; Lofi, C.; Houben, G.J. Managing bias and unfairness in data for decision support: A survey of machine learning and data engineering approaches to identify and mitigate bias and unfairness within data management and analytics systems. VLDB J. 2021, 30, 739–768. [Google Scholar]
  34. Chouldechova, A.; Roth, A. The frontiers of fairness in machine learning. arXiv 2018, arXiv:1810.08810. [Google Scholar]
  35. Suresh, H.; Guttag, J. A Framework for Understanding Unintended Consequences of Machine Learning. arXiv 2019, arXiv:1901.10002. [Google Scholar]
  36. Kraus, S.; Breier, M.; Dasí-Rodríguez, S. The art of crafting a systematic literature review in entrepreneurship research. Int. Entrep. Manag. J. 2020, 16, 1023–1042. [Google Scholar] [CrossRef] [Green Version]
  37. Page, M.J.; McKenzie, J.E.; Bossuyt, P.M.; Boutron, I.; Hoffmann, T.C.; Mulrow, C.D.; Shamseer, L.; Tetzlaff, J.M.; Akl, E.A.; Brennan, S.E.; et al. The PRISMA 2020 statement: An updated guideline for reporting systematic reviews. BMJ 2021, 372, n71. [Google Scholar] [CrossRef] [PubMed]
  38. Pagano, T.P.; Santos, V.R.; Bonfim, Y.d.S.; Paranhos, J.V.D.; Ortega, L.L.; Sá, P.H.M.; Nascimento, L.F.S.; Winkler, I.; Nascimento, E.G.S. Machine Learning Models and Videos of Facial Regions for Estimating Heart Rate: A Review on Patents, Datasets, and Literature. Electronics 2022, 11, 1473. [Google Scholar] [CrossRef]
  39. Booth, A.; Sutton, A.; Papaioannou, D. Systematic Approaches to a Successful Literature Review; SAGE: Thousand Oaks, CA, USA, 2016. [Google Scholar]
  40. Grames, E.M.; Stillman, A.N.; Tingley, M.W.; Elphick, C.S. An automated approach to identifying search terms for systematic reviews using keyword co-occurrence networks. Methods Ecol. Evol. 2019, 10, 1645–1654. [Google Scholar] [CrossRef]
  41. Patil, S. Global Library & Information Science Research seen through Prism of Biblioshiny. Stud. Indian Place Names 2020, 40, 158–170. [Google Scholar]
  42. Aria, M.; Cuccurullo, C. bibliometrix: An R-tool for comprehensive science mapping analysis. J. Inf. 2017, 11, 959–975. [Google Scholar]
  43. König, P.D.; Wenzelburger, G. When Politicization Stops Algorithms in Criminal Justice. Br. J. Criminol. 2021, 61, 832–851. [Google Scholar] [CrossRef]
  44. Jalal, A.; Karmalkar, S.; Hoffmann, J.; Dimakis, A.; Price, E. Fairness for image generation with uncertain sensitive attributes. In Proceedings of the International Conference on Machine Learning (PMLR), Virtual, 18–24 July 2021; pp. 4721–4732. [Google Scholar]
  45. Lee, M.S.A.; Singh, J. Risk Identification Questionnaire for Detecting Unintended Bias in the Machine Learning Development Lifecycle. In Proceedings of the 2021 AAAI/ACM Conference on AI, Ethics, and Society, Virtual Event, 19–21 May 2021; pp. 704–714. [Google Scholar]
  46. D’Mello, S.K.; Tay, L.; Southwell, R. Psychological measurement in the information age: Machine-learned computational models. Curr. Dir. Psychol. Sci. 2022, 31, 76–87. [Google Scholar] [CrossRef]
  47. Li, S.; Yu, J.; Du, X.; Lu, Y.; Qiu, R. Fair Outlier Detection Based on Adversarial Representation Learning. Symmetry 2022, 14, 347. [Google Scholar] [CrossRef]
  48. Das, A.; Anjum, S.; Gurari, D. Dataset bias: A case study for visual question answering. Proc. Assoc. Inf. Sci. Technol. 2019, 56, 58–67. [Google Scholar] [CrossRef]
  49. Fontana, M.; Naretto, F.; Monreale, A.; Giannotti, F. Monitoring Fairness in HOLDA. In Hibrid Human-Artificial Intelligence; IOS Press: Amsterdam, The Netherlands, 2022; p. 66. [Google Scholar]
  50. Bryant, R.; Cintas, C.; Wambugu, I.; Kinai, A.; Weldemariam, K. Analyzing bias in sensitive personal information used to train financial models. arXiv 2019, arXiv:1911.03623. [Google Scholar]
  51. Chiappa, S.; Isaac, W.S. A causal bayesian networks viewpoint on fairness. In IFIP International Summer School on Privacy and Identity Management; Springer: Berlin/Heidelberg, Germany, 2018; pp. 3–20. [Google Scholar]
  52. Sun, W.; Nasraoui, O.; Shafto, P. Evolution and impact of bias in human and machine learning algorithm interaction. PLoS ONE 2020, 15, e0235502. [Google Scholar]
  53. Yang, K.; Huang, B.; Stoyanovich, J.; Schelter, S. Fairness-Aware Instrumentation of Preprocessing Pipelines for Machine Learning. In Proceedings of the Workshop on Human-In-the-Loop Data Analytics (HILDA’20), Portland, OR, USA, 19 June 2020. [Google Scholar]
  54. Paviglianiti, A.; Pasero, E. VITAL-ECG: A de-bias algorithm embedded in a gender-immune device. In Proceedings of the 2020 IEEE International Workshop on Metrology for Industry 4.0 & IoT, Roma, Italy, 3–5 June 2020; pp. 314–318. [Google Scholar]
  55. Martinez Neda, B.; Zeng, Y.; Gago-Masague, S. Using Machine Learning in Admissions: Reducing Human and Algorithmic Bias in the Selection Process. In Proceedings of the 52nd ACM Technical Symposium on Computer Science Education, Virtual, 13–20 March 2021; p. 1323. [Google Scholar]
  56. Adel, T.; Valera, I.; Ghahramani, Z.; Weller, A. One-network adversarial fairness. In Proceedings of the AAAI Conference on Artificial Intelligence, Honolulu, HI, USA, 27 January–1 February 2019; Volume 33, pp. 2412–2420. [Google Scholar]
  57. Paaßen, B.; Bunge, A.; Hainke, C.; Sindelar, L.; Vogelsang, M. Dynamic fairness—Breaking vicious cycles in automatic decision making. In Proceedings of the ESANN, Bruges, Belgium, 24–26 April 2019; pp. 477–482. [Google Scholar]
  58. Quadrianto, N.; Sharmanska, V. Recycling privileged learning and distribution matching for fairness. In Proceedings of the Advances in Neural Information Processing Systems, Long Beach, CA, USA, 4–9 December 2017. [Google Scholar]
  59. Amend, J.J.; Spurlock, S. Improving machine learning fairness with sampling and adversarial learning. J. Comput. Sci. Coll. 2021, 36, 14–23. [Google Scholar]
  60. Cerrato, M.; Esposito, R.; Puma, L.L. Constraining deep representations with a noise module for fair classification. In Proceedings of the 35th Annual ACM Symposium on Applied Computing, Brno, Czech Republic, 30 March–3 April 2020; pp. 470–472. [Google Scholar]
  61. Grari, V.; Ruf, B.; Lamprier, S.; Detyniecki, M. Fair adversarial gradient tree boosting. In Proceedings of the 2019 IEEE International Conference on Data Mining (ICDM), Beijing, China, 8–11 November 2019; pp. 1060–1065. [Google Scholar]
  62. Jain, B.; Huber, M.; Fegaras, L.; Elmasri, R.A. Singular race models: Addressing bias and accuracy in predicting prisoner recidivism. In Proceedings of the 12th ACM International Conference on Pervasive Technologies Related to Assistive Environments, Rhodes, Greece, 5–7 June 2019; pp. 599–607. [Google Scholar]
  63. Georgopoulos, M.; Oldfield, J.; Nicolaou, M.A.; Panagakis, Y.; Pantic, M. Mitigating Demographic Bias in Facial Datasets with Style-Based Multi-attribute Transfer. Int. J. Comput. Vis. 2021, 129, 2288–2307. [Google Scholar] [CrossRef]
  64. Jang, T.; Zheng, F.; Wang, X. Constructing a Fair Classifier with Generated Fair Data. In Proceedings of the AAAI Conference on Artificial Intelligence, Virtual, 2–9 February 2021; Volume 35, pp. 7908–7916. [Google Scholar]
  65. Radovanović, S.; Petrović, A.; Delibašić, B.; Suknović, M. Enforcing fairness in logistic regression algorithm. In Proceedings of the 2020 International Conference on Innovations in Intelligent SysTems and Applications (INISTA), Novi Sad, Serbia, 24–26 August 2020; pp. 1–7. [Google Scholar]
  66. Du, M.; Mukherjee, S.; Wang, G.; Tang, R.; Awadallah, A.; Hu, X. Fairness via Representation Neutralization. Adv. Neural Inf. Process. Syst. 2021, 34, 12091–12103. [Google Scholar]
  67. Gitiaux, X.; Rangwala, H. mdfa: Multi-Differential Fairness Auditor for Black Box Classifiers. In Proceedings of the IJCAI, Macao, China, 10–16 August 2019; pp. 5871–5879. [Google Scholar]
  68. Pessach, D.; Shmueli, E. Improving fairness of artificial intelligence algorithms in Privileged-Group Selection Bias data settings. Expert Syst. Appl. 2021, 185, 115667. [Google Scholar] [CrossRef]
  69. Zheng, W.; Zhao, H. Cost-sensitive hierarchical classification via multi-scale information entropy for data with an imbalanced distribution. Appl. Intell. 2021, 51, 5940–5952. [Google Scholar]
  70. Shi, S.; Wei, S.; Shi, Z.; Du, Y.; Fan, W.; Fan, J.; Conyers, Y.; Xu, F. Algorithm Bias Detection and Mitigation in Lenovo Face Recognition Engine. In Proceedings of the CCF International Conference on Natural Language Processing and Chinese Computing, Zhengzhou, China, 14–18 October 2020; Springer: Cham, Switzerland, 2020; pp. 442–453. [Google Scholar]
  71. Feijóo, C.; Kwon, Y.; Bauer, J.M.; Bohlin, E.; Howell, B.; Jain, R.; Potgieter, P.; Vu, K.; Whalley, J.; Xia, J. Harnessing artificial intelligence (AI) to increase wellbeing for all: The case for a new technology diplomacy. Telecommun. Policy 2020, 44, 101988. [Google Scholar] [CrossRef] [PubMed]
  72. Gambs, S. Privacy and Ethical Challenges in Big Data. In Proceedings of the International Symposium on Foundations and Practice of Security, Montreal, QC, Canada, 13–15 November 2018; Springer: Cham, Switzerland, 2018; pp. 17–26. [Google Scholar]
  73. Stoyanovich, J.; Howe, B.; Jagadish, H. Responsible data management. Proc. VLDB Endow. 2020, 13, 3474–3488. [Google Scholar] [CrossRef]
  74. Du, M.; Yang, F.; Zou, N.; Hu, X. Fairness in Deep Learning: A Computational Perspective. IEEE Intell. Syst. 2021, 36, 25–34. [Google Scholar] [CrossRef]
  75. Reddy, C.; Sharma, D.; Mehri, S.; Romero Soriano, A.; Shabanian, S.; Honari, S. Benchmarking Bias Mitigation Algorithms in Representation Learning through Fairness Metrics. In Proceedings of the Neural Information Processing Systems Datasets and Benchmarks, Virtual, 6–14 December 2021; Volume 1. [Google Scholar]
  76. Jinyin, C.; Yipeng, C.; Yiming, C.; Haibin, Z.; Shouling, J.; Jie, S.; Yao, C. Fairness Research on Deep Learning. J. Comput. Res. Dev. 2021, 58, 264. [Google Scholar]
  77. Kozodoi, N.; Jacob, J.; Lessmann, S. Fairness in credit scoring: Assessment, implementation and profit implications. Eur. J. Oper. Res. 2022, 297, 1083–1094. [Google Scholar] [CrossRef]
  78. Loyola-Gonzalez, O. Black-box vs. white-box: Understanding their advantages and weaknesses from a practical point of view. IEEE Access 2019, 7, 154096–154113. [Google Scholar] [CrossRef]
  79. Larson, J.; Mattu, S.; Kirchner, L.; Angwin, J. Machine Bias; Auerbach Publications: New York, NY, USA, 2016; pp. 254–264. [Google Scholar]
  80. Dua, D.; Graff, C. UCI Machine Learning Repository, University of California, Irvine, School of Information and Computer Sciences. 1 December 2017. Available online: http://archive.ics.uci.edu/ml (accessed on 1 December 2022).
  81. Cortez, P.; Silva, A.M.G. Using data mining to predict secondary school student performance. In Proceedings of the 5th Annual Future Business Technology Conference, EUROSIS-ETI, Porto, Portugal, 9–11 April 2008; pp. 5–12. [Google Scholar]
  82. Yeh, I.C.; Lien, C.h. The comparisons of data mining techniques for the predictive accuracy of probability of default of credit card clients. Expert Syst. Appl. 2009, 36, 2473–2480. [Google Scholar] [CrossRef]
  83. Creedon, T.B.; Zuvekas, S.H.; Hill, S.C.; Ali, M.M.; McClellan, C.; Dey, J.G. Effects of Medicaid expansion on insurance coverage and health services use among adults with disabilities newly eligible for Medicaid. Health Serv. Res. 2022, 57, 183–194. [Google Scholar] [CrossRef] [PubMed]
  84. De-La-Hoz-Correa, E.; Mendoza Palechor, F.; De-La-Hoz-Manotas, A.; Morales Ortega, R.; Sánchez Hernández, A.B. Obesity level estimation software based on decision trees. J. Comput. Sci. 2019, 15, 67–77. [Google Scholar] [CrossRef]
  85. Fehrman, E.; Muhammad, A.K.; Mirkes, E.M.; Egan, V.; Gorban, A.N. The five factor model of personality and evaluation of drug consumption risk. In Data Science; Springer: Berlin/Heidelberg, Germany, 2017; pp. 231–242. [Google Scholar]
  86. Liu, Z.; Luo, P.; Wang, X.; Tang, X. Deep Learning Face Attributes in the Wild. In Proceedings of the International Conference on Computer Vision (ICCV), Santiago, Chile, 7–13 December 2015; pp. 3730–3738. [Google Scholar]
  87. Equal Credit Opportunity Act. Women in the American Political System: An Encyclopedia of Women as Voters, Candidates, and Office Holders [2 Volumes]; ABC-CLIO: Santa Barbara, CA, USA, 2018. [Google Scholar]
Figure 1. Year of the references cited in the works.
Bdcc 07 00015 g001
Figure 2. Process of selecting works with the resulting amount.
Bdcc 07 00015 g002
Figure 3. Systematic review flow diagram, adapted from PRISMA 2020.
Bdcc 07 00015 g003
Figure 4. Keyword co-occurrence network.
Bdcc 07 00015 g004
Figure 5. Confusion Matrix Multiclass.
Bdcc 07 00015 g005
Table 1. Works retrieved by the search string.
AuthorYearCategoryDatasetsFairness MetricsTech.Ref.
Ammar2019Case study---[9]
Koning2021Case study---[43]
Jalal2021Case studyFlickrFaces, AFHQ, Cats and DogsDP, EOin[44]
Mitchell2021IdentificationCOMPAS--[2]
Schuman2020Identification---[8]
Seymour2018IdentificationCOMPAS--[10]
Lee2021Identification---[45]
D’Mello2022Identification---[46]
Booth2021IdentificationAVIs--[7]
Li2022IdentificationCompas, Student, Credit, Crime, Adult, Weight, DrugEOO, DPin[47]
Das2019IdentificationVQA, VizWiz, CLEVRAcc, Precision, Recall, F1-score, ROCpost[48]
Fontana2022IdentificationAdult, SyntheticDP, EO, EOOpost[49]
Bryant2019IdentificationBank,AdultDI, KNNC, NIP, NIN, BR, SPDpre[50]
Chiappa2018IdentificationCOMPASDP, PP, FNR, FPRpre[51]
Sun2020Identification, Case studyMovieLens, syntheticAcc-[52]
Yang2020Identification, MitigationCOMPAS, AdultFPR, FNRpre[53]
Paviglianiti2020Identification, MitigationMIMIC II-pre[54]
Martinez2021Mitigation---[55]
Adel2019MitigationCOMPAS, AdultDI, FNR, FPRin[56]
Paassen2019MitigationCOMPASDPin[57]
Quadrianto2017MitigationCOMPAS, AdultTPR, FPR, DP, EO, EOO, Accin[58]
Amend2021MitigationAdultEOO, DP, Accin[59]
Cerrato2020MitigationCOMPAS, Bank, German, Adult-in[60]
Grari2019MitigationCOMPAS, Adult, Bank MarketingDP, EO, FPR, FNRin[61]
Jain2019MitigationFDOC, FDLEFPR, FNR, Accin[62]
Georgopoulous2021MitigationLFW, CelebA, MOPRHTPR, EO,in[63]
Jang2021MitigationCompas, German, Adult, MEPSABAD, AAOD, AEORD, SPDin[64]
Radovanovic2020MitigationCompas, AdultEO, EOOin[65]
Ashokan2021MitigationMovieLensSP, EO Difference, EOin[28]
Mengnan Du2021MitigationAdult, MEPS, CelebADP, EOin[66]
Gitiaux2019MitigationCOMPAS, Communities, German, Adult, syntheticDIpost[67]
Pessach2021MitigationRecruitment, COMPASEOall[68]
Zheng2021MitigationILSVRC57, CAR196, SUN, DD, F194Acc, Precisionpre[69]
Shi2020Mitigation, Case studyRFWAcc, Race-Blind, EOO, EO, DPpre/in[70]
Feijoo2020Responsible AI---[71]
Gambs2018Responsible AI---[72]
Di Noia2022Responsible AI---[6]
Stoyanovich2020Review---[73]
Dwivedi2019Review---[1]
Mehrabi2019Review---[31]
Mengnan Du2021Review---[74]
Kordzadeh2022Review---[18]
Reddy2021ReviewAdult, CI-MNISTEO, EOO, DP, Accuracyin[75]
Jinyin2021ReviewCOMPAS, Bank, German, Adult, Boston, MEPS, Heart-pre[76]
Kozodoi2022Review, Case study---[77]
Table 2. Datasets present in each work.
DatasetsReferences
COMPAS[2,10,47,51,53,56,57,58,60,61,64,65,67,68,76]
Communities[67]
FDOC[62]
FDLE[62]
Student[47]
Bank[50,60,61,76]
German[60,64,67,76]
Credit[47]
Crime[47]
Adult[47,49,50,53,56,58,59,60,61,64,65,66,67,75,76]
Boston[76]
MEPS[64,66,76]
Heart[76]
MIMIC II[54]
Weight[47]
Drug[47]
FlickrFaces[44]
AFHQ Cats and Dogs[44]
LFW[63]
CelebA[63,66]
MOPRH[63]
MovieLens 1M[28,52]
CI-MNIST[75]
VQA[48]
VizWiz[48]
CLEVR[48]
Synthetic[49,52,67]
RFW[69]
ILSVRC57[69]
CAR196[69]
SUN[69]
DD[69]
F194[69]
Recruitment[68]
AVIs[7]
Table 3. Statistical metrics.
Statistical MetricsReferencesEquation
Positive Predictive Value (PPV)[3] P P V = T P / ( T P + F P )
False Discovery Rate (FDR)[3] F D R = F P / ( T P + F P )
False Omission Rate (FOR)[3] F O R = F N / ( T N + F N )
Negative Predictive Value (NPV)[3] N P V = T N / ( T N + F N )
True Positive Rate (TPR)[3,58,63] T P R = T P / ( T P + F N )
False Positive Rate (FPR)[3,51,53,56,58,61,62] F P R = F P / ( F P + T N )
False Negative Rate (FNR)[3,51,53,56,61,62,53] F N R = F N / ( T P + F N )
True Negative Rate (TNR)[3] T N R = T N / ( F P + T N )
Table 4. Metrics used as fairness criteria.
Fairness MetricsReferences
EO[31,63,65,66,75]
EOO[31,47,59,65,75]
DP[31,44,47,59,66,75]
DI[50]
KNNC[50]
ABAD[64]
AAOD[64]
AEORD[64]
SPD[50,64]
accuracy[48,59,75]
precision[48]
recall[48]
F1-score[48]
NIP[50]
NIN[50]
BR[50]
Table 5. Fairness metrics used in preprocessing techniques.
Fairness MetricsReferences
FPR[51,53]
FNR[51,53]
DP[51,70]
EO[68,70]
SPD[50]
DI[50]
KNNC[50]
NIP[50]
NIN[50]
BR[50]
Disclaimer/Publisher’s Note: The statements, opinions and data contained in all publications are solely those of the individual author(s) and contributor(s) and not of MDPI and/or the editor(s). MDPI and/or the editor(s) disclaim responsibility for any injury to people or property resulting from any ideas, methods, instructions or products referred to in the content.

