Article

Lung Cancer Risk Prediction with Machine Learning Models

Department of Computer Engineering and Informatics, University of Patras, 26504 Patras, Greece
*
Author to whom correspondence should be addressed.
Big Data Cogn. Comput. 2022, 6(4), 139; https://doi.org/10.3390/bdcc6040139
Submission received: 3 July 2022 / Revised: 9 October 2022 / Accepted: 9 November 2022 / Published: 15 November 2022

Abstract

:
The lungs are the center of breath control and ensure that every cell in the body receives oxygen. At the same time, they filter the air to prevent the entry of useless substances and germs into the body. The human body has specially designed defence mechanisms that protect the lungs. However, they are not enough to completely eliminate the risk of various diseases that affect the lungs. Infections, inflammation or even more serious complications, such as the growth of a cancerous tumor, can affect the lungs. In this work, we used machine learning (ML) methods to build efficient models for identifying high-risk individuals for incurring lung cancer and, thus, making earlier interventions to avoid long-term complications. The suggestion of this article is the Rotation Forest that achieves high performance and is evaluated by well-known metrics, such as precision, recall, F-Measure, accuracy and area under the curve (AUC). More specifically, the evaluation of the experiments showed that the proposed model prevailed with an AUC of 99.3%, F-Measure, precision, recall and accuracy of 97.1%.

1. Introduction

The lungs are the main organs of respiration. The human body has two lungs, one on each side of the chest. The left lung is smaller than the right, leaving room for the heart. During breathing, the chest rises and falls. That is because by inhalation, the lungs swell, and by exhalation, they shrink. The lungs are responsible for enriching the blood with oxygen. The heart sends to the lungs blood that is low in oxygen and rich in carbon dioxide. The blood inside the lungs is “cleansed”, absorbs oxygen and leaves carbon dioxide. Carbon dioxide is eliminated during exhalation, while oxygen enters the lungs during inhalation [1,2].
Moreover, the air, in order to reach the lungs, passes successively through the nasal cavity (or the oral cavity in case we breathe through the mouth), the pharynx, the larynx, the trachea and the bronchi. Inside the lungs, the bronchi branch into smaller and smaller bronchi and end up in the alveoli. There are too many capillaries in the alveoli, which release carbon dioxide into the alveoli and take in oxygen. Humans never stop breathing until they die because the lungs supply our blood with oxygen, which is vital for human life [2].
In developed countries, lung diseases are one of the main causes of death. Factors such as smoking, environmental toxins and chronic inflammation cause harmful effects that often lead to permanent damage. The lungs have the ability to clear themselves through a series of processes and mechanisms, such as phlegm. However, for someone who smokes, this is not enough. Environmental factors, genetic, hereditary or a combination thereof, are able to affect the lungs and promote their progression from various diseases. Diseases that occur in the respiratory system belong to several categories [1,3].
Specifically, chronic obstructive pulmonary disease (COPD) includes chronic bronchitis and emphysema. Often, the two diseases coexist, thus creating a complex condition called chronic obstructive pulmonary disease. Smoking is the leading cause of obstructive pulmonary disease [4]. Chronic bronchitis is characterized by inflammation and damage to the lining of the bronchi. The bronchi connect the trachea to the lungs. The main symptoms are chronic cough, increased mucus production and shortness of breath. The main symptoms of emphysema include coughing, shortness of breath, limited exercise resistance and effort for various activities [5].
Moreover, asthma is a chronic condition that affects the bronchi and bronchioles. The most common signs of asthma are shortness of breath and wheezing due to the narrowing of the airways [6]. Cystic fibrosis is an inherited condition that affects patients’ mucus and sweat. Due to the problems that arise, the mucus accumulates in the lungs and is the cause of frequent lung infections. Gradually, permanent damage is caused to the lungs, and severe respiratory failure is established. Tuberculosis is an infection caused by a type of bacterium that mainly affects the lungs. This bacterium causes inflammation in the lung tissue and then destroys it [7]. Finally, pneumonia includes a wide range of infectious diseases caused by infection of the lungs by various germs, bacteria, viruses, parasites, and fungi [8].
Lung cancer is the primary cause of death from malignancies in both genders. It is worth noting that deaths from lung cancer exceed deaths from cancers of the colon, cervix and breast combined. The most common symptom of lung cancer is coughing, which needs special attention, as most lung cancer patients have a cough because they are smokers and suffer from chronic obstructive pulmonary disease, which in itself causes coughing. More important is the change in the character of the cough (it becomes more persistent, more intense, and may be accompanied by expectoration or bloody sputum). In addition, the symptoms caused by lung cancer include expectoration, chest pain, shortness of breath, anorexia, weight loss, fever and hemoptysis [9,10,11].
Thoracic computed tomography (CT) or chest X-ray are some typical methods for lung cancer diagnosis. Occasionally, magnetic resonance imaging (MRI) or positron emission tomography (PET) imaging can be used in the course of staging the extent of the spread of cancer, as it helps to determine the best therapeutic management. Bronchoscopy and biopsy (aspirational needle biopsy, surgical biopsy) are required to determine the actual diagnosis of lung cancer as well as to provide information on the histological type [12,13].
In many countries, the number of former smokers is high, and many types of lung cancer concern former smokers as well. In the United States alone, there are more than 50 million former smokers (i.e., people who have already stopped smoking) [14], so approaches such as lung cancer screening are evidence-based measures to detect and cure lung cancer before the development of lethal metastatic spread in current and former smokers. Supporting smoking cessation is important for current smokers, but lung cancer is a lifelong risk for every smoker. The patient’s risk of dying of lung cancer is determined by the advanced stage of cancer. If someone identifies it in the early stages, it can even be cured, while, at an advanced stage, median survival is less than two years. The early-stage detection of lung cancer is associated with a high frequency of cure, whereas lung cancer detected in higher stages is often associated with a median survival of less than years [15,16,17].
Nowadays, artificial intelligence (AI) and machine learning (ML) techniques play a critical role in healthcare. Due to the wide applicability of AI/ML in numerous health conditions’ risk prediction, a variety of regulations should be determined as in [18,19] to evaluate and support the practical development of AI/ML-based software tools for the early prediction and diagnosis of a disease. The most common diseases that these tools concern are diabetes (as a classification [20] or time-series task for the prediction of continuous glucose values [21]), hypertension [22], COVID-19 [23], hypercholesterolemia [24], COPD [25], stroke [26], cardiovascular diseases (CVDs) [27], acute liver failure (ALF) [28], sleep disorders [29], hepatitis C [30], metabolic syndrome [31], chronic kidney disease (CKD) [32], etc.
In the context of this study, lung cancer will concern us. For this particular disease, many scientific studies have been executed from the perspective of ML. Here, a methodology for designing effective ML classification models is presented to predict lung cancer occurrence with the aid of the most common habits and symptoms/signs as input features to the models. Our contribution is a comparative assessment of numerous classifiers to develop the intended model with the highest sensitivity and discrimination ability in identifying those at high risk. For the evaluation of the models, we considered the performance metrics precision, recall, F-Measure, accuracy and AUC. Moreover, AUC ROC curves are also captured and presented. Finally, from various aspects, the performance analysis revealed that Rotation Forest is the most efficient model, and therefore constitutes the main proposition of this research article.
The next sections of the paper are formulated as follows. In Section 2, related works are provided on the subject under investigation. A focused presentation of the dataset and an analysis of the methodology followed are given in Section 3. Furthermore, in Section 4, we discuss the acquired experimental results. Finally, conclusions and future directions are noted in Section 5.

2. Related Work

Here, we provide a brief overview of the most recent relevant works for the prediction of lung cancer occurrence using ML techniques and models.
Firstly, in [33], the authors demonstrated an efficient approach for the detection and classification of lung cancer by exploiting CT scan images. They employed seven classification models, such as a decision tree, random forest, support vector machine, naive Bayes, k-nearest neighbors, stochastic gradient descent and multi-layer perceptron. For the training and testing of these classifiers, a dataset of 15,750 clinical data, containing 6910 benign and 8840 malignant lung cancer-related images, was considered. In the acquired outcomes, the multi-layer perceptron classifier achieved superior accuracy, with a value of 88.55% in relation to the other classifiers.
Similarly, in [34], the authors applied a neural network, radial basis function network, support vector machine, logistic regression, random forest, J48, naive Bayes and K-nearest neighbors in order to predict lung cancer. They showed that the radial basis function network achieved a higher accuracy of 81.25% on lung cancer data. Additionally, the key objective of [35] is the early diagnosis of lung cancer by examining the performance of classification algorithms. The authors applied classification algorithms, such as naive Bayes, support vector machine, decision tree and logistic regression. In the lung cancer dataset from the UCI, the logistic regression achieved higher accuracy of 96.9%, while in the lung cancer dataset from the data.world, support vector machine achieved a higher accuracy of 99.2%.
The goal of the research work [36] was to enhance the prediction accuracy and Root Mean Square Error (RMSE) of lung cancer patient survival time in months (survival ≤ 6, 7–24, or >24 months) by combining the Random Forest classification model with three regression ones (general linear regression and gradient-boosted machines). Random forest prevailed for survival times ≤ 6 (RMSE 10.52) and > 24 months (RMSE 20.51), while the gradient boosting machine was the winning model for 7–24 months (RMSE 15.65).
Moreover, in [37], several well-known classifiers, such as support vector machine, C4.5 decision tree, multi-layer perceptron, neural network, and naïve Bayes, were applied to a reference dataset obtained from the UCI repository for the early-stage prediction of lung cancer. Additionally, ensemble models, such as random forest and majority voting were used in the context of performance comparison. According to these outcomes, the gradient-boosted tree outperformed the others and achieved an accuracy of 90%.
The authors in [38] aimed to build a data mining classification model in order to predict whether or not a patient has lung cancer based on the [39] dataset. Through the Cross-Industry Standard Process for Data Mining (CRISP-DM) methodology and the RapidMiner software, different models and sampling methods were built. The artificial neural network algorithm prevailed and achieved an accuracy of 92%, a recall of 94.2%, and a precision of 90.8%, compared with other models.
Finally, in [40], the authors designed a mechanism to identify the appropriate biomarkers for early diagnosis of lung cancer by combining established metabolomics mechanisms and machine learning methods. Their study was based on a dataset consisting of 110 lung cancer patients and 43 healthy participants. For enabling the discrimination of first-stage lung cancer patients by healthy individuals, six specific biomarkers were selected after ROC analysis with an AUC, Sensitivity and Specificity equal to 0.989, 0.981, and 1, respectively. The fast correlation-based filter (FCBF) was considered for finding the top 5 relative importance metabolic biomarkers. Among the evaluated models, Naïve Bayes is the suggested one for the early prediction of lung tumor.

3. Materials and Methods

In this section, we will describe the dataset we based on and the main steps of the adopted methodology for lung cancer risk prediction, namely, class balancing and features’ ranking in the balanced data. We will also capture the nominal features’ frequency of occurrence in relation to the lung cancer classes. Moreover, the ML models and performance metrics are described.

3.1. Dataset Description

The present work relied on a public dataset [39]. The number of participants is 309, and all the attributes (15 as input to the ML models and 1 for the target class) are described as follows:
  • Gender [41]: This feature shows if the person’s sex is male or female.
  • Age (years) [42]: This feature captures the person’s age.
  • Smoking [43]: This feature indicates if the participant is a smoker or not.
  • Yellow fingers [44]: This feature refers to whether the participant has yellow fingers or not.
  • Anxiety [45]: This feature shows if the participant is anxious or not.
  • Peer pressure [46]: This feature captures if the participant feels peer pressure or not.
  • Chronic disease [47]: This feature expresses if the participant suffers from a chronic disease or not.
  • Fatigue [48]: This feature manifests if the participant suffers from fatigue or not.
  • Allergy [49]: This feature refers to whether the participant has an allergy or not.
  • Wheezing [50]: This feature declares if the participant suffers from wheezing or not.
  • Alcohol [51]: This feature shows if the participant consumes alcohol or not.
  • Coughing [52]: This feature refers to whether the participant suffers from coughing or not.
  • Shortness of breath [53]: This feature refers to whether the participant has shortness of breath or not.
  • Swallowing difficulty [54]: This feature indicates if the participant has difficulty swallowing or not.
  • Chest pain [55]: This feature captures whether the participant has chest pain or not.
  • Lung Cancer: This feature shows if the participant has been diagnosed with lung cancer or not.
    All the features are nominal except for age, which is numerical.

3.2. Data Preprocessing

We have to note that no processing was performed on the dataset we relied on, as there are no missing values or outliers. To tackle the highly skewed class distribution of the participants among the Lung Cancer (87.4%) and Non-Lung Cancer classes, we employed SMOTE [56]. SMOTE is a widely used method that applies a 5-NN classifier to generate synthetic data [57] for the minority class, i.e., Non-Lung Cancer, which is oversampled such that the instances in two classes are equally distributed (i.e., 50%–50%).

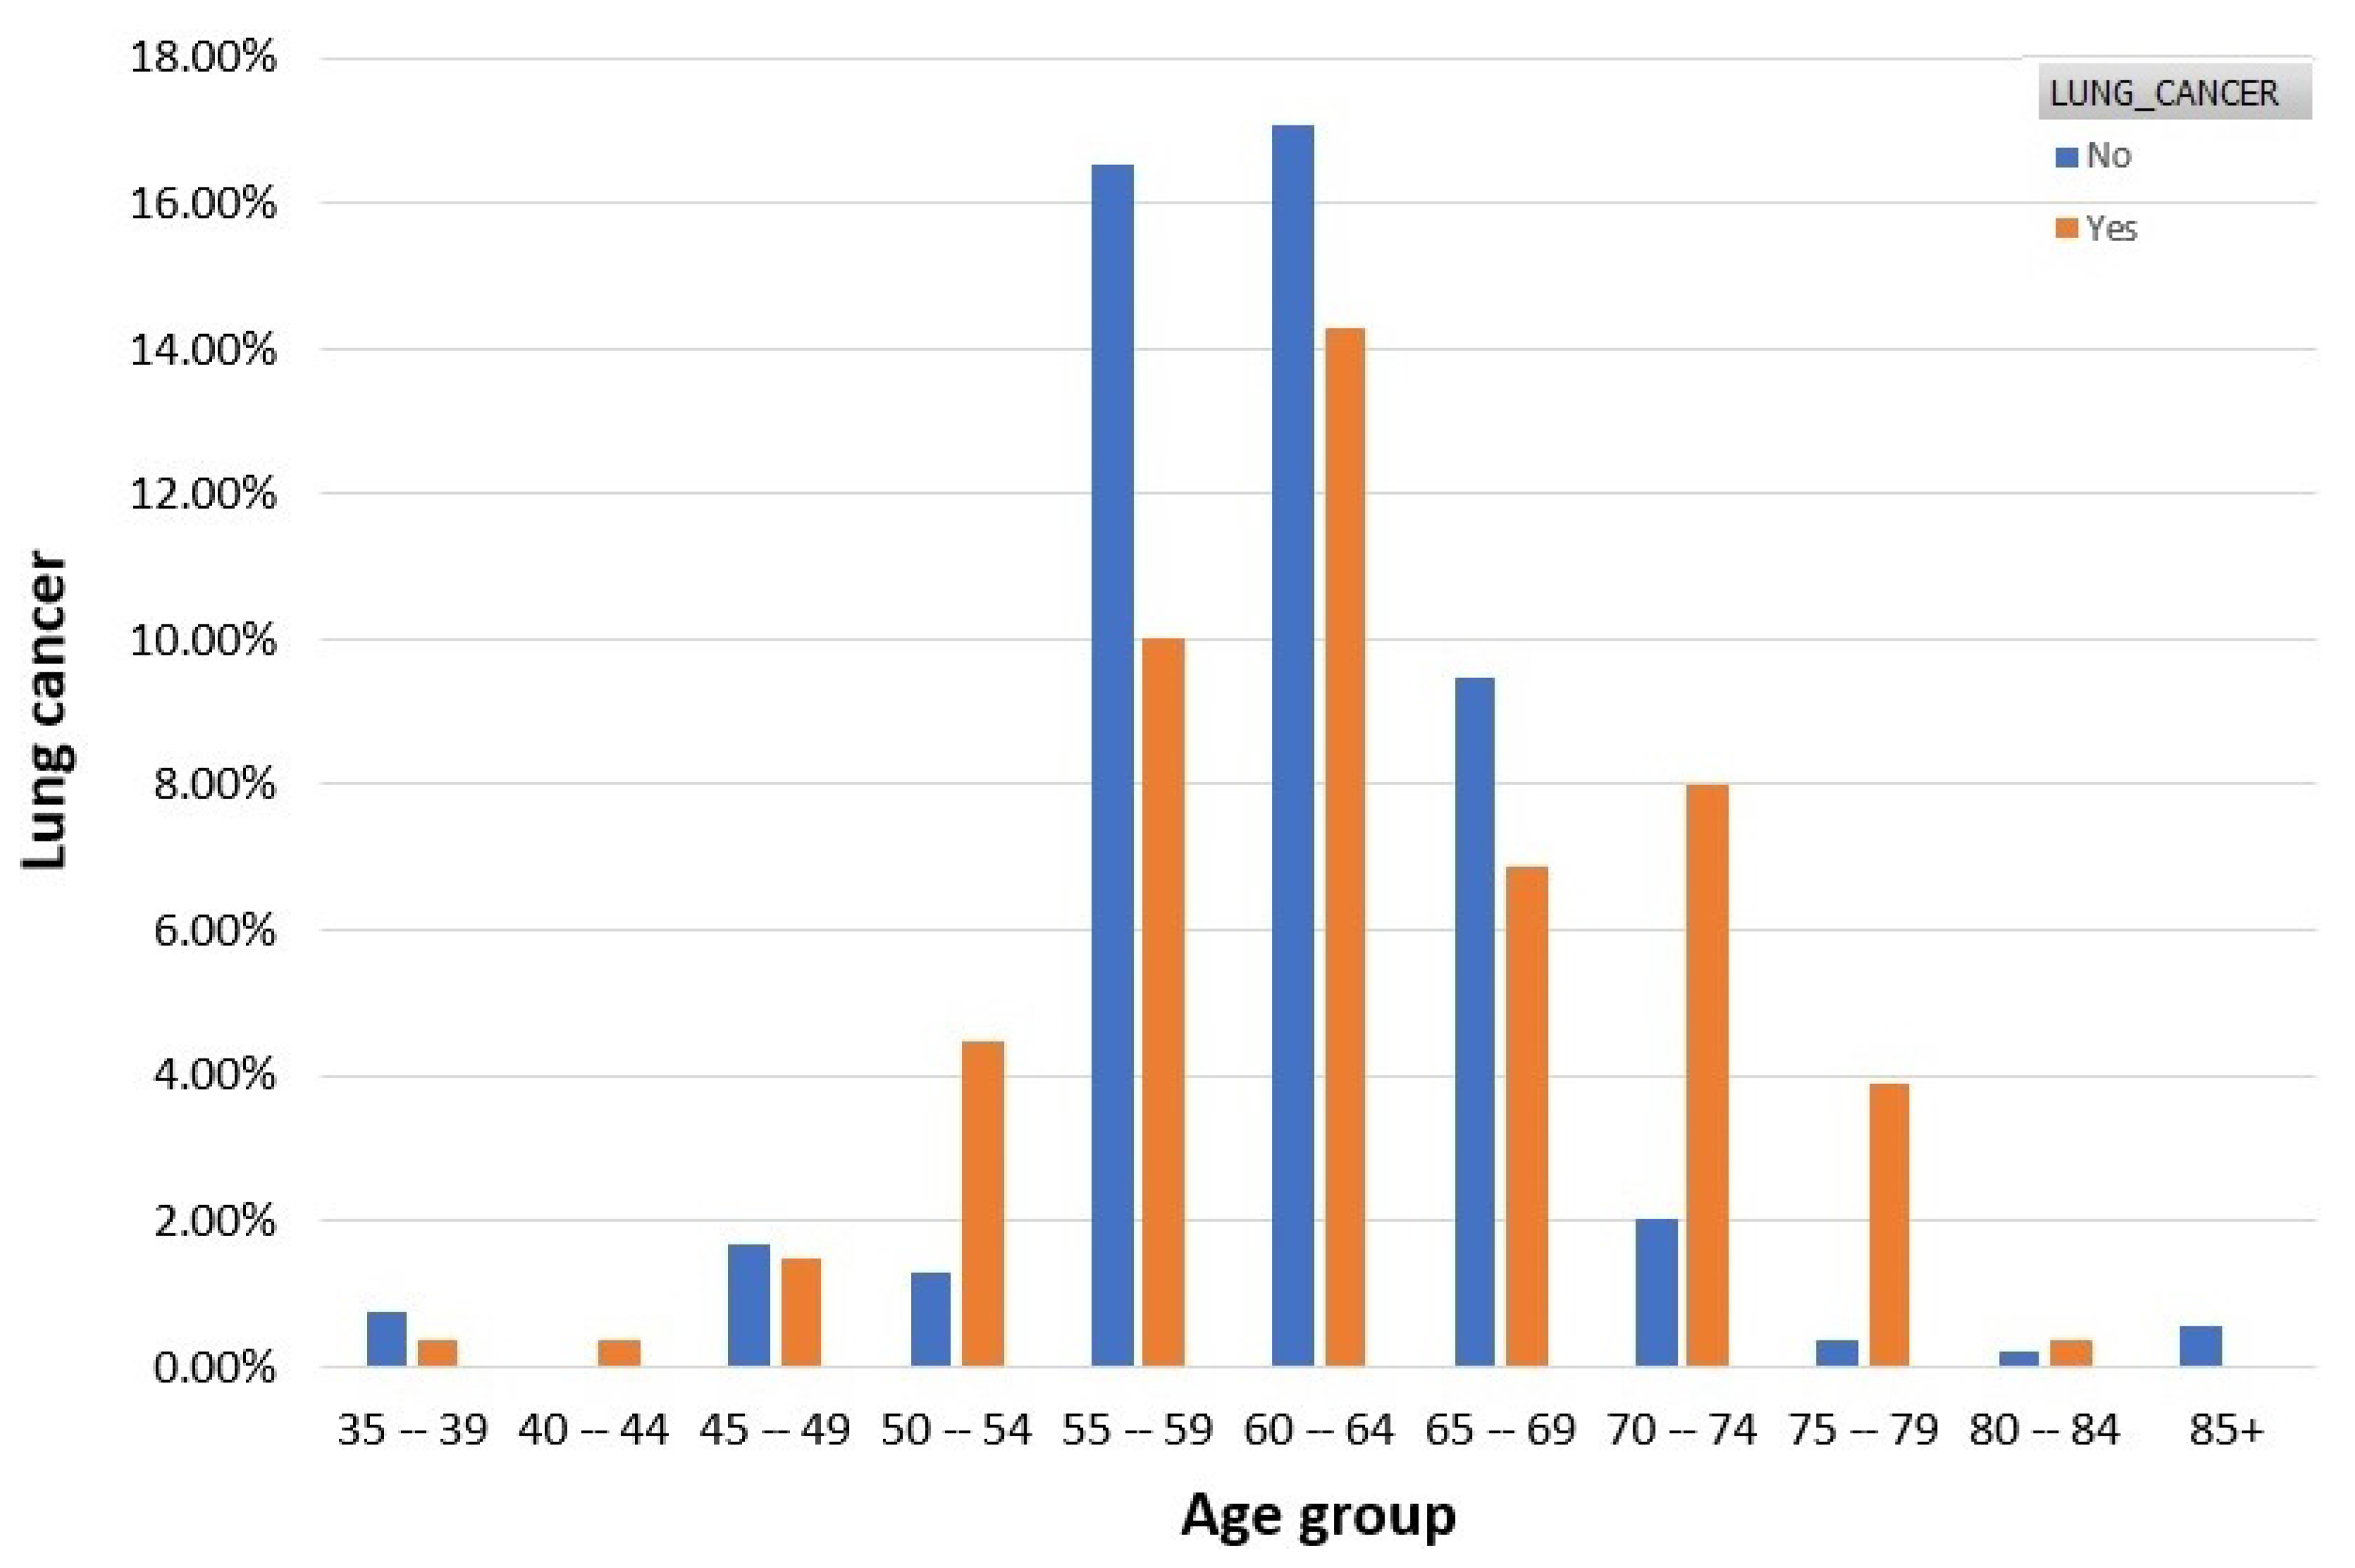
3.3. Features Analysis

In the context of features analysis, first, we measured the importance score of all involved features in the target class. For this purpose, two feature ranking methods were considered, i.e., gain ratio and random forest. We applied the gain ratio (GR) method [58], which assigns a score based on G R ( f i ) = H ( c ) H ( c | f i ) H ( f i ) , where H ( c ) is the entropy of the variable that captures the class values, H ( c | f i ) and H ( f i ) are the conditional entropy of the class given the feature, and the entropy of the feature f i ( i = 1 , 2 , , 15 ), respectively. Random forest computes the Gini impurity to measure the ability of a feature to optimally discriminate the instances in the two classes [59].
The ranking scores in descending order are presented in Table 1. We see that both methods ranked six out of fifteen features with the same order of importance according to the derived scores while some of the rest presented with proximal or reverse ordering. The features of low or no importance are scored by values close to zero and/or negative. However, all features are important signs of lung cancer occurrence and its management by physicians, thus the models will be trained and validated considering all of them.
Moreover, Figure 1 shows the participants’ distribution per age group. We observe that lung cancer mostly concerns people between 50 and 79 years old, where the age group 60–64 is the one with the highest frequency.
In Table 2, we show the features’ manifestation in each class. As for gender, men are approximately equally probable to be diagnosed with lung cancer compared to women. Moreover, from this table, we conclude that each of the examined features is activated in patients with lung cancer by 26% to 35%, while an important percentage noted these signs without having been diagnosed with lung cancer. Even if the disease had not occurred, risk-factor-signs monitoring and follow-up clinical examination may prevent or limit the unpleasant effects of the disease.

3.4. Machine Learning Models

In the research article, for the topic under consideration, various ML models were employed in order to identify which one performs better than the rest by evaluating their prediction performance. More specifically, we focused on naive Bayes (NB) [60], Bayesian network (BayesNet) [61], which are probabilistic classifiers, logistic regression (LR) [62] and logistic model tree (LMT) [63]. Moreover, we tested a commonly used kernel-based classifier, the support vector machine (SVM) [64]. Additionally, stochastic gradient descent (SGD) [65] learning of linear classifier under SVM convex loss function was applied. Furthermore, we considered some decision-tree-based models, such as J48 [66], random tree (RT) [67], rotation forest (RotF) [68] and reduced error pruning tree (RepTree) [69]. From the ensemble ML algorithms [70], random forest (RF) [71] and AdaBoostM1 [72] were exploited. Finally, a simple artificial neural network, the multi-layer perceptron (MLP) [73] and K-nearest neighbors (K-NN) [74], a distance-based classifier, were evaluated.

3.5. Evaluation Metrics

In order to assess the machine learning models’ performance, accuracy, precision, recall, F-Measure and AUC metrics were considered [75]. The desired metrics will be evaluated with the contribution of the confusion matrix which consists of the elements true positive (TP), true negative (TN), false positive (FP) and false negative (FN):
Precision = TP TP + FP , Recall = TP TP + FN
F - Measure = 2 Precision × Recall Precision + Recall Accuracy = TN + TP TN + TP + FN + FP
Accuracy summarizes the performance of the classification task and measures the number of correctly predicted instances from all data instances. We also examined recall, which captures the true positive rate or the sensitivity of a model to identify participants who actually had lung cancer and were correctly considered positive, relative to all positive participants. Precision is a measure of quality, while recall is a measure of quantity. The F-Measure is the harmonic mean of precision and recall and allows a model to be evaluated using a single score. Finally, the AUC ranges between zero and one and is used to determine the ML model with the best performance in discriminating Lung Cancer from Non-Lung Cancer instances. AUC is a measure of separability. If the AUC reaches one, it means that the models have a perfect ability to distinguish two class distributions.

4. Results and Discussion

4.1. Experiments Setup
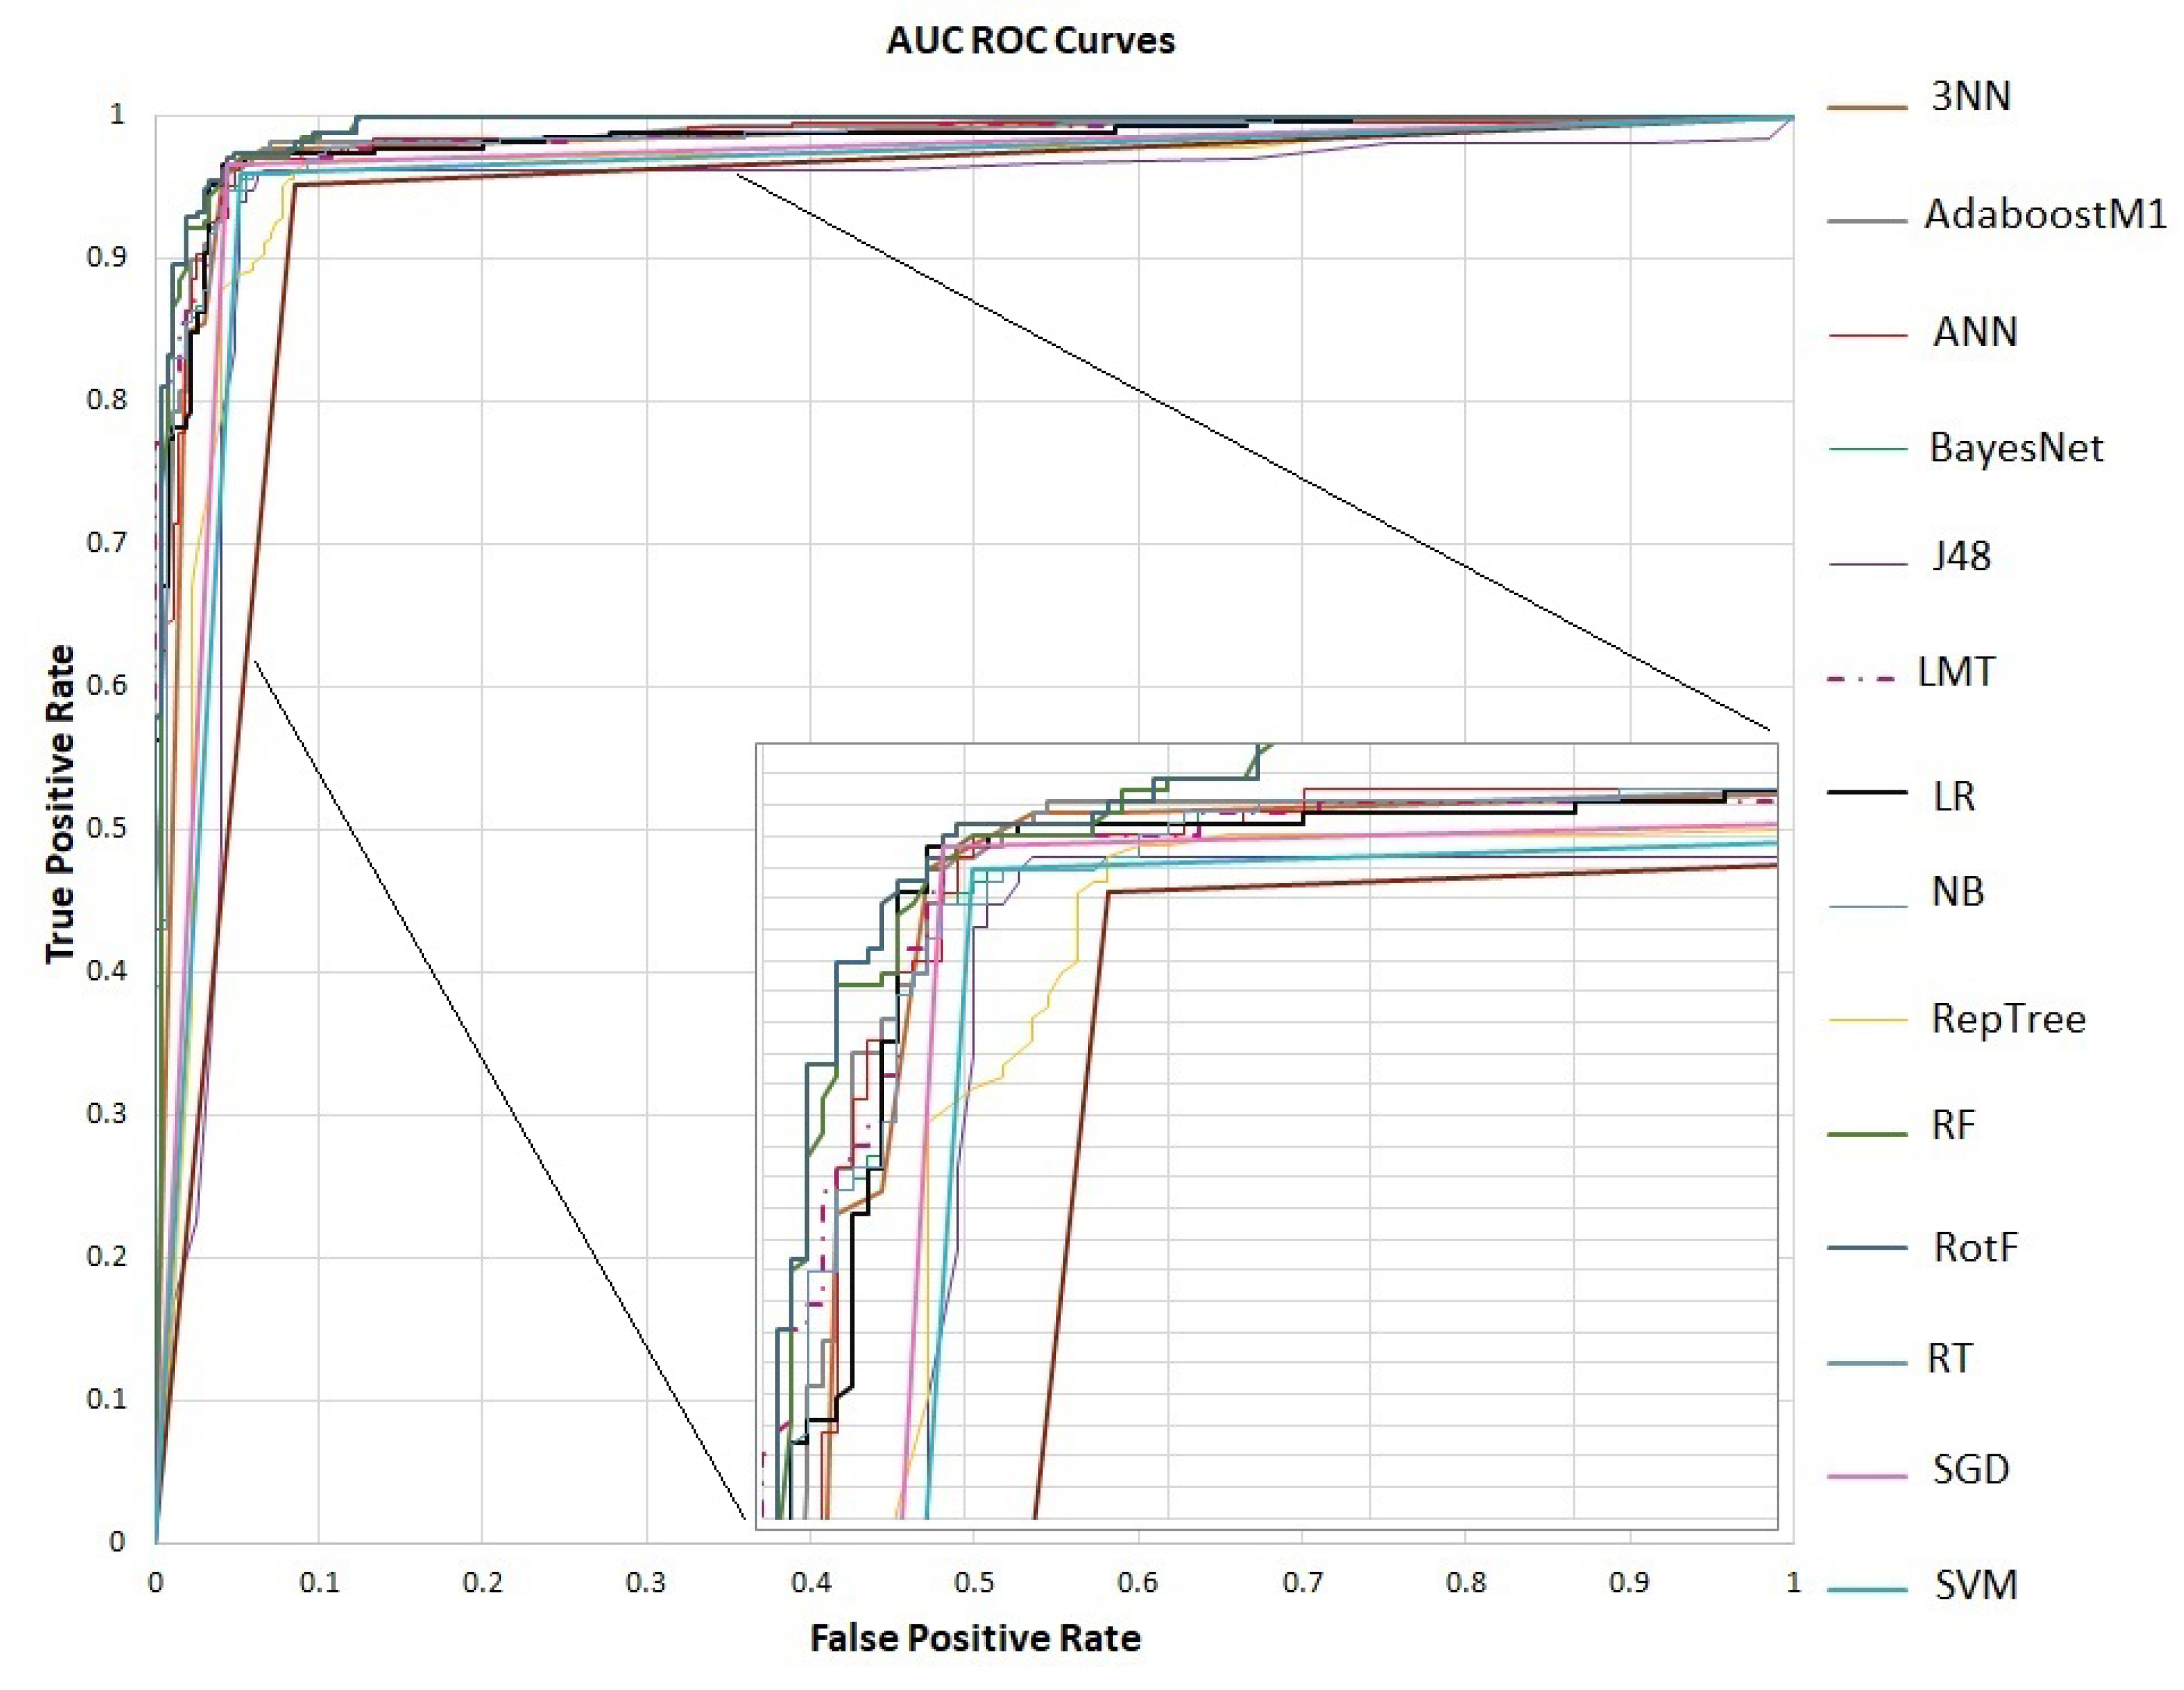
The performance of the ML models was evaluated in the Weka [76] environment, which offers a variety of libraries for data preprocessing, classification, clustering, prediction and visualization. In addition, the experiments were performed on a computer system with the following specifications: 11th generation Intel(R) Core(TM) i7-1165G7 @ 2.80 GHz, RAM 16 GB, Windows 11 Home, 64-bit OS and x64 processor. We applied 10-fold cross-validation and SMOTE to measure the effectiveness of the models on the balanced dataset of 540 instances. Finally, in Table 3, we list the optimal parameter settings of the proposed ML models.

4.2. Evaluation

In the context of this research work, plenty of machine learning models, such as NB, BayesNet, SGD, SVM, LR, ANN, KNN, J48, LMT, RF, RT, RepTree, RotF and AdaBoostM1 are evaluated in terms of accuracy, precision, recall, F-Measure and AUC in order to determine the model with the best predictive performance.
Specifically, in Table 4, we provide the models’ performance evaluation after SMOTE with 10-fold cross-validation. All our proposed models present percentages greater than 93.3% (RT). The best performance is achieved by the RotF model, which has the RF as its base classifier. It presents accuracy, precision, recall and F-Measure equal to 97.1% and an AUC of 99.3%. In addition, it should be noted that high percentages of AUC are achieved by RF with 99.1% and AdaBoostM1 with 98.5%, which has RF as its base classifier. Finally, in Figure 2, we plot the AUC ROC curve of the proposed machine learning models, where the superior performance of RotF is confirmed.
Moreover, in Table 5, models’ comparisons in terms of accuracy, recall and precision are made. The authors in the research work [38] used dataset [39] with the same number of features as us. The results of their models were obtained after 10-fold cross-validation. Our proposed models performed better in all three metrics compared to the models in the aforementioned research work. More specifically, The best performance of our proposed models in terms of accuracy, recall, and precision is achieved by the SVM with a percentage of 95.4%, respectively, whereas in [38], the best performance in the same metrics is achieved by the ANN with percentages of 92%, 94.2%, 90.8%, respectively. In all three metrics, our proposed models outperform.

4.3. Discussion

The proposed methodology in the current study is based on a dataset consisting of features that capture human habits (such as smoking, and alcohol consumption) and signs/symptoms as risk factors that lung cancer patients usually incur. However, these signs are not necessarily related to lung cancer disease, as we observed from features analysis in Section 3.3 of Materials and Methods. Unlike other cancers, lung cancer cannot be seen with the naked eye, and its symptoms are often accompanied by other disease symptoms. The most frequent symptoms are allergies, asthma, shortness of breath, and coughing [33]. In this work, we selected to train several classifiers on various risk factors related to such symptoms to be able to correctly identify the class label (Lung Cancer or Non-Lung Cancer) of an unknown instance, and thus the associated risk. Even if the disease has not manifested, risk-factor monitoring and follow-up clinical examination are appropriate practices for lung cancer management that may prevent or limit the unpleasant effects of the disease through early diagnosis. The clinical examination and identification of lung cancer are usually made when an X-ray, CT, PET-CT, and MRI scan of the patient’s chest is performed [77]. Hence, the considered dataset in combination with features derived from lung images would be quite beneficial for the early diagnosis of the disease and its stage. Let us recall that this study aims to identify the occurrence of lung cancer or not. Therefore, a binary classification problem was studied. From an ML perspective, the cancer stage identification could be solved following a multi-class classification strategy, such as methods one vs. one (OVO), and one vs. all (OVA) [25]. However, the dataset under consideration does not allow us to tackle the problem in such a manner.
Undoubtedly, machine learning has become an important tool for medical carers and clinicians for the early screening, prediction and/or prognosis of several diseases. Significant efforts have been made by researchers to gain access to medical information of individuals’ health records, collect data through questionnaires or generate their own datasets in the laboratories in order to support healthcare analytics by training and testing appropriate models which will give insights about the future development and prevention of disease. To exemplify, in our recent study [32], several classifiers were trained about the prediction of CKD disease, while in this study, lung cancer is the target health condition. These two cases show flexibility and diversity in terms of the applicability of machine learning in healthcare. Irrespective of the data and related disease, after class balancing with SMOTE, all models demonstrated high performance in all metrics. Moreover, promising outcomes were achieved by stacking and voting ensemble models as shown in [32] which here were not investigated. From tree models, the prevalence of the rotation forest classifier is verified both in the case of lung cancer and CKD.
Concluding the results and discussion section, we have to point out a limitation of our article. This research paper was based on a publicly available dataset [39], and it did not come from a hospital unit or institute, which could have given us richer data with various characteristics. Additionally, gaining access to sensitive medical data is difficult due to privacy reasons. However, the dataset we relied on had beneficial features that led us to derive reliable and accurate research results.

5. Conclusions

The lungs are the main organs of respiration. Humans never stop breathing until they die because the lungs supply their blood with oxygen, which is vital for human life. Lung cancer is the leading cause of death from malignancies in both genders. The patient’s lifespan is determined by the advanced stage of cancer. The earlier the diagnosis, the longer the life expectancy.
In this research work, we exploit supervised learning to develop models for identifying individuals with lung cancer manifestation based on several features–symptoms. Various machine learning models, including NB, BayesNet, SGD, SVM, LR, ANN, KNN, J48, LMT, RF, RT, RepTree, RotF, and AdaBoostM1, were evaluated in terms of accuracy, precision, recall, F-Measure and AUC. From the experiment results and after applying SMOTE with 10-fold cross-validation, the RotF outperformed the other models with an accuracy, precision, recall and F-Measure equal to 97.1% and an AUC of 99.3%. Additionally, our proposed models performed with better results in comparison to the models of reference [38] as shown in Table 5.
In future work, we aim to extend the current study along two axes. First, the machine learning framework will be enriched by exploiting deep learning methods and, especially, long short-term memory (LSTM) and convolutional neural networks (CNN) and comparing the results in terms of accuracy with research works in the same scope. Second, the evaluation of classification models in the same dataset will be made assuming a bootstrapping process [78] apart from the existing 10-fold cross-validation, an alternative data-splitting method for the models’ validation, which applies resampling with replacement in the original data.

Author Contributions

E.D. and M.T. conceived of the idea, designed and performed the experiments, analyzed the results, drafted the initial manuscript and revised the final manuscript. All authors have read and agreed to the published version of the manuscript.

Funding

This research received no external funding.

Data Availability Statement

Conflicts of Interest

The authors declare no conflict of interest.

References

  1. Schiller, H.B.; Montoro, D.T.; Simon, L.M.; Rawlins, E.L.; Meyer, K.B.; Strunz, M.; Vieira Braga, F.A.; Timens, W.; Koppelman, G.H.; Budinger, G.S.; et al. The human lung cell atlas: A high-resolution reference map of the human lung in health and disease. Am. J. Respir. Cell Mol. Biol. 2019, 61, 31–41. [Google Scholar] [CrossRef] [PubMed]
  2. Hervier, B.; Russick, J.; Cremer, I.; Vieillard, V. NK cells in the human lungs. Front. Immunol. 2019, 10, 1263. [Google Scholar] [CrossRef] [PubMed] [Green Version]
  3. Barroso, A.T.; Martín, E.M.; Romero, L.M.R.; Ruiz, F.O. Factors affecting lung function: A review of the literature. Arch. De Bronconeumol. 2018, 54, 327–332. [Google Scholar] [CrossRef]
  4. Mirza, S.; Clay, R.D.; Koslow, M.A.; Scanlon, P.D. COPD guidelines: A review of the 2018 GOLD report. In Mayo Clinic Proceedings; Elsevier: Amsterdam, The Netherlands, 2018; Volume 93, pp. 1488–1502. [Google Scholar]
  5. Dotan, Y.; So, J.Y.; Kim, V. Chronic bronchitis: Where are we now? Chronic Obstr. Pulm. Dis. J. COPD Found. 2019, 6, 178. [Google Scholar] [CrossRef]
  6. Stern, J.; Pier, J.; Litonjua, A.A. Asthma epidemiology and risk factors. In Seminars in Immunopathology; Springer: Berlin/Heidelberg, Germany, 2020; Volume 42, pp. 5–15. [Google Scholar]
  7. Bell, S.C.; Mall, M.A.; Gutierrez, H.; Macek, M.; Madge, S.; Davies, J.C.; Burgel, P.R.; Tullis, E.; Castaños, C.; Castellani, C.; et al. The future of cystic fibrosis care: A global perspective. Lancet Respir. Med. 2020, 8, 65–124. [Google Scholar] [CrossRef] [Green Version]
  8. Mandell, L.A.; Niederman, M.S. Aspiration pneumonia. N. Engl. J. Med. 2019, 380, 651–663. [Google Scholar] [CrossRef]
  9. Barta, J.A.; Powell, C.A.; Wisnivesky, J.P. Global epidemiology of lung cancer. Ann. Glob. Health 2019, 85, 8. [Google Scholar] [CrossRef] [Green Version]
  10. Bradley, S.H.; Kennedy, M.; Neal, R.D. Recognising lung cancer in primary care. Adv. Ther. 2019, 36, 19–30. [Google Scholar] [CrossRef] [Green Version]
  11. Athey, V.L.; Walters, S.J.; Rogers, T.K. Symptoms at lung cancer diagnosis are associated with major differences in prognosis. Thorax 2018, 73, 1177–1181. [Google Scholar] [CrossRef] [Green Version]
  12. Duma, N.; Santana-Davila, R.; Molina, J.R. Non–small cell lung cancer: Epidemiology, screening, diagnosis, and treatment. In Mayo Clinic Proceedings; Elsevier: Amsterdam, The Netherlands, 2019; Volume 94, pp. 1623–1640. [Google Scholar]
  13. Romaszko, A.M.; Doboszyńska, A. Multiple primary lung cancer: A literature review. Adv. Clin. Exp. Med. 2018, 27, 725–730. [Google Scholar] [CrossRef]
  14. No Tobacco ’22. Available online: https://www.lung.org/media/press-releases/no-tobacco-%E2%80%9922 (accessed on 6 August 2022).
  15. Wadowska, K.; Bil-Lula, I.; Trembecki, Ł.; Śliwińska-Mossoń, M. Genetic markers in lung cancer diagnosis: A review. Int. J. Mol. Sci. 2020, 21, 4569. [Google Scholar] [CrossRef] [PubMed]
  16. Thakur, S.K.; Singh, D.P.; Choudhary, J. Lung cancer identification: A review on detection and classification. Cancer Metastasis Rev. 2020, 39, 989–998. [Google Scholar] [CrossRef] [PubMed]
  17. Yang, G.; Xiao, Z.; Tang, C.; Deng, Y.; Huang, H.; He, Z. Recent advances in biosensor for detection of lung cancer biomarkers. Biosens. Bioelectron. 2019, 141, 111416. [Google Scholar] [CrossRef] [PubMed]
  18. Artificial Intelligence/Machine Learning (AI/ML)-Based: Software as a Medical Device (SaMD) Action Plan. Available online: https://www.fda.gov/media/145022/download (accessed on 30 July 2022).
  19. Mahler, M.; Auza, C.; Albesa, R.; Melus, C.; Wu, J.A. Regulatory aspects of artificial intelligence and machine learning-enabled software as medical devices (SaMD). In Precision Medicine and Artificial Intelligence; Elsevier: Amsterdam, The Netherlands, 2021; pp. 237–265. [Google Scholar]
  20. Dritsas, E.; Trigka, M. Data-Driven Machine-Learning Methods for Diabetes Risk Prediction. Sensors 2022, 22, 5304. [Google Scholar] [CrossRef] [PubMed]
  21. Dritsas, E.; Alexiou, S.; Konstantoulas, I.; Moustakas, K. Short-term Glucose Prediction based on Oral Glucose Tolerance Test Values. In Proceedings of the International Joint Conference on Biomedical Engineering Systems and Technologies—HEALTHINF, Vienna, Austria, 9–11 February 2022; Volume 5, pp. 249–255. [Google Scholar]
  22. Dritsas, E.; Fazakis, N.; Kocsis, O.; Fakotakis, N.; Moustakas, K. Long-Term Hypertension Risk Prediction with ML Techniques in ELSA Database. In Proceedings of the International Conference on Learning and Intelligent Optimization, Athens, Greece, 20–25 June 2021; Springer: Berlin/Heidelberg, Germany, 2021; pp. 113–120. [Google Scholar]
  23. De Felice, F.; Polimeni, A. Coronavirus disease (COVID-19): A machine learning bibliometric analysis. In Vivo 2020, 34, 1613–1617. [Google Scholar] [CrossRef] [PubMed]
  24. Dritsas, E.; Trigka, M. Machine Learning Methods for Hypercholesterolemia Long-Term Risk Prediction. Sensors 2022, 22, 5365. [Google Scholar] [CrossRef]
  25. Dritsas, E.; Alexiou, S.; Moustakas, K. COPD Severity Prediction in Elderly with ML Techniques. In Proceedings of the 15th International Conference on PErvasive Technologies Related to Assistive Environments, Corfu, Greece, 29 June–1 July 2022; pp. 185–189. [Google Scholar]
  26. Dritsas, E.; Trigka, M. Stroke Risk Prediction with Machine Learning Techniques. Sensors 2022, 22, 4670. [Google Scholar] [CrossRef] [PubMed]
  27. Dritsas, E.; Alexiou, S.; Moustakas, K. Cardiovascular Disease Risk Prediction with Supervised Machine Learning Techniques. In Proceedings of the ICT4AWE, Online, 23–25 April 2022; pp. 315–321. [Google Scholar]
  28. Spann, A.; Yasodhara, A.; Kang, J.; Watt, K.; Wang, B.; Goldenberg, A.; Bhat, M. Applying machine learning in liver disease and transplantation: A comprehensive review. Hepatology 2020, 71, 1093–1105. [Google Scholar] [CrossRef]
  29. Konstantoulas, I.; Kocsis, O.; Dritsas, E.; Fakotakis, N.; Moustakas, K. Sleep Quality Monitoring with Human Assisted Corrections. In Proceedings of the International Joint Conference on Computational Intelligence (IJCCI), Online, 25–27 October 2021; pp. 435–444. [Google Scholar]
  30. Konerman, M.A.; Beste, L.A.; Van, T.; Liu, B.; Zhang, X.; Zhu, J.; Saini, S.D.; Su, G.L.; Nallamothu, B.K.; Ioannou, G.N.; et al. Machine learning models to predict disease progression among veterans with hepatitis C virus. PLoS ONE 2019, 14, e0208141. [Google Scholar] [CrossRef]
  31. Yu, C.S.; Lin, Y.J.; Lin, C.H.; Wang, S.T.; Lin, S.Y.; Lin, S.H.; Wu, J.L.; Chang, S.S. Predicting metabolic syndrome with machine learning models using a decision tree algorithm: Retrospective cohort study. JMIR Med. Inf. 2020, 8, e17110. [Google Scholar] [CrossRef]
  32. Dritsas, E.; Trigka, M. Machine Learning Techniques for Chronic Kidney Disease Risk Prediction. Big Data Cogn. Comput. 2022, 6, 98. [Google Scholar] [CrossRef]
  33. Singh, G.A.P.; Gupta, P. Performance analysis of various machine learning-based approaches for detection and classification of lung cancer in humans. Neural Comput. Appl. 2019, 31, 6863–6877. [Google Scholar] [CrossRef]
  34. Patra, R. Prediction of lung cancer using machine learning classifier. In Proceedings of the International Conference on Computing Science, Communication and Security, Gujarat, India, 26–27 March 2020; Springer: Berlin/Heidelberg, Germany, 2020; pp. 132–142. [Google Scholar]
  35. Radhika, P.; Nair, R.A.; Veena, G. A comparative study of lung cancer detection using machine learning algorithms. In Proceedings of the 2019 IEEE International Conference on Electrical, Computer and Communication Technologies (ICECCT), Prague, Czech Republic, 20–22 February 2019; pp. 1–4. [Google Scholar]
  36. Bartholomai, J.A.; Frieboes, H.B. Lung cancer survival prediction via machine learning regression, classification, and statistical techniques. In Proceedings of the 2018 IEEE International Symposium on Signal Processing and Information Technology (ISSPIT), Louisville, KY, USA, 6–8 December 2018; pp. 632–637. [Google Scholar]
  37. Faisal, M.I.; Bashir, S.; Khan, Z.S.; Khan, F.H. An evaluation of machine learning classifiers and ensembles for early stage prediction of lung cancer. In Proceedings of the 2018 3rd International Conference on Emerging Trends in Engineering, Sciences and Technology (ICEEST), Thrissur, Kerala, India, 18–20 January 2018; pp. 1–4. [Google Scholar]
  38. Vieira, E.; Ferreira, D.; Neto, C.; Abelha, A.; Machado, J. Data Mining Approach to Classify Cases of Lung Cancer. In World Conference on Information Systems and Technologies; Springer: Berlin/Heidelberg, Germany, 2021; pp. 511–521. [Google Scholar]
  39. Lung Cancer Prediction Dataset. Available online: https://www.kaggle.com/datasets/mysarahmadbhat/lung-cancer (accessed on 3 July 2022).
  40. Xie, Y.; Meng, W.Y.; Li, R.Z.; Wang, Y.W.; Qian, X.; Chan, C.; Yu, Z.F.; Fan, X.X.; Pan, H.D.; Xie, C.; et al. Early lung cancer diagnostic biomarker discovery by machine learning methods. Transl. Oncol. 2021, 14, 100907. [Google Scholar] [CrossRef]
  41. Stapelfeld, C.; Dammann, C.; Maser, E. Sex-specificity in lung cancer risk. Int. J. Cancer 2020, 146, 2376–2382. [Google Scholar] [CrossRef] [PubMed]
  42. de Groot, P.M.; Wu, C.C.; Carter, B.W.; Munden, R.F. The epidemiology of lung cancer. Transl. Lung Cancer Res. 2018, 7, 220. [Google Scholar] [CrossRef] [PubMed]
  43. O’Keeffe, L.M.; Taylor, G.; Huxley, R.R.; Mitchell, P.; Woodward, M.; Peters, S.A. Smoking as a risk factor for lung cancer in women and men: A systematic review and meta-analysis. BMJ Open 2018, 8, e021611. [Google Scholar] [CrossRef] [PubMed] [Green Version]
  44. Al-Bander, B.; Fadil, Y.A.; Mahdi, H. Multi-Criteria Decision Support System for Lung Cancer Prediction; IOP Conference Series: Materials Science and Engineering; IOP Publishing: Bristol, UK, 2021; Volume 1076, p. 012036. [Google Scholar]
  45. Hu, T.; Xiao, J.; Peng, J.; Kuang, X.; He, B. Relationship between resilience, social support as well as anxiety/depression of lung cancer patients: A cross-sectional observation study. J. Cancer Res. Ther. 2018, 14, 72. [Google Scholar]
  46. Leshargie, C.T.; Alebel, A.; Kibret, G.D.; Birhanu, M.Y.; Mulugeta, H.; Malloy, P.; Wagnew, F.; Ewunetie, A.A.; Ketema, D.B.; Aderaw, A.; et al. The impact of peer pressure on cigarette smoking among high school and university students in Ethiopia: A systemic review and meta-analysis. PLoS ONE 2019, 14, e0222572. [Google Scholar] [CrossRef]
  47. Schabath, M.B.; Cote, M.L. Cancer progress and priorities: Lung cancer. Cancer Epidemiol. Prev. Biomarkers 2019, 28, 1563–1579. [Google Scholar] [CrossRef] [Green Version]
  48. Avancini, A.; Sartori, G.; Gkountakos, A.; Casali, M.; Trestini, I.; Tregnago, D.; Bria, E.; Jones, L.W.; Milella, M.; Lanza, M.; et al. Physical activity and exercise in lung cancer care: Will promises be fulfilled? Oncologist 2020, 25, e555–e569. [Google Scholar] [CrossRef] [Green Version]
  49. Kantor, E.D.; Hsu, M.; Du, M.; Signorello, L.B. Allergies and asthma in relation to cancer risk. Cancer Epidemiol. Prev. Biomarkers 2019, 28, 1395–1403. [Google Scholar] [CrossRef] [PubMed]
  50. Alsharairi, N.A. The effects of dietary supplements on asthma and lung cancer risk in smokers and non-smokers: A review of the literature. Nutrients 2019, 11, 725. [Google Scholar] [CrossRef] [PubMed] [Green Version]
  51. Brenner, D.R.; Fehringer, G.; Zhang, Z.F.; Lee, Y.C.A.; Meyers, T.; Matsuo, K.; Ito, H.; Vineis, P.; Stucker, I.; Boffetta, P.; et al. Alcohol consumption and lung cancer risk: A pooled analysis from the International Lung Cancer Consortium and the SYNERGY study. Cancer Epidemiol. 2019, 58, 25–32. [Google Scholar] [CrossRef] [PubMed]
  52. Harle, A.S.; Blackhall, F.H.; Molassiotis, A.; Yorke, J.; Dockry, R.; Holt, K.J.; Yuill, D.; Baker, K.; Smith, J.A. Cough in patients with lung cancer: A longitudinal observational study of characterization and clinical associations. Chest 2019, 155, 103–113. [Google Scholar] [CrossRef] [PubMed] [Green Version]
  53. Phillips, M.; Bauer, T.L.; Pass, H.I. A volatile biomarker in breath predicts lung cancer and pulmonary nodules. J. Breath Res. 2019, 13, 036013. [Google Scholar] [CrossRef] [Green Version]
  54. Brady, G.C.; Roe, J.W.; O’Brien, M.; Boaz, A.; Shaw, C. An investigation of the prevalence of swallowing difficulties and impact on quality of life in patients with advanced lung cancer. Support. Care Cancer 2018, 26, 515–519. [Google Scholar] [CrossRef]
  55. Malinowska, K. The relationship between chest pain and level of perioperative anxiety in patients with lung cancer. Pol. J. Surg. 2018, 90, 23–27. [Google Scholar] [CrossRef]
  56. Maldonado, S.; López, J.; Vairetti, C. An alternative SMOTE oversampling strategy for high-dimensional datasets. Appl. Soft Comput. 2019, 76, 380–389. [Google Scholar] [CrossRef]
  57. Dritsas, E.; Fazakis, N.; Kocsis, O.; Moustakas, K.; Fakotakis, N. Optimal Team Pairing of Elder Office Employees with Machine Learning on Synthetic Data. In Proceedings of the 2021 12th International Conference on Information, Intelligence, Systems & Applications (IISA), Chania, Crete, Greece, 12–14 July 2021; pp. 1–4. [Google Scholar]
  58. Gnanambal, S.; Thangaraj, M.; Meenatchi, V.; Gayathri, V. Classification algorithms with attribute selection: An evaluation study using WEKA. Int. J. Adv. Netw. Appl. 2018, 9, 3640–3644. [Google Scholar]
  59. Darst, B.F.; Malecki, K.C.; Engelman, C.D. Using recursive feature elimination in random forest to account for correlated variables in high dimensional data. BMC Genet. 2018, 19, 1–6. [Google Scholar] [CrossRef] [Green Version]
  60. Berrar, D. Bayes’ theorem and naive Bayes classifier. In Encyclopedia of Bioinformatics and Computational Biology: ABC of Bioinformatics; Elsevier: Amsterdam, The Netherlands, 2019; pp. 403–412. [Google Scholar]
  61. McLachlan, S.; Dube, K.; Hitman, G.A.; Fenton, N.E.; Kyrimi, E. Bayesian networks in healthcare: Distribution by medical condition. Artif. Intell. Med. 2020, 107, 101912. [Google Scholar] [CrossRef] [PubMed]
  62. Nusinovici, S.; Tham, Y.C.; Yan, M.Y.C.; Ting, D.S.W.; Li, J.; Sabanayagam, C.; Wong, T.Y.; Cheng, C.Y. Logistic regression was as good as machine learning for predicting major chronic diseases. J. Clin. Epidemiol. 2020, 122, 56–69. [Google Scholar] [CrossRef] [PubMed]
  63. Truong, X.L.; Mitamura, M.; Kono, Y.; Raghavan, V.; Yonezawa, G.; Truong, X.Q.; Do, T.H.; Tien Bui, D.; Lee, S. Enhancing prediction performance of landslide susceptibility model using hybrid machine learning approach of bagging ensemble and logistic model tree. Appl. Sci. 2018, 8, 1046. [Google Scholar] [CrossRef] [Green Version]
  64. Pisner, D.A.; Schnyer, D.M. Support vector machine. In Machine Learning; Elsevier: Amsterdam, The Netherlands, 2020; pp. 101–121. [Google Scholar]
  65. Netrapalli, P. Stochastic gradient descent and its variants in machine learning. J. Indian Inst. Sci. 2019, 99, 201–213. [Google Scholar] [CrossRef]
  66. Jimoh, I.A.; Ismaila, I.; Olalere, M. Enhanced Decision Tree-J48 with SMOTE Machine Learning Algorithm for Effective Botnet Detection in Imbalance Dataset. In Proceedings of the 2019 15th International Conference on Electronics, Computer and Computation (ICECCO), Abuja, Nigeria, 10–12 December 2019; pp. 1–8. [Google Scholar]
  67. Joloudari, J.H.; Hassannataj Joloudari, E.; Saadatfar, H.; Ghasemigol, M.; Razavi, S.M.; Mosavi, A.; Nabipour, N.; Shamshirband, S.; Nadai, L. Coronary artery disease diagnosis; ranking the significant features using a random trees model. Int. J. Environ. Res. Public Health 2020, 17, 731. [Google Scholar] [CrossRef] [PubMed] [Green Version]
  68. Naghibi, S.A.; Dolatkordestani, M.; Rezaei, A.; Amouzegari, P.; Heravi, M.T.; Kalantar, B.; Pradhan, B. Application of rotation forest with decision trees as base classifier and a novel ensemble model in spatial modeling of groundwater potential. Environ. Monit. Assess. 2019, 191, 1–20. [Google Scholar] [CrossRef]
  69. Pham, B.T.; Prakash, I.; Singh, S.K.; Shirzadi, A.; Shahabi, H.; Bui, D.T. Landslide susceptibility modeling using Reduced Error Pruning Trees and different ensemble techniques: Hybrid machine learning approaches. Catena 2019, 175, 203–218. [Google Scholar] [CrossRef]
  70. Sagi, O.; Rokach, L. Ensemble learning: A survey. Wiley Interdiscip. Rev. Data Min. Knowl. Discov. 2018, 8, e1249. [Google Scholar] [CrossRef]
  71. Palimkar, P.; Shaw, R.N.; Ghosh, A. Machine learning technique to prognosis diabetes disease: Random forest classifier approach. In Advanced Computing and Intelligent Technologies; Springer: Berlin/Heidelberg, Germany, 2022; pp. 219–244. [Google Scholar]
  72. Polat, K.; Sentürk, U. A novel ML approach to prediction of breast cancer: Combining of mad normalization, KMC based feature weighting and AdaBoostM1 classifier. In Proceedings of the 2018 2nd International Symposium on Multidisciplinary Studies and Innovative Technologies (ISMSIT), Ankara, Turkey, 19–21 October 2018; pp. 1–4. [Google Scholar]
  73. Masih, N.; Naz, H.; Ahuja, S. Multilayer perceptron based deep neural network for early detection of coronary heart disease. Health Technol. 2021, 11, 127–138. [Google Scholar] [CrossRef]
  74. Cunningham, P.; Delany, S.J. k-Nearest neighbour classifiers-A Tutorial. ACM Comput. Surv. 2021, 54, 1–25. [Google Scholar] [CrossRef]
  75. Zaman, M.; Lung, C.H. Evaluation of machine learning techniques for network intrusion detection. In Proceedings of the NOMS 2018-2018 IEEE/IFIP Network Operations and Management Symposium, Taipei, Taiwan, 23–27 April 2018; pp. 1–5. [Google Scholar]
  76. Weka Tool. Available online: https://www.weka.io/ (accessed on 3 July 2022).
  77. Vial, A.; Stirling, D.; Field, M.; Ros, M.; Ritz, C.; Carolan, M.; Holloway, L.; Miller, A.A. The role of deep learning and radiomic feature extraction in cancer-specific predictive modelling: A review. Transl. Cancer Res. 2018, 7, 803–816. [Google Scholar] [CrossRef]
  78. Xu, Y.; Goodacre, R. On splitting training and validation set: A comparative study of cross-validation, bootstrap and systematic sampling for estimating the generalization performance of supervised learning. J. Anal. Test. 2018, 2, 249–262. [Google Scholar] [CrossRef] [PubMed]
Figure 1. Participants distribution in the age groups in the balanced data.
Bdcc 06 00139 g001
Figure 2. Models Evaluation Based on AUC ROC Curves.
Bdcc 06 00139 g002
Table 1. Features’ ranking in the balanced data.
Random ForestGain Ratio
FeatureRankingFeatureRanking
Age0.3462Allergy0.3951
Allergy0.2809Alcohol0.3699
Alcohol0.2665Swallow Difficulty0.3256
Wheezing0.2567Wheezing0.3081
Coughing0.2442Peer Pressure0.2920
Swallow Difficulty0.2327Coughing0.2473
Peer Pressure0.2245Age0.1561
Chronic Disease0.1662Chronic Disease0.1177
Chest Pain0.0958Chest Pain0.0438
Anxiety0.0774Yellow Fingers0.0291
Smoking0.0753Anxiety0.0290
Yellow Fingers0.0725Smoking0.0220
Shortness of Breath0.0431Shortness of Breath0.0133
Gender−0.0053Gender0.0025
Fatigue−0.0334Fatigue0.0003
Table 2. The distribution of participants in terms of feature values and class label in the balanced data.
FeatureLung CancerFeatureLung Cancer
GenderNoYesAllergyNoYes
Female26.11%23.15%No49.07%19.07%
Male23.89%26.85%Yes0.93%30.93%
SmokingNoYesWheezingNoYes
No30.00%21.30%No47.41%19.81%
Yes20.00%28.70%Yes2.59%30.19%
Yellow FingersNoYesAlcoholNoYes
No29.81%19.81%No48.70%19.44%
Yes20.19%30.19%Yes1.30%30.56%
AnxietyNoYesCoughingNoYes
No33.52%23.70%No45.00%18.70%
Yes16.48%26.30%Yes5.00%31.30%
Peer PressureNoYesShortness of BreathNoYes
No48.15%23.15%No11.67%17.41%
Yes1.85%26.85%Yes38.33%32.59%
Chronic DiseaseNoYesShallow DifficultyNoYes
No41.85%23.70%No49.07%24.07%
Yes8.15%26.30%Yes0.93%25.93%
FatigueNoYesChest PainNoYes
No15.93%15.00%No32.59%20.37%
Yes34.07%35.00%Yes17.41%29.63%
Table 3. Machine learning models’ settings.
ModelsParameters
NB useKernelEstimator: False
useSupervisedDiscretization: True
BayesNetestimator: simpleEstimator
search Algorithm: K2
useADTree: True
SGDepochs = 500
epsilon = 0.001
lambda = 10 4
learningRate = 0.01
lossFunction: Hinge loss (SVM)
SVMeps = 0.001
gamma = 0.0
kernel type: linear
loss = 0.1
LRridge = 10 8
useConjugateGradientDescent: False
ANNhidden layers: `a’
learning rate: 0.3
momentum: 0.2
training time: 500
KNNK = 3
Search Algorithm: LinearNNSearch
with Euclidean
J48reducedErrorPruning: False
savelnstanceData: False
subtreeRaising: True
LMTerrorOnProbabilities: False
fastRegression: True
numInstances = 15
useAIC: False
RFmaxDepth = 0
numIterations = 100
numFeatures = 0
RTmaxDepth = 0
minNum = 1.0
minVarianceProp = 0.001
DT (RepTree)maxDepth = −1
minNum = 2.0
minVarianceProp = 0.001
RotFclassifier: Random Forest
numberOfGroups: False
projectionFilter: PrincipalComponents
AdaBoostM1classifier: Random Forest
resume: False
useResampling: False
Table 4. Performance evaluation after SMOTE with 10-fold cross validation.
AccuracyPrecisionRecallF-MeasureAUC
NB0.9500.9500.9500.9500.982
BayesNet0.9500.9500.9500.9500.982
SGD0.9600.9600.9600.9600.960
SVM0.9540.9540.9540.9540.954
LR0.9630.9630.9630.9630.983
ANN0.9460.9460.9460.9460.983
3NN0.9600.9590.9590.9590.978
J480.9480.9480.9480.9480.938
LMT0.9590.9590.9590.9590.985
RF0.9520.9520.9520.9520.991
RT0.9330.9330.9330.9330.933
DT(RepTree)0.9370.9370.9370.9370.955
RotF0.9710.9710.9710.9710.993
AdaBoostM10.9540.9540.9540.9540.985
Table 5. Models’ comparison in terms of accuracy, recall and precision.
AccuracyRecallPrecision
Proposed Models[38]Proposed Models[38]Proposed Models[38]
SVM95.4%90.9%95.4%91.6%95.4%90.3%
ANN94.6%92%94.6%94.2%94.6%90.8%
NB95%88.7%95%86.2%95%91%
DT93.7%87.4%93.7%91.2%93.7%85.2%
KNN95.2%85.5%95.2%87.4%95.2%84.7%
Publisher’s Note: MDPI stays neutral with regard to jurisdictional claims in published maps and institutional affiliations.

