
Virtual Reality Adaptation Using Electrodermal Activity to Support the User Experience


Abstract
:1. Introduction
2. Related Work
2.1. Social Virtual Reality
2.2. Electrodermal Activity and Cognitive Workload
2.3. Physiological Adaptation
3. Online Physiologically-Adaptive System
4. User Study
4.1. Participants
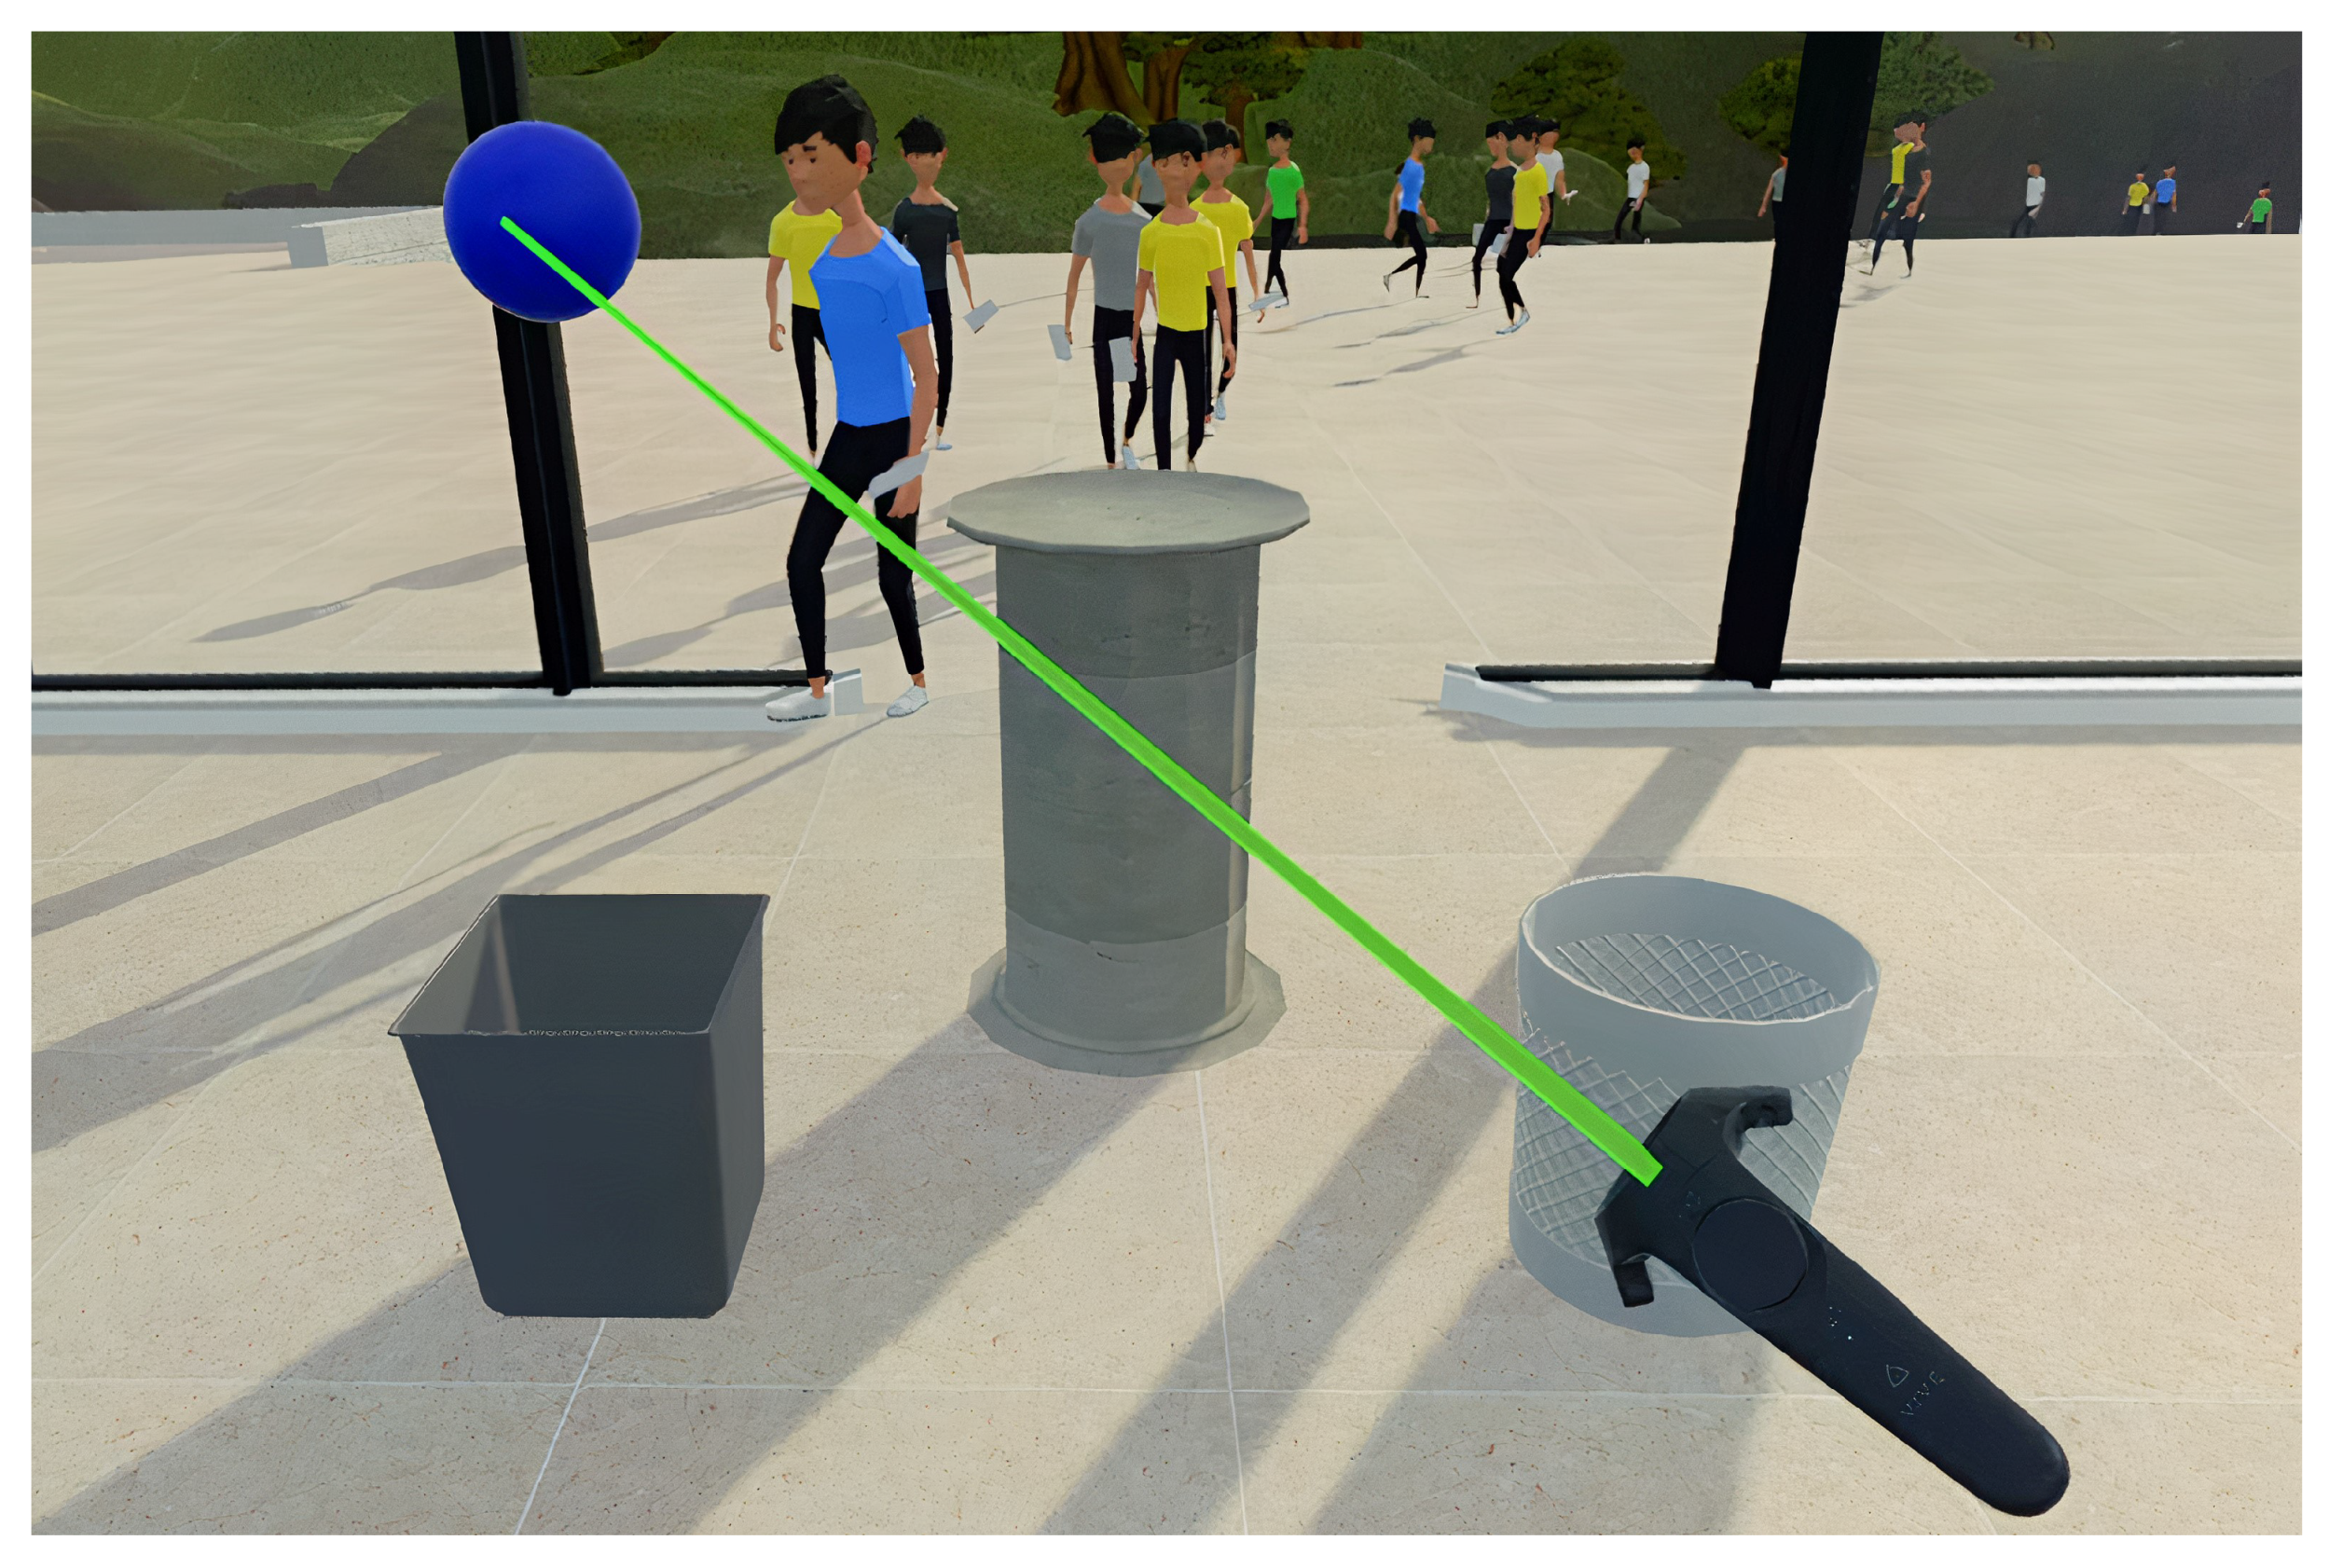
4.2. Apparatus
4.3. Measurements
4.4. Procedure
5. Results
5.1. Analysis
5.2. Non-Adaptive Conditions
5.3. Adaptive Condition
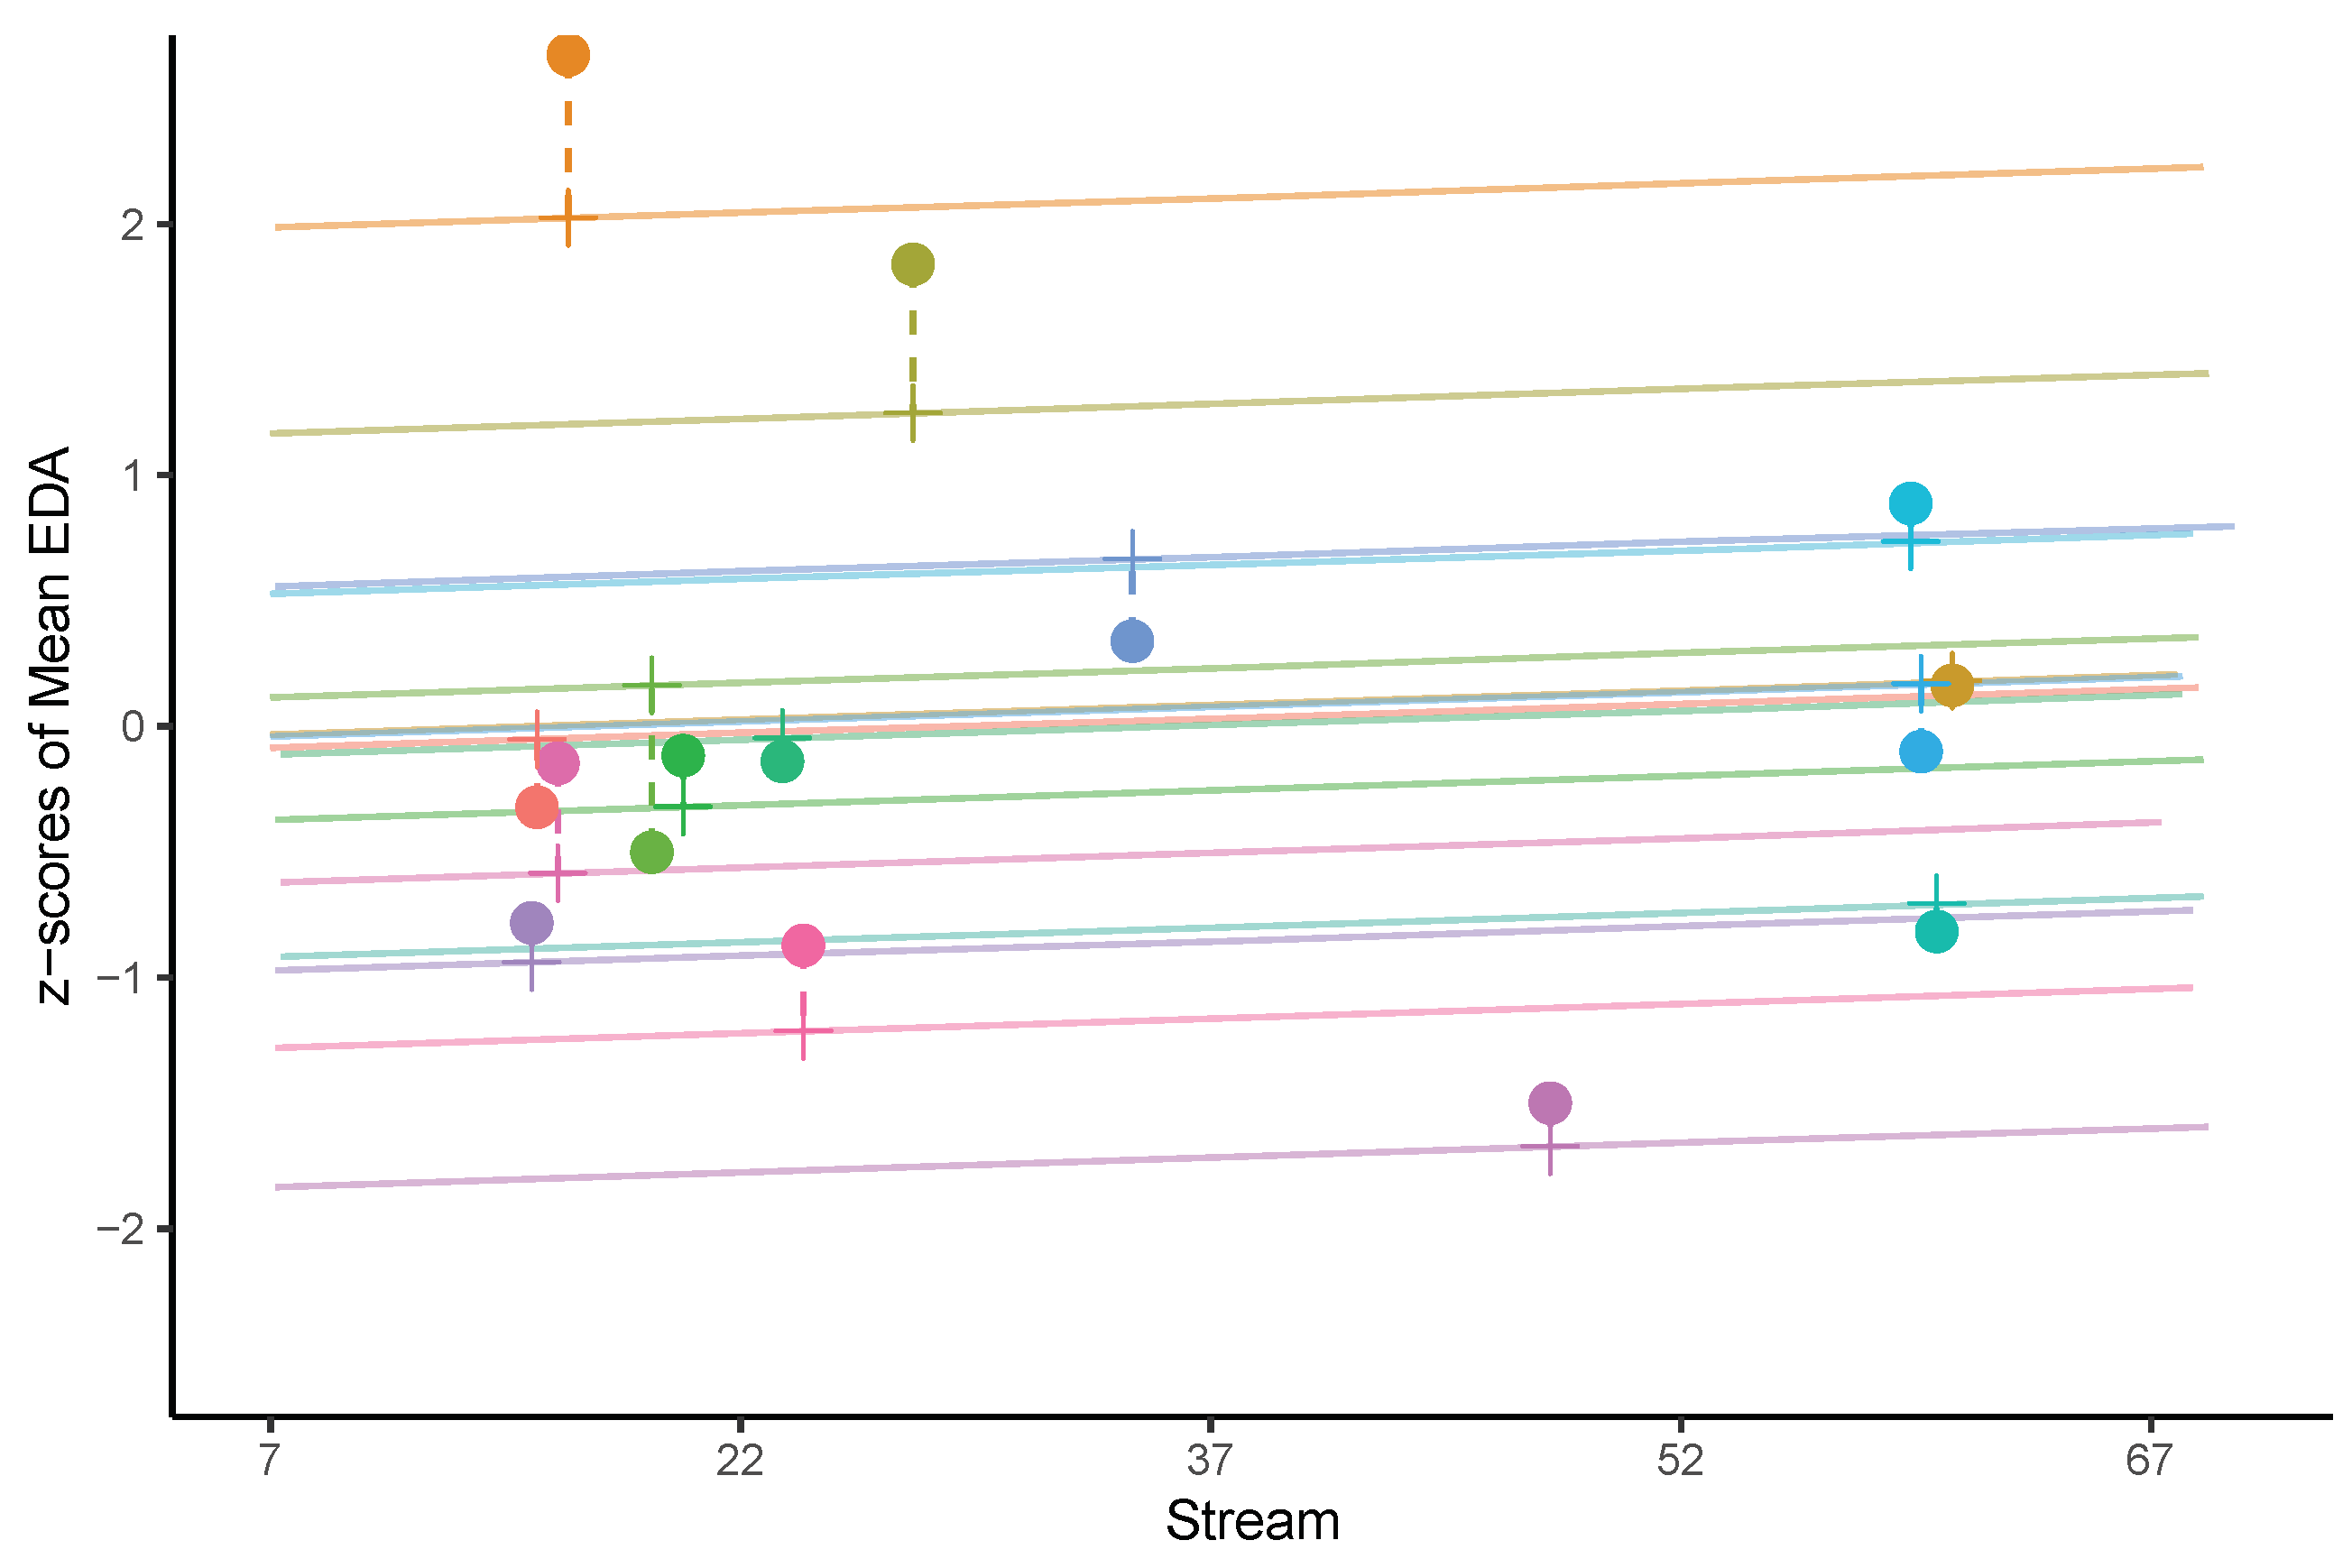
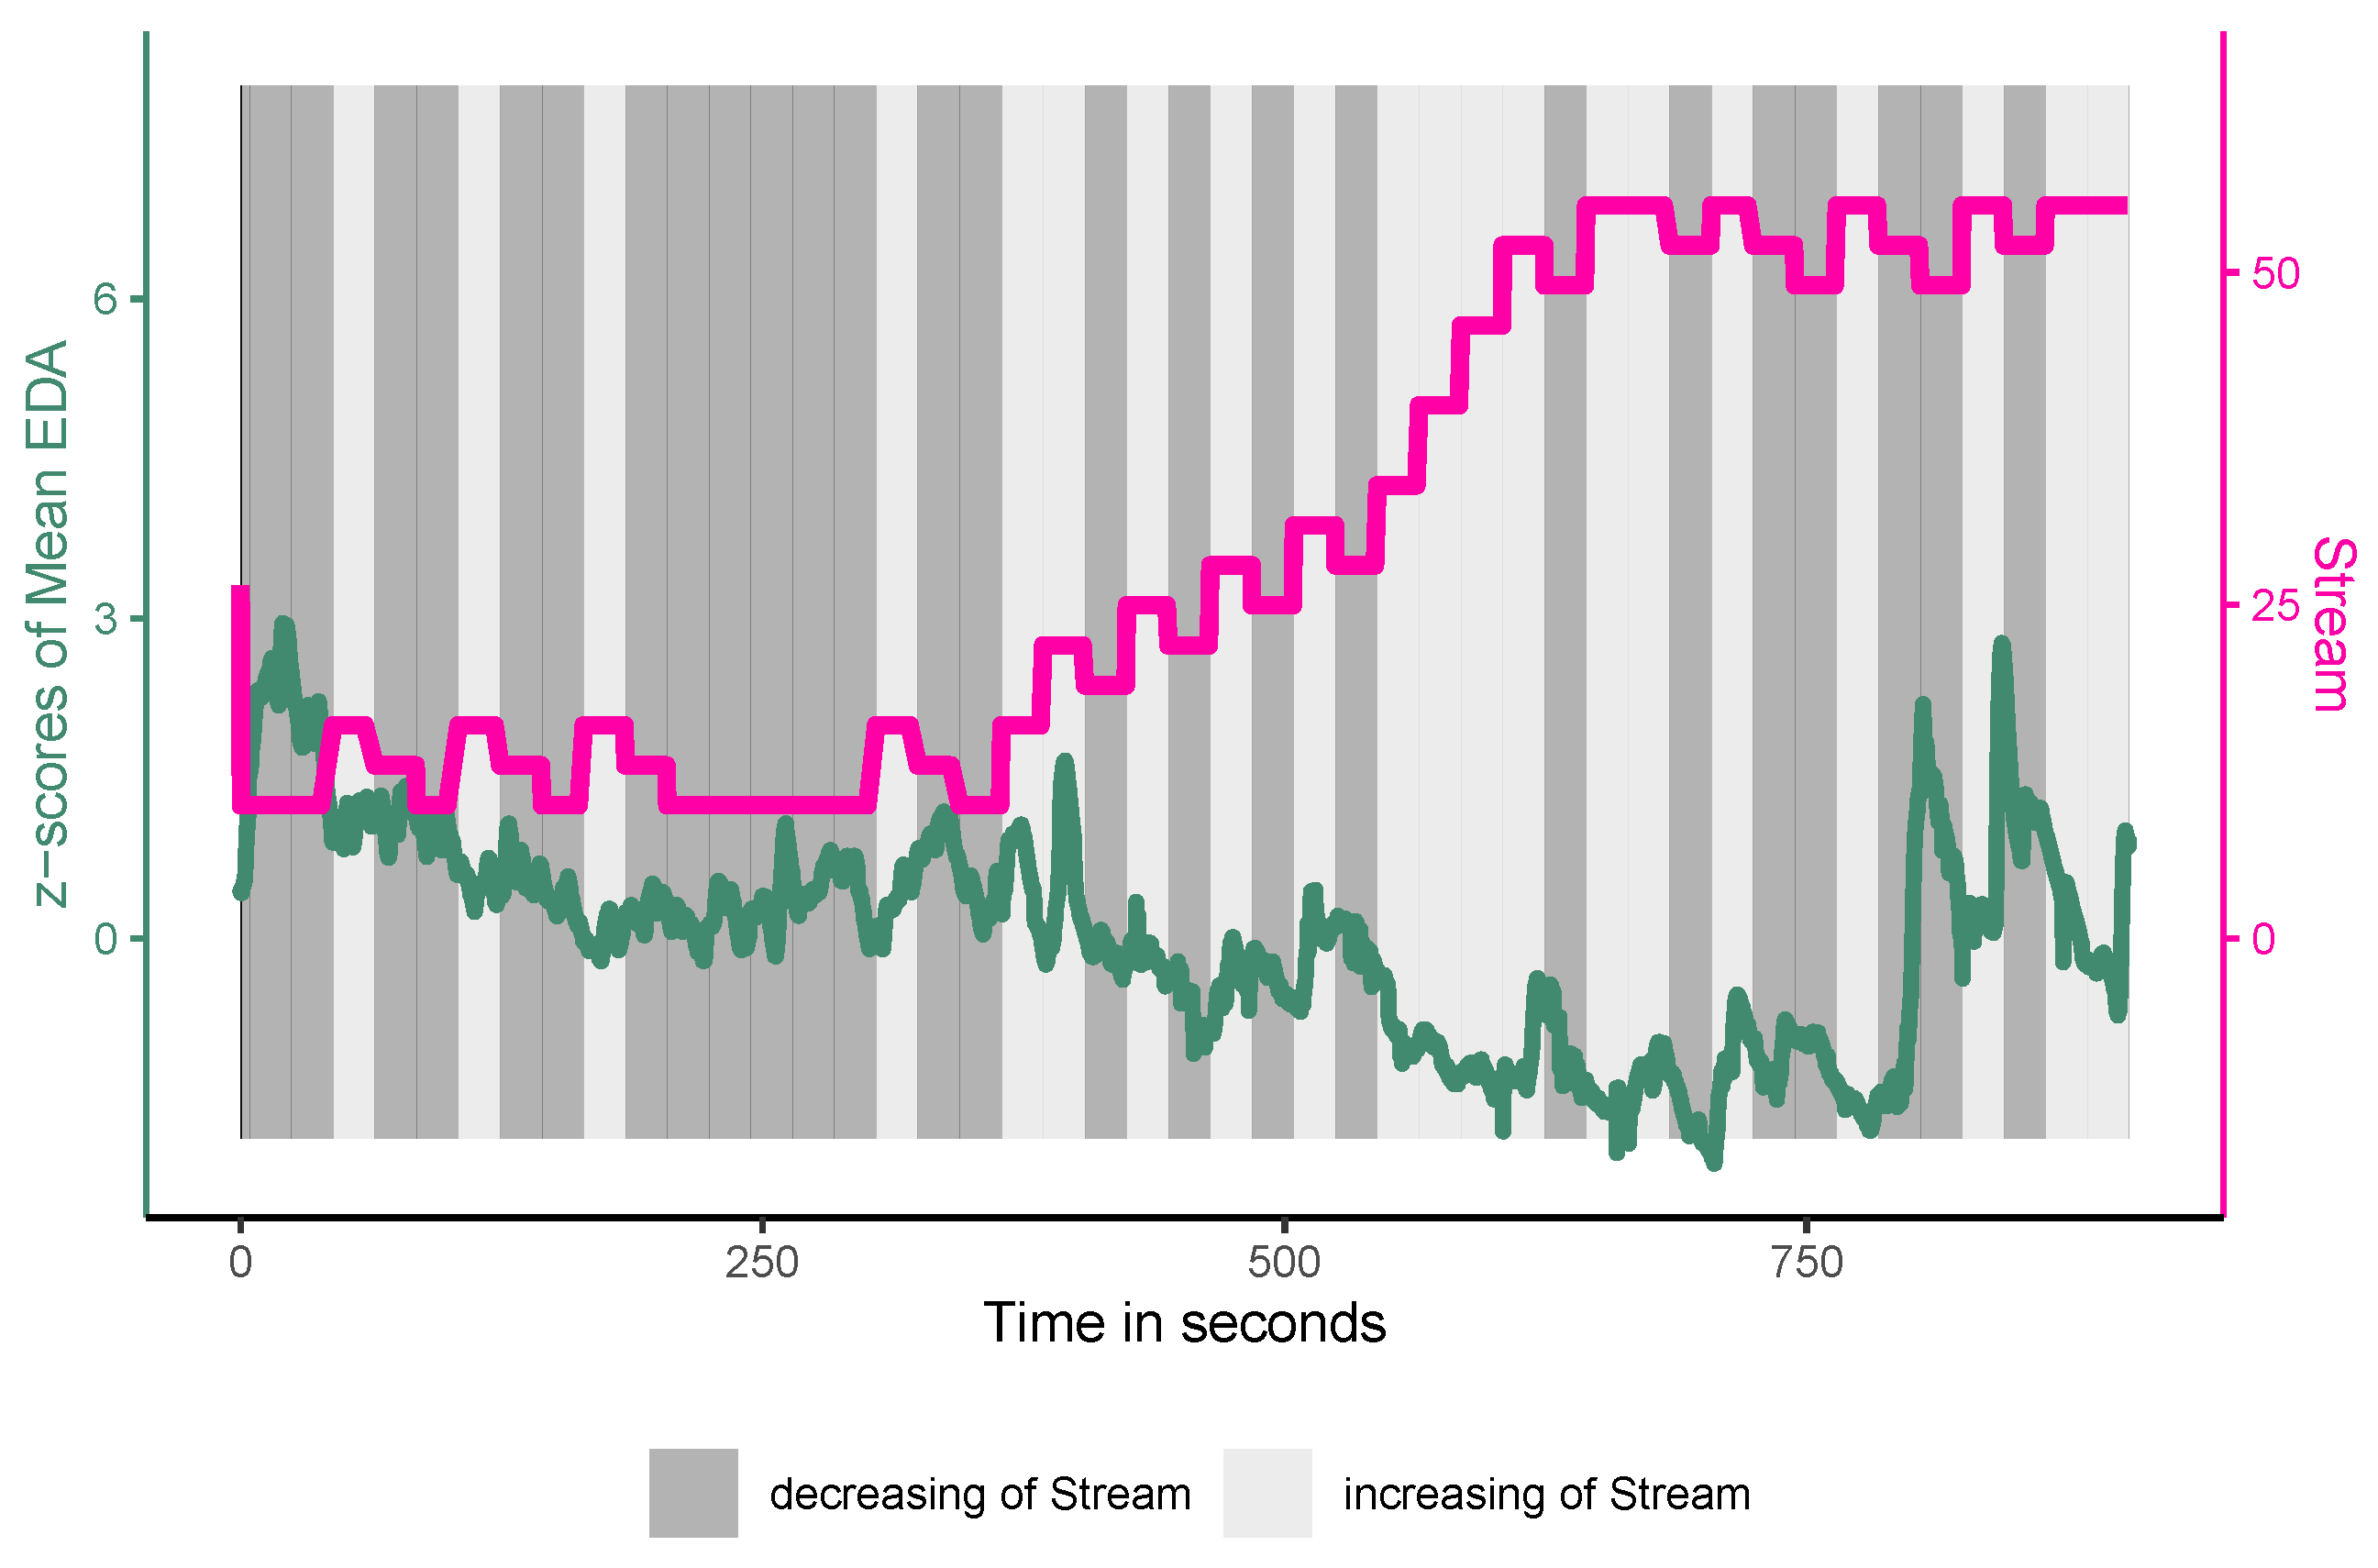
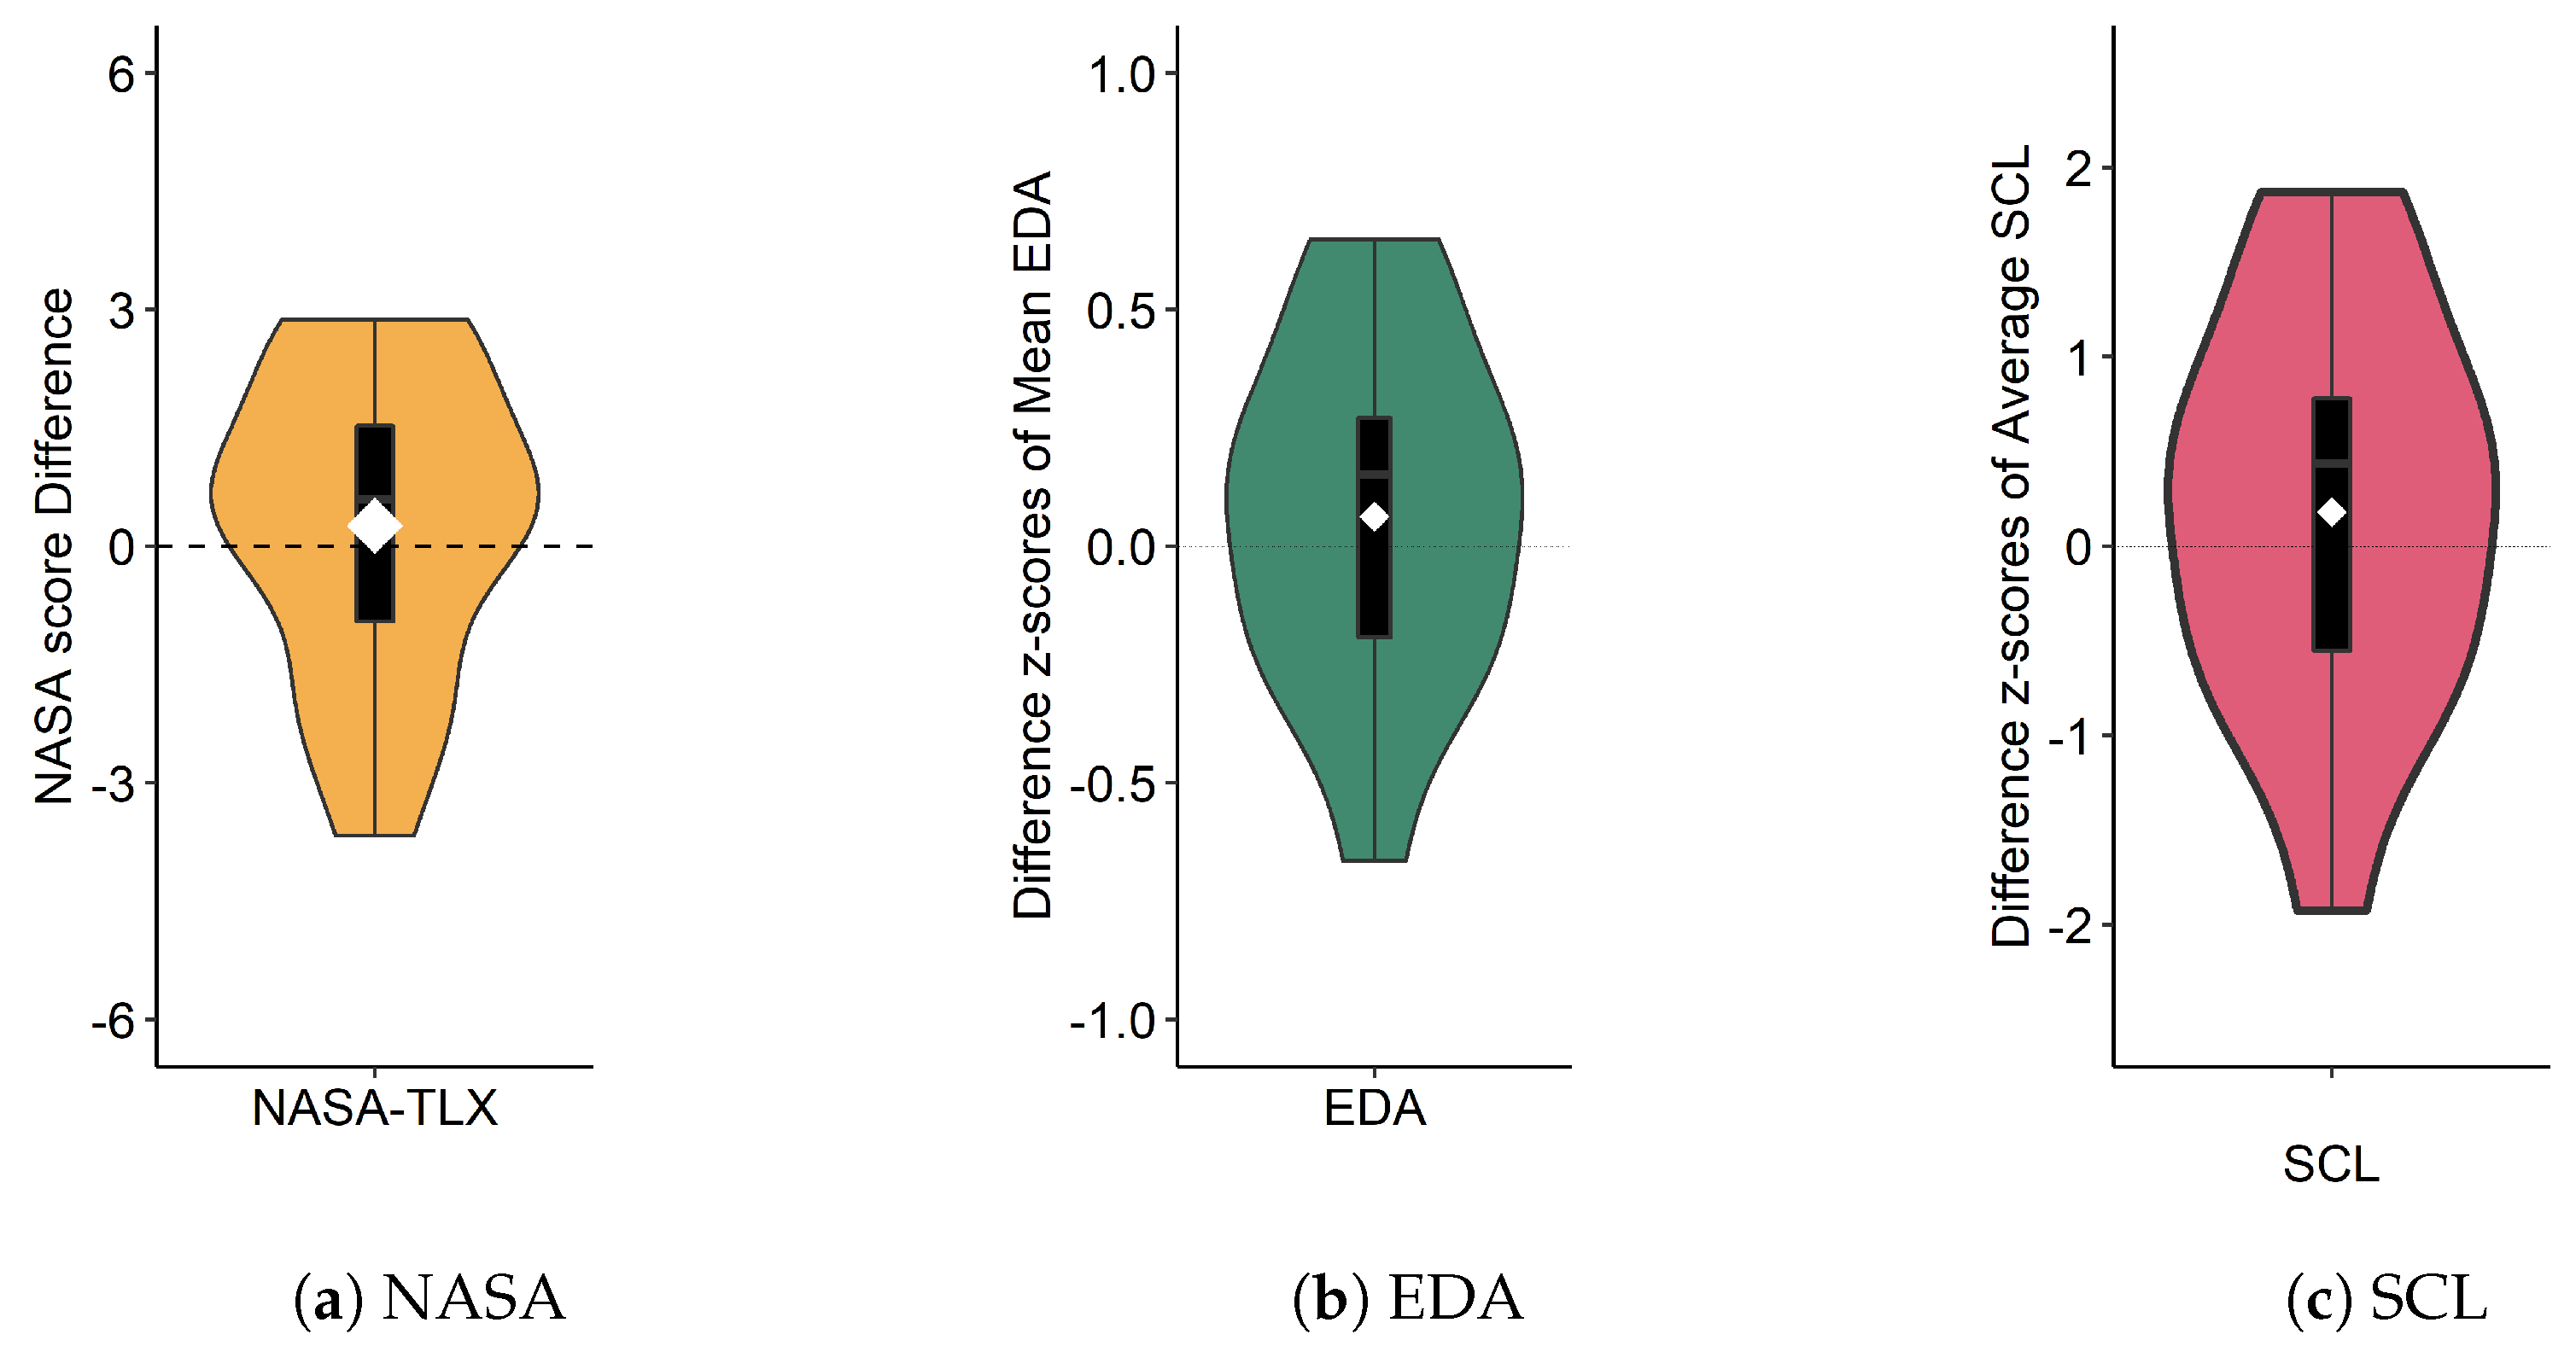
5.3.1. Electrodermal Activity Measures
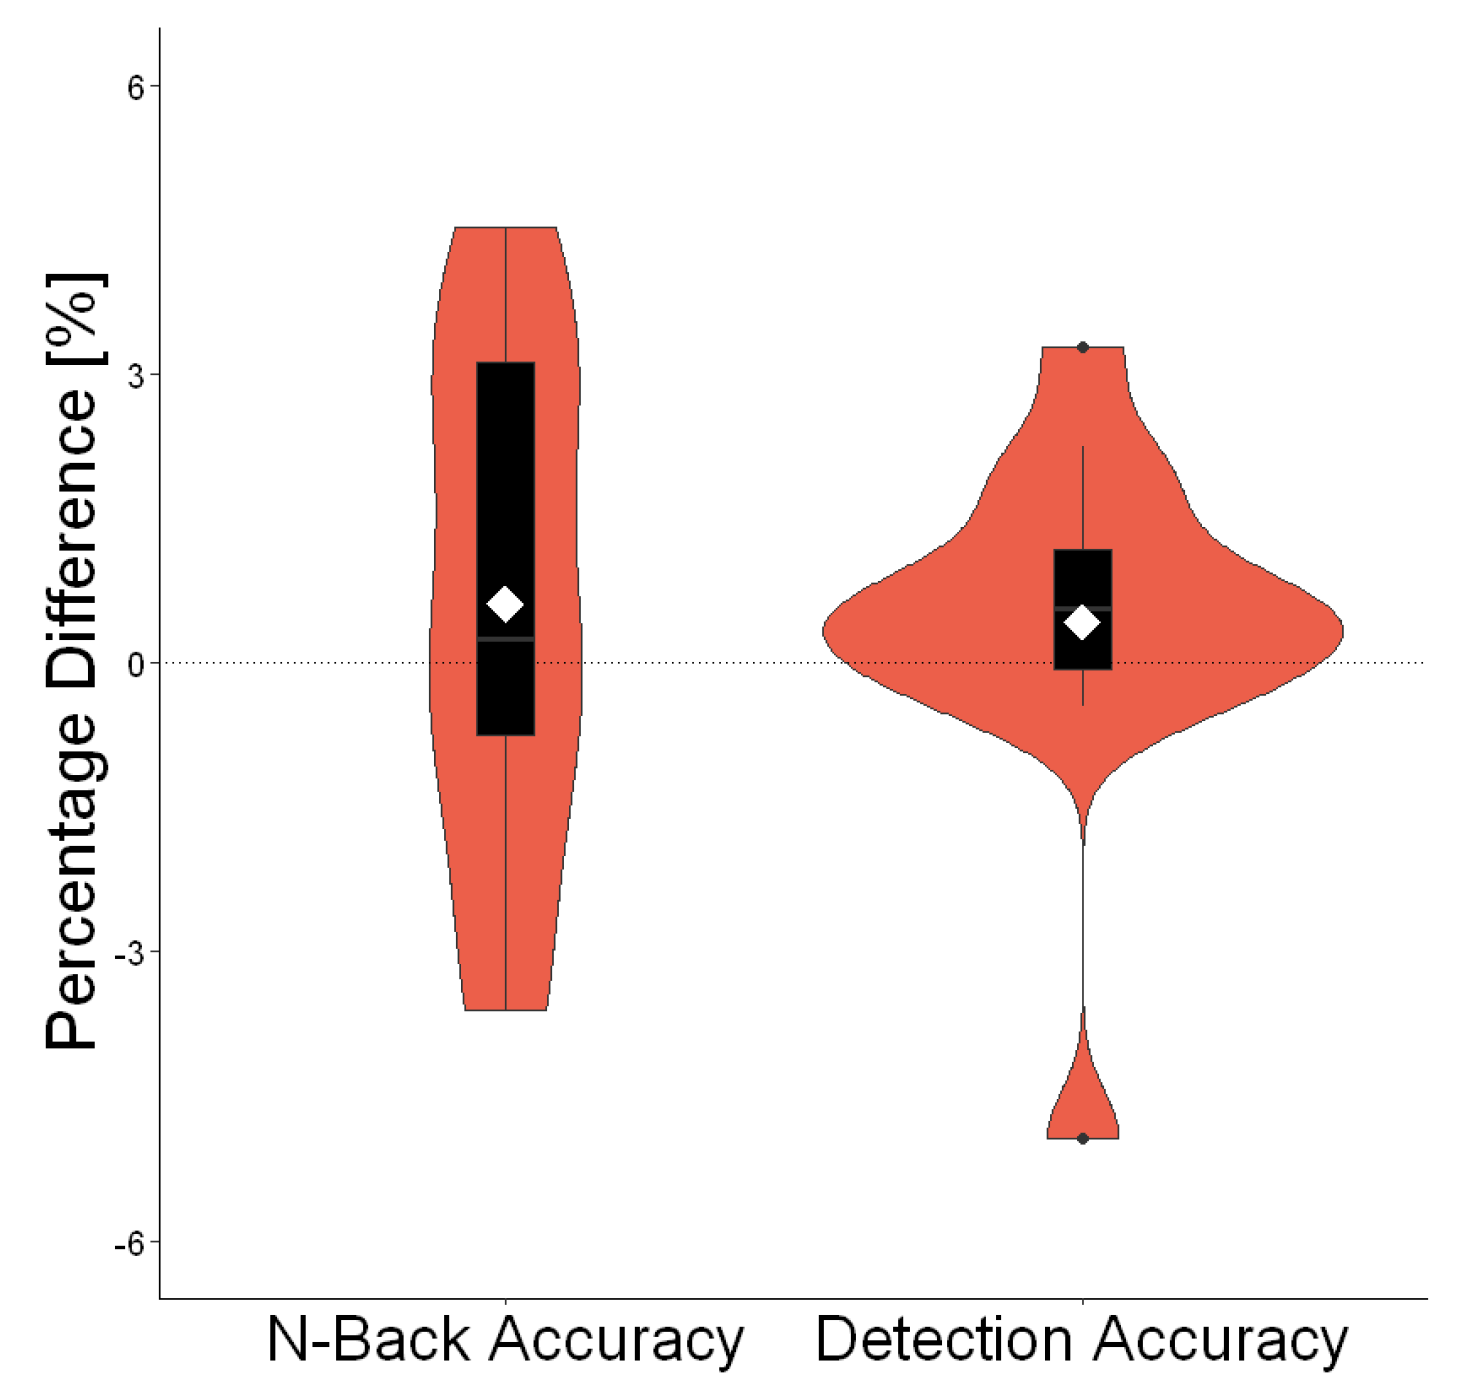
5.3.2. Workload and Performance

| Actual | Prediction | Diff | t-Test/Wilcoxon | Shapiro | |||||||
|---|---|---|---|---|---|---|---|---|---|---|---|
| M | SD | M | SD | M | SD | d | t/Z | p | W | p | |
| n-back Acc. [%] | 94.892 | 2.662 | 94.471 | 2.007 | 0.422 | 1.801 | 0.234 | 93.000 | 0.064 | 0.825 | 0.008 |
| Visual Det. task Acc. [%] | 95.478 | 3.837 | 94.696 | 2.766 | 0.781 | 1.706 | 0.458 | 1.774 | 0.098 | 0.944 | 0.440 |
| Raw NASA | 8.578 | 3.205 | 8.317 | 2.250 | 0.261 | 1.952 | 0.134 | 0.518 | 0.613 | 0.938 | 0.363 |
| EDA Mean (std) | 0.040 | 1.074 | −0.023 | 0.957 | 0.063 | 0.364 | 0.172 | 0.668 | 0.515 | 0.976 | 0.937 |
| SCL | 9.456 | 3.100 | 9.275 | 2.761 | 0.181 | 1.051 | −0.172 | 0.666 | 0.516 | 0.976 | 0.939 |
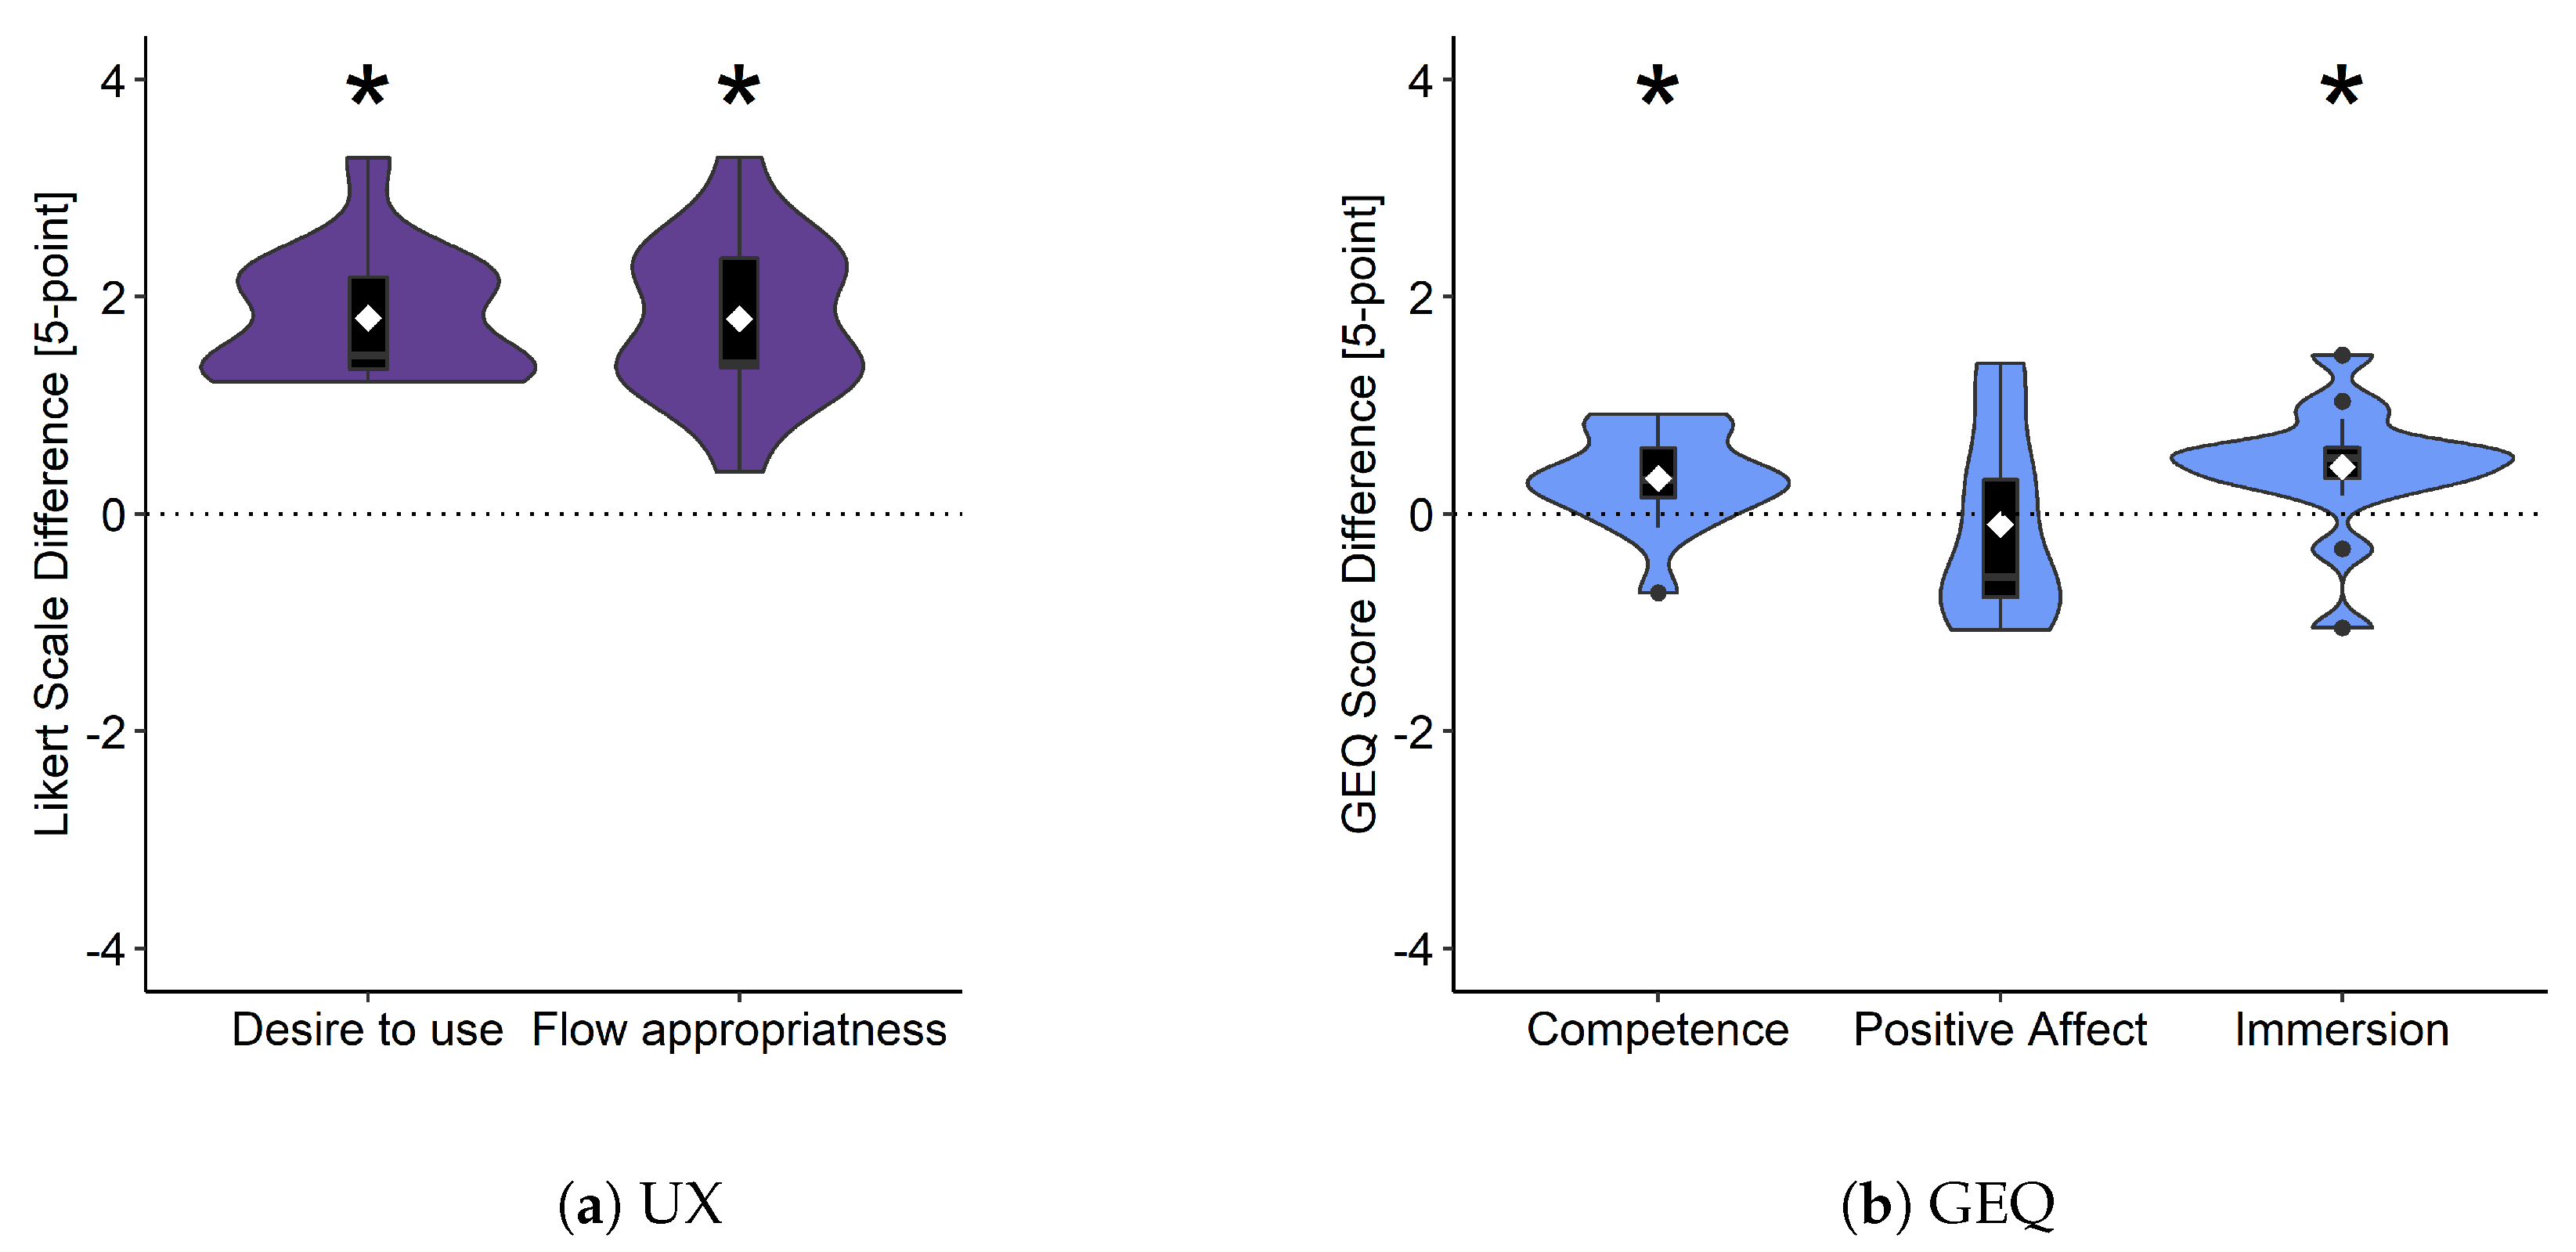
| GEQ—Competence | 2.767 | 0.623 | 2.441 | 0.374 | 0.326 | 0.436 | 0.746 | 2.890 | 0.012 | 0.933 | 0.298 |
| GEQ—Positive Affection | 2.300 | 0.978 | 2.396 | 0.262 | −0.096 | 0.866 | -0.111 | 52.000 | 0.679 | 0.864 | 0.027 |
| GEQ—Immersion | 1.500 | 0.707 | 1.067 | 0.334 | 0.433 | 0.574 | 0.755 | 2.924 | 0.011 | 0.903 | 0.105 |
| Stream Appropriate | 3.467 | 0.743 | 1.669 | 0.058 | 1.798 | 0.729 | 2.465 | 9.548 | <0.001 | 0.902 | 0.104 |
| Desire To Use | 3.533 | 0.640 | 1.728 | 0.101 | 1.805 | 0.591 | 3.053 | 120.000 | <0.001 | 0.827 | 0.008 |
5.3.3. Subjective Evaluation
6. Discussion
Limitations
7. Conclusions
Supplementary Materials
Author Contributions
Funding
Institutional Review Board Statement
Informed Consent Statement
Data Availability Statement
Conflicts of Interest
References
- Knierim, P.; Kosch, T.; Schmidt, A. The Nomadic Office: A Location Independent Workspace through Mixed Reality. IEEE Pervasive Comput. 2021, 20, 71–78. [Google Scholar] [CrossRef]
- Czarnek, G.; Strojny, P.; Strojny, A.; Richter, M. Assessing engagement during rescue operation simulated in virtual reality: A psychophysiological study. Int. J. Hum. Comput. Interact. 2020, 36, 464–476. [Google Scholar] [CrossRef]
- Radianti, J.; Majchrzak, T.A.; Fromm, J.; Wohlgenannt, I. A systematic review of immersive virtual reality applications for higher education: Design elements, lessons learned, and research agenda. Comput. Educ. 2020, 147, 103778. [Google Scholar] [CrossRef]
- Giordana, F.; Efremov, V.; Sourimant, G.; Rasheva, S.; Tatarchuk, N.; James, C. Virtual Production in ’Book of the Dead’: Technicolor’s Genesis Platform, Powered by Unity. In Proceedings of the ACM SIGGRAPH 2018 Real-Time Live! Vancouver, BC, Canada, 12–16 August 2018. [Google Scholar] [CrossRef]
- Latoschik, M.E.; Kern, F.; Stauffert, J.P.; Bartl, A.; Botsch, M.; Lugrin, J.L. Not Alone Here?! Scalability and User Experience of Embodied Ambient Crowds in Distributed Social Virtual Reality. IEEE Trans. Vis. Comput. Graph. 2019, 25, 2134–2144. [Google Scholar] [CrossRef] [PubMed]
- Ionescu, R.T.; Alexe, B.; Leordeanu, M.; Popescu, M.; Papadopoulos, D.P.; Ferrari, V. How Hard Can It Be? Estimating the Difficulty of Visual Search in an Image. In Proceedings of the 2016 IEEE Conference on Computer Vision and Pattern Recognition (CVPR), Las Vegas, NV, USA, 27–30 June 2016; pp. 2157–2166. [Google Scholar] [CrossRef] [Green Version]
- Mnookin, J.; Kellman, P.J.; Dror, I.; Erlikhman, G.; Garrigan, P.; Ghose, T.; Metler, E.; Charlton, D. Error Rates for Latent Fingerprinting as a Function of Visual Complexity and Cognitive Difficulty; National Institute of Justice, US Department of Justice: Washington, DC, USA, 2016.
- Dorneich, M.C.; Whitlow, S.D.; Ververs, P.M.; Rogers, W.H. Mitigating cognitive bottlenecks via an augmented cognition adaptive system. In Proceedings of the SMC’03 Conference Proceedings, 2003 IEEE International Conference on Systems, Man and Cybernetics. Conference Theme—System Security and Assurance (Cat. No.03CH37483), Washington, DC, USA, 8 October 2003; Volume 1, pp. 937–944. [Google Scholar] [CrossRef]
- Lackey, S.J.; Salcedo, J.N.; Szalma, J.L.; Hancock, P.A. The stress and workload of virtual reality training: The effects of presence, immersion and flow. Ergonomics 2016, 59, 1060–1072. [Google Scholar] [CrossRef]
- Luong, T.; Martin, N.; Raison, A.; Argelaguet, F.; Diverrez, J.M.; Lécuyer, A. Towards Real-Time Recognition of Users Mental Workload Using Integrated Physiological Sensors Into a VR HMD. In Proceedings of the 2020 IEEE International Symposium on Mixed and Augmented Reality (ISMAR), Porto de Galinhas, Brazil, 9–13 November 2020; pp. 425–437. [Google Scholar] [CrossRef]
- Bläsing, D.; Bornewasser, M. A Strain Based Model for Adaptive Regulation of Cognitive Assistance Systems—Theoretical Framework and Practical Limitations. In Proceedings of the Intelligent Human Systems Integration 2019, San Diego, CA, USA, 7–10 February 2019; pp. 10–16. [Google Scholar] [CrossRef]
- Fairclough, S.H.; Venables, L. Prediction of subjective states from psychophysiology: A multivariate approach. Biol. Psychol. 2006, 71, 100–110. [Google Scholar] [CrossRef]
- Splawn, J.M.; Miller, M.E. Prediction of perceived workload from task performance and heart rate measures. In Proceedings of the Human Factors and Ergonomics Society Annual Meeting, Torino, Italy, 1 October 2013; Volume 57, pp. 778–782. [Google Scholar] [CrossRef]
- Kosch, T.; Hassib, M.; Buschek, D.; Schmidt, A. Look into My Eyes: Using Pupil Dilation to Estimate Mental Workload for Task Complexity Adaptation. In Proceedings of the Extended Abstracts of the 2018 CHI Conference on Human Factors in Computing Systems, Montreal, QC, Canada, 21–26 April 2018; pp. 1–6. [Google Scholar] [CrossRef]
- Mishra, J.; Anguera, J.A.; Gazzaley, A. Video games for neuro-cognitive optimization. Neuron 2016, 90, 214–218. [Google Scholar] [CrossRef] [Green Version]
- Kukolja, D.; Popović, S.; Dropuljić, B.; Horvat, M.; Ćosić, K. Real-Time Emotional State Estimator for Adaptive Virtual Reality Stimulation. In Proceedings of the Foundations of Augmented Cognition: Neuroergonomics and Operational Neuroscience, San Diego, CA, USA, 19–24 July 2009; pp. 175–184. [Google Scholar] [CrossRef]
- Wright, R.A. Refining the prediction of effort: Brehm’s distinction between potential motivation and motivation intensity. Soc. Personal. Psychol. Compass 2008, 2, 682–701. [Google Scholar] [CrossRef]
- Richter, M.; Gendolla, G.H. The heart contracts to reward: Monetary incentives and preejection period. Psychophysiology 2009, 46, 451–457. [Google Scholar] [CrossRef]
- Richter, M.; Friedrich, A.; Gendolla, G.H. Task difficulty effects on cardiac activity. Psychophysiology 2008, 45, 869–875. [Google Scholar] [CrossRef]
- Fairclough, S.H. Fundamentals of physiological computing. Interact. Comput. 2009, 21, 133–145. [Google Scholar] [CrossRef]
- Dorneich, M.C.; Ververs, P.M.; Mathan, S.; Whitlow, S.; Hayes, C.C. Considering Etiquette in the Design of an Adaptive System. J. Cogn. Eng. Decis. Mak. 2012, 6, 243–265. [Google Scholar] [CrossRef] [Green Version]
- Kosch, T.; Karolus, J.; Ha, H.; Schmidt, A. Your Skin Resists: Exploring Electrodermal Activity as Workload Indicator during Manual Assembly. In Proceedings of the ACM SIGCHI Symposium on Engineering Interactive Computing Systems, Valencia, Spain, 18–21 June 2019. [Google Scholar] [CrossRef]
- Kamkuimo, K.S.A.; Girard, B.; Menelas, B.A.J. Dynamic Difficulty Adjustment Through Real-Time Physiological Feedback for a More Adapted Virtual Reality Exposure Therapy. In Proceedings of the Games and Learning Alliance, Laval, France, 9–10 December 2020; pp. 102–111. [Google Scholar] [CrossRef]
- Ewing, K.C.; Fairclough, S.H.; Gilleade, K. Evaluation of an adaptive game that uses EEG measures validated during the design process as inputs to a biocybernetic loop. Front. Hum. Neurosci. 2016, 10, 223. [Google Scholar] [CrossRef] [PubMed] [Green Version]
- Wright, R.A.; Kirby, L.D. Effort determination of cardiovascular response: An integrative analysis with applications in social psychology. Adv. Exp. Soc. Psychol. 2001, 33, 255–307. [Google Scholar] [CrossRef]
- Pope, A.T.; Bogart, E.H.; Bartolome, D.S. Biocybernetic system evaluates indices of operator engagement in automated task. Biol. Psychol. 1995, 40, 187–195. [Google Scholar] [CrossRef]
- Muñoz, J.E.; Quintero, L.; Stephens, C.L.; Pope, A.T. A psychophysiological model of firearms training in police officers: A virtual reality experiment for biocybernetic adaptation. Front. Psychol. 2020, 11, 683. [Google Scholar] [CrossRef]
- Chiossi, F.; Welsch, R.; Villa, S.; Chuang, L.L.; Mayer, S. Designing a Physiological Loop for the Adaptation of Virtual Human Characters in a Social VR Scenario. In Proceedings of the 2022 IEEE Conference on Virtual Reality and 3D User Interfaces Abstracts and Workshops, Christchurch, New Zealand, 12–16 March 2022. [Google Scholar] [CrossRef]
- Williamson, J.; Li, J.; Vinayagamoorthy, V.; Shamma, D.A.; Cesar, P. Proxemics and social interactions in an instrumented virtual reality workshop. In Proceedings of the 2021 CHI Conference on Human Factors in Computing Systems, Yokohama, Japan, 8–13 May 2021; pp. 1–13. [Google Scholar] [CrossRef]
- Moustafa, F.; Steed, A. A Longitudinal Study of Small Group Interaction in Social Virtual Reality. In Proceedings of the 24th ACM Symposium on Virtual Reality Software and Technology, Tokyo, Japan, 28 November–1 December 2018. [Google Scholar] [CrossRef] [Green Version]
- Hall, E.T. The Hidden Dimension; Doubleday: Garden City, NY, USA, 1966; Volume 609. [Google Scholar]
- Desor, J.A. Toward a psychological theory of crowding. J. Personal. Soc. Psychol. 1972, 21, 79. [Google Scholar] [CrossRef]
- Welsch, R.; von Castell, C.; Hecht, H. The anisotropy of personal space. PLoS ONE 2019, 14, e0217587. [Google Scholar] [CrossRef]
- Worchel, S.; Teddie, C. The experience of crowding: A two-factor theory. J. Personal. Soc. Psychol. 1976, 34, 30. [Google Scholar] [CrossRef]
- Kennedy, D.P.; Gläscher, J.; Tyszka, J.M.; Adolphs, R. Personal space regulation by the human amygdala. Nat. Neurosci. 2009, 12, 1226–1227. [Google Scholar] [CrossRef]
- Llobera, J.; Spanlang, B.; Ruffini, G.; Slater, M. Proxemics with Multiple Dynamic Characters in an Immersive Virtual Environment. ACM Trans. Appl. Percept. 2010, 8. [Google Scholar] [CrossRef] [Green Version]
- Li, J.; Vinayagamoorthy, V.; Schwartz, R.; IJsselsteijn, W.; Shamma, D.A.; Cesar, P. Social VR: A New Medium for Remote Communication and Collaboration. In Proceedings of the Extended Abstracts of the 2020 CHI Conference on Human Factors in Computing Systems, Honolulu, HI, USA, 25–30 April 2020; pp. 1–8. [Google Scholar] [CrossRef]
- Li, J.; Vinayagamoorthy, V.; Williamson, J.; Shamma, D.A.; Cesar, P. Social VR: A New Medium for Remote Communication and Collaboration. In Proceedings of the Extended Abstracts of the 2021 CHI Conference on Human Factors in Computing Systems, Yokohama, Japan, 8–13 May 2021. [Google Scholar] [CrossRef]
- Jonas, M.; Said, S.; Yu, D.; Aiello, C.; Furlo, N.; Zytko, D. Towards a Taxonomy of Social VR Application Design. In Proceedings of the Extended Abstracts of the Annual Symposium on Computer-Human Interaction in Play Companion Extended Abstracts, Barcelona, Spain, 22–25 October 2019; pp. 437–444. [Google Scholar] [CrossRef]
- Freeman, G.; Maloney, D. Body, Avatar, and Me: The Presentation and Perception of Self in Social Virtual Reality. Proc. ACM Hum.-Comput. Interact. 2021, 4, 1–27. [Google Scholar] [CrossRef]
- Heidicker, P.; Langbehn, E.; Steinicke, F. Influence of avatar appearance on presence in social VR. In Proceedings of the 2017 IEEE Symposium on 3D User Interfaces (3DUI), Los Angeles, CA, USA, 18–19 March 2017; pp. 233–234. [Google Scholar] [CrossRef]
- Sykownik, P.; Masuch, M. The Experience of Social Touch in Multi-User Virtual Reality. In Proceedings of the 26th ACM Symposium on Virtual Reality Software and Technology, Virtual, 1–4 November 2020. [Google Scholar] [CrossRef]
- Gunkel, S.; Stokking, H.; Prins, M.; Niamut, O.; Siahaan, E.; Cesar, P. Experiencing Virtual Reality Together: Social VR Use Case Study. In Proceedings of the 2018 ACM International Conference on Interactive Experiences for TV and Online Video, Seoul, Korea, 26–28 June 2018; pp. 233–238. [Google Scholar] [CrossRef] [Green Version]
- Hecht, H.; Welsch, R.; Viehoff, J.; Longo, M.R. The shape of personal space. Acta Psychol. 2019, 193, 113–122. [Google Scholar] [CrossRef] [PubMed]
- McVeigh-Schultz, J.; Márquez Segura, E.; Merrill, N.; Isbister, K. What’s It Mean to “Be Socia” in VR? Mapping the Social VR Design Ecology. In Proceedings of the 2018 ACM Conference Companion Publication on Designing Interactive Systems, Hong Kong, China, 9–13 June 2018; pp. 289–294. [Google Scholar] [CrossRef]
- Koilias, A.; Nelson, M.G.; Anagnostopoulos, C.N.; Mousas, C. Immersive walking in a virtual crowd: The effects of the density, speed, and direction of a virtual crowd on human movement behavior. Comput. Animat. Virtual Worlds 2020, 31, e1928. [Google Scholar] [CrossRef]
- Dickinson, P.; Gerling, K.; Hicks, K.; Murray, J.; Shearer, J.; Greenwood, J. Virtual reality crowd simulation: Effects of agent density on user experience and behaviour. Virtual Real. 2019, 23, 19–32. [Google Scholar] [CrossRef] [Green Version]
- Olivia, A.; Mack, M.L.; Shrestha, M.; Peeper, A. Identifying the Perceptual Dimensions of Visual Complexity of Scenes. Available online: https://escholarship.org/uc/item/17s4h6w8 (accessed on 31 March 2022).
- De Manzano, Ö.; Theorell, T.; Harmat, L.; Ullén, F. The psychophysiology of flow during piano playing. Emotion 2010, 10, 301. [Google Scholar] [CrossRef] [Green Version]
- Mandryk, R.L.; Inkpen, K.M. Physiological indicators for the evaluation of co-located collaborative play. In Proceedings of the 2004 ACM Conference on Computer Supported Cooperative Work, Chicago, IL, USA, 6–10 November 2004; pp. 102–111. [Google Scholar]
- Martens, M.A.; Antley, A.; Freeman, D.; Slater, M.; Harrison, P.J.; Tunbridge, E.M. It feels real: Physiological responses to a stressful virtual reality environment and its impact on working memory. J. Psychopharmacol. 2019, 33, 1264–1273. [Google Scholar] [CrossRef] [Green Version]
- Nourbakhsh, N.; Wang, Y.; Chen, F.; Calvo, R.A. Using galvanic skin response for cognitive load measurement in arithmetic and reading tasks. In Proceedings of the 24th Australian Computer-Human Interaction Conference, Melbourne, Australia, 26–30 November 2012; pp. 420–423. [Google Scholar]
- Ghaderyan, P.; Abbasi, A. An efficient automatic workload estimation method based on electrodermal activity using pattern classifier combinations. Int. J. Psychophysiol. 2016, 110, 91–101. [Google Scholar] [CrossRef]
- VaezMousavi, S.M.; Barry, R.J.; Clarke, A.R. Individual differences in task-related activation and performance. Physiol. Behav. 2009, 98, 326–330. [Google Scholar] [CrossRef]
- Matthews, G.; Desmond, P.A. Personality and multiple dimensions of task-induced fatigue: A study of simulated driving. Personal. Individ. Differ. 1998, 25, 443–458. [Google Scholar] [CrossRef]
- Hockey, G.R.J. A Motivational Control Theory of Cognitive Fatigue; American Psychological Association: Washington, DC, USA, 2011. [Google Scholar]
- Thayer, R.E. The Biopsychology of Mood and Arousal; Oxford University Press: Oxford, UK, 1990. [Google Scholar]
- Boucsein, W. Electrodermal Activity; Springer Science & Business Media: Berlin, Germany, 2012. [Google Scholar] [CrossRef]
- Son, J.; Park, M. Estimating Cognitive Load Complexity Using Performance and Physiological Data in a Driving Simulator. Available online: https://www.semanticscholar.org/paper/Estimating-Cognitive-Load-Complexity-Using-and-Data-Son-Daegu/347eb082dc4969dc65a813db8ad72f6b99061609 (accessed on 31 March 2022).
- Mehler, B.; Reimer, B.; Coughlin, J.F.; Dusek, J.A. Impact of incremental increases in cognitive workload on physiological arousal and performance in young adult drivers. Transp. Res. Rec. 2009, 2138, 6–12. [Google Scholar] [CrossRef]
- Parsons, T.D.; Courtney, C.G. Interactions between threat and executive control in a virtual reality stroop task. IEEE Trans. Affect. Comput. 2016, 9, 66–75. [Google Scholar] [CrossRef]
- Charles, R.L.; Nixon, J. Measuring mental workload using physiological measures: A systematic review. Appl. Ergon. 2019, 74, 221–232. [Google Scholar] [CrossRef]
- Wiener, N. Cybernetics or Control and Communication in the Animal and the Machine; Technology Press: Cambridge, MA, USA, 1948. [Google Scholar]
- Heylighen, F.; Joslyn, C. Cybernetics and second-order cybernetics. Encycl. Phys. Sci. Technol. 2001, 4, 155–170. [Google Scholar]
- Scerbo, M.W.; Freeman, F.G.; Mikulka, P.J. A brain-based system for adaptive automation. Theor. Issues Ergon. Sci. 2003, 4, 200–219. [Google Scholar] [CrossRef]
- Kort, B.; Reilly, R. Analytical Models of Emotions, Learning and Relationships: Towards an Affect-Sensitive Cognitive Machine. Available online: https://web.media.mit.edu/~reilly/its2002.pdf (accessed on 31 March 2022).
- Rani, P.; Sarkar, N. Operator engagement detection and robot behavior adaptation in human-robot interaction. In Proceedings of the 2005 IEEE International Conference on Robotics and Automation, Barcelona, Spain, 18–22 April 2005; pp. 2051–2056. [Google Scholar]
- Fairclough, S.H.; Zander, T.O. Current Research in Neuroadaptive Technology; Elsevier Science & Technology: San Diego, CA, USA, 2021. [Google Scholar]
- Stach, T.; Graham, T.C.N.; Yim, J.; Rhodes, R.E. Heart Rate Control of Exercise Video Games. In Proceedings of the Graphics Interface 2009, Kelowna, BC, Canada, 25–27 May 2009; pp. 125–132. [Google Scholar]
- Wu, D.; Courtney, C.G.; Lance, B.J.; Narayanan, S.S.; Dawson, M.E.; Oie, K.S.; Parsons, T.D. Optimal arousal identification and classification for affective computing using physiological signals: Virtual reality stroop task. IEEE Trans. Affect. Comput. 2010, 1, 109–118. [Google Scholar] [CrossRef]
- Dey, A.; Chatburn, A.; Billinghurst, M. Exploration of an EEG-based cognitively adaptive training system in virtual reality. In Proceedings of the 2019 IEEE Conference on Virtual Reality and 3d User Interfaces (VR), Osaka, Japan, 23–27 March 2019; pp. 220–226. [Google Scholar] [CrossRef]
- Makransky, G.; Terkildsen, T.S.; Mayer, R.E. Adding immersive virtual reality to a science lab simulation causes more presence but less learning. Learn. Instr. 2019, 60, 225–236. [Google Scholar] [CrossRef]
- Harper, S.; Michailidou, E.; Stevens, R. Toward a definition of visual complexity as an implicit measure of cognitive load. Acm Trans. Appl. Percept. (TAP) 2009, 6, 1–18. [Google Scholar] [CrossRef]
- Ragan, E.D.; Bowman, D.A.; Kopper, R.; Stinson, C.; Scerbo, S.; McMahan, R.P. Effects of field of view and visual complexity on virtual reality training effectiveness for a visual scanning task. IEEE Trans. Vis. Comput. Graph. 2015, 21, 794–807. [Google Scholar] [CrossRef]
- Kelaiah, I.; Kavakli, M.; Cheng, K. Associations between simulator sickness and visual complexity of a virtual scene. Front. Psychol. Behav. Sci. 2014, 3, 27–35. [Google Scholar]
- George, C.; Janssen, P.; Heuss, D.; Alt, F. Should I Interrupt or Not? Understanding Interruptions in Head-Mounted Display Settings. In Proceedings of the 2019 on Designing Interactive Systems Conference, San Diego, CA, USA, 23–28 June 2019; pp. 497–510. [Google Scholar]
- Staib, M.; Castegnetti, G.; Bach, D.R. Optimising a model-based approach to inferring fear learning from skin conductance responses. J. Neurosci. Methods 2015, 255, 131–138. [Google Scholar] [CrossRef] [PubMed] [Green Version]
- Kirchner, W.K. Age differences in short-term retention of rapidly changing information. J. Exp. Psychol. 1958, 55, 352. [Google Scholar] [CrossRef] [PubMed]
- Rzayev, R.; Mayer, S.; Krauter, C.; Henze, N. Notification in VR: The Effect of Notification Placement, Task and Environment. In Proceedings of the Annual Symposium on Computer-Human Interaction in Play, Barcelona, Spain, 22–25 October 2019; pp. 199–211. [Google Scholar] [CrossRef]
- Selzer, M.N.; Gazcon, N.F.; Larrea, M.L. Effects of virtual presence and learning outcome using low-end virtual reality systems. Displays 2019, 59, 9–15. [Google Scholar] [CrossRef]
- McMillan, K.M.; Laird, A.R.; Witt, S.T.; Meyerand, M.E. Self-paced working memory: Validation of verbal variations of the n-back paradigm. Brain Res. 2007, 1139, 133–142. [Google Scholar] [CrossRef] [Green Version]
- Babaei, E.; Tag, B.; Dingler, T.; Velloso, E. A Critique of Electrodermal Activity Practices at CHI. In Proceedings of the 2021 CHI Conference on Human Factors in Computing Systems, Yokohama, Japan, 8–13 May 2021. [Google Scholar] [CrossRef]
- Hart, S.G. Nasa-Task Load Index (NASA-TLX); 20 Years Later. Proc. Hum. Factors Ergon. Soc. Annu. Meet. 2006, 50, 904–908. [Google Scholar] [CrossRef] [Green Version]
- Hart, S.G.; Staveland, L.E. Development of NASA-TLX (Task Load Index): Results of empirical and theoretical research. In Advances in Psychology; Elsevier: Amsterdam, The Netherlands, 1988; Volume 52, pp. 139–183. [Google Scholar]
- IJsselsteijn, W.A.; de Kort, Y.A.; Poels, K. The Game Experience Questionnaire; Eindhoven University of Technology: Eindhoven, The Netherlands, 2013; Volume 46. [Google Scholar]
- Law, E.L.C.; Brühlmann, F.; Mekler, E.D. Systematic review and validation of the game experience questionnaire (geq)-implications for citation and reporting practice. In Proceedings of the 2018 Annual Symposium on Computer-Human Interaction in Play, Melbourne, Australia, 28–31 October 2018; pp. 257–270. [Google Scholar]
- Keshavarz, B.; Hecht, H. Validating an efficient method to quantify motion sickness. Hum. Factors 2011, 53, 415–426. [Google Scholar] [CrossRef] [Green Version]
- Chiossi, F.; Welsch, R.; Villa, S.; Chuang, L.; Mayer, S. Virtual Reality Adaptation using Electrodermal Activity to Support User Experience. DaRUS Open Data Platform. Version 1.; 2022; pp. 2693–2700. Available online: https://darus.uni-stuttgart.de/dataset.xhtml?persistentId=doi:10.18419/darus-2820 (accessed on 31 March 2022).
- R Core Team. R: A Language and Environment for Statistical Computing; R Foundation for Statistical Computing: Vienna, Austria, 2021. [Google Scholar]
- Wickham, H.; Averick, M.; Bryan, J.; Chang, W.; McGowan, L.; François, R.; Grolemund, G.; Hayes, A.; Henry, L.; Hester, J. Welcome to the tidyverse. J. Open Source Soft. 2019, 4, 1686. [Google Scholar] [CrossRef]
- Dahl, D.B.; Scott, D.; Roosen, C.; Magnusson, A.; Swinton, J. xtable: Export Tables to LaTeX or HTML. R Package Version 1.8-4. 2019. Available online: https://rdrr.io/cran/xtable/ (accessed on 31 March 2022).
- Kuznetsova, A.; Bruun Brockhoff, P.; Haubo Bojesen Christensen, R. lmerTest: Tests in Linear Mixed Effects Models. R Package Version 3.1-3. 2020. Available online: https://cran.r-project.org/web/packages/lmerTest/index.html (accessed on 31 March 2022).
- Makowski, D.; Lüdecke, D.; Ben-Shachar, M.S.; Patil, I. Report: Automated Reporting of Results and Statistical Models. R Package Version 0.4.0. 2021. Available online: https://easystats.github.io/report/ (accessed on 31 March 2022).
- Benedek, M.; Kaernbach, C. Decomposition of skin conductance data by means of nonnegative deconvolution. Psychophysiology 2010, 47, 647–658. [Google Scholar] [CrossRef] [Green Version]
- Cacioppo, J.T.; Tassinary, L.G. Principles of Psychophysiology: Physical, Social, and Inferential Elements; Cambridge University Press: Cambridge, UK, 1990. [Google Scholar]
- Pecchinenda, A. The affective significance of skin conductance activity during a difficult problem-solving task. Cogn. Emot. 1996, 10, 481–504. [Google Scholar] [CrossRef]
- Peifer, C.; Schulz, A.; Schächinger, H.; Baumann, N.; Antoni, C.H. The relation of flow-experience and physiological arousal under stress—can u shape it? J. Exp. Soc. Psychol. 2014, 53, 62–69. [Google Scholar] [CrossRef]
- De Fockert, J.W. Beyond perceptual load and dilution: A review of the role of working memory in selective attention. Front. Psychol. 2013, 4, 287. [Google Scholar] [PubMed] [Green Version]
- Milgram, P.; Takemura, H.; Utsumi, A.; Kishino, F. Augmented reality: A class of displays on the reality-virtuality continuum. In Proceedings of the Telemanipulator and Telepresence Technologies. International Society for Optics and Photonics, Boston, MA, USA, 31 October–4 November 1994; Volume 2351, pp. 282–292. [Google Scholar] [CrossRef]
- Ghaffari, R.; Yang, D.S.; Kim, J.; Mansour, A.; Wright, J.A., Jr.; Model, J.B.; Wright, D.E.; Rogers, J.A.; Ray, T.R. State of Sweat: Emerging Wearable Systems for Real-Time, Noninvasive Sweat Sensing and Analytics. ACS Sens. 2021, 6, 2787–2801. [Google Scholar] [CrossRef] [PubMed]
- Lee, Y.; Yoon, S.; Lee, C.; Lee, M. Wearable EDA sensor gloves using conducting fabric and embedded system. In Proceedings of the World Congress on Medical Physics and Biomedical Engineering 2006, New York, NY, USA, 30 August–3 September 2006; pp. 883–888. [Google Scholar] [CrossRef]
- Laufer, L.; Németh, B. Predicting user action from skin conductance. In Proceedings of the 13th International Conference on Intelligent User Interfaces, Lisboa, Portugal, 14–17 February 2012; pp. 357–360. [Google Scholar] [CrossRef]
- Gilroy, S.; Porteous, J.; Charles, F.; Cavazza, M. Exploring passive user interaction for adaptive narratives. In Proceedings of the 2012 ACM International Conference on Intelligent User Interfaces, Lisboa, Portugal, 14–17 February 2012; pp. 119–128. [Google Scholar]
- Greco, A.; Valenza, G.; Lanata, A.; Scilingo, E.P.; Citi, L. cvxEDA: A convex optimization approach to electrodermal activity processing. IEEE Trans. Biomed. Eng. 2015, 63, 797–804. [Google Scholar] [CrossRef] [PubMed] [Green Version]
- Talsma, D.; Doty, T.J.; Woldorff, M.G. Selective attention and audiovisual integration: Is attending to both modalities a prerequisite for early integration? Cereb. Cortex 2007, 17, 679–690. [Google Scholar] [CrossRef] [Green Version]
- Dinh, H.Q.; Walker, N.; Hodges, L.F.; Song, C.; Kobayashi, A. Evaluating the importance of multi-sensory input on memory and the sense of presence in virtual environments. In Proceedings of the IEEE Virtual Reality, Houston, TX, USA, 13–17 March 1999; pp. 222–228. [Google Scholar] [CrossRef]
- Braithwaite, J.J.; Watson, D.G.; Jones, R.; Rowe, M. A guide for analysing electrodermal activity (EDA) & skin conductance responses (SCRs) for psychological experiments. Psychophysiology 2013, 49, 1017–1034. [Google Scholar]
- Healey, J.; Seger, J.; Picard, R. Quantifying driver stress: Developing a system for collecting and processing bio-metric signals in natural situations. Biomed. Sci. Instrum. 1999, 35, 193–198. [Google Scholar]
- Barry, R.J.; Rushby, J.A.; Wallace, M.J.; Clarke, A.R.; Johnstone, S.J.; Zlojutro, I. Caffeine effects on resting-state arousal. Clin. Neurophysiol. 2005, 116, 2693–2700. [Google Scholar] [CrossRef]


| Stream 7 | Stream 22 | Stream 37 | Stream 52 | Stream 67 | LMM | ||||||||
|---|---|---|---|---|---|---|---|---|---|---|---|---|---|
| M | SD | M | SD | M | SD | M | SD | M | SD | b | t | p | |
| n-back Acc. [%]. | 97.423 | 1.607 | 95.381 | 2.660 | 94.401 | 2.430 | 92.133 | 3.182 | 91.055 | 4.162 | −0.107 | −9.396 | <0.001 |
| Visual Det. Acc. [%] | 97.208 | 3.073 | 95.579 | 4.647 | 94.834 | 2.670 | 93.067 | 3.116 | 90.949 | 2.613 | −0.100 | −7.083 | <0.001 |
| Raw NASA TLX | 5.267 | 2.520 | 7.644 | 2.268 | 9.500 | 3.616 | 9.133 | 3.282 | 11.833 | 3.262 | 0.097 | 8.101 | <0.001 |
| EDA Mean (std) | −0.091 | 1.031 | −0.083 | 1.001 | −0.034 | 0.896 | 0.003 | 1.083 | 0.166 | 1.056 | 0.004 | 2.536 | 0.014 |
| SCL | 9.078 | 2.974 | 9.102 | 2.888 | 9.242 | 2.585 | 9.348 | 3.127 | 9.819 | 3.047 | 0.012 | 2.535 | 0.014 |
| GEQ—Competence | 2.667 | 0.939 | 2.600 | 1.039 | 2.200 | 0.862 | 2.600 | 0.687 | 1.967 | 0.834 | −0.009 | −2.149 | 0.036 |
| GEQ—Pos. Affec. | 2.400 | 0.806 | 2.500 | 0.655 | 2.467 | 0.550 | 2.433 | 0.729 | 2.100 | 0.761 | −0.004 | −1.318 | 0.193 |
| GEQ—Immersion | 0.833 | 0.724 | 1.200 | 0.841 | 1.133 | 0.876 | 1.067 | 0.821 | 1.167 | 0.939 | 0.004 | 0.906 | 0.369 |
| Stream Appropriate | 1.400 | 0.632 | 1.600 | 0.737 | 2.000 | 0.756 | 1.933 | 0.799 | 1.467 | 0.743 | 0.003 | 0.754 | 0.454 |
| Desire To Use | 1.467 | 0.640 | 1.800 | 0.775 | 1.800 | 0.941 | 2.267 | 0.799 | 1.333 | 0.617 | 0.001 | 0.309 | 0.759 |
Publisher’s Note: MDPI stays neutral with regard to jurisdictional claims in published maps and institutional affiliations. |
© 2022 by the authors. Licensee MDPI, Basel, Switzerland. This article is an open access article distributed under the terms and conditions of the Creative Commons Attribution (CC BY) license (https://creativecommons.org/licenses/by/4.0/).
Share and Cite
Chiossi, F.; Welsch, R.; Villa, S.; Chuang, L.; Mayer, S. Virtual Reality Adaptation Using Electrodermal Activity to Support the User Experience. Big Data Cogn. Comput. 2022, 6, 55. https://doi.org/10.3390/bdcc6020055
Chiossi F, Welsch R, Villa S, Chuang L, Mayer S. Virtual Reality Adaptation Using Electrodermal Activity to Support the User Experience. Big Data and Cognitive Computing. 2022; 6(2):55. https://doi.org/10.3390/bdcc6020055
Chicago/Turabian StyleChiossi, Francesco, Robin Welsch, Steeven Villa, Lewis Chuang, and Sven Mayer. 2022. "Virtual Reality Adaptation Using Electrodermal Activity to Support the User Experience" Big Data and Cognitive Computing 6, no. 2: 55. https://doi.org/10.3390/bdcc6020055
APA StyleChiossi, F., Welsch, R., Villa, S., Chuang, L., & Mayer, S. (2022). Virtual Reality Adaptation Using Electrodermal Activity to Support the User Experience. Big Data and Cognitive Computing, 6(2), 55. https://doi.org/10.3390/bdcc6020055