Article

Revisiting Gradient Boosting-Based Approaches for Learning Imbalanced Data: A Case of Anomaly Detection on Power Grids

by
Maya Hilda Lestari Louk
1 and
Bayu Adhi Tama
2,*
1
Department of Informatics Engineering, University of Surabaya, Surabaya 60293, Indonesia
2
Data Science Group, Institute for Basic Science (IBS), Daejeon 34141, Korea
*
Author to whom correspondence should be addressed.
Big Data Cogn. Comput. 2022, 6(2), 41; https://doi.org/10.3390/bdcc6020041
Submission received: 9 March 2022 / Revised: 31 March 2022 / Accepted: 14 April 2022 / Published: 16 April 2022
(This article belongs to the Special Issue Cyber Security in Big Data Era)

Abstract

:
Gradient boosting ensembles have been used in the cyber-security area for many years; nonetheless, their efficacy and accuracy for intrusion detection systems (IDSs) remain questionable, particularly when dealing with problems involving imbalanced data. This article fills the void in the existing body of knowledge by evaluating the performance of gradient boosting-based ensembles, including gradient boosting machine (GBM), extreme gradient boosting (XGBoost), LightGBM, and CatBoost. This paper assesses the performance of various imbalanced data sets using the Matthew correlation coefficient (MCC), area under the receiver operating characteristic curve (AUC), and F1 metrics. The article discusses an example of anomaly detection in an industrial control network and, more specifically, threat detection in a cyber-physical smart power grid. The tests’ results indicate that CatBoost surpassed its competitors, regardless of the imbalance ratio of the data sets. Moreover, LightGBM showed a much lower performance value and had more variability across the data sets.

1. Introduction

Power grid infrastructure has a significant positive impact on economic growth. It is an effective tool for stimulating regional economies [1]. In its current form, a smart power grid (SP) regulates both the supply of power and information across its intricate cyber-physical network. Hence, SP is a critical infrastructure with a significant socio-economic benefit. An SP is a sophisticated cyber-physical system that integrates the physical power system with computing, sensor, and advanced communication technologies so that an efficient and reliable process of transmission, distribution, monitoring, and control of electricity can be considerably maintained [2]. The majority of countries consider SP to be a vital infrastructure and have developed security procedures and policies to protect it [3,4]. As the design and implementation of SP become increasingly complex in nature, phasor measurement units (PMUs) have been adopted to increase system performance. One of the advantages of this approach is the process of making quick decisions based on the gathered data. Nonetheless, attackers can launch attacks to wreak havoc on power grid networks and induce blackouts [5].
Previous works have proposed IDSs to secure SP [6,7,8,9]. One of the IDSs domain research issues is choosing a seamlessly and computationally efficient classifier in the wild. It is not that straightforward since every intrusion data set has its own characteristics, differing from network architecture and attack scenario distributions. Knowing that those aforementioned problems are critical, this paper aims to establish a comparative analysis of several ensemble learners, providing researchers in this field with a better insight into finding the best-performing classifier ensembles. This study focuses on gradient boosting ensembles for IDSs in power grids, an area of research that has received scant attention in the current literature. In addition, those ensemble algorithms are deemed to be the most effective approaches for classification tasks involving imbalanced data problem [10,11]. Four implementations of gradient boosting ensembles are taken into account in our experiment, namely GBM [12], XGBoost [13], LightGBM [14], and CatBoost [15]. To sum up, this article has the following contributions:
  • We benchmark several implementations of state-of-the-art gradient boosting ensembles for anomaly detection on power grids;
  • We assess the performance of each gradient boosting ensemble under different imbalanced ratios ( I r );
  • We apply an oversampling strategy, namely the majority weighted minority oversampling technique (MWMOTE) [16], to overcome the imbalanced data issue.
We structure the rest of this article as follows. Section 2 describes pertinent existing works in the realm of machine learning-based IDSs in power grids, followed by Section 3, which presents an overview of the oversampling method and gradient boosting ensembles. The experimental settings and results are specified in Section 4, while, finally, we conclude with some remarks in Section 5.

2. Related Work

This section presents the state-of-the-art machine learning techniques for IDSs in power grids. We present the existing studies in chronological order. Hink et al. [17] investigated the potential of several machine learning algorithms as an approach for discerning kinds of power system disruptions, with an emphasis on identifying cyber-attacks. Pan et al. [6] utilized a sequential pattern mining to identify patterns associated with power systems outages and cyber-attacks effectively. In addition, the work also introduces the term “common path”, which is a sequence of critical system states in the temporal order that corresponds to distinct sorts of disruptions and cyber-attacks. Similarly, Pan et al. [7] built a hybrid IDS that can learn the temporal states of power system circumstances such as disruptions, regular control operations, and cyber-attacks. The proposed model is built based on a data mining method called “common path mining” to discover patterns using a power system audit log and other measurement data.
A new privacy-preserving IDS based on the correlation coefficient and expectation-maximization clustering algorithm is introduced in [18]. The proposed model is tested on the multi-class attacks of the power system data sets. Next, Keshk et al. [8] proposed another privacy-preserving technique for anomaly-based IDS. The proposed framework is comprised of two modules, namely a data preprocessing module and an anomaly detection module. The power system and the UNSW-NB15 data set are considered to evaluate the performance of the proposed technique. A gradient boosting-based feature selection technique for an IDS in smart grids is presented in [19]. The proposed model does not only reduce execution time but also enhances the detection rate. Several machine learning algorithms are applied to the selected feature subset.
Upadhyay et al. [9] combined a recursive feature elimination-XGBoost-based feature selection and majority voting-based classifier ensemble models for IDS in power grids. The ensemble framework blends nine heterogeneous individual learners to obtain an accurate solution to the IDS task. It improves the performance accuracy while reducing the false rate compared to other similar existing techniques. Lastly, this current work is similar to Louk and Tama [20], and they compared and analyzed classifier ensembles that are specifically designed for handling imbalanced data sets. The experiment results show that EasyEnsemble outperforms other classifier ensemble models considered in the study. Moreover, undersampling and oversampling techniques effectively improve the performance of boosting but not of bagging. This work, however, differs significantly from that presented in Louk and Tama [20] in terms of the classifier ensembles considered and the oversampling strategy utilized.

3. Methods

In this section, we first present an overview of the oversampling method considered in this study, followed by the four classifiers in the gradient boosting family.

3.1. Oversampling Technique

The aim of oversampling methods is to generate a set of synthetic positive examples based on the training ones. Note that the term ’examples’ refers to “samples” or “instances” of a data set. Let ζ = { ( x 1 , y 1 ) , , ( x m , y m ) } be the training data set, where y i { 1 , 1 } is the data labels; let ζ + = { ( x , y ) ζ : y = 1 } be the positive or minority examples; and let ζ = { ( x , y ) ζ : y = 1 } be the negative or majority examples. If | ζ + | > | ζ | , the performance of classification algorithms is significantly hampered, particularly when it comes to the minority examples. Hence, it is necessary to have a method to improve such performance. In this work, we utilize MWMOTE [16] to generate new examples by filling up blank spaces among the minority examples. MWMOTE has a benefit over the classical method, e.g., SMOTE, as it is able to detect noisy examples by assigning higher weights to borderline examples. The following (Algorithm 1) is the procedure for generating synthetic examples using MWMOTE.
Algorithm 1: General procedure of majority weighted minority oversampling technique
Preparation:
Training samples, ζ ; number of examples to generate, n u m E x ; threshold, T c l u s t ;
Procedure:
1. Calculate a set of filtered positive examples, ζ f +
2. Calculate positive boundary of ζ f + , U and negative boundary, V.
3. x V , determine the likelihood of picking x by assigning: P ( x ) = y U I α , C ( x , y ) and normalize those likelihoods.
4. Estimate L 1 , . . . , L M clusters of ζ + using agglomerative clustering algorithm and threshold, T c l u s t
5. Generate n u m E x by iteratively picking x V w.r.t. the likelihood P ( x ) , and update ζ iteratively by performing E : = E { x + r ( y x ) } , where y L k is uniformly picked and L k is the cluster containing x.

3.2. Gradient Boosting Ensembles

Gradient boosting tree (GBT) is an ensemble learning that combines several weak classifiers into a strong one. It is typically an additive model (e.g., linear addition of weak classifiers) and uses the CART regression tree algorithm as the base weak model. Let D = { ( x i , y i ) | i { 1 , . . . , l } , x i R k , y i R } be the power system data set with k features and l examples. It is a binary classification problem, where label y corresponds to each example x. Hence, the aim of a classification algorithm is to identify a classifier that maps the examples to either of the two classes (e.g., attack or normal).
Given an ensemble of T trees, the prediction output y ( x ^ ) T for an input x is the sum of predictions from each tree, y ( x ^ ) T = i = 1 T f i ( x ) , where f i is the output of the i-th regression tree of the T tree ensemble. To construct the ( T + 1 )-th tree, GBT minimizes a regularized objective function O b j t = Ω t + Θ t , where Ω t is loss function and Θ t is a regularization function to control the over-fitting. In this study, we employ four different GBT implementations, namely GBM [12], XGBoost [13], LightGBM [14], and CatBoost [15].

4. Experiment Settings and Results

4.1. Power Grid Data Set

To evaluate the classifier ensemble models, we utilize a benchmark data set that is developed by the Oak Ridge National Laboratories [7]. The data set was generated by setting up a power grid testbed that includes measurements related to the normal, disturbance, control, and cyber attack behaviors of the electric transmission system. The data set is composed of 128 features that were recorded by PMUs, relay snort alarms, and other control panel logs. A power system binary-class classification data set is considered since we aim to perform an anomaly-based intrusion detection task, where a machine learning algorithm usually classifies whether the traffic is natural or attack. The data set contains 15 sets with different instance distributions of each class. The class distribution in each set is measured by the imbalanced ratio ( I r ), which is a proportion of #minority examples to #majority examples. Therefore, a non-skewed data set has a value of 1, and conversely, a skewed data set has a value less than 1. In summary, the characteristics of each data set used in this study is provided in Table 1. In addition, the table provides information concerning the total examples ( ζ T ), number of examples labeled natural ( ζ ), and number of examples labeled attack ( ζ + ).

4.2. Evaluation Metrics

In this experiment, we adopt 10-fold cross validation, where the final result is the mean value of 10 elements. The performance of classifiers on the test set is measured under three different metrics, i.e., Matthew correlation coefficient ( M C C ), area under the receiver operating characteristic curve ( A U C ), and F 1 scores. A performance value is usually derived from a confusion matrix, H = T P F N F P T N , which summarizes the outcome of a binary classification [21,22]. Supposing that F N + T P = ζ + and F P + T N = ζ , a classification algorithm has perfect score if H = ζ + 0 0 ζ , where T P is true positive, FN is false negative, FP is false positive, and TN is true negative.
M C C provides more realistic estimates of the model performance and is calculated as the Pearson product moment correlation coefficient between actual and predicted scores. More specifically, it is obtained from the following formula:
M C C = T P · T N F P · F N ( T P + F P ) · ζ · ( T N + F N ) · ζ +
where it ranges in the interval { 1 , + 1 } , with −1 and +1 achieved in the case of perfect misclassification and perfect classification, respectively.
A U C is a popular metric to summarize the receiver operating characteristic curve, which is a probability curve that plots the true positive rate (TPR) against false positive rate (FPR) at various threshold values. Formally, it is calculated as follows:
A U C = 0 1 T P R ( F P R ) d F P R = 0 1 T P R ( F P R 1 ( x ) ) d x
where it ranges in the interval { 0 , 1 } . The higher its value, the more accurate the performance of the algorithm is at differentiating between positive and negative classes.
F 1 is defined as the harmonic mean of precision and recall metrics. It has the following form:
F 1 = 2 · T P 2 · T P + F P + F N
where it ranges in the interval { 0 , 1 } , with T P = 0 and F N = F P = 0 gained in case of perfect misclassification and perfect classification, respectively.

4.3. Hyperparameters Search

Hyperparameters for each implementation were searched using random search [23]. For GBM implementation [12], the hyperparameters were used specify include tree size, interaction depth, and shrinkage. XGBoost [13] has several hyperparameters to tune such as maximum depth, η , subsample, column sample by tree, and tree size. There are several hyperparameters to train LightGBM [14] such as maximum bin, maximum depth, minimum data in leaf, learning rate, lambda l 1 , lambda l 2 , tree size, feature fraction, bagging fraction, path smoothing, and minimum gain to split. Lastly, the hyperparameters of CatBoost [15] for tuning include tree size, depth, learning rate, l 2 leaf regularization, border count, and boosting type.
For all implementations, we searched the number of trees from four possible values, i.e., 100, 200, 500, and 1000 trees. We determined the search space of other hyperparameters as follows. GBM: interaction depth = { 3 , 4 , , 12 } and shrinkage = { 0.005 , 0.01 , 0.05 , 0.1 , 0.3 } . XGBoost: maximum depth = { 1 , 2 , , 12 } , η = { 0 , 0.1 , 0.2 , , 1 } , subsample = { 0.1 , 0.5 , 0.8 } , and column sample by tree = { 0.5 , 0.6 , , 0.9 } . LightGBM: maximum depth = { 1 , 2 , , 15 } , maximum bin = { 100 , 255 } , minimum data in leaf = {100,200,...,1000}, learning rate = { 0.01 , 0.02 , , 0.3 } , lambda l 1 and l 2 = { 0 , 10 , 20 , , 100 } , feature fraction and bagging fraction = { 0.5 , 0.9 } , path smoothing = { 1 E 8 , 1 E 3 } , and minimum gain to split = { 0 , 1 , 2 , , 15 } . CatBoost: depth = { 1 , 2 , , 10 } , learning rate = { 0.03 , 0.001 , 0.01 , 0.1 , 0.2 , 0.3 } , l 2 leaf regularization = { 1 , 3 , 5 , 10 , 100 } , border count = { 5 , 10 , 20 , 30 , 50 , 100 , 200 } , and boosting type = {’ordered’,’plain’}.

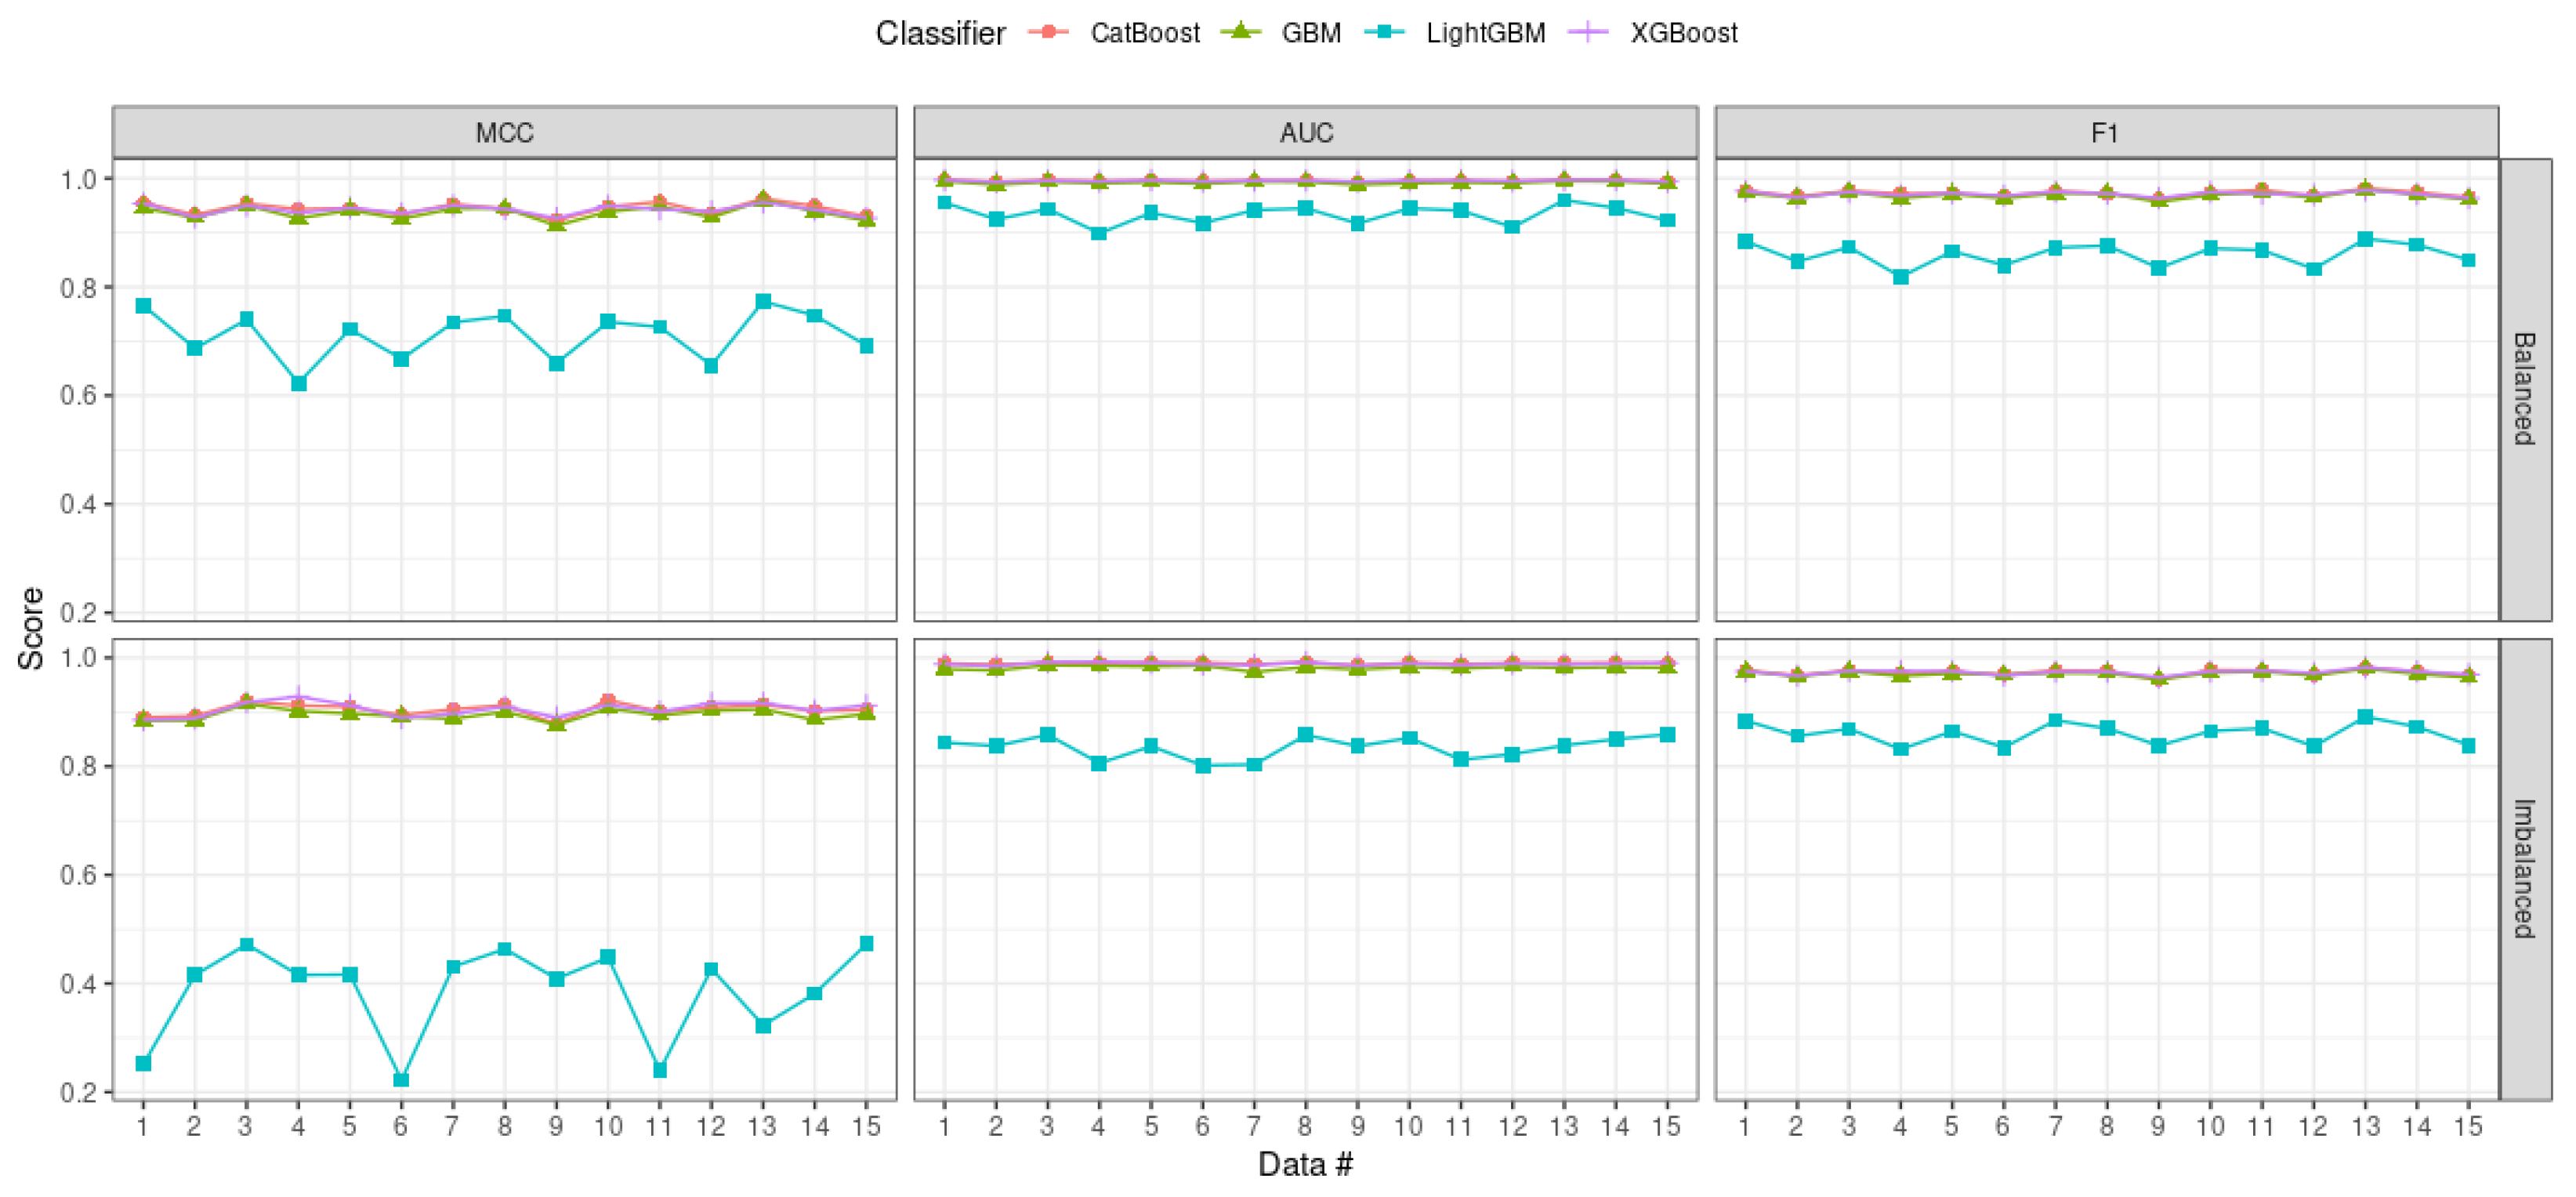
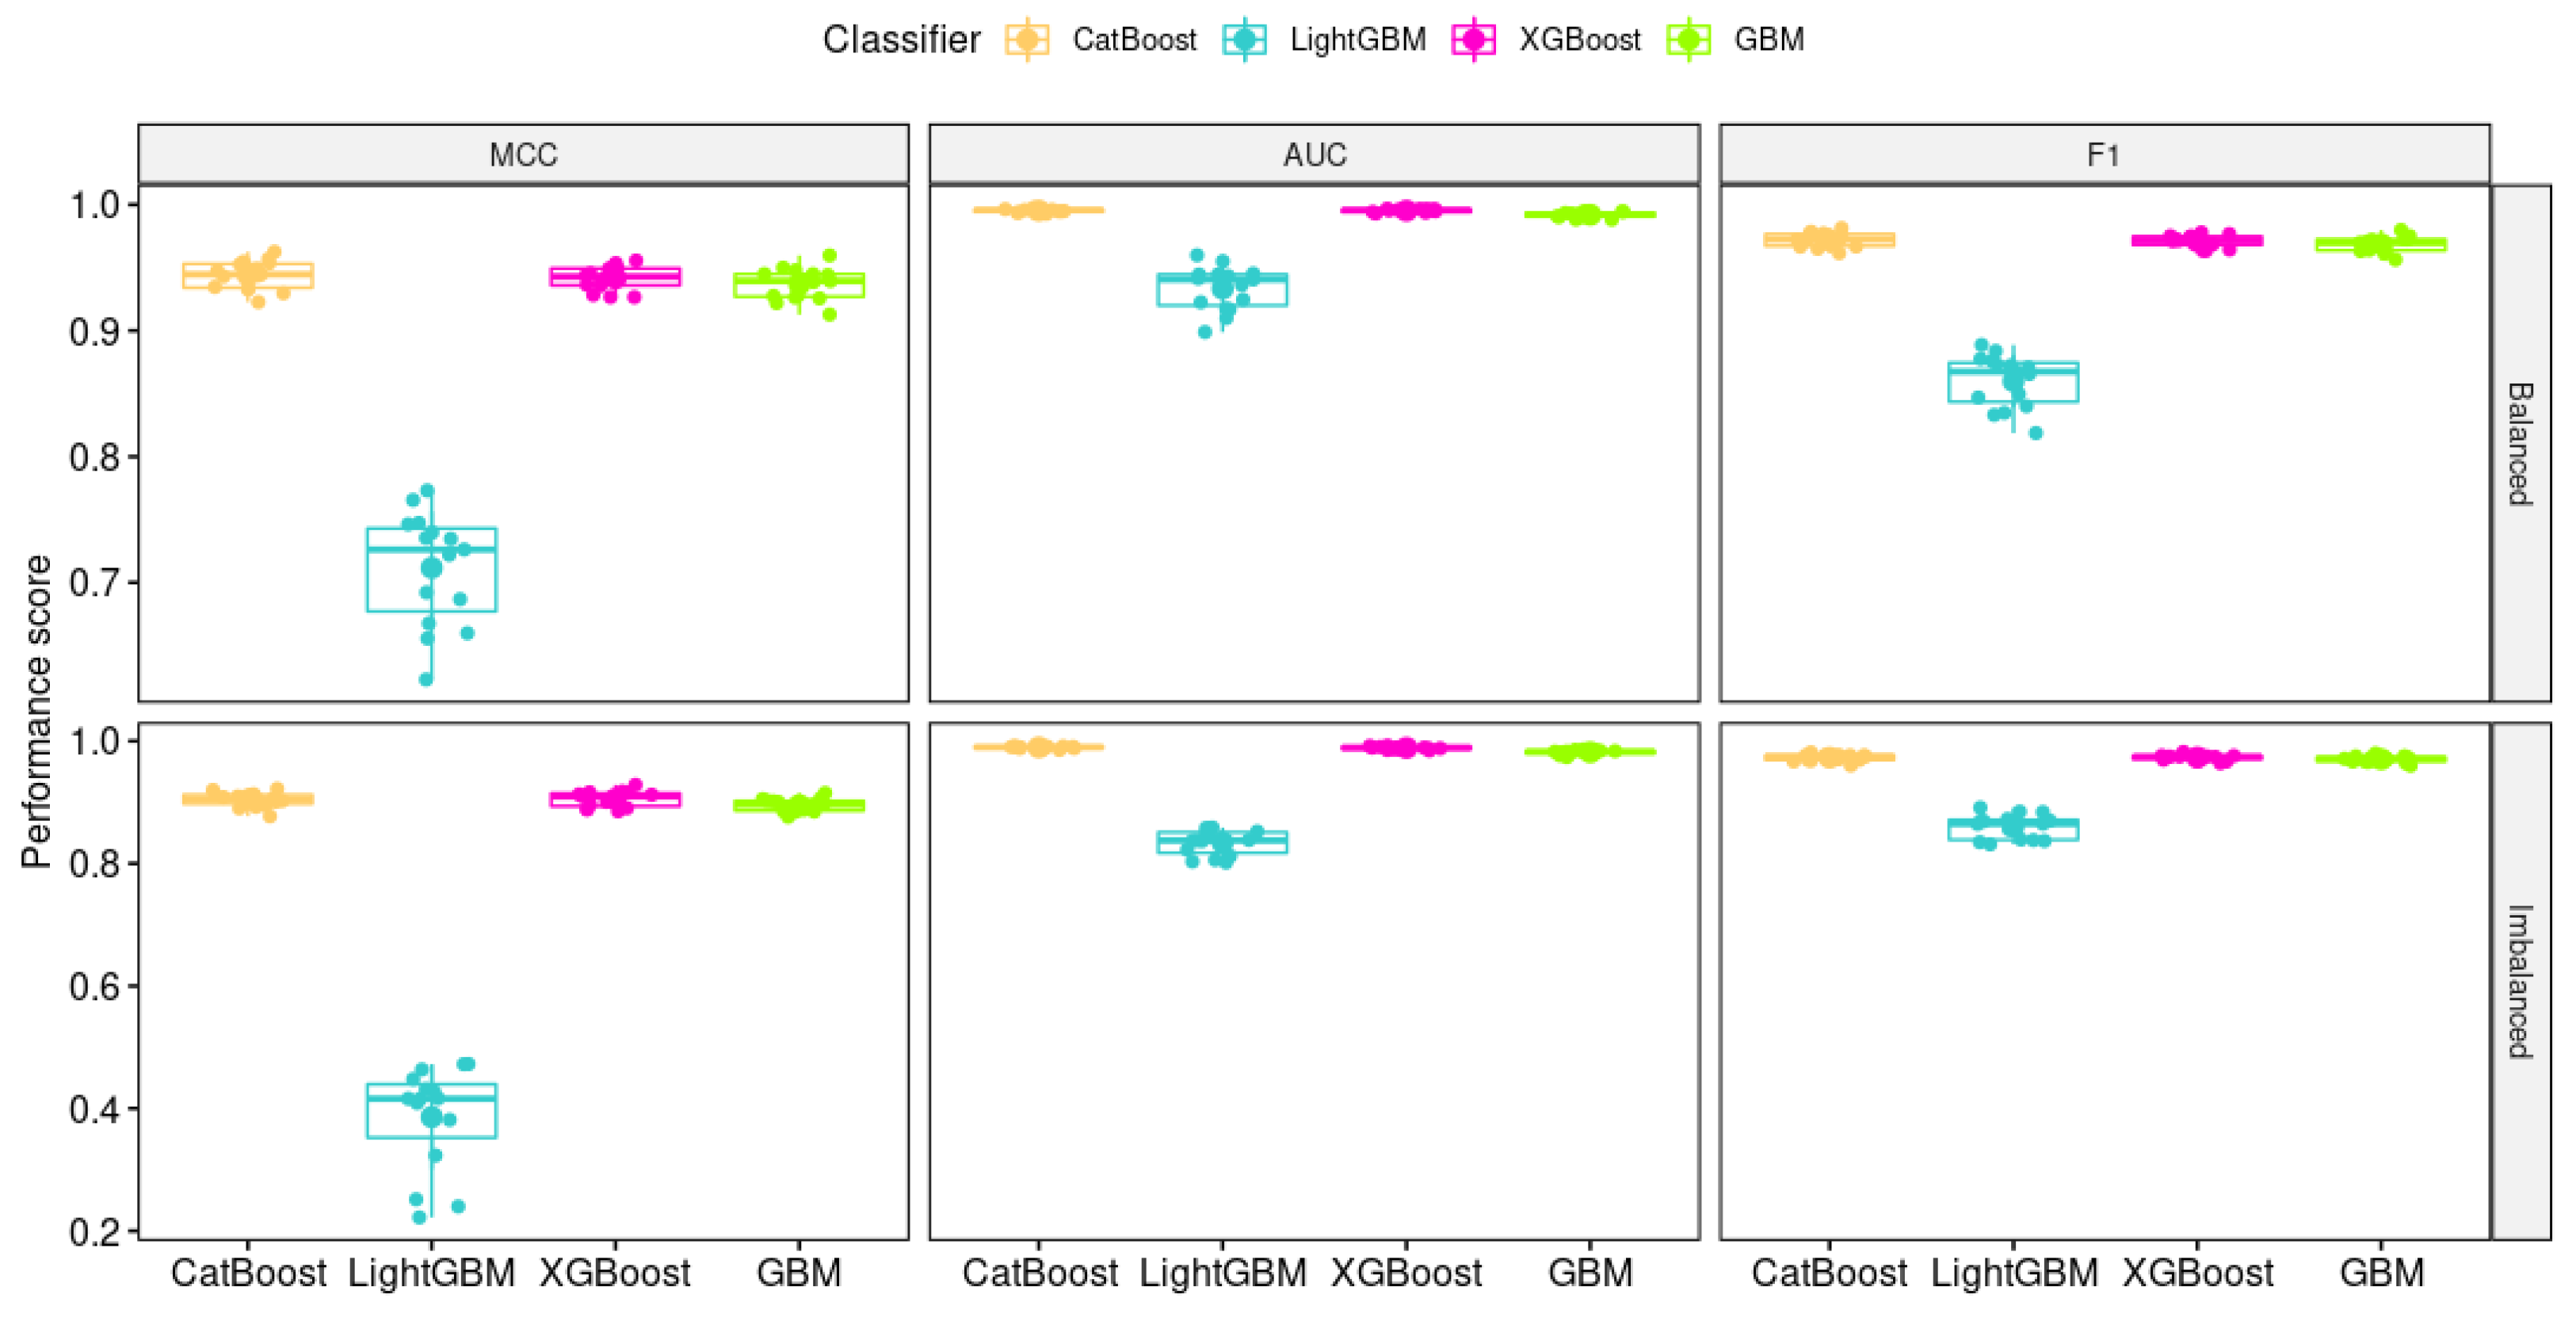
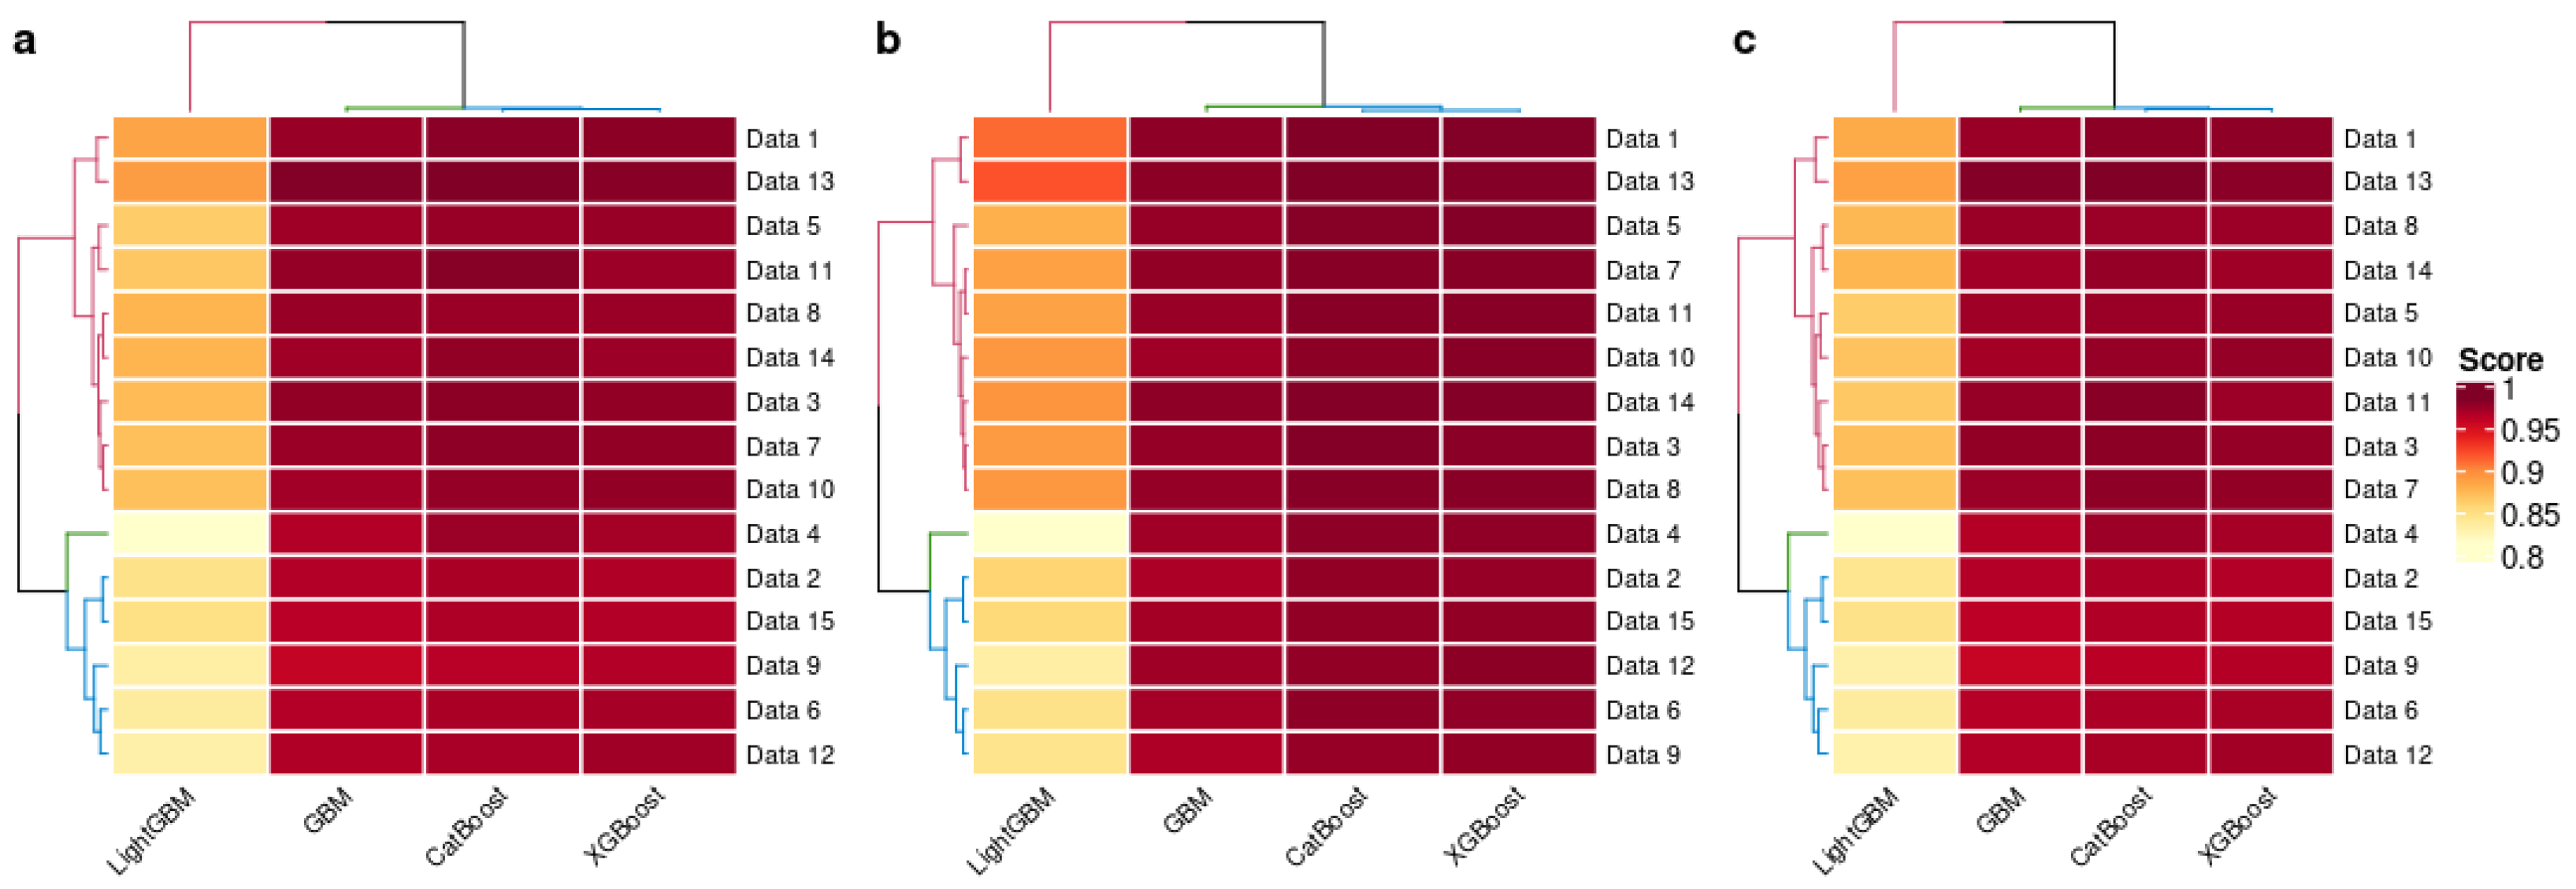
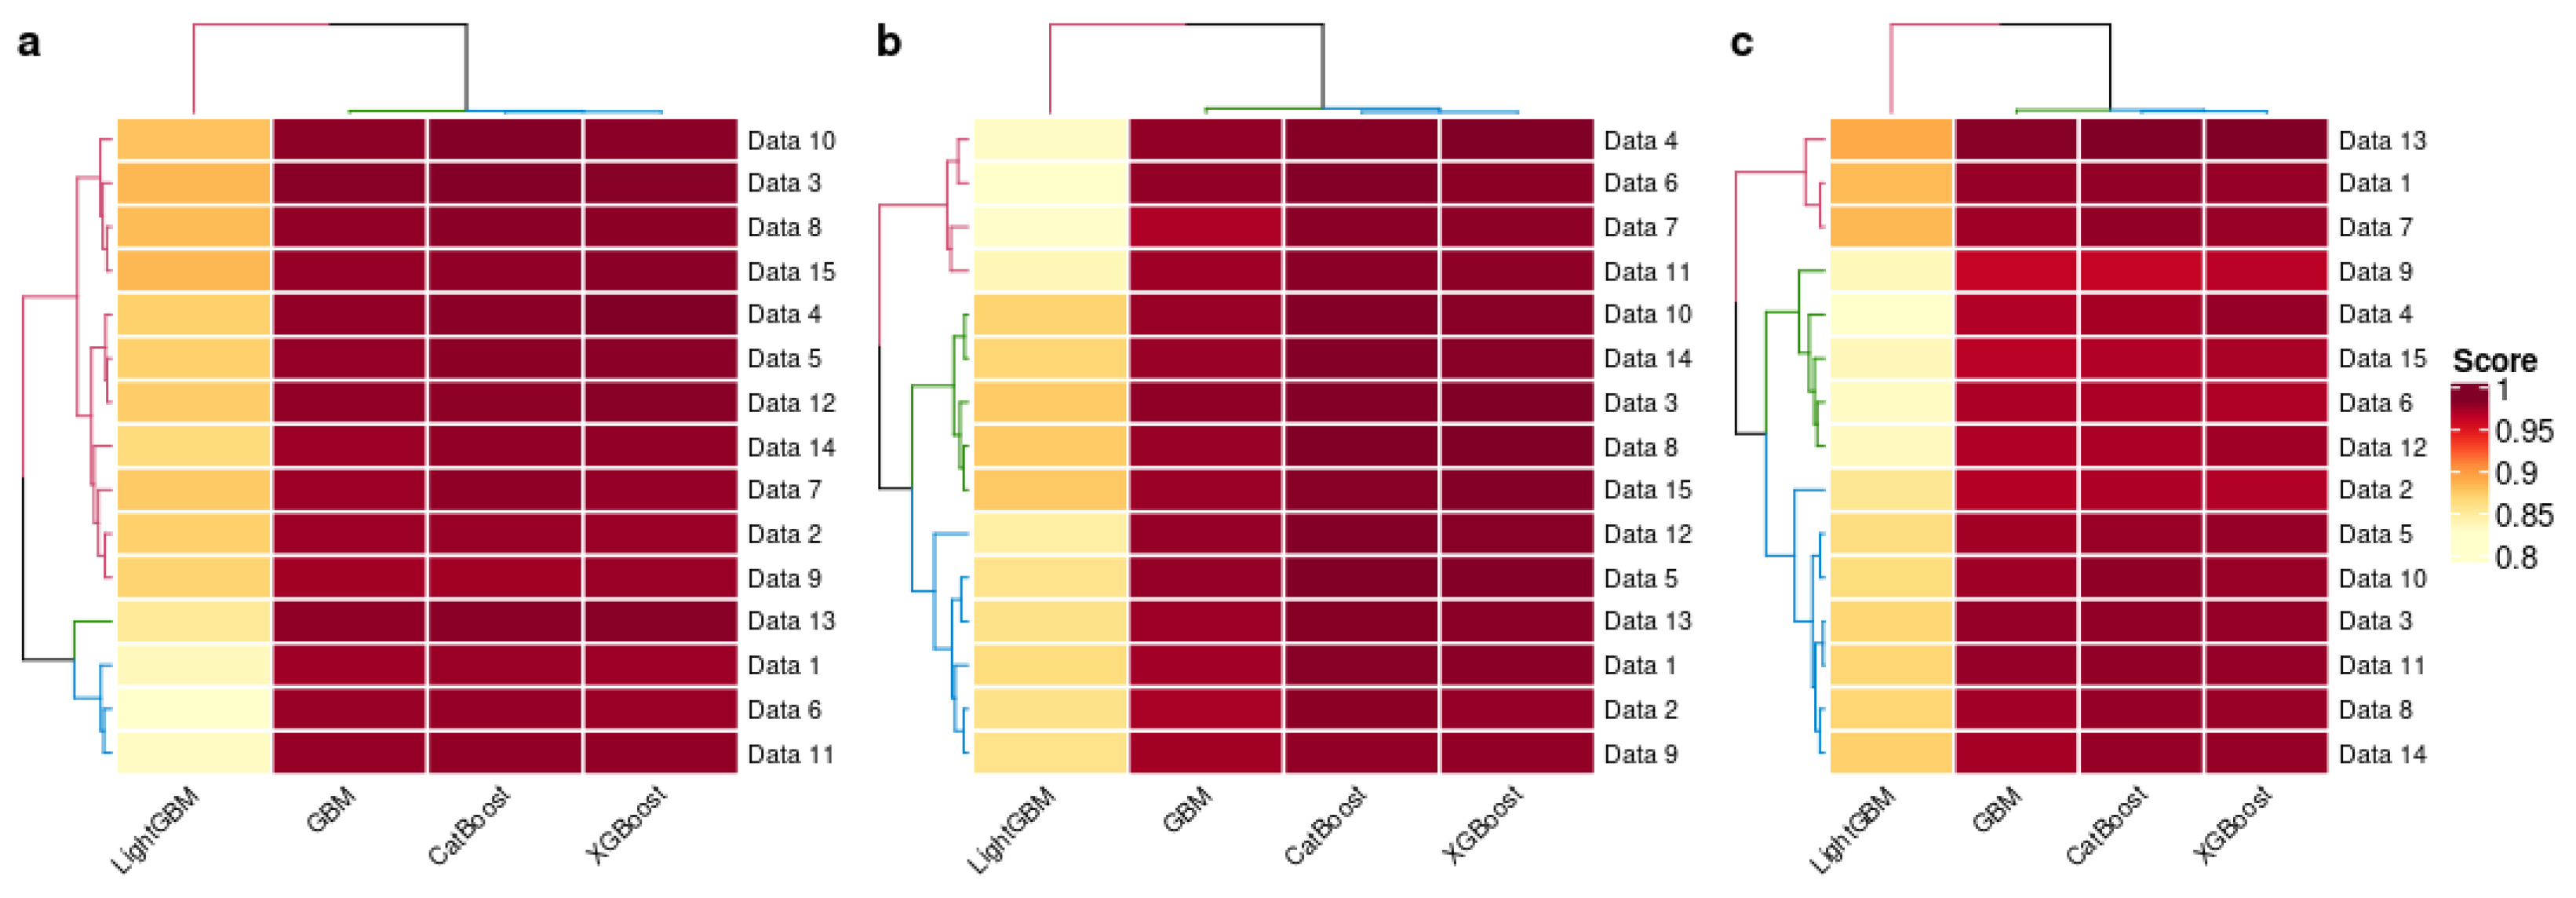
4.4. Result Discussion

All experiments were run on a machine with a Linux operating system, an Intel Xeon processor, and 32GB of memory. All data sets used in this study are publicly available (https://sites.google.com/a/uah.edu/tommy-morris-uah/ics-data-sets, accessed on 8 March 2022), while the code was implemented in R using the m l r 3 package [24]. This section aims to provide a performance validation of the gradient boosting ensembles (i.e., GBM, XGBoost, LightGBM, and CatBoost) in two different scenarios. First, the performance behavior of all benchmarked algorithms is assessed on the original (e.g., imbalanced) power system data sets. Second, we analyze the algorithms’ performance on the synthetically oversampled data sets (e.g., balanced). Here, the MWMOTE technique is used to oversample the minority class of each data set instances.
Figure 1 depicts the average performance of all algorithms across two distinct scenarios and data sets with respect to MCC, AUC, and F1 metrics. While LightGBM performs worse on average than the other three algorithms, all algorithms have appeared to be outstanding (score > 0.8) and maintain a constant AUC and F1 metric regardless of the I r of the data set. More precisely, two metrics, AUC and F1, produce over-optimistic and elevated results; thus, they do not notify us of ongoing prediction problems. However, a somewhat different picture emerges when MCC is considered as a performance metric. There is a slight difference in the algorithms’ performance, particularly when dealing with an imbalanced data problem. For instance, LightGBM reports relatively low MCC scores for the data set #1, #11, and #13, despite the fact that those data sets are highly imbalanced ( I r < 0.4 ). However, an outlier pattern was discovered in our analysis, in which data set #6 has a lower MCC score despite having I r > 0.4 . Additionally, unlike AUC and F1, we can argue that MCC is a consistent and effective statistical metric in any data set without producing misleading results [21].
It can also be noted that the performance of CatBoost, XGBoost, and GBM is much more consistent than the performance of LightGBM, which varies slightly across the data sets (see Figure 2). There are striking similarities and differences between the four performance distributions. In particular, the performance distributions of CatBoost, XGBoost, and GBM have roughly the same median, whereas LightGBM has a much lower median over all performance metrics. The performance values of LightGBM have much larger variability than the performance values of the other three algorithms.
Moreover, we apply hierarchical clustering to group the algorithms and data sets using the Ward.D dissimilarities measure [25]. We chose k = 3 as the number of clusters to be built. Figure 3 and Figure 4 show the hierarchical clusters of vertical observations (e.g., classification algorithms) and horizontal observations (e.g., data sets) in imbalanced and balanced data sets, respectively. The clustering method categorizes the classification algorithms into two main groups, where LightGBM has a considerable dissimilarity with GBM, CatBoost, and XGBoost, irrespective of the performance metrics and data set issues. In imbalanced data sets (see Figure 3), considering the MCC metric as an example, there are clearly two distinct groups: The red color group seems to consist of three more distinct groups, whereas the majority of blue and green color observations (i.e., data set #13, #1, #6, and #11) are clustered together at approximately the same height. This result confirms that the observations in blue and green are highly imbalanced data sets ( I r < 0.4 ), similarly to what we obtained in the previous section. In contrast, regarding balanced data sets (see Figure 4), there are obviously two unique groups in which three separate groups seem to be part of each group.
Lastly, we further benchmarked the algorithms’ performance based on the Friedman rank test [26,27]. Each algorithm was scored independently for each data set, ascending from the best-performing algorithm to the worst-performing one based on the performance metrics [28,29]. Using MCC as an example, the performance of LightGBM is consistent across two different settings, while CatBoost and GBM performed significantly better in the balanced data set setting than in the imbalanced data set setting. On the contrary, XGBoost performs worse when the data sets are balanced than when they are imbalanced (see Table 2).

5. Conclusions

This paper benchmarked four implementations of gradient boosting ensembles, namely GBM, XGBoost, LightGBM, and CatBoost, on various imbalanced data sets. We considered anomaly detection in power grids as a case study, whereas the performance of ensembles was examined under three performance measures, namely MCC, AUC, and F1 scores. Our study revealed that CatBoost was the best-performing algorithm in two different experimental settings, while LightGBM had a substantially lower performance value and a lot more variation in how it worked with different data sets. CatBoost slightly outperformed XGBoost with respect to all performance metrics when the Friedman rank test was used. The limitation of this study lies in the evaluation, which was only restricted to the fifteen power grid data sets. Future work should incorporate more diverse and relevant IDSs data sets to produce more generalizable findings. Finally, it is critical to introduce a novel public benchmark data set that can significantly impact the evaluation bechmark of machine learning algorithms.

Author Contributions

Conceptualization, M.H.L.L. and B.A.T.; methodology, B.A.T.; validation, M.H.L.L.; investigation, M.H.L.L.; writing—original draft preparation, M.H.L.L.; writing—review and editing, M.H.L.L. and B.A.T.; visualization, B.A.T.; supervision, B.A.T. All authors have read and agreed to the published version of the manuscript.

Funding

This research is funded by Institute for Basic Science (IBS) under grant No. IBS-R029-C2-001.

Institutional Review Board Statement

Not applicable.

Informed Consent Statement

Not applicable.

Data Availability Statement

Not applicable.

Conflicts of Interest

The authors declare no conflict of interest. The funders had no role in the design of the study; in the collection, analyses, or interpretation of data; in the writing of the manuscript; or in the decision to publish the results.

References

  1. Xu, Z.; Das, D.K.; Guo, W.; Wei, W. Does power grid infrastructure stimulate regional economic growth? Energy Policy 2021, 155, 112296. [Google Scholar] [CrossRef]
  2. Wei, R.; Kelly, T.P.; Hawkins, R.; Armengaud, E. Deis: Dependability engineering innovation for cyber-physical systems. In Federation of International Conferences on Software Technologies: Applications and Foundations; Springer: Berlin/Heidelberg, Germany, 2017; pp. 409–416. [Google Scholar]
  3. Irmak, E.; Erkek, İ. An overview of cyber-attack vectors on SCADA systems. In Proceedings of the 2018 6th International Symposium on Digital Forensic and Security (ISDFS), Antalya, Turkey, 22–25 March 2018; pp. 1–5. [Google Scholar]
  4. Li, Y.G.; Yang, G.H. Worst-case ϵ-stealthy false data injection attacks in cyber-physical systems. Inf. Sci. 2020, 515, 352–364. [Google Scholar] [CrossRef]
  5. Sengan, S.; Subramaniyaswamy, V.; Indragandhi, V.; Velayutham, P.; Ravi, L. Detection of false data cyber-attacks for the assessment of security in smart grid using deep learning. Comput. Electr. Eng. 2021, 93, 107211. [Google Scholar] [CrossRef]
  6. Pan, S.; Morris, T.; Adhikari, U. Classification of disturbances and cyber-attacks in power systems using heterogeneous time-synchronized data. IEEE Trans. Ind. Inform. 2015, 11, 650–662. [Google Scholar] [CrossRef]
  7. Pan, S.; Morris, T.; Adhikari, U. Developing a hybrid intrusion detection system using data mining for power systems. IEEE Trans. Smart Grid 2015, 6, 3104–3113. [Google Scholar] [CrossRef]
  8. Keshk, M.; Sitnikova, E.; Moustafa, N.; Hu, J.; Khalil, I. An integrated framework for privacy-preserving based anomaly detection for cyber-physical systems. IEEE Trans. Sustain. Comput. 2019, 6, 66–79. [Google Scholar] [CrossRef]
  9. Upadhyay, D.; Manero, J.; Zaman, M.; Sampalli, S. Intrusion detection in SCADA based power grids: Recursive feature elimination model with majority vote ensemble algorithm. IEEE Trans. Netw. Sci. Eng. 2021, 8, 2559–2574. [Google Scholar] [CrossRef]
  10. Xu, Z.; Huang, G.; Weinberger, K.Q.; Zheng, A.X. Gradient boosted feature selection. In Proceedings of the 20th ACM SIGKDD International Conference on Knowledge Discovery and Data Mining, New York, NY, USA, 24–27 August 2014; pp. 522–531. [Google Scholar]
  11. Tama, B.A.; Lim, S. Ensemble learning for intrusion detection systems: A systematic mapping study and cross-benchmark evaluation. Comput. Sci. Rev. 2021, 39, 100357. [Google Scholar] [CrossRef]
  12. Friedman, J.H. Greedy function approximation: A gradient boosting machine. Ann. Stat. 2001, 29, 1189–1232. [Google Scholar] [CrossRef]
  13. Chen, T.; Guestrin, C. Xgboost: A scalable tree boosting system. In Proceedings of the 22nd ACM Sigkdd International Conference on Knowledge Discovery and Data Mining, San Francisco, CA, USA, 13–17 August 2016; pp. 785–794. [Google Scholar]
  14. Ke, G.; Meng, Q.; Finley, T.; Wang, T.; Chen, W.; Ma, W.; Ye, Q.; Liu, T.Y. Lightgbm: A highly efficient gradient boosting decision tree. In Advances in Neural Information Processing Systems; ACM: New York, NY, USA, 2017; pp. 3146–3154. [Google Scholar]
  15. Prokhorenkova, L.; Gusev, G.; Vorobev, A.; Dorogush, A.V.; Gulin, A. CatBoost: Unbiased boosting with categorical features. In Advances in Neural Information Processing Systems; ACM: New York, NY, USA, 2018; pp. 6638–6648. [Google Scholar]
  16. Barua, S.; Islam, M.M.; Yao, X.; Murase, K. MWMOTE–majority weighted minority oversampling technique for imbalanced data set learning. IEEE Trans. Knowl. Data Eng. 2012, 26, 405–425. [Google Scholar] [CrossRef]
  17. Hink, R.C.B.; Beaver, J.M.; Buckner, M.A.; Morris, T.; Adhikari, U.; Pan, S. Machine learning for power system disturbance and cyber-attack discrimination. In Proceedings of the 2014 7th International Symposium on Resilient Control Systems (ISRCS), Denver, CO, USA, 19–21 August 2014; pp. 1–8. [Google Scholar]
  18. Keshk, M.; Moustafa, N.; Sitnikova, E.; Creech, G. Privacy preservation intrusion detection technique for SCADA systems. In Proceedings of the 2017 Military Communications and Information Systems Conference (MilCIS), Canberra, ACT, Australia, 14–16 November 2017; pp. 1–6. [Google Scholar]
  19. Upadhyay, D.; Manero, J.; Zaman, M.; Sampalli, S. Gradient boosting feature selection with machine learning classifiers for intrusion detection on power grids. IEEE Trans. Netw. Serv. Manag. 2020, 18, 1104–1116. [Google Scholar] [CrossRef]
  20. Louk, M.H.L.; Tama, B.A. Exploring Ensemble-Based Class Imbalance Learners for Intrusion Detection in Industrial Control Networks. Big Data Cogn. Comput. 2021, 5, 72. [Google Scholar] [CrossRef]
  21. Chicco, D.; Jurman, G. The advantages of the Matthews correlation coefficient (MCC) over F1 score and accuracy in binary classification evaluation. BMC Genom. 2020, 21, 6. [Google Scholar] [CrossRef] [PubMed] [Green Version]
  22. Chicco, D.; Tötsch, N.; Jurman, G. The Matthews correlation coefficient (MCC) is more reliable than balanced accuracy, bookmaker informedness, and markedness in two-class confusion matrix evaluation. BioData Min. 2021, 14, 13. [Google Scholar] [CrossRef] [PubMed]
  23. Bergstra, J.; Bengio, Y. Random search for hyper-parameter optimization. J. Mach. Learn. Res. 2012, 13, 281–305. [Google Scholar]
  24. Lang, M.; Binder, M.; Richter, J.; Schratz, P.; Pfisterer, F.; Coors, S.; Au, Q.; Casalicchio, G.; Kotthoff, L.; Bischl, B. mlr3: A modern object-oriented machine learning framework in R. J. Open Source Softw. 2019, 4, 1903. [Google Scholar] [CrossRef] [Green Version]
  25. Murtagh, F.; Legendre, P. Ward’s hierarchical agglomerative clustering method: Which algorithms implement Ward’s criterion? J. Classif. 2014, 31, 274–295. [Google Scholar] [CrossRef] [Green Version]
  26. Friedman, M. A comparison of alternative tests of significance for the problem of m rankings. Ann. Math. Stat. 1940, 11, 86–92. [Google Scholar] [CrossRef]
  27. Demšar, J. Statistical comparisons of classifiers over multiple data sets. J. Mach. Learn. Res. 2006, 7, 1–30. [Google Scholar]
  28. Japkowicz, N.; Shah, M. Evaluating Learning Algorithms: A Classification Perspective; Cambridge University Press: Cambridge, UK, 2011. [Google Scholar]
  29. Tama, B.A.; Lim, S. A comparative performance evaluation of classification algorithms for clinical decision support systems. Mathematics 2020, 8, 1814. [Google Scholar] [CrossRef]
Figure 1. Average performance of all algorithms across various power system data sets.
Bdcc 06 00041 g001
Figure 2. The skewness and spread of algorithms’ performance over two distinct scenarios.
Bdcc 06 00041 g002
Figure 3. Hierarchical clusters (shown in three distinct colors) of algorithms and imbalanced data sets in terms of (a) MCC, (b) AUC, and (c) F1 metrics. The color in each cell represents the corresponding performance value (light yellow: low; dark red: high).
Bdcc 06 00041 g003
Figure 4. Hierarchical clusters (shown in three distinct colors) of algorithms and balanced data sets in terms of (a) MCC, (b) AUC, and (c) F1 metrics. The color in each cell represents the corresponding performance value (light yellow: low; dark red: high).
Bdcc 06 00041 g004
Table 1. The characteristics of power system data sets. Imbalance ratio ( I r ) less than 0.4 indicates highly imbalanced data sets.
Data Set ζ T ζ ζ + I r
Data 14966386611000.285
Data 25069352515440.438
Data 35415381116040.421
Data 45202340218000.529
Data 55161368014810.402
Data 64967349014770.423
Data 75236391013260.339
Data 85315377115440.409
Data 95340357017700.496
Data 105569392116480.420
Data 115251396912820.323
Data 125224345317710.513
Data 135271411811530.280
Data 145115376213530.360
Data 155276341518610.545
Table 2. Average Friedman rank of all algorithms across different performance metrics.
ScenarioPerformance MetricCatBoostGBMLightGBMXGBoost
ImbalancedMCC1.472.934.001.60
AUC1.273.004.001.73
F11.402.874.001.73
BalancedMCC1.402.674.001.93
AUC1.533.004.001.47
F11.402.674.001.93
Publisher’s Note: MDPI stays neutral with regard to jurisdictional claims in published maps and institutional affiliations.

