Abstract
The COVID-19 pandemic has resulted in a global health crisis. The rapid spread of the virus has led to the infection of a significant population and millions of deaths worldwide. Therefore, the world is in urgent need of a fast and accurate COVID-19 screening. Numerous researchers have performed exceptionally well to design pioneering deep learning (DL) models for the automatic screening of COVID-19 based on computerised tomography (CT) scans; however, there is still a concern regarding the performance stability affected by tiny perturbations and structural changes in CT images. This paper proposes a fusion of a moment invariant (MI) method and a DL algorithm for feature extraction to address the instabilities in the existing COVID-19 classification models. The proposed method incorporates the MI-based features into the DL models using the cascade fusion method. It was found that the fusion of MI features with DL features has the potential to improve the sensitivity and accuracy of the COVID-19 classification. Based on the evaluation using the SARS-CoV-2 dataset, the fusion of VGG16 and Hu moments shows the best result with 90% sensitivity and 93% accuracy.
1. Introduction
Following the declaration of the coronavirus infectious disease 2019 (COVID-19) outbreak as a public health emergency of global concern on 11th March 2020, it has since been recognised as a pandemic [1]. COVID-19 is a respiratory illness caused by a novel virus known as severe acute syndrome coronavirus-2 (SARS-CoV-2). Primarily, the virus gains entry into the human body via the oral and nasal orifices, where it stays and rapidly proliferates to increase the viral load [2]. The virus gradually descends to the lower respiratory tract, reaching the lungs before it impairs the respiratory process [2]. These events contribute to the respiratory symptoms that are manifested by infected persons.
The most widely employed technique in detecting and confirming the presence of COVID-19 is the reverse transcription-polymerase chain reaction (RT-PCR) test [3]. However, RT-PCR results in a high false-negative rate and is time-consuming, as the screening needs to be repeated several times. A false-negative result could pose a risk to the patients’ life because they do not receive suitable treatments on time.
Medical imaging, especially the computerised tomography (CT) scan, appears to be a quicker and more reliable technology for the early detection of COVID-19. Given that CT scan has the capacity to detect essential features such as patchy bilateral shadows or ground-glass opacity (GGO), interlobular septa thickening in the lungs of COVID-19 infected patients [4], it is currently considered the primary method for radiologists and clinical doctors as a screening tool for patients suspected to be positive for the virus [5]. However, COVID-19 diagnosis based on the CT scans requires radiology experts, and the vast number of cases results in an insufficient number of radiologists. Thus, in order to expedite the screening of COVID-19 diagnosis and address issues relating to the scarcity of RT-PCR test kits and prolonged waiting time for results, an automated screening is required.
Machine learning is utilised to tackle a wide range of problems in a variety of industries, including phishing detection [6], water quality research [7], facial recognition [8,9], food recognition [10], and many others. The application of machine learning in the automatic detection of COVID-19 has gained extensive recognition by expediting the diagnosis and employing minimum labour inputs. Specifically, many researchers have applied deep learning (DL) techniques in classifying the severity of COVID-19 in accordance with CT scans [11,12,13,14] attributed to their remarkable ability in image processing tasks. The images are classified by using a descriptor to extract the images’ import features (e.g., SIFT [15] and image moment [16], which is followed by the application of classifiers such as SVM for the final image classification [17]. Techniques that are based on deep neural networks are characterised by high performance as the images are classified based on the extracted features, thereby reflecting their difference compared to handcrafted features [18].
Recently, several applications involving image processing and pattern recognition have benefited from powerful tools such as orthogonal moments and their variants. Numerous researchers have reported the successful usage of image moments in feature extraction in many applications [19,20]. For example, the combination of orthogonal quaternion Polar Harmonic Transform moments with optimisation algorithms for image representation and feature selection was successful in classifying the images of colour galaxies [21]. However, it has been established that there are still instabilities in artificial intelligence techniques for medical imaging that are associated with tiny perturbations and structural changes in the CT images [22]. Events such as patient shifting, small anatomic variation between individuals, and white-noise issues arising from the scanner might generate tiny disturbances [22].
The main drive for conducting this research is to propose an accurate classification technique for COVID-19 CT images that depends on the combination of the strength of the two methods. Furthermore, this study aims to investigate the potential of the moment invariant (MI) method for a more reliable automated COVID-19 screening. This paper proposed a fusion of Moment Invariant (MI)-based algorithm with the VGG16 model for feature extraction to increase the stability, sensitivity, and specificity of COVID-19 detection based on CT scans. The performance of the proposed method was trained and evaluated using the SARS-CoV-2 dataset. In summary, the key contributions of this research are as follows;
- A fusion of DL-based features and MI-based features is employed into a neural network-based framework for a more reliable and faster screening of COVID-19 patients using CT scans.
- An extensive experimental analysis is presented to validate the effectiveness and efficiency of the MI-based COVID-19 detection algorithm. By incorporating the MI method in the feature extraction, the proposed framework can attain the best accuracy of 93% with high sensitivity (90%) and specificity (96%).
The above-mentioned contributions are presented in Section 1 of this article, whereas the other parts are divided into four sections. Section 2 discusses the related works in the research area, while the proposed method is explained in Section 3. Then, Section 4 described the dataset preparation to be used in the experiments, whereas Section 5 elaborates the experiments conducted and discussed the results obtained. Section 6 and Section 7 present the conclusion and potential future works, respectively.
2. Related Works
2.1. Deep Learning Approaches for COVID-19 Detection
A modified VGG-19 model for COVID-19 detection was proposed by Mohammed [23], which involves features extraction from CT images and chest X-rays. The performance assessment was conducted on a self-collected database consisting of 1000 CT images and chest X-rays. The sensitivity, specificity, and accuracy of the VGG-19 model were reported as 97.4%, 99.4%, and 99.0%, respectively [23]. Another researcher proposed a deep transfer learning algorithm, VGG-19, that employs Chest X-ray and CT scan images for the prompt detection of COVID-19 cases [24]. The proposed model yielded promising diagnostic properties with sensitivity, specificity, and accuracy of 94.0%, 95.86%, and 95.0%, respectively [24]. For the classification of COVID-19 CT images, Butt et al. [13] reviewed a study by comparing multiple CNN models and found that a 3D-CNN with residual learning framework (ResNet-23) as a based network of the CNN was able to achieve an accuracy of 86.7% [13].
Additionally, a DL approach that uses Multiple Instance Learning (MIL) Residual neural network ResNet34 has been developed by Xiao et al. [25] for COVID-19 severity prediction. The model used private collected CT images from different universities and produced an accuracy of 97.45% on the training set and 81.9% on the testing set. However, they acknowledged the presence of potential bias and lack of transparency and interpretability due to the relatively small size of the dataset employed in developing the DL approach [25]. Jaiswal et al. [11] used DenseNet-201 for the automated detection and diagnosis of COVID-19 CT images. The researchers used the sigmoid activate function for binary classification instead of the SoftMax activate function and generated an accuracy and specificity of 99.8% and 99.2%, respectively [11]. Another residual learning approach on COVID-19 detection was proposed by Ahuja et al. [26]. The authors used ResNet-18 as the pre-trained model for abnormality localisation on the public dataset COVID-CT-Dataset and also applied image augmentation to produce more training and testing CT images and finally achieved more than 90% for accuracy, sensitivity, and specificity [26].
2.2. Application of Moment Invariant in Image-Based Classification
Moment invariants (MIs) are special functions of image moment. Moments are scalar quantities that are applied to characterise a function and capture its important features. MI is regularly applied to extract the geometric invariant features of geometric transformed images. It is commonly used in applications such as the classification of invariant objects and invariant features, which includes rotation, scaling, and translation extraction using moments. Moment invariant can be categorised into continuous moments and discrete moments. It has become a preferable selection for shape description as it provides a distinct solution for a given problem mentioned [27]. MI has been widely applied in medical imaging such as object detection and image registration.
Various MIs were applied by Ruggeri and Pajaro [28] to decide the layer of the eye cornea that is visualised in the confocal microscope. Given the capacity of cell shapes to provide distinct and individual layers, they served as the main basis for the proposed layer recognition. Upon applying Hu’s invariants on the binarised data, the researchers were able to classify it by ANN [28]. To avoid bias in the binarisation result, Zernike moments (ZMs) was used as an alternative cell-shape description. The result of the implementation outperformed the Hu moment invariants, and no binarisation was required.
Wang and Wang [29] used MIs on image processing for digital subtraction angiography to visualise the blood vessels in X-ray images. MIs are combined for local similarity detection during image sequence registration, which is followed by a proposed method involving thin-plate spline image warping, which has been demonstrated to be capable of handling both slow and sudden motions [29].
Hu MIs have also been applied to describe protein fragment features in order to identify the functions of proteins, including the SARS coronavirus [30]. The morphometry of cortical sulci was performed by using three-dimensional geometric moments and their invariants [31]. These MIs were applied with respect to rotation, translation, and uniform change of scale, and the approach successfully characterised the brain activities based on the Principal Component Analysis (PCA) of the first 12 invariants, which was computed for the first 12 different deep brain structures [31]. Furthermore, the approach was employed to the shapes of 116 various cortical sulci that were automatically detected in a dataset of 142 brains to obtain their correlates of handedness and gender [31].
3. Proposed Method
The block diagram of the proposed moment invariant-based deep learning method for COVID-19 classification based on CT images is shown in Figure 1. There are three main stages in the proposed method, which are features extraction from the CT images, features concatenation, and classification. Two types of features are extracted during the feature extraction stage: DL features and MI features. For DL feature extraction, three different CNN architectures are utilised in this work: namely, the Custom CNN, ResNet50, and VGG16. Meanwhile, the MI-based features are extracted using the Hu moment invariant method. Then, these two features (DL-based and MI-based features) are concatenated using the cascade fusion. Lastly, classification based on the fused features is performed by using the fully connected (FC) layers. The details of each stage of the proposed method are explained further in the following subsections.
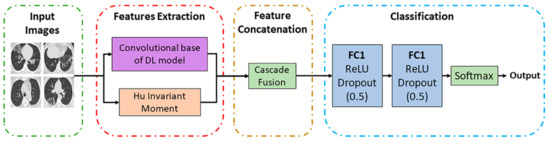
Figure 1.
Block diagram of the proposed method.
3.1. DL Features Extraction
For image classification of a case of COVID-19 as negative or positive, three CNN models were developed to extract essential features. A Custom CNN was constructed, and two pre-trained models, ResNet50 and VGG16, were reconstructed as the DL feature extractor. Each model was composed of two parts: convolutional base and classifier. The convolutional base comprises convolutional and pooling layers to generate features, whereas the classifier categorises the image based on extracted features. The transfer learning technique is used to work with the two pre-trained models by fine tuning the models’ parameters using the pre-trained weight of ImageNet [32]. It helps to overcome the overfitting problem, as we have a limited amount of CT images for training purposes. The classifier part for all the pre-trained models was removed, and their convolutional bases were used to extract the DL features. The Custom CNN is constructed from scratch with five convolutional layers. The Custom CNN will be further described in Section 3.1.3. For the Custom CNN network, the features are extracted at the final max-pooling layer and a volume shape of 11 × 11 × 64. ResNet50 generated features of shape 7 × 7 × 2048 at the final activation layer and VGG16 output features of shape 7 × 7 × 512 at the final max-poling layer.
3.1.1. Pre-Trained Model (VGG16)
Two well-established pre-trained models are used in the proposed method: (i) VGG16 and (ii) Resnet50. VGG16 is a CNN architecture that won the ILSVR (Imagenet) competition in 2014 [18]. This model is able to extract low-level features by using its small kernel size and proved to have an excellent feature extraction ability for the classification of COVID-19 CT images, as reported in [33]. VGG16 consists of 16 convolutional layers and has a small receptive field of 3 × 3. It also has five max-pooling layers of size 2 × 2 with stride two [18]. In this study, the VGG16 model follows the original architectures, which can be downloaded using Keras libraries via the Application API. For this work, the VGG16 model is loaded from the Keras framework using the command from “keras.applications import VGG16”, with “include_top” argument set to False upon importing the model in order to omit the original classifier part of the model. Furthermore, the last max-pooling layer was also omitted and replaced with an average pooling layer. During the classification phase, the output features from the average pooling layer of the VGG16 model are fed into the new fully-connected layers. The new classifier part of the VGG16 model consists of one flattened layer and two dense layers, with each generating 100 and 2 outputs, respectively. The first dense layer has a Rectified Linear Unit (ReLU) activation function with 0.5 dropout. The output layer, which is the last dense layer, has a Sigmoid activation function. The feature map size of the generated VGG16 features used in this work is 25,088 × 1 dimension per input image. Figure 2 depicts the VGG16 architecture used in this paper.
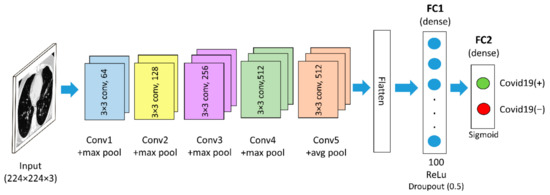
Figure 2.
The VGG16-based architecture used in this work.
3.1.2. Pre-Trained Model (ResNet50)
ResNet50 is a form of a residual network having 50 layers. It is comparable to VGG16 except that ResNet50 has an additional identity mapping capability. The identity mapping used in ResNet50 allows the model to bypass a CNN weight layer if the current layer is not necessary. It reduces the vanishing gradient problem by allowing an alternate shortcut for the gradient to flow. In this research, the ResNet50 model is loaded from the Keras framework using the command “from keras.applications import ResNet50” with the “include_top” argument set to “False”. Furthermore, an average pooling layer is added after the convolutional layer of the fifth convolutional block. Similar to VGG16, a new classifier part is added after the average pooling layer of the ResNet50. The feature map size of the generated ResNet50 features used in this work is 2048 × 1 dimension per input image. The ResNet50 architecture used in this paper is depicted in Figure 3.
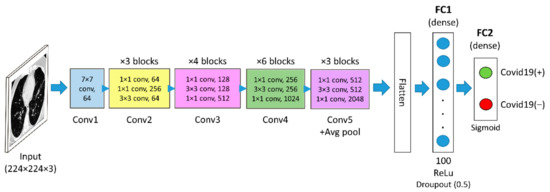
Figure 3.
The ResNet50-based architecture used in this work.
3.1.3. Custom CNN
The Custom CNN model is constructed from scratch using the sequential method. All the libraries required to build a sequential model are imported from the keras.model and keras.layers. The Custom CNN is composed of five convolutional layers and four max-pooling layers. All convolutional layers have a window shape of size 3 × 3. The first convolutional layer uses 32 convolution filters, and the subsequent convolutional layers use 64 convolution filters. Furthermore, 2 × 2 maximum pooling layers were applied after the first, second, fourth, and fifth convolutional layers. Correspondingly, after the last max-pooling layer, there is an FC layer with the ReLU activation function and an FC layer with the Softmax activation function. For this network, the dropout is fixed to 0.5, and the first dense layer is set to generate 128 outputs while the second dense layer is set to generate two outputs. Figure 4 depicts the architecture of the Custom CNN model. The feature map size of the generated Custom CNN features is 12,800 × 1 dimension per input image.
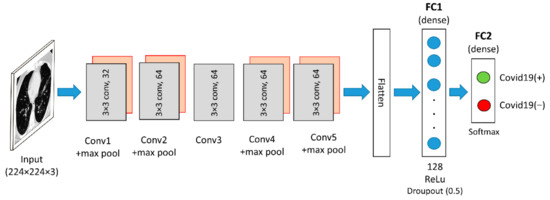
Figure 4.
Custom CNN architecture used in this work.
3.2. Hu Invariant Moment
The MI-based features of each CT image are extracted using the Hu invariant moments function from the OpenCV library. Hu moments have specific features such as scaling, rotation insensitive, and could be translated. They are capable of extracting contour and shape characteristics from lung images. Hu moments of an image are statistical outcomes produced following the weighing of average image intensities of the pixels, and the moments are insensitive to image transformations [34,35]. This signifies that the same moment values are produced irrespective of the alterations made to the image. Hence, to enhance the CNN in terms of invariance to the limitation of image transformations, the Hu’s moments of the image can be fed to the FC neural network. The central moments provided below can be used to achieve the invariant features [35,36]:
where
The pixel point is the image’s centroid . The centroid moments are estimated by using the image’s centroid , which is equal to the , whose centre has been shifted to the image’s centroid. As a result, the central moments remain unchanged and insensitive to image translations. Normalisation can be applied to obtain the scale invariance [36].
The following equation defines the normalised central moments:
where
A total of seven moment invariants are produced in line with the normalised central moments in (1) and (2):
Hu moment invariants are a set of seven numbers calculated using central moments that are invariant to image transformations. The first six moments are invariants under translation, rotation, and scaling [35], whereas the seventh moment’s sign changes depending on the direction of the image reflection. According to [35], as the image resolution increases, the fluctuation of moment values becomes more stable. When the resolution exceeds 270 × 270, the fluctuation no longer decreases and becomes stagnant. This means that even if some changes were made to the image, it will always produce nearly identical moment values. After rescaling the CT images to 224 × 224 dimension during the pre-processing step, the process of extracting the Hu moments of the CT images begins with reading the image and then converting it to a grayscale image. This is implemented through the use of Python’s imread() and cvtColor() functions. OpenCV has a built-in function for calculating Hu moments called HuMoments(). This function takes the central moment of the images, which can be calculated using the function moments() as input. Then, the seven Hu moment values are generated in the shape of a 7 × 1 dimension.
3.3. Features Concatenation
The high-level features of each image extracted from DL models were concatenated with the Hu moments feature of the respective image into a composite vector. Cascade fusion is applied to directly connect to the two feature maps (DL features and Hu moment features) while retaining all the elements due to its suitability for the fusion of feature maps of any dimension, as proposed by Ren et al. [37]. The extracted Hu moment values were presented as a one-dimensional row vector, whereas the features extracted from Custom CNN and pre-trained models were multi-dimensional feature vectors. The concatenation process begins with flattening the features extracted from a CT image by a DL model. The output of the last convolutional or pooling layer of the DL model is multi-dimensional features of the CT image. These features needed to be flattened so that it can be concatenated with the one-dimension Hu moments. By using the K.concatenate() in Keras, the flattened DL features and the Hu moments of the image were concatenated to produce the final fused features. Figure 5 depicts the concatenation process of DL features and Hu moment of one CT image.
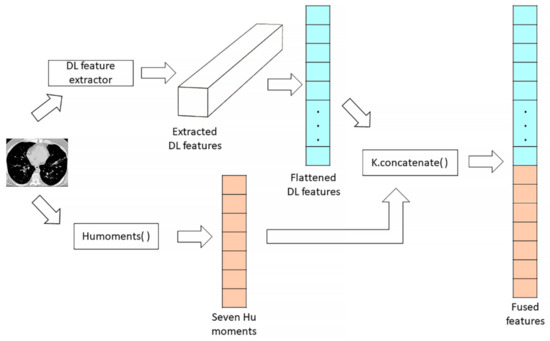
Figure 5.
Features concatenation process between the DL features and the Hu moments of a CT image.
3.4. Classification Phase
In this work, a fully connected network is built with two fully connected (FC) layers. The first FC (dense) layers generates 100 output units for VGG16 and ResNet50 and 128 output units for Custom CNN with a ReLU activation function and a dropout of 50%. The second FC (dense) layers generates two output units with a sigmoid activation function for VGG16 and ResNet50 and softmax activation function for Custom CNN. In the classification phase, the fused features generated by the concatenation process between the DL features and the Hu moment invariants were preserved as one-dimensional features. Then, these features were fed into FC networks. In a neural network, the activation function is responsible for transforming the summed weighted input from the node into the activation of the node or output for that input. Compared to any other activation function, ReLU prevents exponential growth in a model computation and is simpler to implement, since it has only a derivative of either zero or one, depending on whether its input is respectively negative or positive. Lastly, the output of the last FC layer is used to predict the probability of COVID-19 positive and COVID-19 negative labels.
4. Dataset
The present research used the SARS-CoV-2 CT-Scan dataset for experimental purposes. Soares et al. [38] compiled this dataset after collecting the data from a hospital in Sao Paulo, Brazil and obtaining approval by their ethical committee. The dataset has been made public by the authors on 22 April 2020 and can be accessed via the Kaggle website at the following link: https://www.kaggle.com/plameneduardo/sarscov2-ctscan-dataset (accessed on 14 January 2021). The SARS-CoV-2 dataset is a well-balanced dataset with 1230 COVID-19 negative and 1252 COVID-19 positive CT scans, contributing to a total of 2482 CT scans. A balanced dataset prevents the domination of the minority class by the majority class, where the classifier learns only one class concept rather than two distinct concepts during the training process [24]. Furthermore, the SARS-CoV-2 dataset is one of the most recent datasets with the most significant COVID-19 positive and negative radiology images [24]. This dataset contains digital scans of printed CT images ranging in size from 104 × 153 to 484 × 416 pixels.
The model was trained using a sample of data designed for training purposes. The model was fit into the training dataset by adjusting the parameters. A validation dataset is a dataset used for frequent evaluation of the model. This validation dataset was used in fine-tuning the model hyper-parameters, but it was not applied for the training process. Lastly, a testing dataset is a subset of data used to evaluate the performance of the trained model on the unseen data. The most important factor in the success rate of machine learning is the amount of training provided and the availability of testing data [39]. According to experts’ opinions, test outcomes will fail to attain a good classifier if training data is below 50% [40]. Hence, to be assured of achieving an accurate diagnosis, the training data were increased. The selected dataset was manually divided into training, validation, and testing sets with a ratio of 82.8%, 9.1%, and 8.1%, respectively. The training dataset consists of 2054 total images, with 1032 COVID-19 negative and 1022 COVID-19 positive CT images. On the other hand, the validation dataset comprises 121 and 107 CT images that are COVID-19 negative and COVID-19 positive, respectively. The testing dataset had a total of 200 CT images with an equal number of COVID-19 positive and negative cases. The partition of the selected dataset is summarised in Table 1. Then, all CT images from the training and testing sets were rescaled into 224 × 224 pixels using OpenCV’s resize function.

Table 1.
Dataset partition.
5. Experiments
Figure 6 summarises the experiments conducted to validate the proposed method. In the first part of the experiments, the CT images only undergo basic pre-processing steps before the training and testing phases, which includes rescaling into 224 × 224 dimension using the resize function from OpenCV and pixels normalisation. All images that were fed into the DL models (Custom CNN, ResNet50, and VGG16) for feature extraction retained their three-dimensional colour channel format. However, the images that were fed into the Hu invariant moment method were grey-scaled. Then, all rescaled images pixel values were normalised into a range between zero and one. In another part of the experiments, additional pre-processing steps called region of Interest (ROI) segmentation was carried out before the training and testing phases. The model implementation has been carried out using Keras API in Python, with a Tensorflow backend.
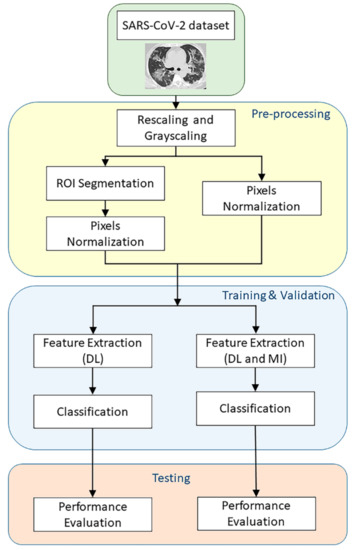
Figure 6.
Flowchart of the experiments.
For medical imaging, the ROI contains the main disease information, which is the main basis for the doctor to diagnose and formulate the treatment plan [41]. Hence, ROI can replace the original image in image processing, which can reduce the amount of calculations and deal better with the rapid growth of image data [41]. Segmentation of ROI from the enhanced image is widely employed by researchers with automated and semi-automated techniques [42]. In this work, the lung structure in the CT images was automatically segmented using Python’s OpenCV and scikit-image libraries. The segmentation process begins with image binarisation using a threshold of 150 Hounsfield Units (HU), which is followed by removing the unwanted regions connected to the image’s border. All tiny and unnecessary parts surrounding the left and right lung parenchyma were removed. Thereafter, a binary erosion with a disc of radius two was used to detach the lung nodules from the blood vessels. Next, binary erosion with a disc radius of 10 was used to maintain the attachment of the nodules to the lung wall, resulting in a binary mask of the lungs. Small holes, large airways, blood vessels, and trachea were filled with the hole-filling function within the lung’s binary mask. This procedure was performed to produce complete ground truth images of the lungs. Finally, these ground truth images were superimposed to fill the masked region with the original lung region, which is the ROI. Segmented ROI image pixels values were normalised into a range between 0 and 1 to convert the images into the range that could be normally sensed. Figure 7 shows the ROI segmentation of a lung CT scan.
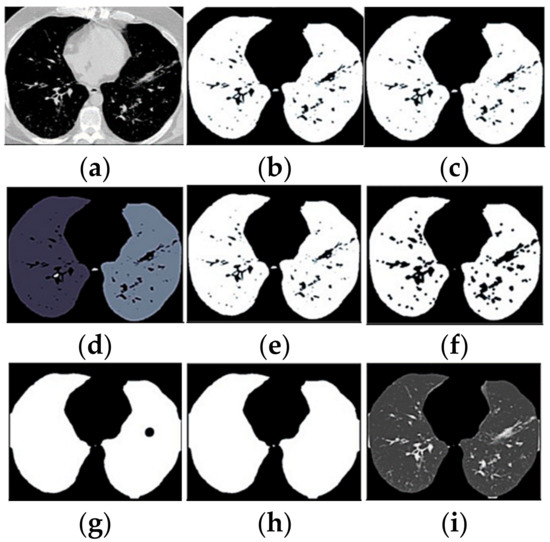
Figure 7.
ROI segmentation of a lung CT scan. Each panel presented the image result of every steps of the segmentation process: (a) original CT; (b) binarised; (c) border removed; (d) component labelled; (e) biggest two selected; (f) blood vessels separated; (g) mask closure; (h) holes filled; (i) segmented image.
6. Results and Discussion
Throughout this section, several abbreviations were used for better organisation and presentation of the results. The DL models without the use of MI-based features were denoted as Custom CNN, ResNet50, and VGG16, whereas the DL models involving the use of MI-based features were designated as Custom CNN + MI, ResNet50 + MI, and VGG16 + MI. The results obtained from the experiments are presented in the following subsections.
6.1. Models’ Performance on Unsegmented CT Images
For each of the DL models, training and validation were conducted for 100 epochs, and we set the learning rate to be 0.0004 with an Adam optimiser. A single passing of the whole training dataset to the neural network is insufficient for the network model to learn the weights. A small number of epochs will result in the underfitting of the model, whereas overfitting ensues if there are very high numbers of epochs. Therefore, 100 epochs were proposed and used for better weight updating and learning optimisation. Next, the learning rate is a hyper-parameter that affects the learning process during the training phase. If the training rate is too high, the training will become unstable, or the learning set’s weight will be too fast, whereas a very low learning rate will prolong the training process. Since this experiment was only run for 100 epochs, which is not really long, a small learning rate of 0.0004 was proposed.
The training and validation accuracy of the DL models without MI on the unsegmented datasets are shown in Figure 8. As presented by the dots on the curve lines in Figure 8a, the best training accuracy for the Custom CNN was obtained on the 94th epoch, ResNet50 on the 99th epoch, and VGG16 on the 24th epoch, whereas for the validation accuracy in Figure 8b, the best epochs were obtained for Custom CNN, ResNet50, and VGG16 on the 90th, 88th, and 51st runs, respectively. In Figure 9a, the Custom CNN + MI, ResNet50 + MI, and VGG16 + MI obtained the best training accuracy on the 12th, 98th, and 16th epochs, respectively. For the validation accuracy in Figure 9b, the best epoch obtained for Custom CNN + MI, ResNet50 + MI, and VGG16 + MI was obtained on the 38th, 83th, and 55th epochs, respectively.
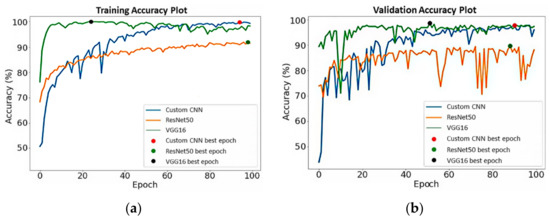
Figure 8.
(a) Training and (b) validation accuracy for DL models without MI.
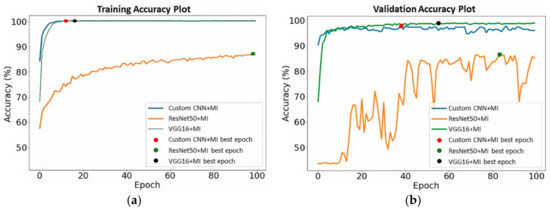
Figure 9.
(a) Training and (b) validation accuracy for DL models with MI.
After the training phases, the DL models were tested on the pre-processed testing dataset. Based on the generated confusion matrices and Receiver Operating Curves (ROCs), the performance of the DL models with and without MI was summarised in Table 2. The Area under the Curve (AUC) values of the Custom CNN and VGG16 models ranged from 0.95 to 0.98, respectively, which is considered an excellent classification performance. Both AUC values of the Custom CNN and VGG16 were very close to 1, because the prediction power of both models was good. Specifically, the predicted probability values close to 1 are regarded as correct labelling, while values close to 0 represent incorrect labelling.
Table 2.
Performance of DL models with and without MI on the testing dataset (unsegmented).
The highest AUC was exhibited by VGG16 and with a specificity value of 0.975 (97.5%). It can also be seen that the use of MI-based features could increase the DL model’s specificity performance in classifying COVID-19 cases, as supported by the higher specificity obtained by the Custom CNN + MI (96%) and ResNet50 + MI (72%) compared to the Custom CNN (90%) and ResNet50 (69%), respectively. However, there was a 1% decrease in the specificity obtained by VGG16 + MI when compared to VGG16. VGG16 yielded the highest specificity value with 97%. Furthermore, it can also be seen the accuracy value of Custom CNN and VGG16 models increased when using the MI-based features. Specifically, Custom CNN + MI (90.5%) and VGG16 + MI (93%) showed 0.5% higher accuracy than Custom CNN (90%) and VGG16 (92.5%), respectively. Based on these findings, it can be concluded that MI has the potential to mitigate the inaccuracy of the COVID-19 classification model as the model learns an additional seven features from the CT image. The Hu moments concatenated into the DL features has made the flattened vector more informative and more discriminative. The more features learned by the model, the greater the recognition ability of the model. In addition, the DL models were trained to see the Hu moment, extent, and solidity values alongside the DL features vector. These values had affected the activations in the network in order to achieve transformation invariant.
In contrast, there was a significant decrease in the accuracy value when MI-based features were employed in the ResNet50 model. Accordingly, by applying only the feature extracted via ResNet50, the model yielded an accuracy value of 76.5%, which decreased to 73.5% when ResNet50 + MI was used. For sensitivity, the highest results were obtained by Custom CNN and VGG16 + MI, with each yielding a value of 90%. Although VGG16 + MI showed a significant increase in sensitivity compared to VGG16 (88%), the Custom CNN + MI (85%) and ResNet50 + MI (75%) exhibited lower sensitivity values than Custom CNN (90%) and ResNet50 (84%), respectively. In both MI-based and non-MI-based experiments, the ResNet50 model had shown the worst performance compared to other models. The low ResNet50 performance could be attributed to the ResNet50 feature map size (2048 × 1 dimension) employed in this work being significantly less than the VGG16 feature map size (25,088 × 1 dimension) [10]. The larger feature map size of VGG16 compared to Custom CNN and ResNet50, on the other hand, is likely to contribute to VGG16 giving the best overall accuracy. Hence, the proposed method gained the overall advantages of using VGG16 as the feature extractor. Overall, VGG16 + MI yielded the highest sensitivity and accuracy values with 90% and 93%, respectively, thereby making it the best among the six models generated.
6.2. Models’ Performance on Segmented CT Images
All the training and validation process was conducted for 100 epochs, and the learning rate was set at 0.0004 with an Adam optimiser. Figure 10 shows the training and validation accuracy of the DL models without MI on the segmented training and validation datasets, respectively. As presented by the dots on the curved lines in Figure 10a, the best training accuracy results for the VGG16 was obtained on the 29th epoch, while that for ResNet50 was obtained on the 70th epoch, and that for Custom CNN was obtained on the 76th epoch. For the validation accuracy depicted in Figure 10b, the best epoch was obtained for Custom CNN, ResNet50 and VGG16 on the 76th, 79th, and 28th runs, respectively. In Figure 11a, the Custom CNN + MI, ResNet50 + MI, and VGG16 + MI obtained the best training accuracy on the 43rd, 100th, and 93rd epochs, respectively. For the validation accuracy, the best epoch was obtained for Custom CNN + MI, ResNet50 + MI, and VGG16 + MI on the 23rd, 94th, and 37th runs, respectively.
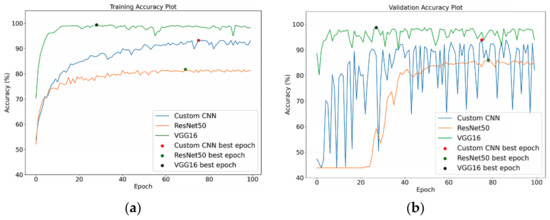
Figure 10.
(a) Training and (b) validation accuracy for DL models without MI on segmented images.
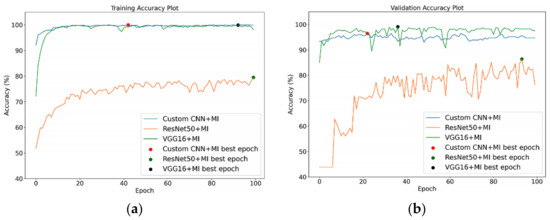
Figure 11.
(a) Training and (b) validation accuracy for DL models with MI on segmented images.
After the training phases, the DL models were tested on the segmented CT images in the testing dataset. Based on the generated confusion matrices and the ROCs, the sensitivity, specificity, and accuracy performance of the DL models with and without MI on the segmented CT images were calculated and recorded (Table 3). Then, these results were compared to the findings in Table 2. As shown in Table 3, most of the models with segmentation on the input images performed worse compared to those without segmentation. For example, Custom CNN yielded a sensitivity value of 90% on the unsegmented images and 80% on the segmented images, thereby showing a 10% decrease in sensitivity due to segmentation on the input images.
Table 3.
Performance of DL models with and without MI on the testing dataset (segmented vs. unsegmented).
There was a 12% decrease in specificity by Custom CNN + MI with image segmentation compared to the Custom CNN + MI without the image segmentation. Additionally, with image segmentation, both VGG16 and VGG16 + MI showed a 5% decrease in accuracy when compared to that without image segmentation. However, ResNet50 with image segmentation showed significant improvement in specificity and accuracy, with 82% and 79%, respectively. ResNet50 + MI also showed better results on the segmented images with 76% sensitivity, 79% specificity, and 77.5% accuracy.
Given the overall performance of the models on the segmented images, it can be concluded that segmentation on the input CT images would decline the performance of the COVID-19 classification. This might be due to the poor segmentation of lung images, which resulted in improper segmentation of some critical lung regions. The improperly segmented region is adherent to the inner lung or lung wall and resulted in the loss of essential features during model training, thus leading to the lower recognition ability of the models.
6.3. Models’ Performance Report with Confidence Intervals
A confidence interval (CI) is an interval statistic used to quantify the uncertainty on an estimate. CI is commonly employed to contain an unknown characteristic of the population or process [43]. The quantity of interest might be a population property or parameter, such as the mean or standard deviation of the population or process [43]. In applied machine learning, CI can be used in presenting the skill of a classification model, in particular, the models’ accuracy. Each prediction is a binary decision that could be correct or incorrect. Technically, this is called a Bernoulli trial [44]. The proportions in a Bernoulli trial have a specific distribution called a binomial distribution. In statistics, a succession of independent events that either succeed or fail is called a Bernoulli process [45]. For large , where is the size of the testing dataset, the distribution of this random variable approaches the normal distribution [45]. Hence, with large sample sizes (e.g., more than 30 samples), this distribution can be approximated using the Gaussian. In other words, the CI can be calculated based on the assumption of a Gaussian distribution of the proportion. For example, if is the accuracy rate while classifying some data of size , a CI with a 95% confidence level for accuracy of the classification model can be computed as follows:
where 1.96 is the constant value corresponding to the 95% confidence level. In this study, this formula is also applied to calculate the CI for sensitivity and precision. Hence, the generalized equation for CI is:
where is a constant value corresponding to a given confidence level, is the size of the testing dataset, can be , , and , which refer to the performance metrics accuracy, sensitivity, and specificity, respectively. In this paper, the value of is set to 1.96.
Simply reporting the classification model’s sensitivity, specificity, and accuracy is insufficient, because the results may vary when the model is evaluated on different samples. Hence, CI is needed to represent the possible range around the estimated performance metrics so that practitioners would be able to understand how good or bad the model would be. CI also represent the stability of the estimation. A stable estimate is one that would be close to the same value if the experiments were repeated. An unstable estimation is one that would significantly vary from one sample to another. A wider CI in relation to the estimate itself indicates instability. On the other hand, narrow CI in relation to the point of estimate tells us that the estimated value is relatively stable and that repeated experiments would give approximately the same results.
Table 4 and Table 5 present the calculated confidence intervals for the models’ performance on unsegmented and segmented testing datasets, respectively. In Table 5, for the sensitivity metric, Custom CNN and VGG16 + MI have the narrowest CI (4.16%). This suggests that the true sensitivity values are likely between 85.84% and 94.16%. For the accuracy metric, the smallest range of CI lower and upper boundaries was on VGG16 + MI, where the reported accuracy of the model was 93.0 ± 3.54% at a 95% confidence level. In addition, when compared to other models, the VGG16 model has the highest specificity rate as well as the smallest CI lower and upper bounds range (2.36%). When tested on segmented images, there is a 95% chance that the ranges [81.19, 90.81] and [83.5, 92.5] correspond to the true model’s sensitivity and accuracy of the VGG16 + MI (refer to Table 5).
Table 4.
Confidence intervals for the models’ performance on unsegmented testing dataset.
Table 5.
Confidence intervals for the models’ performance on segmented testing dataset.
6.4. Gradient-Weight Class Activation Mapping (Grad-CAM)
To increase the transparency of the proposed method, Grad-CAM is used to visualise the regions of the CT images that are essential for prediction by the best model (VGG16). The Grad-CAM used class-specific gradient information flowing into the last convolutional layer to generate a localisation map of the essential regions in an image [24]. In this paper, Grad-CAM is applied to the final convolutional layer after the predicted class has been determined using the proposed VGG16 model. Figure 12 shows several examples of Grad-CAM visualisation on the COVID-19 CT images. As shown in Figure 12, the heatmap on each image shows the potentially infected region for COVID-19. The heatmap is standard jet colourmaps and is overlapped on the original image where the red colour highlights the activation region associated with the predicted class (in this case, COVID-19 positive). In addition, the heatmap in Figure 12 indicates the COVID-19 features learned by the proposed VGG16 model.
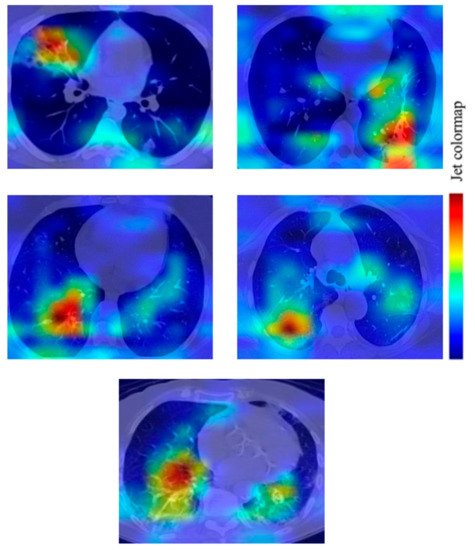
Figure 12.
Grad-CAM visualization of the infected region on COVID-19 CT images based on a prediction by the VGG16 model.
6.5. Comparison with Other Works
Table 6 compares this paper’s proposed VGG16 + MI model to the recently published literature on DL approaches applied for COVID-19 detection. All the models reported in Table 6 uses the SARS-CoV-2 dataset for their experiments. Based on the findings, VGG16 + MI gives a higher accuracy value than VGG19 + DenseNet169 [46], COVID-Net [47], and DenseNet121 [48]. Furthermore, VGG16 + MI also has a higher sensitivity rate than the COVID-Net model by Wang et al. [47]. Although the model by Hasan et al. [48] has a higher sensitivity rate than the proposed model, DenseNet121 [48] has a more complex architecture than VGG16 + MI, since DenseNet121 consists of a total of 58 convolutional layers, whereas VGG16 + MI consists of only 16 convolutional layers. If lower complexity holds higher priority, then the VGG16 + MI is preferable when compared to DenseNet121, given that there is only a 2% difference in the sensitivity rate. However, the proposed model has a lower accuracy value when compared to VGG19 + Grad-CAM [24]. In contrast to our approach, Panwar et al. performed data augmentation on their training dataset [24].
Table 6.
Summary of deep learning-based COVID-19 diagnosis approaches using the SARS-CoV-2 dataset in recent studies compared to our VGG16 + MI model.
7. Conclusions
In this paper, a novel moment invariant based on a neural network algorithm for COVID-19 diagnosis was introduced by incorporating the MI method in the feature extraction of CT scans. First, the Hu invariant moment function from OpenCV was used to extract the MI-based features from the CT images, and three DL models (Custom CNN, ResNet50, and VGG16) were re-structured to extract the DL-based features from the images. Then, the two features are concatenated using the cascade fusion method. Finally, the fused features are fed into the FC layers for the classification process. Based on the experiments conducted on the SARS-CoV-2 dataset, it was found that fusion of MI features with DL features has the potential to improve the sensitivity and accuracy of the COVID-19 classification, but with only a small increment. However, the computational time required to extract and concatenate both DL and moment invariant features is significantly longer than the time required to extract only DL features. Nevertheless, if accuracy holds higher priority, then the use of the fused features is the better choice. Additionally, it was discovered that an improper segmentation of CT images could result in a reduction of the model’s classification and recognition ability.
8. Future Works
The future work includes expanding the size of the dataset and testing the proposed method on a larger and more heterogeneous dataset. Furthermore, a cross-dataset will also be considered where the model is trained and tested on different datasets or a combination of the datasets. Additionally, as inspired by [49], the binary classification in this work could be further improved to multi-class classification, which classified the COVID-19 CT images according to the levels of the infection’s severity. Given the increasing number of active cases nowadays, patients with more severe infections were given priority for treatment at the hospitals and quarantine centres. Although the present study could expedite the screening process, further examination on the severity of the infection should be done to decide whether or not the COVID-19 positive patients should be given intensive therapy.
Author Contributions
Conceptualisation, C.J.H., M.M.S., J.A.D. and S.O.; Data curation, C.J.H.; Formal analysis, C.J.H. and M.M.S.; Funding acquisition, E.G.M.; Investigation, E.G.M., C.J.H. and M.M.S.; Methodology, E.G.M., C.J.H., M.M.S., J.A.D. and S.O.; Project administration, E.G.M. and M.M.S.; Resources, E.G.M.; Supervision, E.G.M. and M.H.A.H. All authors have read and agreed to the published version of the manuscript.
Funding
This research was funded by the Research Management Center (RMC), Universiti Malaysia Sabah, under grant number SDK0283-2020. The APC was funded by the Research Management Center (RMC), University Malaysia Sabah.
Institutional Review Board Statement
Not applicable.
Informed Consent Statement
Not applicable.
Data Availability Statement
The SARS-CoV-2 dataset used in our study can be accessed via the Kaggle website at the following link: https://www.kaggle.com/plameneduardo/sarscov2-ctscan-dataset.
Acknowledgments
The authors are pleased to thank the individuals who contributed to this study.
Conflicts of Interest
The authors declare no conflict of interest.
References
- Wu, F.; Zhao, S.; Yu, B.; Chen, Y.-M.; Wang, W.; Song, Z.-G.; Hu, Y.; Tao, Z.-W.; Tian, J.-H.; Pei, Y.-Y.; et al. A new coronavirus associated with human respiratory disease in China. Nature 2020, 579, 265–269. [Google Scholar] [CrossRef] [PubMed] [Green Version]
- Guan, W.-J.; Ni, Z.-Y.; Hu, Y.; Liang, W.-H.; Ou, C.-Q.; He, J.-X.; Liu, L.; Shan, H.; Lei, C.-L.; Hui, D.S.C.; et al. China Medical Treatment Expert Group for COVID-19. Clinical Characteristics of Coronavirus Disease 2019 in China. N. Engl. J. Med. 2020, 382, 1708–1720. [Google Scholar] [CrossRef] [PubMed]
- Xie, X.; Zhong, Z.; Zhao, W.; Zheng, C.; Wang, F.; Liu, J. Chest CT for Typical Coronavirus Disease 2019 (COVID-19) Pneumonia: Relationship to Negative RT-PCR Testing. Radiology 2020, 296, E41–E45. [Google Scholar] [CrossRef] [PubMed] [Green Version]
- Huang, C.; Wang, Y.; Li, X.; Ren, L.; Zhao, J.; Hu, Y.; Zhang, L.; Fan, G.; Xu, J.; Gu, X.; et al. Clinical features of patients infected with 2019 novel coronavirus in Wuhan, China. Lancet 2020, 395, 497–506. [Google Scholar] [CrossRef] [Green Version]
- Fiala, M.J. Ultrasound in COVID-19: A time of ultrasound findings in relation to CT. Elsevier Public Health Emerg. Collect. 2020, 75, 553–554. [Google Scholar] [CrossRef]
- Adebowale, M.A.; Lwin, K.T.; Hossain, M.A. Intelligent phishing detection scheme using deep learning algorithms. J. Enterp. Inf. Manag. 2020. [Google Scholar] [CrossRef]
- Yahya, F. Machine Learning in Dam Water Research: An Overview of Applications and Approaches. Int. J. Adv. Trends Comput. Sci. Eng. 2020, 9, 1268–1274. [Google Scholar] [CrossRef]
- Moung, E.G. Face Recognition State-of-the-art, Enablers, Challenges and Solutions: A Review. Int. J. Adv. Trends Comput. Sci. Eng. 2020, 9, 96–105. [Google Scholar] [CrossRef]
- Dargham, J.A.; Chekima, A.; Moung, E.G.; Omatu, S. The Effect of Training Data Selection on Face Recognition in Surveillance Application. Adv. Intell. Syst. Comput. 2015, 373, 227–234. [Google Scholar] [CrossRef]
- Razali, M.N.; Moung, E.G.; Yahya, F.; Hou, C.J.; Hanapi, R.; Mohamed, R.; Hashem, I.A.T. Indigenous Food Recognition Model Based on Various Convolutional Neural Network Architectures for Gastronomic Tourism Business Analytics. Information 2021, 12, 322. [Google Scholar] [CrossRef]
- Jaiswal, A.; Gianchandani, N.; Singh, D.; Kumar, V.; Kaur, M. Classification of the COVID-19 infected patients using DenseNet201 based deep transfer learning. J. Biomol. Struct. Dyn. 2021, 39, 5682–5689. [Google Scholar] [CrossRef]
- Yu, Z.; Li, X.; Sun, H.; Wang, J.; Zhao, T.; Chen, H.; Ma, Y.; Zhu, S.; Xie, Z. Rapid identification of COVID-19 severity in CT scans through classification of deep features. Biomed. Eng. Online 2020, 19, 63. [Google Scholar] [CrossRef]
- Butt, C.; Gill, J.; Chun, D.; Babu, B.A. RETRACTED ARTICLE: Deep learning system to screen coronavirus disease 2019 pneumonia. Appl. Intell. 2020. [Google Scholar] [CrossRef]
- Ardakani, A.A.; Kanafi, A.R.; Acharya, U.R.; Khadem, N.; Mohammadi, A. Application of deep learning technique to manage COVID-19 in routine clinical practice using CT images: Results of 10 convolutional neural networks. Comput. Biol. Med. 2020, 121, 103795. [Google Scholar] [CrossRef]
- Yang, Y.; Newsam, S. Comparing SIFT descriptors and gabor texture features for classification of remote sensed imagery. In Proceedings of the 2008 15th IEEE International Conference on Image Processing, San Diego, CA, USA, 12–15 October 2008; pp. 1852–1855. [Google Scholar]
- Elaziz, M.A.; Hosny, K.M.; Selim, I.M. Galaxies image classification using artificial bee colony based on orthogonal Gegenbauer moments. Soft Comput. 2018, 23, 9573–9583. [Google Scholar] [CrossRef]
- Suykens, J.A.K.; Vandewalle, J. Least Squares Support Vector Machine Classifiers. Neural Process. Lett. 1999, 9, 293–300. [Google Scholar] [CrossRef]
- Simonyan, K.; Zisserman, A. Very deep convolutional networks for large-scale image recognition. arXiv 2014, arXiv:1409.1556. [Google Scholar]
- Hosny, K.M.; Hamza, H.M.; Lashin, N.A. Copy-for-duplication forgery detection in colour images using QPCETMs and sub-image approach. IET Image Process. 2019, 13, 1437–1446. [Google Scholar] [CrossRef]
- Eltoukhy, M.M.; Elhoseny, M.; Hosny, K.; Singh, A.K. Computer aided detection of mammographic mass using exact Gaussian–Hermite moments. J. Ambient. Intell. Humaniz. Comput. 2018. [Google Scholar] [CrossRef]
- Hosny, K.; Elaziz, M.; Selim, I.; Darwish, M. Classification of galaxy color images using quaternion polar complex exponential transform and binary Stochastic Fractal Search. Astron. Comput. 2020, 31, 100383. [Google Scholar] [CrossRef]
- Antun, V.; Renna, F.; Poon, C.; Adcock, B.; Hansen, A.C. On instabilities of deep learning in image reconstruction and the potential costs of AI. Proc. Natl. Acad. Sci. USA 2020, 117, 30088–30095. [Google Scholar] [CrossRef] [PubMed]
- Mohammed, Y.K. A deep learning framework to detect COVID-19 disease via chest X-ray and CT scan images. Int. J. Electr. Comput. Eng. 2020, 11, 844–850. [Google Scholar]
- Panwar, H.; Gupta, P.; Siddiqui, M.K.; Morales-Menendez, R.; Bhardwaj, P.; Singh, V. A deep learning and grad-CAM based color visualization approach for fast detection of COVID-19 cases using chest X-ray and CT-Scan images. Chaos Solitons Fractals 2020, 140, 110190. [Google Scholar] [CrossRef]
- Xiao, L.-S.; Li, P.; Sun, F.; Zhang, Y.; Xu, C.; Zhu, H.; Cai, F.-Q.; He, Y.-L.; Zhang, W.-F.; Ma, S.-C.; et al. Development and Validation of a Deep Learning-Based Model Using Computed Tomography Imaging for Predicting Disease Severity of Coronavirus Disease 2019. Front. Bioeng. Biotechnol. 2020, 8, 898. [Google Scholar] [CrossRef] [PubMed]
- Ahuja, S.; Panigrahi, B.K.; Dey, N.; Rajinikanth, V.; Gandhi, T.K. Deep transfer learning-based automated detection of COVID-19 from lung CT scan slices. Appl. Intell. 2021, 51, 571–585. [Google Scholar] [CrossRef] [PubMed]
- Belkasim, S.; Shridhar, M.; Ahmadi, M. Pattern recognition with moment invariants: A comparative study and new results. Pattern Recognit. 1991, 24, 1117–1138. [Google Scholar] [CrossRef]
- Ruggeri, A.; Pajaro, S. Automatic recognition of cell layers in corneal confocal microscopy images. Comput. Methods Programs Biomed. 2002, 68, 25–35. [Google Scholar] [CrossRef]
- Wang, J.-L.; Wang, B.-H. An invariant approach for image registration in digital subtraction angiography. Zhongguo Yi Liao Qi Xie Za Zhi Chin. J. Med. Instrum. 2006, 30, 15. [Google Scholar]
- Hung, C.-M.; Huang, Y.-M.; Chang, M.-S. Alignment using genetic programming with causal trees for identification of protein functions. Nonlinear Anal. Theory, Methods Appl. 2005, 65, 1070–1093. [Google Scholar] [CrossRef]
- Mangin, J.-F.; Poupon, F.; Duchesnay, E.; Riviere, D.; Cachia, A.; Collins, D.L. rain morphometry using 3D moment invariants. Med. Image Anal. 2004, 8, 187–196. [Google Scholar] [CrossRef]
- Deng, J.; Dong, W.; Socher, R.; Li, L.J.; Li, K.; Li, F.F. Imagenet: A Large-Scale Hierarchical Image Database. In Proceedings of the 2009 IEEE Conference on Computer Vision and Pattern Recognition, Miami, FL, USA, 20–25 June 2009; pp. 248–255. [Google Scholar]
- Perumal, V.; Theivanithy, K. A Transfer Learning Model for COVID-19 Detection with Computed Tomography and Sonogram Images. In Proceedings of the 2021 Sixth International Conference on Wireless Communications, Signal Processing and Networking (WiSPNET), Chennai, India, 25–27 March 2021; pp. 80–83. [Google Scholar]
- Mahesh, V.G.V.; Raj, A.N.J.; Fan, Z. Invariant moments based convolutional neural networks for image analysis. Int. J. Comput. Intell. Syst. 2017, 10, 936. [Google Scholar] [CrossRef] [Green Version]
- Li, D. Analysis of Moment Invariants on Image Scaling and Rotation. Innov. Comput. Sci. Softw. Eng. 2010, 415–419. [Google Scholar] [CrossRef]
- Hu, M.-K. Visual pattern recognition by moment invariants. IEEE Trans. Inf. Theory 1962, 8, 179–187. [Google Scholar] [CrossRef] [Green Version]
- Ren, Y.; Yang, J.; Zhang, Q.; Guo, Z. Ship recognition based on Hu invariant moments and convolutional neural network for video surveillance. Multimedia Tools Appl. 2021, 80, 1343–1373. [Google Scholar] [CrossRef]
- Soares, E.; Angelov, P.; Biaso, S.; Froes, M.H.; Abe, K. SARS-CoV-2 CT-scan dataset: A large dataset of real patients CT scans for SARS-CoV-2 identification. MedRxiv 2020. [Google Scholar] [CrossRef]
- Uçar, M.K.; Nour, M.; Sindi, H.; Polat, K. The Effect of Training and Testing Process on Machine Learning in Biomedical Datasets. Math. Probl. Eng. 2020, 2020, 2836236. [Google Scholar] [CrossRef]
- Afify, H.M.; Darwish, A.; Mohammed, K.K.; Hassanien, A.E. Ingénierie des Systèmes d’ Information an Automated CAD System of CT Chest Images for COVID-19 Based on Genetic Algorithm and K-Nearest Neighbor Classifier. Ingénierie Systèmes Inf. 2020, 25, 589–594. [Google Scholar] [CrossRef]
- Sun, S.; Zhang, R. Region of Interest Extraction of Medical Image based on Improved Region Growing Algorithm. In Proceedings of the 2017 International Conference on Material Science, Energy and Environmental Engineering (MSEEE 2017), Xi’an, China, 26–27 August 2017. [Google Scholar]
- Satapathy, S.C.; Hemanth, D.J.; Kadry, S.; Manogaran, G.; Hannon, N. Segmentation and Evaluation of COVID-19 Lesion from CT scan Slices—A Study with Kapur/Otsu Function and Cuckoo Search Algorithm. Res. Sq. 2020. [Google Scholar] [CrossRef]
- Meeker, W.Q.; Hahn, G.J.; Escobar, L.A. Statistical Intervals: A Guide for Practitioners and Researchers, Second; John Wiley&Sons, Inc.: Hoboken, NJ, USA, 2017. [Google Scholar]
- Papoulis, A. Probability, Random Variables, and Stochastic Processes, 2nd ed.; McGraw-Hill: New York, NY, USA, 1984. [Google Scholar]
- Witten, I.H.; Frank, E.; Hall, M.A. Data Mining: Practical Machine Learning Tools and Techniques, 3rd ed.; Elsevier Morgan Kaufmann: San Francisco, CA, USA, 2011. [Google Scholar] [CrossRef] [Green Version]
- Jangam, E.; Barreto, A.A.D.; Annavarapu, C.S.R. Automatic detection of COVID-19 from chest CT scan and chest X-Rays images using deep learning, transfer learning and stacking. Appl. Intell. 2021, 1–17. [Google Scholar] [CrossRef]
- Wang, Z.; Liu, Q.; Dou, Q. Contrastive Cross-Site Learning with Redesigned Net for COVID-19 CT Classification. IEEE J. Biomed. Health Inform. 2020, 24, 2806–2813. [Google Scholar] [CrossRef]
- Hasan, N.; Bao, Y.; Shawon, A.; Huang, Y. DenseNet Convolutional Neural Networks Application for Predicting COVID-19 Using CT Image. SN Comput. Sci. 2021, 2, 389. [Google Scholar] [CrossRef] [PubMed]
- Li, C.; Dong, D.; Li, L.; Gong, W.; Li, X.; Bai, Y.; Wang, M.; Hu, Z.; Zha, Y.; Tian, J. Classification of Severe and Critical COVID-19 Using Deep Learning and Radiomics. IEEE J. Biomed. Health Inform. 2020, 24, 3585–3594. [Google Scholar] [CrossRef] [PubMed]
Publisher’s Note: MDPI stays neutral with regard to jurisdictional claims in published maps and institutional affiliations. |
© 2021 by the authors. Licensee MDPI, Basel, Switzerland. This article is an open access article distributed under the terms and conditions of the Creative Commons Attribution (CC BY) license (https://creativecommons.org/licenses/by/4.0/).