Abstract
Nowadays, due to the extensive use of information networks in a broad range of fields, e.g., bio-informatics, sociology, digital marketing, computer science, etc., graph theory applications have attracted significant scientific interest. Due to its apparent abstraction, community detection has become one of the most thoroughly studied graph partitioning problems. However, the existing algorithms principally propose iterative solutions of high polynomial order that repetitively require exhaustive analysis. These methods can undoubtedly be considered resource-wise overdemanding, unscalable, and inapplicable in big data graphs, such as today’s social networks. In this article, a novel, near-linear, and highly scalable community prediction methodology is introduced. Specifically, using a distributed, stacking-based model, which is built on plain network topology characteristics of bootstrap sampled subgraphs, the underlined community hierarchy of any given social network is efficiently extracted in spite of its size and density. The effectiveness of the proposed methodology has diligently been examined on numerous real-life social networks and proven superior to various similar approaches in terms of performance, stability, and accuracy.
1. Introduction
In consideration of the exponential proliferation of data along with the substantial demand to conveniently incorporate the internal inference and semantics, information networks have evidently been one of the most prevalent data representations. Particularly, by presenting each individual data entity as a node and by denoting any kind of association with an interconnection edge, information graphs may formulate any functional system of interacting entities. Therefore, the usage of this general-purpose abstraction has practically proven beneficial in various scientific sectors such as chemistry, biology, politics, digital marketing, computer science and sociology.
Focusing on social media, information networks can be deemed as the predominant data structure due to their handily compact representation. From sentiment analysis, expert identification and mood analysis, to recommendation systems, digital footprint identification and targeted marketing, graph theory lies under numerous social network issues. Among others, community detection might be considered as one of the graph theory keystones since its outcome is fundamentally critical in various cases, such as influence propagation, link prediction, and opinion mining.
The main objective of community detection regards the identification of strongly interconnected groups of nodes, aka communities, by primarily leveraging the network topology features [,,]. In respect of sociology, community detection could be construed as the expression of the homophily effect on a given social network [,]. Essentially, community reflects the natural human tendency to mostly associate and interact with similar peers. Thus, any social network can be naturally decomposed to groups of highly interacting entities, the communities, which plainly disclose the given social graph’s inner mechanics.
As meticulously presented in [,,,], copious algorithms have been published to tackle this NP-hard problem. From graph theory methods to hybrid approaches, which ably combine network analysis with techniques of different scientific areas, the diversity of the existing bibliography is indeed remarkable. The most prominent community detection methods include, inter alia, the Louvain [], the Girvan–Newman [], the Clauset–Newman–Moore [], the label propagation (LAP) [], and the spectral clustering [] algorithms.
Despite the difference in the divide and conquer strategy applied, the classic community detection algorithms basically define iterative optimization processes that require exhaustive analysis. Therefore, as plainly explained in [], with their corresponding computational complexity being at least quadratic, the application of classic community detection algorithms is strictly limited to small graphs. In addition, as clearly demonstrated in [,,], those solutions are principally static methods that neglect the social networks’ inherent topology heterogeneities which are responsible for the significantly variant community structure. Hence, taking into account the size of real-life social graphs, which typically outnumber a billion users [], and their extremely imbalanced subjacent community hierarchy, the introduction of new, profoundly scalable and highly accurate alternatives is indubitably mandatory.
Inspired by the unconventional application of link prediction in the community extraction process in [], the initial node-oriented definition can be alternatively translated to its equivalent edge-oriented explanation. Specifically, community detection can be differently expressed as the classification of the imminent graph’s edges to either the ones associating nodes of different communities, aka inter-connection edges, or of the same, aka intra-connection edges, solely based on network topology characteristics. This is actually the principal scope of community prediction which promising perspectives were clearly demonstrated in [,].
Originally, Makris, Pettas and Pispirigos [] introduced a distributed, binary logistic regression model is trained using a representative subgraph that is suitably extracted using the Tiny Sample Extraction algorithm. Despite its promising prediction performance, the strict prerequisite of extracting a subgraph of indispensably similar network characteristics to the original graph, seems insurmountable for today’s big data graphs. This obstacle is deftly circumvented with the sampling process introduced in the bagging ensemble community prediction methodology proposed in []. Specifically, by concurrently applying plain BFS crawlers, multiple subgraphs are extracted. After properly transforming them to training data sets, the base classifiers of a bagging ensemble model are trained. This plain sampling technique was practically proven advantageous in capturing a considerable amount of the original graph’s variability. However, due to this methodology’s [] significant tendency to misclassify the true inter-connection edges, reflected on the classifier’s poor precision and increased bias, the extracted community structure is not sufficiently discernible.
In this article, aiming to diminish the bias while ensuring the minimum variance and the maximum stability, a novel, near-linear, and highly scalable stacking-based community prediction methodology is introduced. Specifically, on the model of bootstrap resampling, multiple BFS crawlers are concurrently applied on a given social graph, extracting multiple subgraphs. For each extracted subgraph, any edge included is appropriately enriched with a predefined set of network topology features and suitably labeled after the Louvain algorithm’s [] application. Hence, the previously extracted subgraphs are properly transformed to community detection-ready data sets that used in training a distributed stacking ensemble meta-learner. This meta-learner is built on top of properly fitted bagging and boosting distributed ensemble models, which combination guarantees the minimization of the generated bias/variance effect. Thorough experimentation has been conducted on various real-life social graphs [,,,,,,] which conclusively demonstrated that the proposed methodology is remarkably stable, eminently accurate and highly efficient in predicting the subjacent community structure of any analyzed social media network.
The remainder of this article is organized as follows:
- Section 2 presents the existing bibliography regarding community detection and community prediction.
- Section 3 analyzes the proposed methodology and explains its implementation.
- Section 4 describes the conducted experimentation process and assesses the generated results.
- Section 5 outlines the conclusions and sets the future steps.
2. Background
2.1. Community Detection Definitions & Classic Algorithms
Community detection is the network analysis problem that aims to identify the naturally formed, groups of vertices that are more interlinked with each other, comparing to the rest of the graph [,,]. Despite the lack of a broadly accepted definition [], a community can be intuitively perceived considering its graph representation. In particular, a group of vertices might be deemed as a community, if only the ratio of its internal edges, aka intra-cluster density, is higher than the ratio of its external edges, aka inter-cluster density. Consequently, assuming a group of nodes C, its intra-cluster density, denoted as dint(C), can be calculated as follows:
where:
- mint is the number of the intra-connection edges of the group C,
- n is the number of nodes within the group C, and
- ½ ∗ n ∗ (n − 1) is the number of all possible internal edges of the group C.
Respectively, its inter-cluster density, denoted as dext(C), is calculated as:
where:
- mext is the number of the inter-connection edges of the group C,
- n is the number of nodes within the group C,
- N is the number of nodes of the given information network, and
- n ∗ (N − n) is the number of all possible internal edges of the group C.
Thus, the following equation is satisfied, should the group of nodes C forms a community:
Due to community detection’s broad application in numerous scientific fields, such as biology, sociology, criminology, politics, marketing, computer science, etc., this NP-hard problem [,,] has been thoroughly studied. Copious research has already been published that can be roughly distinguished to graph partitioning, modularity optimization, label propagation and transformation algorithms.
Based on the principle that an information network’s underlying community hierarchy is practically the sparsely inter-connected groups of highly intra-connected vertices [] and by initially considering the whole graph as a single community, the purpose of the graph partitioning algorithms is to remove the inter-connection edges by iteratively optimizing a global network topology measure. These algorithms are specialized in the community extraction of information networks which nodes follow the power-law distribution, aka scale-free information networks [].Even if there are profuse network topology measures proposed, such as the shortest-path betweenness [], the random-walk edge betweenness [], the geodesic edge betweenness [], the current-flow edge betweenness [], the hypergraphs [], etc., the most prominent is the edge centrality measure introduced in the Girvan–Newman algorithm []. This measure quantifies the importance of each edge by calculating the distinct shortest paths between any possible pair of nodes that run along it. As proven in [,], Girvan–Newman algorithm’s time complexity is O(nm2), where n and m denote the information network’s number of nodes and edges respectively. Hence, despite its plain conception and its straightforward implementation, its application is merely limited to information networks of few hundreds of vertices.
A worth mentioning sub-category of graph partitioning algorithms is the data structure-based methods []. Following the top-down strategy previously described, the principal objective of those approaches is to properly transform the given information graph to a highly efficient tree-like data structure. Thus, after initially considering the whole graph a community, presented as the generated data structure’s root node, the leaves of the constructed tree practically reflect the given graph’s underlying community hierarchy. The most indicative algorithms, among others, are the Overlapping Community algorithm (OCA) [] and the GSkeletonClu method [] that are intrinsically parallelizable to minimize the time required for community detection. However, as plainly explained [], the data structure-based methods are inherently not suitable for networks displaying major inhomogeneities that is the case of today’s social graphs.
Similar to the graph partitioning methods, the modularity optimization algorithms aim to extract the underlying community hierarchy by respectively defining iterative optimization processes. However, these approaches principally follow bottom-up strategies that form meta-communities by globally maximizing modularity [,,,]. Modularity is the most prevalent quality function that holistically combines the intra-cluster and the inter-cluster densities to assess the coherence of a given group of vertices. Among the plentiful modularity optimization techniques proposed, such as the simulated annealing [], the Clauset–Newman–Moore [], the Wakita–Tsurumi [], the Xiang [] etc., the Louvain algorithm [] is unquestionably the predominant. By initially considering each node as a distinct community, aka singleton, and by repetitively merging the communities that maximize modularity, this algorithm displays outstanding execution performance and serves as a generally accepted community detection standard. As defined in [], the modularity optimization algorithms are considered ideal for detecting the subjacent community structure of information networks which nodes follow the normal distribution. Actually, this is the case of big data graphs according to the central limit theorem. However, as convincingly proven in [,,,], modularity optimization is an NP-complete problem, limiting thusly the imminent algorithms‘ application to networks of some thousands of vertices.
In line with the premise that each node is more likely to belong to the community that most of its direct neighbors belong, the label propagation algorithms are typical iterative processes that extract the imminent community hierarchy by repetitively assessing and re-assigning, where needed, the appropriate community label to each individual node. From the initial label propagation algorithm (LPA) [] to more sophisticated methods, such as the community overlap propagation algorithm (CORPA) [], the multi-label propagation algorithm (MLPA) [], the parallel structural clustering algorithm [] etc., these methods principally aim to extract overlapping communities. Despite their promising computational complexity, the label propagation algorithms intrinsically tend to overrate the graph’s average qualities. Hence, as shown in [], their extracted hierarchy’s quality characteristics are relatively poor, since the generated community structure is unrelated to the distinct partitions’ properties.
Finally, the convenient generalization of community detection and its vast adoption from various fields led to the introduction of transformation algorithms. These methods are radically different to the classic, network-oriented approaches. In particular, they alternatively project the community detection concept to different representations to simplify its intrinsic complexity and leverage different, widely applied methods and theories. From the spectral methods based on linear algebra techniques [,] and the Markov chains theory of random walks algorithm [], to the divisive global clustering algorithm influenced by the electrical circuit analysis [] and the genetic algorithms alternatives [,], the variety of transformation algorithms is doubtlessly notable. However, every such proposed projection can equivalently be translated to heavy computational demands. Consequently, with their time complexity being typically of cubic order, the transformation algorithms are practically inapplicable in big data graphs, for which polynomial solutions are prohibitive [].
2.2. Community Prediction
The binary classification of a graph’s edges to either intra-connection or inter-connection in order to predict its underlying community structure by solely leveraging their network topology characteristics, is the community prediction’s accurate definition. In essence, this concept can be briefly construed as the process of properly training a binary classifier to imitate the behavior of a community detection algorithm using plain network topology features.
To some extent, the community prediction concept was introduced in []. Here, Takaffoli et al. presented a community structure evolution framework that aimed to predict the existence probability of each possible edge and consequently the later community structure of a given graph. Specifically, given the input graph’s original community structure and assuming the occurrence of a specific event, the aforementioned classification is properly made for each possible edge by considering the history statistics, the influential members qualities and the network topology properties of each existing community. Albeit the common objective to predict the subjacent community hierarchy, this approach [] principally intents to predict the underlying structure’s evolution using fundamentally dissimilar prediction criteria.
In [], the initial community prediction methodology is introduced. In detail, after applying the tiny sample extraction algorithm on the input social network, a representative subgraph of similar network topology qualities to the input graph, is extracted. This subgraph is properly transformed to a community prediction-ready training data set by enriching each imminent edge, not only with a predefined set of network topology features regarding the corresponding k-depth neighborhoods, but also with the suitable inter-connection/intra-connection label after the application of the Louvain algorithm []. Consequently, a distributed binary logistic regression classifier is appropriately trained using the conveniently converted representative subgraph. This community prediction classifier [] is consequently applied to the input graph to properly classify all its impending edges. After removing all the intra-connection edges, the subjacent community hierarchy of the input graph is revealed.
Despite the fact that this community extraction technique [] has proven notably promising, the rigid requirement to extract a subgraph of analogous topological qualities with the original, is evidently an insuperable limitation for today’s social networks. Firstly, the representativity’s insurance is mainly inclined to the extraction of a subgraph of similar size to the initial graph, as demonstrated in []. Furthermore, the Tiny Sample Extraction algorithm inherently requires severe statistical analysis by demanding the calculation of the input graph’s node degree probability density function, which might not be feasible in general for big data graphs. Finally, and importantly, the predicted community structure tends to be fairly unstable due to the considerably high variance of the corresponding community prediction classifier.
In [] an alternative community prediction methodology is introduced. After applying multiple BFS crawlers on the input social graph, multiple subgraphs are extracted. Similar to the subgraph transformation process presented in [], each of the previously extracted subgraphs is properly converted to a community prediction-ready training data set. Thus, after training a distributed, binary logistic regression classifier for each suitably transformed subgraph, a bagging ensemble meta-learner is constructed. This meta-learner is applied to the input graph, to properly classify each imminent edge as either inter-connection or intra-connection by averaging the decisions made from the individual logistic regression base learners. Thereupon, the input graph’s community structure can be disclosed after removing the inter-connection predicted edges.
The bootstrap resampling technique presented in [] has practically proven capable of capturing a considerable amount of the input graph’s network topology variability. Hence, due to its intrinsic simplicity, this distributed community prediction methodology [] has demonstrated increased robustness and decreased variance comparing to the []. However, this bagging ensemble meta-learner, as clearly reflected in its consistently poor sensitivity performance, was highly biased and subsequently tended to underfit the training data. This precarious behavior led to the systematic misprediction of the truly inter-connection edges as intra-connection that resulted in the extraction of significantly undiscernible community structures. Ergo, the bagging ensemble meta-learner of [] can unquestionably be considered insufficient for community prediction.
Therefore, the essential demand to enhance the quality of the predicted community structure by minimizing the bias/variance effect, while preserving the outstanding performance benefits of the distributed execution, is doubtlessly satisfied by the highly efficient, intrinsically distributed, stacking-based community prediction methodology proposed in this manuscript.
3. Proposed Methodology
In this article, a near-linear and fully distributed stacking-based community prediction methodology for large scale social networks is introduced. The principal objective of the proposed technique is the optimization of the extracted community structure’s quality by effectively minimizing the prediction’s bias/variance trade-off.
As shown in Figure 1, following the bootstrap resampling strategy, multiple BFS crawlers are initially triggered to extract multiple subgraphs from the input graph. Subsequently, the extracted subgraphs are properly enriched and suitably transformed to community prediction-ready data sets, with which the distributed stacking ensemble classifier is trained. This community prediction model that deftly balances the efficient capturing of data regularities and generalization is then applied on the input graph. After removing the edges previously classified as inter-connection, the underlying community hierarchy of the input graph is thusly extracted.
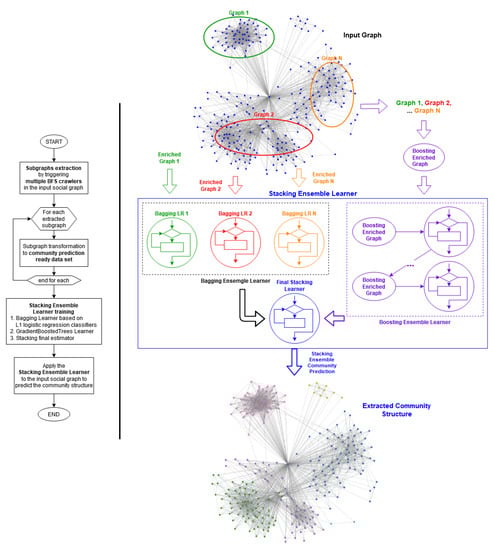
Figure 1.
The flowchart and the diagram of the stacking ensemble prediction methodology.
3.1. Subgraph Extraction
As assuredly described in [,,], due to the gigantic magnitude, the extended topological heterogeneities and the excessively variant structure of social networks, it seems infeasible to deduce the statistical properties of a global distribution of probability that the sophisticated sampling methods require. Hence, despite the lack of general finite-sample guarantees, the bootstrap resampling method is adopted considering its indisputable simplicity, its inherent parallelism, its asymptotical accuracy and its critical capability to control the stability of the results. Therefore, multiple BFS crawlers are randomly triggered to extract subgraphs of a predefined size. It should be noted that the number of the extracted subgraphs and their predefined magnitude obviously define the size of the training data set.
The maximum number of BFS crawlers concurrently executed, is practically determined by the level of parallelism of the execution system.
In contrast, the predefined magnitude of each extracted subgraph is strongly correlated to the input graph’s size. This critical parameter decidedly affects the performance of the proposed methodology and is subject to the input graph. Specifically, considering that the feature enrichment process requires the application of a classic community detection algorithm in terms of labelling, the size of each individual subgraph should be limited to a substantially manageable and descriptive as possible portion of the original graph. Practically, in the case of big data graphs, this might be way smaller than the two orders of magnitude, comparing the size of the original graph.
3.2. Feature Enrichment
As already discussed in sub-Section 2.1, the community’s intuitive interpretation is associated with the comparison of the intra-cluster and inter-cluster densities. Inevitably, the evaluation of whether two immediately connected nodes belong to the same community or not, is intrinsically interwoven with the deeper knowledge of their surrounding neighborhoods. Hence, each individual edge should be properly enriched with features that include its network topology information up to a predefined depth of value k.
The value of depth k is an essential parameter that seriously affects the community prediction’s performance. However, as thorough experimentation verified, the higher the value of depth, the less informative the calculated features had been. In particular, the feature enrichment for depths higher than the third degree has not been profitable since the corresponding features tended to converge to the graph’s average values. Thus, they did not have significant contribution to the variability’s explanation.
Therefore, considering any pair of adjacent nodes, denoted as a, b, and their individual sets of distinct neighbor vertices up to the kth depth, denoted as ak and bk respectively, the following descriptive network topology measures are calculated per distinct depth’s value:
- The intersection: The number of common neighbor vertices up to the kth depth.
- The loose similarity: The fraction of the intersection’s cardinality divided by the union’s cardinality of the individual sets of the distinct neighbor vertices up to the kth depth.
- The dissimilarity: The fraction of the symmetric difference’s cardinality divided by the union’s cardinality of the individual sets of the distinct neighbor vertices up to the kth depth.
- The edge balance: The absolute difference of the cardinalities of the individual sets of the distinct neighbor vertices up to the kth depth.
- the edge information: the imminent edge’s interconnection strength indicated by the number of different k-length paths between the vertices a, b [].
Even if might seem computationally demanding, the feature enrichment process described is inherently distributed. Specifically, considering that the necessary calculations can be performed independently per distinct edge, it is more than obvious that this step is intrinsically parallelizable.
To complete the extracted subgraphs’ transformation to community prediction-ready training data sets, the application of a community detection algorithm is required to properly label each distinct edge. As adequately explained in [], no community detection algorithm can generally be considered optimal for any community detection task. Thus, considering that the Louvain algorithm [] is one of the fastest modularity-based algorithms and is broadly accepted as a community detection standard, it is selected to suitably label the subgraphs’ edges as either intra-connection or inter-connection.
However, it is well established that the execution’s initiation node and the applied merging’s order [,] heavily affect the Louvain algorithm’s returned community structure. To ensure the validity of the labelling process, the Louvain algorithm is executed multiple times from different, randomly selected, initiation nodes. Thus, the final assigned label is practically the average response of the individual executions. It is notable that the significantly limited size of the extracted subgraphs and the Louvain algorithm’s decent time complexity seem sufficient to effectively circumvent this heavy computational requirement.
3.3. Stacking Ensemble Learner
The incontrovertibly high variance of the distributed logistic regression model in [] and the exceedingly increased bias of the distributed bagging ensemble meta-model presented in [], resulted in the extraction of undiscernible community structures of poor quality. Hence, the necessity for more sophisticated community prediction methodologies is strongly emphasized. Therefore, a highly-scalable and fully distributed, stacking ensemble model is introduced. This community prediction meta-learner focuses on optimizing the extracted community structure’s quality by minimizing the significant bias/variance effect.
In stacking ensemble methods, the independently trained, heterogeneous base learners are aptly combined by training a final model relying on the individual base learners’ predictions. As shown in Figure 1, the final base learner of the proposed stacking ensemble classifier is built on top of:
- a distributed bagging ensemble of L2 regularized, binary logistic regression classifiers, and
- a distributed gradient boosted trees ensemble model [], aka distributed GBT boosting ensemble model.
The final estimator is trained in accordance with the predicted class probabilities generated by the individual bagging and boosting estimators that are inherently designed to ensure high stability. This way, the proposed stacking meta-model will subtly balance between the bagging ensemble model, which intrinsically guarantees variance mitigation, and the boosting ensemble model that naturally specializes in bias minimization.
As previously mentioned, the community detection algorithms, which behavior the community prediction classifier should imitate, are iterative optimization processes of network topology measures that are ordinarily modelled with linear relationships. Hence, apart from its intrinsic simplicity and its impressive prediction performance, the binary logistic regression classifier seems the ideal base learner for the individual ensemble models. This binary learner is used not only as bagging ensemble model’s base learner, but also as the final estimator of the distributed stacking estimator. It is worth mentioning, that a distributed version of the binary logistic regression classifier is readily available in the Spark processing framework [], based on which the proposed methodology was implemented.
In bagging ensemble methods, several homogeneous base learners are independently trained on different bootstrap sampled data sets, which are properly combined by some deterministic averaging process. Subsequently, by training one binary logistic regression classifier per distinct community prediction-ready data set and by plainly averaging their individual predicted class probabilities, the distributed bagging ensemble model is conveniently built. This ensemble meta-model is naturally distributed since both training and prediction operations can obviously executed independently on the base learner level. By virtue of the curse of the dimensionality and the occurrence of the multicollinearity effect, the enforcement of regularization is necessary. Taking into consideration that the individual coefficients are not expected to have significant discrepancies, the L2 regularization is applied on bagging ensemble model’s base learners.
In boosting methods, homogeneous base learners are sequentially trained. This way, any of the subsequent learners in the ensemble boost focuses on the weaknesses of the previous estimators so as to improve the prediction accuracy. Particularly, by iteratively adapting each base learner to the misclassified hypotheses of those of the previous levels, boosting principally generates strong prediction models that specialize in bias reduction. Thus, considering the community prediction’s intrinsic complexity, a distributed GBT boosting ensemble model [] is properly trained on the combined community prediction-ready training data sets. This ensemble of decision trees productively captures the inherent non-linearities and the subjacent feature interactions, by demonstrating extensive adjustability and outstanding prediction performance. To avoid the GBT boosting ensemble models’ inherent tendency to overfit the following parameters require careful configuration per distinct graph:
- The loss function that should be set to logloss to outline the classification purpose of the stacking ensemble classifier.
- The number of decision trees.
- The maximum depth of the decision trees that depend on the input variables’ interaction.
- The learning rate, i.e., shrinkage, that determines the weighting of new decision trees added to the model.
3.4. Complexity Analysis
As already explained, the proposed community prediction methodology initially trains a distributed stacking ensemble classifier. It is considered that:
- The subgraph extraction process requires the application of multiple linear BFS crawlers which number is constant.
- The number of the extracted subgraphs is also constant.
- the size of the extracted subgraphs is considerably limited. Particularly, as shown in the conducted experimentation’s execution parameters in Table 4 this size was consistently smaller than two order of magnitude comparing to the input graph’s size.
- The feature enrichment process is of linear complexity and is intrinsically distributed on the edge level.
- The edge labelling process requires multiple executions of the Louvain algorithm [] on each extracted subgraph, where the number of executions is constant.
- The Louvain [] algorithm’s time complexity is considered O(k logk), where k indicates the number of subgraph’s nodes.
Thus, it is safe to conclude that the overall complexity of the training step is O(k logk), where k is the number of vertices included in the extracted training sample.
Furthermore, the time complexity of the stacking ensemble model application is similar to the inter-connection edges removal execution’s step, which in both cases is O(m), as regards the number of edges of the input graph, denoted with m.
Hence, since the reduction of the training data set’s size tends to outweigh the logk factor introduced by the application of the Louvain algorithm, it seems reasonable to conclude that the proposed methodology’s overall complexity is apparently towards linearity, as regards the number of edges of the input graph.
4. Experimentation Process & Results Discussion
To evaluate the performance of the proposed stacking ensemble community prediction methodology thorough experimentation has been conducted. Specifically, using an eight node Cloudera CDH 6.3.3 cluster, with 8 GBs of RAM and 4 virtual processing cores per execution node, the proposed methodology has been compared and contrasted against various community extraction methods with regards to the social graphs presented in Table 1. The Spark software framework used in terms of this experimentation as regards the community prediction implementations was the Apache Spark 2.4.5 and the proposed methodology was fully implemented using the Python interface for Spark API, aka PySpark, on the DataFrame level of abstraction. On the contrary, the classic community detection algorithms are practically built-in implementations of the NetworkX Python package.

Table 1.
Evaluated data sets.
It is worth mentioning that to ensure the determinism and the validity of this experimentation process, each distinct execution has been repeated 10 times. As a result, the reported values are practically the average of the individual executions.
4.1. Complexity Analysis
Regarding the evaluation of the prediction performance, to properly juxtapose the proposed stacking ensemble methodology with the corresponding of the distributed bagging ensemble methodology [] and the distributed logistic regression model [] the following classification performance metrics are considered:
- Accuracy: The ratio of the correctly classified predictions over all the predictions made.
- Recall: The fraction of the correctly predicted inter-connection edges over all truly inter-connection edges. This is practically the indicator of how well a community prediction model classifies the truly inter-connection edges.
- Precision: The ratio of the correctly classified inter-connection edges over all inter-connection predictions made.
- Specificity: The fraction of the correctly predicted intra-connection edges over all truly intra-connection edges. Accordingly, to recall, this is the indicator of how well a community prediction model classifies the truly intra-connection edges.
- F1-Score: The harmonic mean of the correctly classified predictions.
It is self-evident that the higher the difference between the intra-cluster and inter-cluster densities, the more qualitative and discernible the extracted community structure is expected to be. Therefore, to consider as valid a generated community structure, the number of intra-connection edges is expected to be significantly higher than the corresponding number of inter-connection edges. As a result, along with the accuracy, the F1-score is a similarly critical prediction performance metric due to its intrinsic specialization in uneven class distributions.
As already explained, the ultimate purpose of community prediction is to properly train a binary classifier to imitate the behavior of a community detection algorithm. Hence, the prediction performance comparison can alternatively be translated to the identification of the community prediction methodology that better imitates the community detection algorithm’s behavior used during training. In this case, the Louvain algorithm [] should serve as ground truth, dictating thusly its application to any analyzed social graph. However, this requirement places strict limitations regarding the size of the social graphs that should be considered for experimentation. Hence, in terms of proper evaluation, despite the proposed stacking ensemble methodology’s inherent capability of handling way larger social graphs, the experimentation process is circumscribed to relatively small social networks.
In terms of comparison’s fairness, apart from applying the same edge labelling strategy per different community prediction methodology, the training data sets used were also of similar size. Specifically, the experimentation execution parameters applied per different social graph for the distributed logistic regression model [] are presented in Table 2. For the distributed bagging ensemble methodology [] are given in Table 3. Finally, Table 4 and Table 5 introduce the execution parameters of the bagging and the boosting components respectively of the proposed distributed stacking ensemble methodology.
Table 2.
Distributed logistic regression [] community prediction methodology execution parameters per distinct social graph.
Table 3.
Distributed bagging ensemble [] community prediction methodology execution parameters per distinct social graph.
Table 4.
The bagging ensemble learner’s execution parameters per distinct social graph of the distributed stacking ensemble community prediction methodology.
Table 5.
The boosting ensemble learner’s execution parameters per distinct social graph of the distributed stacking ensemble community prediction methodology.
As emphatically proven by the experimentation’s results and shown in Figure 2, the supremacy of the proposed stacking ensemble methodology is uncontested. By reporting in average, 82.72% for accuracy, 77.40% for recall, 79.93% for precision, 80.67% for specificity and 78.99% for F1-score, the distributed stacking-based community prediction classifier consistently outreaches the prediction performance of the other alternatives [,] and systematically better-imitates the Louvain algorithm’s behavior in any analyzed graph. Specifically, the proposed methodology exceeds the distributed logistic regression model approach [] by 20.33% and 38.29% in terms of average accuracy and F1-score. On the other hand, comparing the distributed bagging ensemble technique’s [] performance, the proposed methodology’s outcome has proven ameliorated by 11.07% and 25.19% as regards the average accuracy and F1-score values. Particularly, focusing on the comparison with the distributed bagging ensemble alternative [], it is safe to conclude that the bigger the size of the individual graph, the higher the accuracy improvement of the proposed community prediction methodology.
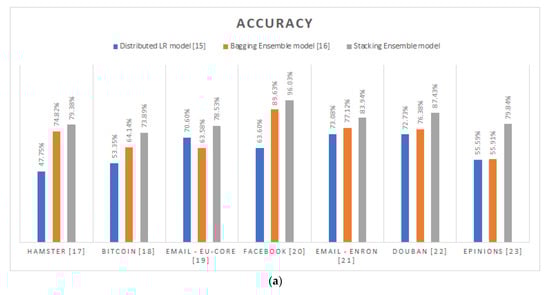
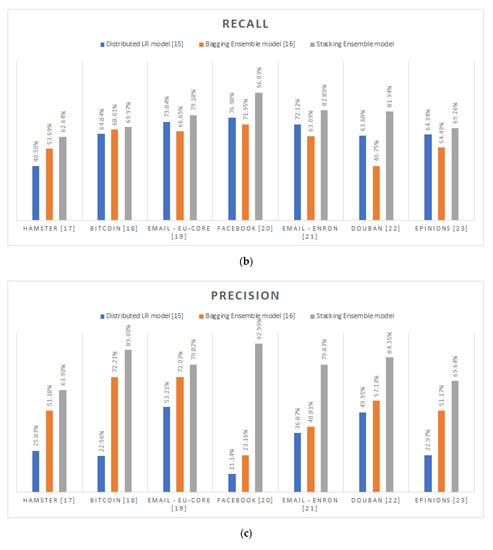
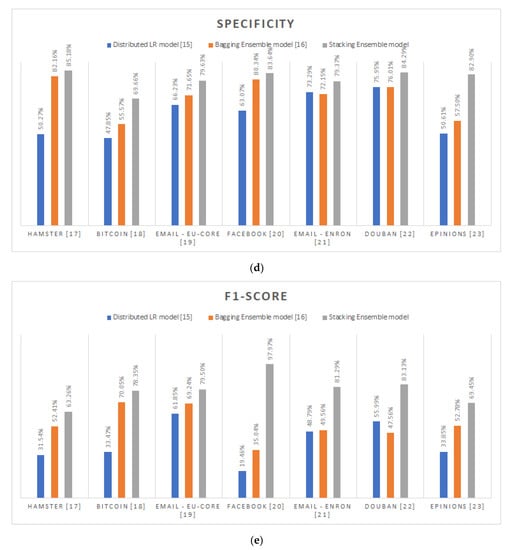
Figure 2.
Prediction performance metrics per different community prediction methodology per distinct social graph: (a) Accuracy; (b) Recall; (c) Precision; (d) Specificity; (e) F1-Score.
As already explained, the major problem of the other community prediction methodologies [,] is the continuously undiscernible extracted community structures due to their indisputable tendency to misclassify the inter-connection edges. This fact is also cross-validated by the experimentation process conducted. Specifically, the distributed logistic regression model methodology [] reports 31.79% in average for precision, while the respective reported value for the distributed bagging ensemble methodology [] is 52.53%. Although, by combining this poor precision performance with their respectable recall values, which on average were 65.19% and 59.80%, respectively, it is safe to conclude that the root cause of this misclassification is their inherent reluctancy to make inter-connection predictions. In other words, both methodologies [,] were more prone on the intra-connection prediction instead of inter-connection ones.
As practically proven, the most indicative case is the Facebook graph []. In this, the [] methodology poorly reports that only the 11.14% of its inter-connection predictions were correct, while the 76.98% of all its inter-connection predictions were truly inter-connection. Similarly, the respective values for the [] methodology are 23.16% for precision and 71.95% for recall. Consequently, the corresponding generated community structure per methodology, was apparently less fragmented than the originally expected. On the contrary, the performance of the proposed stacking ensemble methodology for this specific graph is way better comparing to the others. In particular, by correctly predicting the inter-connection edges in the 96.03% of cases and by properly identifying the truly inter-connection edges by 92.99%, the proposed methodology successfully imitates the Louvain algorithm’s behavior in the case of Facebook graph [].
This is also graphically cross-verified in Figure 3, where the intra-connection edges are represented with blue and the inter-connection edges with red. As clearly shown in Figure 3a,d, the extracted community structures of the proposed stacking ensemble methodology and of the Louvain algorithm’s [] are remarkably similar. In contrast, the generated community hierarchies of the other community prediction methodologies [,], as demonstrated in Figure 3b,c, are the evidently undiscernible.
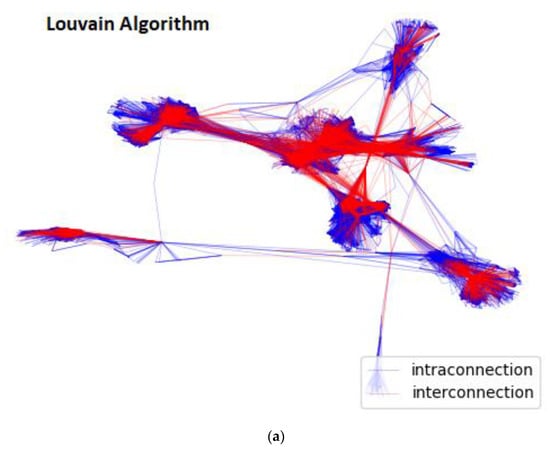
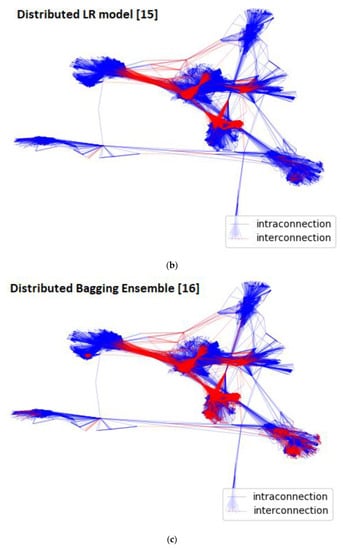
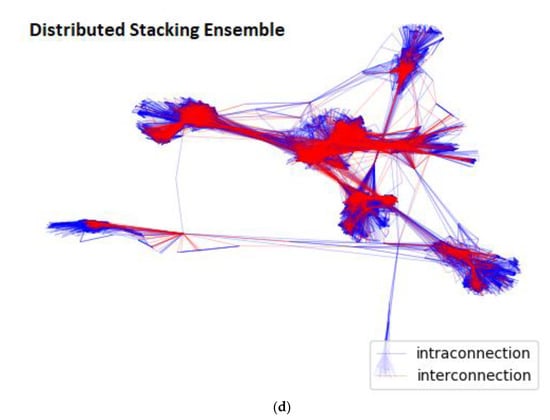
Figure 3.
Extracted Community Structure per different community prediction methodology for Facebook [] graph: (a) Louvain algorithm’s []; (b) Distributed LR model [] methodology’s returned; (c) Distributed bagging ensemble [] methodology’s; (d) Distributed stacking ensemble methodology’s.
4.2. Netowrk Quality Evaluation
It should not be neglected that the proposed community prediction methodology is basically a community detection alternative. Thus, it is totally reasonable to qualitative juxtapose the extracted community structure for each social-network examined, with the corresponding of the Louvain [] and the Girvan–Newman [] algorithms that are highly regarded.
In terms of validity, considering the wide adoption of the NetworkX Python package that readily allow the study of the structure and the dynamics of complex networks, the respective built-in functions were used in case of the Louvain [] and the Girvan–Newman [] algorithms.
To quantify the quality of the extracted community structures the following topological quality measures are considered:
- Coverage []: The average value of the individual community ratio of the number of intra-community edges to the total number of edges in the graph.
- Performance []: The average value of the individual community ratio of the number of intra-community edges plus inter-community non-edges to the total number of potential edges.
- Modularity [,,]: The average value of the individual communities’ ratio of the intra-community density to the corresponding density of the standard null model.
Considering that the ideal hierarchy structure should be consisted of completely disconnected partitions, the coverage definition apparently concurs with the intuitive interpretation of community. As shown in Figure 4, by impressively reporting 94.44% in average, the proposed stacking ensemble methodology constantly extracts denser communities, while outreaching the respective value of the Louvain algorithm [,] by 25.5% and of the Girvan–Newman algorithm [,] by 38.44%. This striking coverage performance apart from ensuring the returned hierarchy’s coherence, additionally results in the generation of more discernible community structures. This behavior is due to the fact that the proposed methodology tends to correctly identify more inter-connection edges comparing to the classic approaches.
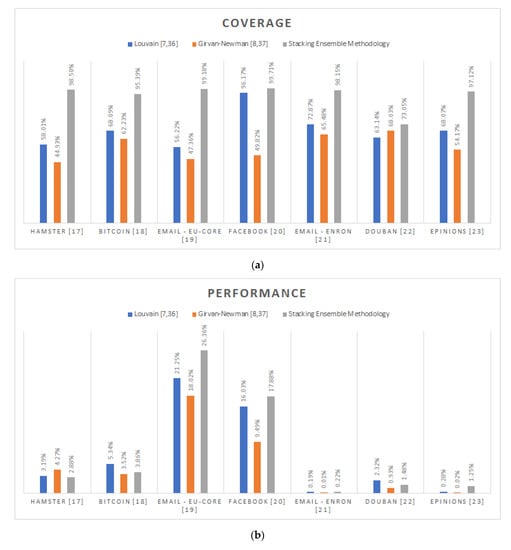
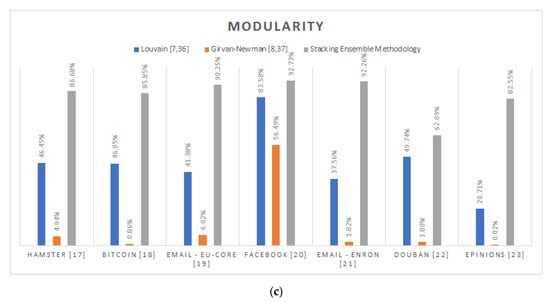
Figure 4.
Network analysis comparison of the proposed stacking methodology against the Louvain [,] and the Girvan-Newman [,] community detection algorithms: (a) Coverage; (b) Performance; (c) Modularity.
The extraction of more discernible community structures is also cross-validated by the modularity measure, which is broadly considered [,,] as one of the most indicative quality functions. Taking into account that a null model is a randomized version of the original graph which preserves the input graph’s degree sequence, modularity practically quantifies the difference between the generated hierarchy’s average coverage and the corresponding of the standard null model. As well explained in [], the higher the calculated modularity, the denser and thus more discernible the extracted community hierarchy will be. Hence, by reporting 84.63% in average modularity, the proposed stacking prediction methodology manages to detect consistently denser community hierarchies comparing to the Louvain [,] and the Girvan–Newman [,] algorithms by 38.15% and 74.35% in average, respectively. The significance of this conclusion is further strengthened considering that the Louvain [,] algorithm’s primary intention is to maximize the modularity of the generated structure.
Regarding the performance network quality measure, the root cause of the calculated mediocre overall results lays on the sparsely connected input graphs. By definition, the performance aims to calculate the ratio of the vertices’ pairs that either belong to the same community and are connected, or do not belong to the same community and are not connected, to all possible pair of vertices. As a result, the sparser the original graph, the lesser the impact of the community extraction to this corresponding quality measure. Hence, considering the “Average Degree” column of Table 1, only the Email-Eu-Core [] and Facebook [] graphs might be eligible for consideration. For this cases, the proposed stacking ensemble methodology outreaches, in average, the Louvain [,] algorithm’s performance by 3.48% and the corresponding of the Girvan–Newman [,] by 8.37%.
Finally, it should be strongly noted that the Louvain algorithm’s close imitation of the proposed stacking ensemble methodology, with regard to the Facebook graph [], is not only reflected in its prediction performance, but also in the reported network quality metrics.
4.3. Execution Performance Evaluation
In terms of completeness, despite the fact that the execution performance comparison between the classic community detection algorithms and a fully distributed, near-linear implementation seems aimless, this section is included to demonstrate the proposed community prediction methodology’s remarkable potentials. Particularly, the execution performance contrast regards the one of the fully distributed PySpark implementation of the proposed methodology on an eight node Spark cluster of 8 GBs of RAM and 4 vCPU cores per node, against those of the built-in, NetworkX’s Python implementations of the Louvain [] and the Girvan–Newman [] algorithms on a single node of 64 GBs of RAM and 32vCPU cores, using the Python 3.8.5 interpreter.
Hence, as plainly presented in Figure 5, the application of the proposed highly scalable approach practically reduces the execution time required to extract the underlying community hierarchy of any analyzed social graph by 83.92% and 93.36%, on average, comparing to the Louvain [] and the Girvan–Newman [] implementations.
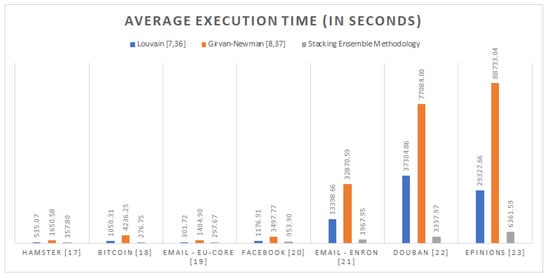
Figure 5.
The average execution time of the proposed community prediction methodology and the classic community detection algorithms per distinct social graph in seconds.
5. Conclusions
In this manuscript, a novel, near-linear, and highly scalable stacking-based community prediction methodology is introduced. As the extensive experimentation convincingly presented, by leveraging the plain network topology characteristics of small, bootstrap sampled, training data sets, the proposed, fully distributed, stacking ensemble meta-learner practically manages to effectively detect the underlying community structure of any given social graph regardless of its size and density.
Despite the promising results, there is a great room for improvement. Specifically, by:
- Automating the stacking ensemble learner parameterization regarding the number of the extracted subgraphs, the size of the extracted subgraphs and the value of the depth considered on the feature enrichment process.
- Enhancing the set of network topology features calculated with additional topological properties.
- Enhancing the labelling step during training with the further adoption of other classic community detection algorithms such as the Girvan–Newman algorithm [] and the Clauset–Newman–Moore algorithm [] and automate the selection of the suitable labelling approach.
- Automating the parameterization process of the distributed GBT component to optimally minimize the prediction bias.
Author Contributions
Conceptualization, G.P. and C.M.; methodology, G.P.; software, G.P.; validation, G.P.; formal analysis, G.P.; investigation, G.P.; resources, G.P.; data curation, G.P.; writing—original draft preparation, G.P.; writing—review and editing, G.P.; visualization, G.P.; supervision, G.P.; project administration, C.M.; funding acquisition, G.P. and C.M. All authors have read and agreed to the published version of the manuscript.
Funding
Christos Makris has been co-financed by the European Union and the Greek national funds through the Regional Operational Program “Western Greece 2014–2020”, under the Call “Regional Research and Innovation Strategies for Smart Specialization—RIS3 in Information and Communication Technologies” (project: 5038701 entitled “Reviews Manager: Hotel Reviews Intelligent Impact Assessment Platform”).
Institutional Review Board Statement
Not applicable.
Informed Consent Statement
Not applicable.
Data Availability Statement
Data available in a publicly accessible repository that does not issue DOIs.
Conflicts of Interest
The authors declare no conflict of interest.
References
- Fortunato, S. Community detection in graphs. arXiv 2009, arXiv:0906.0612. [Google Scholar] [CrossRef]
- Schaeffer, S.E. Graph clustering. Comput. Sci. Rev. 2007, 1, 27–64. [Google Scholar] [CrossRef]
- Souravlas, S.; Sifaleras, A.; Tsintogianni, M.; Katsavounis, S. A classification of community detection methods in social networks: A survey. Int. J. Gen. Syst. 2021, 50, 63–91. [Google Scholar] [CrossRef]
- Khediri, N.; Karoui, W. Community Detection in Social Network with Node Attributes Based on Formal Concept Analysis. In Proceedings of the 2017 IEEE/ACS 14th International Conference on Computer Systems and Applications (AICCSA), Hammamet, Tunisia, 30 Octorber–3 November 2017; pp. 1346–1353. [Google Scholar] [CrossRef]
- Li, Y. Community Detection with Node Attributes and its Generalization. arXiv 2016, arXiv:1604.03601. [Google Scholar]
- Devi, J.C.; Poovammal, E. An Analysis of Overlapping Community Detection Algorithms in Social Networks. Procedia Comput. Sci. 2016, 89, 349–358. [Google Scholar] [CrossRef]
- Blondel, V.D.; Guillaume, J.-L.; Lambiotte, R.; Lefebvre, E. Fast unfolding of community hierarchies in large networks. J. Stat. Mech. Theory Exp. 2008, 2008, P10008. [Google Scholar] [CrossRef]
- Newman, M.E.J.; Girvan, M. Finding and evaluating community structure in networks. Phys. Rev. E 2004, 69, 026113. [Google Scholar] [CrossRef]
- Lancichinetti, A.; Kivelä, M.; Saramäki, J.; Fortunato, S. Characterizing the community structure of complex networks. PLoS ONE 2010, 5, e11976. [Google Scholar] [CrossRef] [PubMed]
- Bouhatem, F.; El Hadj, A.A.; Souam, F. Density-based Approach with Dual Optimization for Tracking Community Structure of Increasing Social Networks. Int. J. Artif. Intell. Tools 2020, 29, 2050002. [Google Scholar] [CrossRef]
- Jarukasemratana, S.; Murata, T. Edge Weight Method for Community Detection on Mixed Scale-Free Networks. Int. J. Artif. Intell. Tools 2015, 24, 1540007. [Google Scholar] [CrossRef]
- Wakita, K.; Tsurumi, T. Finding community structure in mega-scale social networks. In Proceedings of the 16th International Conference on Information Integration and Web-Based Applications & Services, Hanoi, Vietnam, 4–6 December 2007; Volume 105, pp. 1275–1276. [Google Scholar]
- Backlinko.com. Available online: https://backlinko.com/social-media-users (accessed on 3 December 2020).
- Takaffoli, M.; Rabbany, R.; Zaïane, O.R. Community evolution prediction in dynamic social networks. In Proceedings of the 2014 IEEE/ACM International Conference on Advances in Social Networks Analysis and Mining (ASONAM 2014), Beijing, China, 17–20 August 2014; pp. 9–16. [Google Scholar] [CrossRef]
- Makris, C.; Pettas, D.; Pispirigos, G. Distributed Community Prediction for Social Graphs Based on Louvain Algorithm. In IFIP International Conference on Artificial Intelligence Applications and Innovations; Springer: Cham, Switzerland, 2019; pp. 500–511. [Google Scholar]
- Makris, C.; Pispirigos, G.; Rizos, I.O. A Distributed Bagging Ensemble Methodology for Community Prediction in Social Networks. Information 2020, 11, 199. [Google Scholar] [CrossRef]
- Hamster Friendships Network Data Set—KONECT. April 2017. Available online: http://konect.uni-koblenz.de/networks/petster-friendships-hamster (accessed on 15 September 2020).
- Kumar, S.; Hooi, B.; Makhija, D.; Kumar, M.; Subrahmanian, V.S.; Faloutsos, C. REV2: Fraudulent User Prediction in Rating Platforms. In Proceedings of the 11th ACM International Conference on Web Search and Data Mining (WSDM), Los Angeles, CA, USA, 5–9 February 2018; Available online: https://snap.stanford.edu/data/soc-sign-bitcoin-alpha.html (accessed on 15 September 2020).
- Yin, H.; Benson, A.R.; Leskovec, J.; Gleich, D.F. Local Higher-Order Graph Clustering. In Proceedings of the 23rd ACM SIGKDD International Conference on Knowledge Discovery and Data Mining, Halifax, NS, Canada, 13–17 August 2017; Available online: https://snap.stanford.edu/data/email-Eu-core.html (accessed on 15 September 2020).
- McAuley, J.; Leskovec, J. Learning to Discover Social Circles in Ego Networks. NIPS. 2012. Available online: https://snap.stanford.edu/data/ego-Facebook.html (accessed on 15 September 2020).
- Klimmt, B.; Yang, Y. Introducing the Enron corpus. In Proceedings of the CEAS Conference, Mountain View, CA, USA, 30–31 July 2004; Available online: https://snap.stanford.edu/data/email-Enron.html (accessed on 15 September 2020).
- Douban Network Data Set—KONECT. April 2017. Available online: http://konect.uni-koblenz.de/networks/douban (accessed on 15 September 2020).
- Richardson, M.; Agrawal, R.; Domingos, P. Trust Management for the Semantic Web. ISWC. 2003. Available online: https://snap.stanford.edu/data/soc-Epinions1.html (accessed on 15 September 2020).
- Girvan, M.; Newman, M.E.J. Community structure in social and biological networks. Proc. Natl. Acad. Sci. USA 2002, 99, 7821–7826. [Google Scholar] [CrossRef]
- Clauset, A.; Newman, M.E.J.; Moore, C. Finding community structure in very large networks. Phys. Rev. E 2004, 70, 066111. [Google Scholar] [CrossRef] [PubMed]
- Gregory, S. Finding overlapping communities in networks by label propagation. New J. Phys. 2010, 12, 103018. [Google Scholar] [CrossRef]
- Zhang, X.-K.; Ren, J.; Song, C.; Jia, J.; Zhang, Q. Label propagation algorithm for community detection based on node importance and label influence. Phys. Lett. A 2017, 381, 2691–2698. [Google Scholar] [CrossRef]
- Zhao, W.; Martha, V.; Xu, X. PSCAN: A Parallel Structural Clustering Algorithm for Big Networks in MapReduce. In Proceedings of the 2013 IEEE 27th International Conference on Advanced Information Networking and Applications (AINA), Barcelona, Spain, 25–28 March 2013; pp. 862–869. [Google Scholar]
- Newman, M.E.J. Modularity and community structure in networks. Proc. Natl. Acad. Sci. USA 2006, 103, 8577–8582. [Google Scholar] [CrossRef] [PubMed]
- Shao, J.; Zhang, Z.; Yu, Z.; Wang, J.; Zhao, Y.; Yang, Q. Community Detection and Link Prediction via Cluster-driven Low-rank Matrix Completion. In Proceedings of the Twenty-Eighth International Joint Conference on Artificial Intelligence, Macao, China, 1–16 August 2019; pp. 3382–3388. [Google Scholar] [CrossRef]
- Messaoudi, I.; Kamel, N. Community Detection Using Fireworks Optimization Algorithm. Int. J. Artif. Intell. Tools 2019, 28, 1950010. [Google Scholar] [CrossRef]
- Amelio, A.; Pizzuti, C. An Evolutionary and Local Refinement Approach for Community Detection in Signed Networks. Int. J. Artif. Intell. Tools 2016, 25, 1650021. [Google Scholar] [CrossRef]
- Dan, K. The Square of Adjacency Matrices. arXiv 2012, arXiv:1207.3122. [Google Scholar]
- Peel, L.; Larremore, D.B.; Clauset, A. The ground truth about metadata and community detection in networks. Sci. Adv. 2017, 3, e1602548. [Google Scholar] [CrossRef]
- Meng, X.; Bradley, J.K.; Yavuz, B.; Sparks, E.R.; Venkataraman, S.; Liu, D.; Freeman, J.; Tsai, D.B.; Amde, M.; Owen, S.; et al. MLlib: Machine Learning in Apache Spark. J. Mach. Learn. Res. 2016, 17, 34. [Google Scholar]
- Github.com/NetworkX.com/Louvain Implementation. Available online: https://github.com/taynaud/python-louvain (accessed on 15 September 2020).
- NetworkX.com/Girvan-Newman Implementation. Available online: https://networkx.org/documentation/stable/reference/algorithms/generated/networkx.algorithms.community.centrality.girvan_newman.html (accessed on 15 September 2020).
Publisher’s Note: MDPI stays neutral with regard to jurisdictional claims in published maps and institutional affiliations. |
© 2021 by the authors. Licensee MDPI, Basel, Switzerland. This article is an open access article distributed under the terms and conditions of the Creative Commons Attribution (CC BY) license (http://creativecommons.org/licenses/by/4.0/).