1. Introduction
Fifty-five years have passed since Ivan Sutherland presented his vision of the ultimate display [
1]. Jaron Lanier coined the term “Virtual Reality” back in 1989 [
2]. Meanwhile, emerging extended reality (xR) technologies, such as virtual reality (VR), augmented reality (AR), and mixed reality (MR), are currently transforming the workflows of many industries. These technologies also offer sustainable, affordable, and efficient solutions for architecture and city planning. Decisive technological developments such as improved physically based rendering methods and less expensive head-mounted displays (HMDs) have simplified the possibilities of developing virtual reality environments for small and medium-sized enterprises in the last five years.
Integrated Virtual Reality applications for geographical information systems (VRGIS) or integrated Augmented Reality applications for geographical information systems (ARGIS) basically means the integration of xR-technologies with GIS data. This includes virtual reality (VR), augmented reality (AR) and mixed reality (MR) applications. This fusion enables many interactive 3D real-time applications for visualizing spatial information. Recently, researchers have made great progress in the development of VRGIS and ARGIS applications. VRGIS combines virtual reality technologies, 3D GIS applications and real-time Web GIS solutions. It can be deployed on various interaction devices, such as mobile devices, PCs and HMDs. The user is able to obtain the landscape data in real-time, three-dimensionally and interactively. Moreover, VRGIS enables the user to apply controls, evaluations, calculations and transfers upon the layer of existing spatial data. Some work has focused on BIM integration and computer-aided design (CAD) [
3]. The Open Geospatial Consortium (OGC) has developed the open and exchangeable CityGML format [
4]. Other projects have dealt with the integration of AR hardware and VR systems, such as GeoWalls or a Cave Automatic Virtual Environment (CAVE) display [
5,
6,
7]. Moreover, there are more MR systems emerging, using GIS applications with VR hardware, some of them used in cultural heritage and education [
8,
9,
10,
11]. Often, these are applications for decision making in the urban planning process for experts and end users, for data overlay for population information, orientation, navigation, reconstruction or the simulation of future scenarios.
Developing VRGIS applications today, we are facing the following problems: For many mobile devices, the processing of the resulting data volumes, associated query functions and the level of detail are a well-known problem. On the other hand, georeferenced data are currently only available in many different data formats. Even the correct georeferencing of 3D data in virtual worlds is not always self-evident and possible. VRGIS and ARGIS promise new and interesting approaches here, through immersive and partially immersive 3D representation methods. There are different approaches for the technological integration of GIS applications and VR hardware today. There are many proprietary solutions, but only a few functional open-source solutions. Therefore, this paper will focus on the development of an open-source workflow to integrate GIS data into VR environments for small and medium-sized enterprises (SMEs) in Bavaria.
This research began with an inquiry from a small IT company for a detailed overview on current software solutions. Most companies in Germany are small or medium-sized enterprises (SMEs). This article is vital for these companies, since its aim is to create a practical open source solution for everyday work, based on up-to-date research. The first aim of this research was to find an open-source workflow for project preparation, software installation and hardware setup. Secondly, for orientation and classification, a comprehensive networking matrix for applied interactive technologies (APITs) should be introduced for partner searches in related software developments [
12].
The results are very interesting for municipalities, authorities and for architects and city planners. Thus, they receive valuable information and an overview on contemporary open-source alternatives for planning in the urban environment. Our findings show that open-source platforms used in VRGIS solutions can offer very interesting, practical and economical solutions for SME’s and all other partners involved in planning. All investigated VRGIS and ARGIS applications can be classified into three groups. Furthermore, it is shown that we can categorize all current xR-applications in the APITs networking matrix. With the help of this matrix, technically related developments can be identified, and meaningful cross-references between individual disciplines can be established. Moreover, this networking matrix will help SME’s in finding partners for related developments. Thus, this research work provides an overview of up-to-date developments in this field, since no such focused study yet exists. Furthermore, it provides a solid basis for further detailed research on the integration of xR-technologies with common architectural and industrial software.
In the following chapters, a classification of xR-applications will be done on the basis of a detailed literature review. Current application areas of xR-technologies are shown, and the so-called APITs networking matrix will be explained. In a next step, the evaluation criteria for xR-applications in SMEs will be elaborated: economic efficiency, integration capability and operability. Due to these criteria, we will finally be able to propose a simple open source xR-solution for SMEs in Bavaria.
2. Literature Review
In a comparative case study based on the method of structured and focused comparison according to George and Bennett [
13], fourteen current software applications are presented below as examples. The taxonomy of current VR hardware according to Anthes et al. [
14] allows a categorization of applications according to output devices (mobile, wired) and software development (proprietary and open source platforms, game engines, WebVR and multi-user experiences). A subsequent discussion of the different software solutions is based on the criteria of integration capability into existing planning tools, operability without programming knowledge and general economic efficiency.
A systematic search for relevant work was conducted in ScienceDirect, Web of Science and Scopus. Due to decisive technological developments, the selection criteria were limited to studies focusing on VRGIS and ARGIS within the last five years. The decision for this period of the last five years was made because of the appearance of decisive technological developments in 2015. HTC Vive was first presented at the Quo Vadis Game Developer Conference in Berlin from 21–23 April 2015. Unreal Engine 4 became free of charge on 2 March 2015. In the same year, we saw improved image-based lighting in Source Engine 2 and advanced physically based rendering methods in Cryengine 3, Unity 5 and Unreal Engine 4. With Cycles, Blender presented a new GPU-based render engine. After reviewing fourteen selected studies from the last five years, the following three groups of applications can be distinguished (please see
Appendix B,
Table A1,
Table A2 and
Table A3):
Interactive xR-Applications
Mobile VR Applications with 360° Panoramas or Videos
Non-immersive Desktop Applications (e.g., WebVRGIS)
2.1. Interactive xR-Applications
Interactive xR-applications include immersive, partially immersive and non-immersive settings, as well as georeferenced and non-georeferenced solutions.
For the digital reconstruction of the Gale Crater on Mars, Caravaca et al. [
15] are developing an interactive multi-user platform. They are using several HTC Vives (wired, roomscale) as output devices. They do not make any statement about the software and the game engine being used. The 3D terrain model is georeferenced and photogrammetric.
Ma et al. [
16] are developing their own complex interactive, immersive and georeferenced 3D desktop application, for the representation of complex infrastructural issues in urban planning and communication. The application uses georeferenced data from various sources (e.g., Google Street View with the Google Maps JavaScript API and public survey data). Based on JavaScript, a proprietary software tool “Underground Utility” is being developed to set personalized markers. The 3D models used were created from Shapefiles with Trimble SketchUp. The SYMMETRY software was used to prepare the Sketchup files for the final VR application. The map material was compiled from Shapefiles using AutoCAD and ARCMap. The output device is the HTC Vive; the application is wired and interactive (roomscale). The data remain georeferenced in the final interactive VR application.
Berger and Bill [
17] are developing a multi-sensorial VR application for the immersive experience of urban traffic noise. They use the format COLLADA for import into Unity. It defines an open standard XML schema for the exchange of digital assets between different interactive 3D graphics software applications. A Python script automatically divides the CityGML data into individual buildings. In Unity, they use the Mapbox Mapping Extension to load elevation data and a collection of base maps in an exactly georeferenced manner. As output devices, two settings are tested: a mobile standalone solution comparable to a Samsung Gear VR, and a wired solution comparable to an Oculus Go (seated).
Wang et al. [
18] present a mobile mixed reality system (HoloDym3DGeoScene) for georeferenced and web-based data collection, and for spatial and interactive presentation. They use the Microsoft Hololens as a mobile device. HoloDym3DGeoScene uses Internet services to provide data and content. The user can interact with the virtual content via a physical and visual interface. Bing Map and Open Street Map, satellite, vector and raster data serve as databases. The interactive mixed reality environment was developed using Unity, C# and Visual Studio.
Bekele [
19] is designing a similar georeferenced system (Walkable MxR Map) for cultural heritage and education using Google and Bing Maps, and with Microsoft Hololens as the end device. It is also possible to query spatial data interactively. The software for the interactive application is Unity with the Mixed Reality Toolkit (MRTK) and Visual Studio.
Simon [
20] describes a simple proprietary production pipeline for a mixed reality application (MxR) with the ESRI CityEngine, ArcGIS, FME and Global Mapper. The output device is a mobile device (smartphone, tablet). The game engine Unity and the software Vuforia are used for development. The final MxR application is interactive, but unfortunately the data are no longer georeferenced in the virtual world.
Secci et al. [
21] use photogrammetry to create a virtual 3D image of a shipwreck for cultural heritage, educational and archaeological purposes. The final VR application is created with the open source software QGIS, the proprietary software 3DS MAX, Substance Painter and the free version of the Unreal Engine. The setting is wired, interactive and immersive (seated). The output device is the Oculus Rift. While the initially used photogrammetric data is georeferenced, the interactive 3D environment is ultimately no longer georeferenced.
Furthermore, for underwater archaeology, Bruno et al. [
22] are also developing a VR system with a tablet controller. The VR system based on the HTC-Vive (wired, roomscale) is developed with Unity and has an interactive, web-based scene editor. The tablet controller is mobile and supports navigation and other functions in three-dimensional space. The georeferenced 3D model is created photogrammetrically.
Li [
23] presents a mixed-reality GIS environment for cultural heritage conservation. A combination of mobile AR and wired VR application has been developed. 360° videos and Microsoft Kinect are used to create digital 3D models. The ArcGIS platform brings the data together in a georeferenced manner. The Oculus Rift and a projective augmented reality (PAR) are used; this is interactive and immersive (seated).
An interesting open-source solution is presented by Virtanen et al. [
24]. They have developed the “Meshmoon Platform”, a collaborative xR-application using exclusively open-source data. The open multi-user system uses the open-source realXtend Tundra technology (Tundra Extensible Mark-Up Language—TXML) and is based on the open-source game engine OGRE 3D and the Open Asset Import Library. All 3D models are provided on request via a central server. A virtual 3D environment (CAVE) is used as output device. All data remain georeferenced in the virtual environment.
2.2. Mobile VR Applications with 360° Panoramas or Videos
Often, VR applications can also be found using mobile devices. El halabi et al. [
25] present such a virtual city model for decision making in the urban planning process for Rafah City. The focus is on participatory planning, cooperation and sustainable development. They have developed the system with the proprietary ESRI City Engine, ArcGIS Online and use the Samsung Gear VR as the end device. The data is georeferenced and the system also offers web services. Li et al. [
26] are also developing a web-based system for traffic analysis and data visualization with the Samsung Gear VR. It represents a transitional form to dedicated and non-immersive WebVRGIS systems.
2.3. Non-Immersive Desktop Applications (e.g., WebVRGIS)
Liao [
27] is developing a server-based and georeferenced VRGIS system, to optimize available resources in tourism. Proposed is a Rich Internet Application (RIA) with an IIS server and a SQL database. The interactive 3D visualization is supported by the unity engine; no information is given about the visual end device.
Altaweel [
28], Li et al. [
29] and Zhang et al. [
30] name following software packages for the development of web-based VRGIS applications: Geoscope, the ESRI City Engine and XEarth. These are non-immersive desktop applications. Wang et al. [
18] also present an interactive and georeferenced WebVRGIS platform (wired, seated) with three-dimensional spatial data retrieval and 3D data visualization.
Boulos et al. [
10] present the 3D Shenzhen City WebVRGIS, an internet platform for the interactive visualization of GIS data using the example of the metropolis of Shenzhen in China. The software used was the ESRI CityEngine with mobile and wired VRGIS (ArcGIS 360 VR), on the ArcGIS Online Cloud. Output devices are the Samsung Gear VR or the Oculus Rift. Moreover, an AR application from the ESRI community for allocating water pipes in New Jersey and an interactive digital map for navigation in the event of a natural disaster are explained. With CleanApp and OpenLitterMap, two ARGIS applications will be presented for waste prevention and mapping.
3. Results and Discussion
Today, VRGIS and ARGIS have a broad field of application in various disciplines. This includes not only urban, regional and infrastructure planning and tools for decision making in the urban planning process [
16,
24,
25], but also data on traffic management, other population-related data and spatial queries [
28], geological analysis and simulation in planetary and space exploration [
15], interactive applications for tourism [
27,
31], monuments and cultural heritage [
19], and archaeology and underwater archaeology [
21,
22]. VR applications are also used today for fast and efficient data and information visualization, in teaching and geography, for climate modeling, multi-criteria optimization, spatial analysis and sustainable development. Boulos et al. [
10] combine IoT and Big Data. Their fields of application are health, smart cities and regions, population management, traffic management, allocation and monitoring of infrastructure and urban resources, environmental and disaster control, early warning systems, simulation and planning, as well as solar altitude studies in urban environments.
The examination of the cited literature showed how broad the field of application is for VR applications today. On the other hand, the investigation also showed that the respective application area determines the used hardware and software in a very significant way. The final solution often depends also on the individual situation within the value chain and the user group.
Currently, there are only a few operable VRGIS applications for SME’s in architecture and urban planning. The operability of these applications strictly depends on the evaluation criteria of integration capability, operability and economic efficiency. In the following, an evaluation can be found of the individual applications according to the criteria of integration in existing planning tools, operability without programming knowledge and general economic efficiency.
The integration of official survey data in xR-applications is practically feasible today and is possible in various technological variants. There are integrated server- and web-based concepts and standalone variants for the targeted compilation and processing of data.
Among the studies examined, the open source solutions [
21,
24] show a high degree of integration applicability into other planning tools and ensure sustainability and general economic efficiency. However, operability without special programming skills is often better provided by proprietary solutions [
10,
20,
25]. There are currently relatively few multi-user applications and only some applications with interactive spatial query functions. One permanent challenge is the complex multi-dimensional presentation of information, the amount of data and the corresponding level of detail in the presentation, especially for mobile devices.
Due to the internal position calculation in game engines, and the existing accuracy of floating point numbers, the integration of georeferenced survey data is a fundamental problem. With the use of open data exchange formats such as COLLADA for interactive graphics applications and the Mapbox SDK for Unity, Berger and Bill [
17] show an interesting opportunity to store georeferenced data sets in game engines with exact positional accuracy.
Höhl [
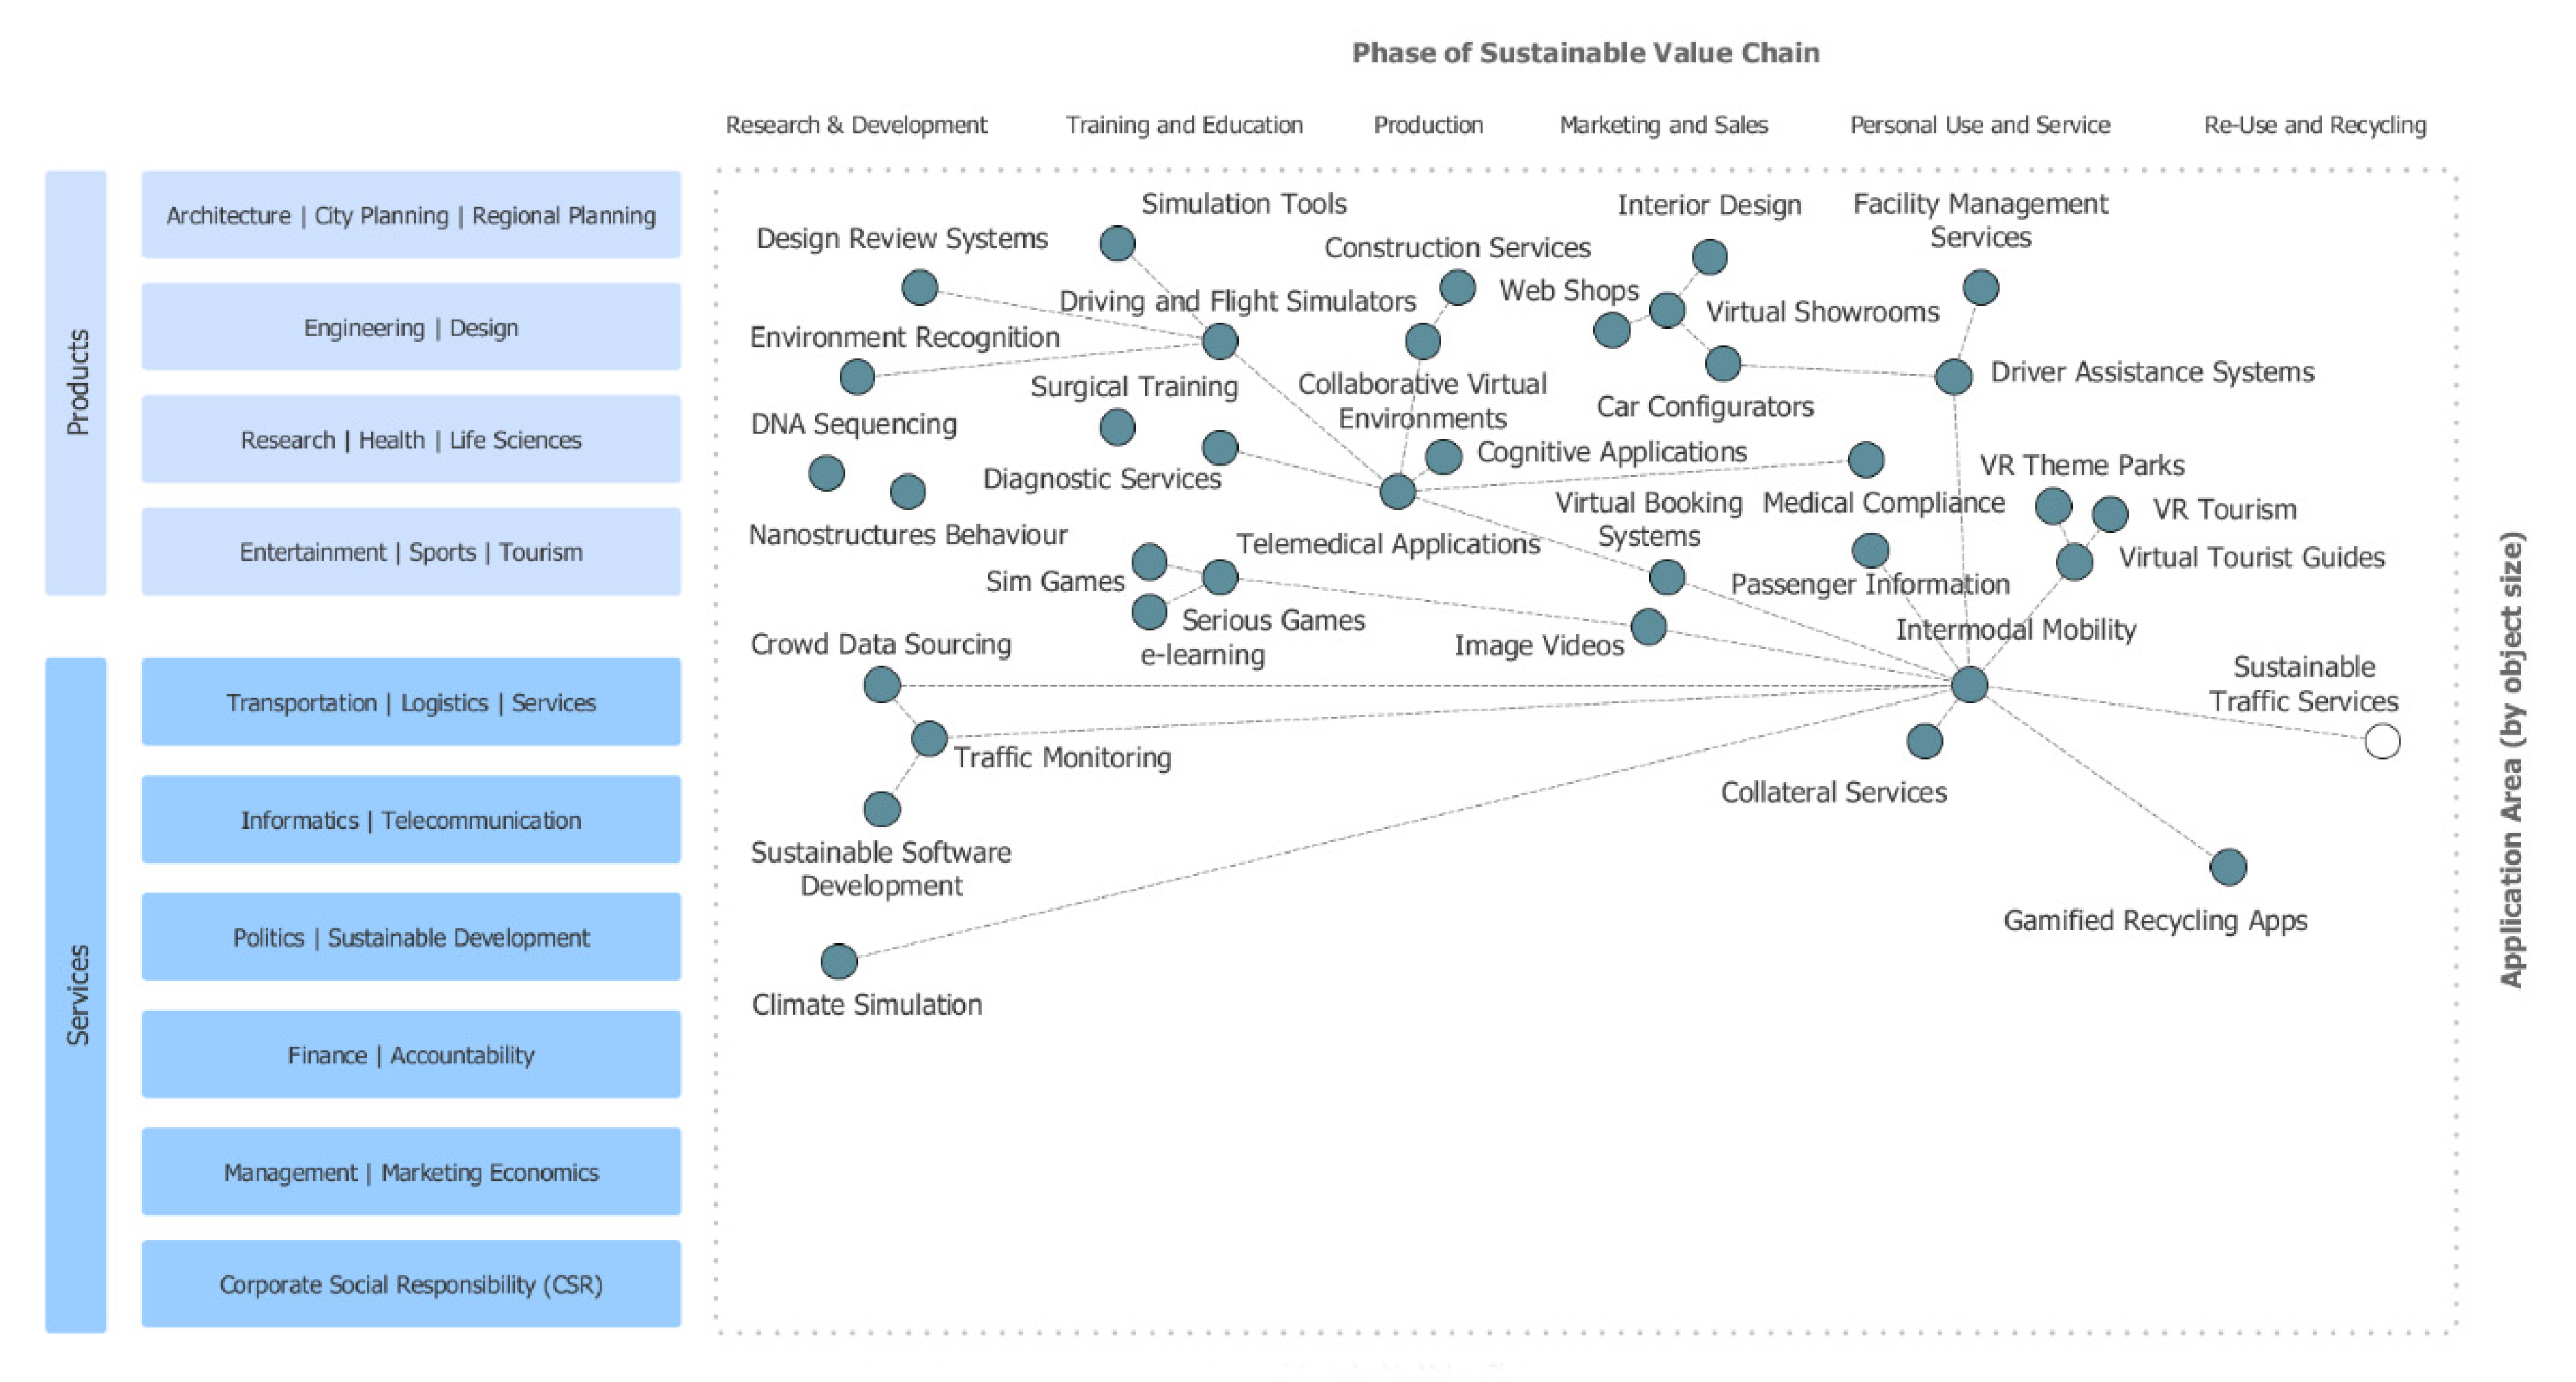
12] has designed a comprehensive networking matrix for applied interactive technologies (APITs) as shown in
Figure 1. With the help of this matrix, technically related developments can be identified, and meaningful cross-references between the individual disciplines can be established. According to the areas of application in classical simulation, there are ten areas of application. They are arranged on the y-axis according to size (km, m, mm and scaleless) and according to products and services. The sustainable value-added chain extends on the x-axis. Engineering and product design, entertainment and sports, transport, logistics and utility services, information technology and telecommunications, politics and sustainable development, finance and accounting, management and marketing economics and corporate social responsibility are also mentioned, in addition to the application areas already covered.
From the perspective of the author, the following approaches for the development of VRGIS for SME’s can be further pursued. Due to the aforementioned evaluation criteria of integration capability, operability and economy, a simple open-source software solution can be interesting, just as a proprietary solution. Using open-source tools will bring forward the integration capability, operability and economy of the whole system. The proprietary solution was found to be simpler by the customer in terms of operability and software installation, but it does not yet provide positional accuracy. A setup using COLLADA and Mapbox SDK will allow for a more simple data exchange and exact positional accuracy in game engines. A simple local hardware setup without elaborate server solutions will increase economic efficiency and operability. The APITs networking matrix was introduced in the decision-making process, and our clients found it helpful. So, in the following chapters, a simple existing proprietary and a newly developed open-source solution will be introduced and compared.
4. Simple xR-Solutions for Small and Medium-Sized Enterprises in Bavaria
Technical solutions such as those developed by Simon [
20] aim at integration capability and cost-effectiveness and are therefore very suitable for the operational requirements of small and medium-sized enterprises. Moreover, operability without special programming knowledge is at least in large parts intended by the author. Therefore, in the following section, the design for a corresponding alternative workflow for an interactive xR-application with open-source software is presented, especially for small and medium-sized enterprises in Bavaria. All materials used can be found in
Appendix A.
4.1. Official Survey Data: Types and Data Formats
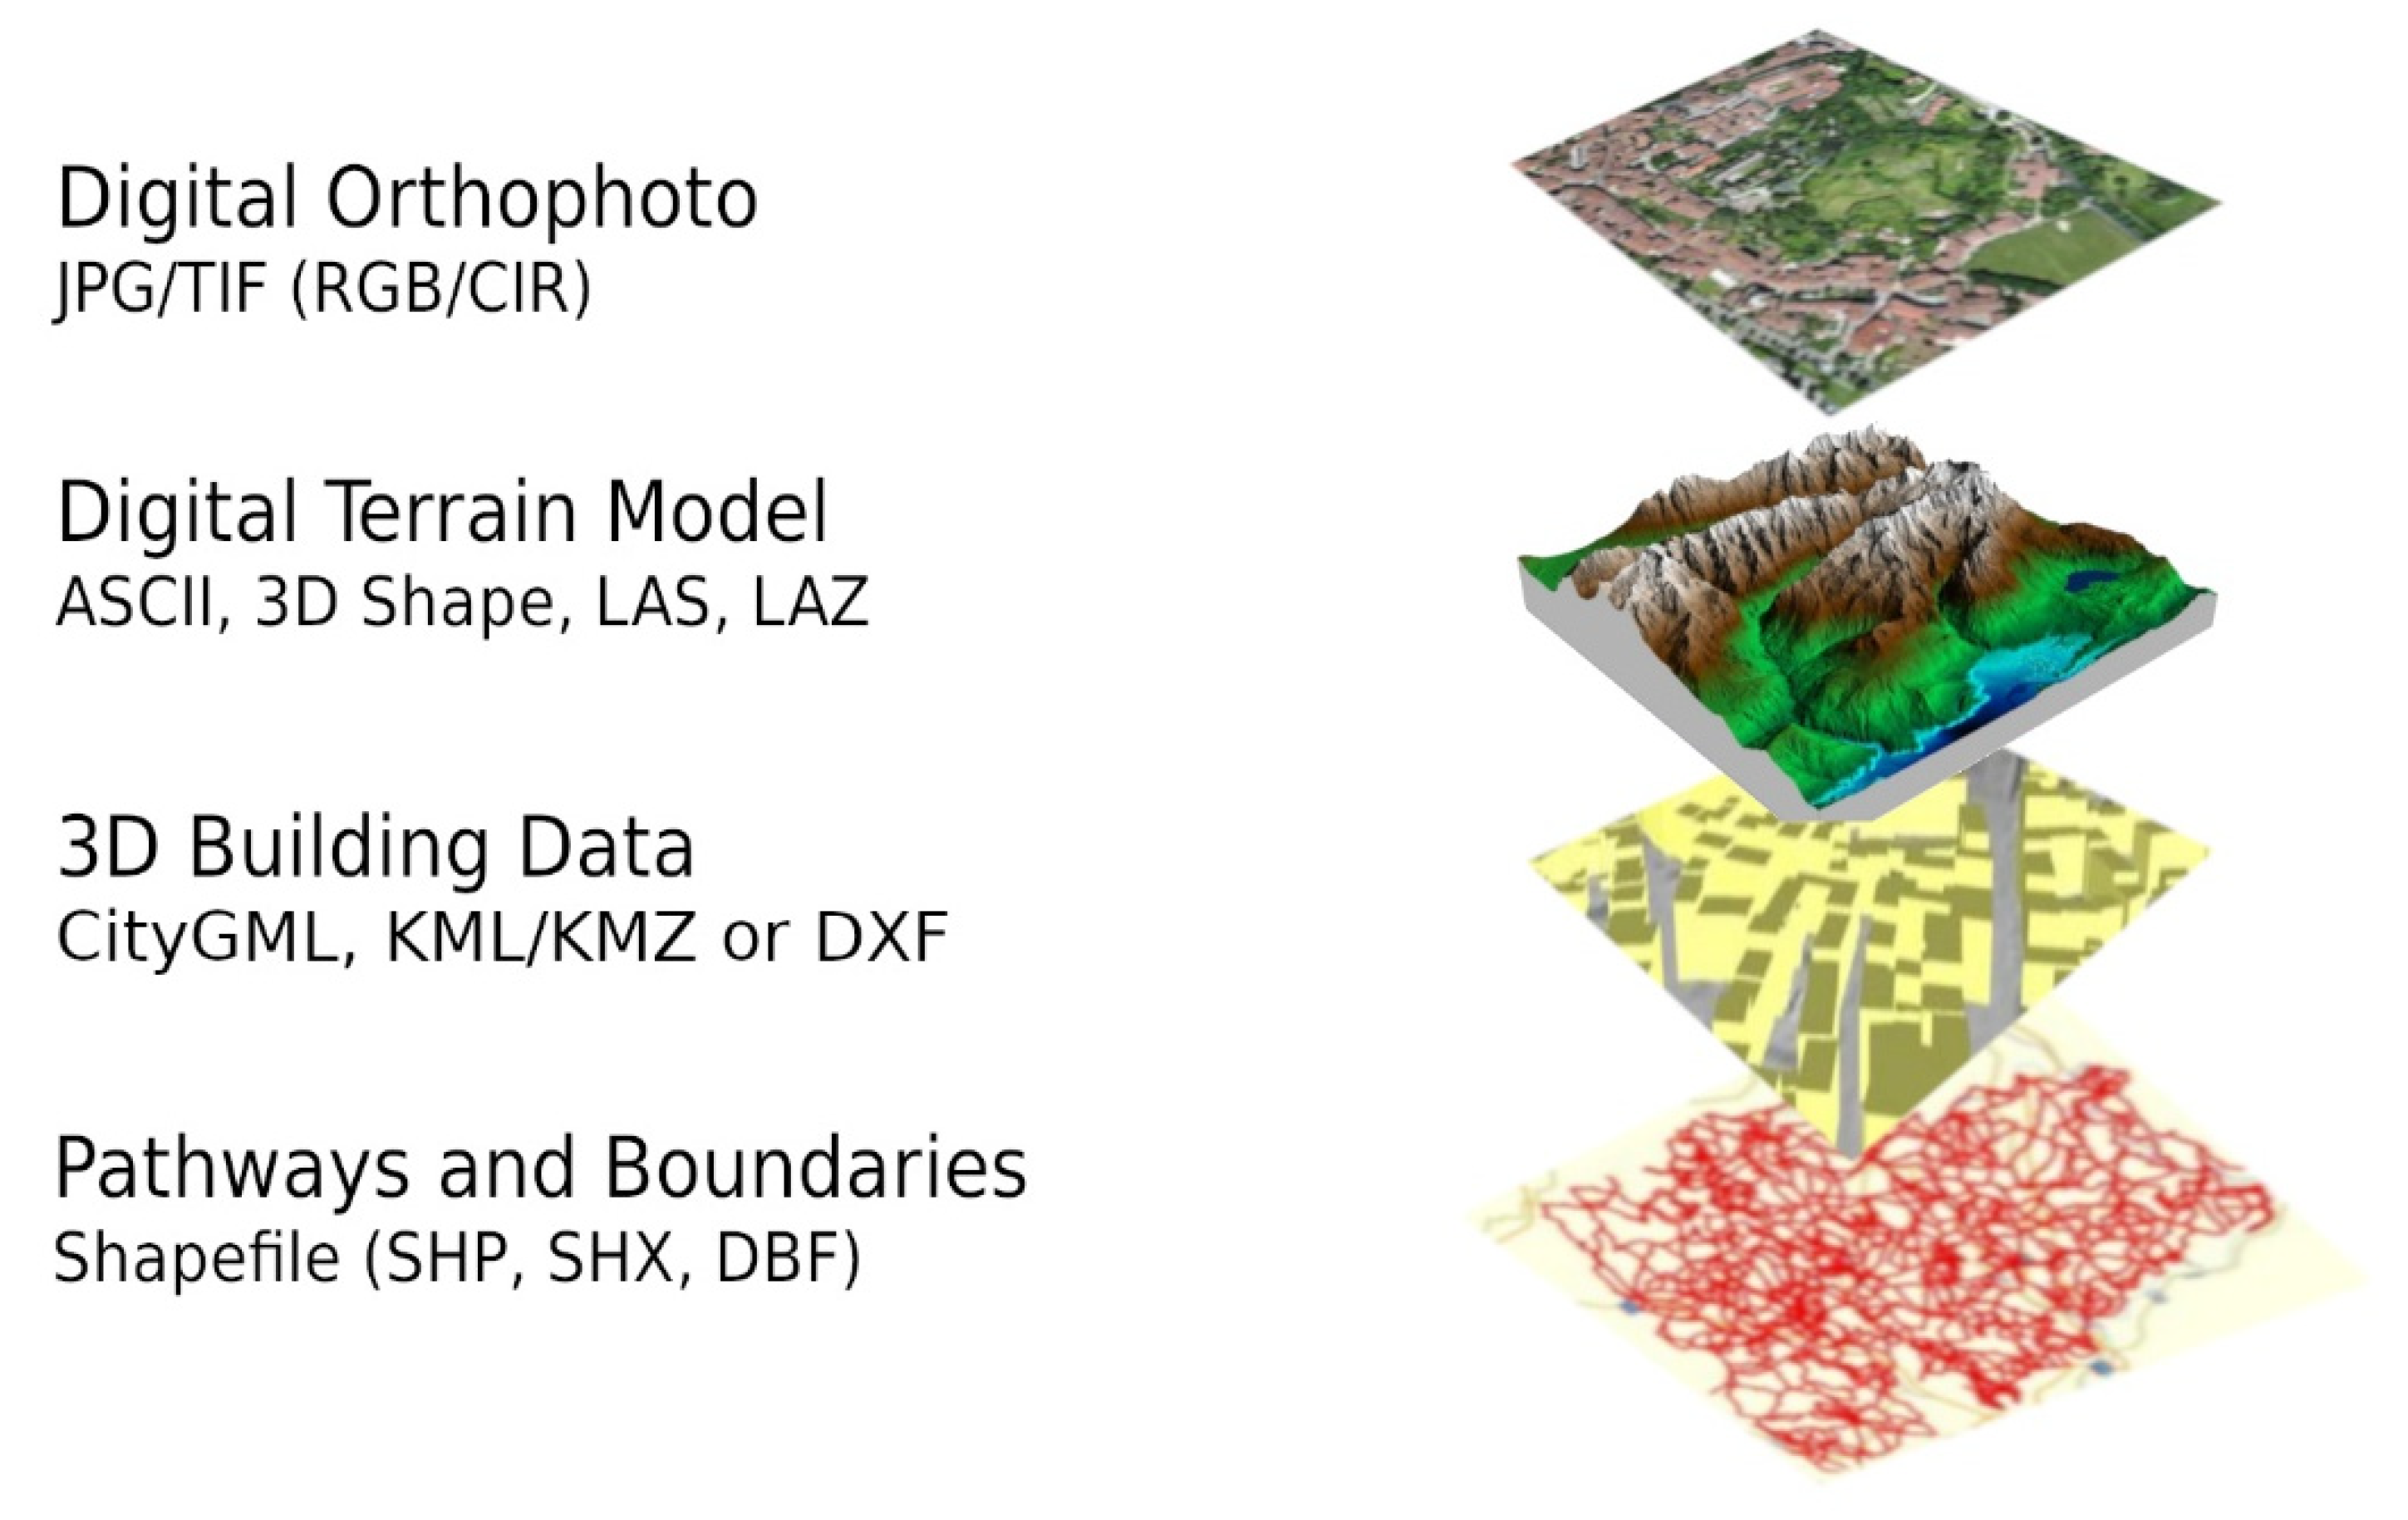
The Landesamt für Digitalisierung, Breitband und Vermessung (LDBV) in Bavaria offers a wide range of different data as shown in
Figure 2. The BayernAtlas is also available online. For our virtual environment, however, we often need several different products, which are also available in different data formats.
Orthophotos have different topicality, are available in different resolutions (cm/px) and dimensions, and are offered in true colors (RGB) or in infrared (CIR) color. Today, there are different technologies available to create georeferenced digital terrain models. Photogrammetry uses different methods to generate three-dimensional data from 2D images (mono-plotting, stereo imagery interpretation, multi-imagery block adjustment). Three-dimensional and georeferenced point clouds are generated by different laser scanning methods (LIDAR). Airborne laser scanning (ALS) of airplanes or satellites, terrestrial laser scanning (TLS) or mobile laser scanning (MLS) are used.
These digital terrain models are offered by LDBV in different grid widths (25 m, 5 m, 1 m). Furthermore, 3D building data is contained in the official real estate cadastre information system (ALKIS®). It also contains the digital cadastral map (DFK), the automated real estate register (ALB) and information on soil estimation and actual use. Moreover, 3D building data is available in various degrees of detail (LoD2/LoD1), accuracies (5 m/1 m), sizes (tiling) and data formats. The OpenData Bayern site provides various data on statistics, population and geography in various data formats, including, for example, cycle paths or hiking trails as 2D surface files in Shapefile format.
4.2. Projection Methods and Georeferencing
Depending on the type of projection, there are different so-called map net drafts or map illustrations. In the past, for example, the Gauss-Krüger coordinate system was used in Germany and Austria. Since 2019, the Bavarian Surveying Authority has been using the European Terrestrial Reference System 1989 (ETRS89) with UTM (Universal Transverse Mercator Projection) as the new official reference and mapping system [
32]. Official survey data always refer to one of these reference systems. Often the World Geodetic System 1984 (WGS84) is also used. Before merging the survey data in a GIS application, it must be clarified to which reference system the data refer. According to the reference system, the software parameters must be set and adjusted in the central GIS application. These basic settings enable the correct export and the correct integration of the exact georeferenced representation into interactive 3D real-time applications.
4.3. Proprietary Pipeline for the Integration of Survey Data
Simon [
20] describes a proprietary production pipeline for a mixed-reality application using the ESRI CityEngine and ArcGIS, FME and Global Mapper as shown in
Figure 3. The output device is a mobile end device (smartphone, tablet). The game engine Unity and the software Vuforia were used for development. The final application is interactive, but unfortunately the data are not georeferenced in the virtual world.
The first step consists of importing and merging the different data formats on separate layers in a central GIS application (e.g., ESRI CityEngine). Some data formats (e.g., CityGML, ASCII) must be converted beforehand or imported via special suites (e.g., ArcMap/ArcGIS, FME, Global Mapper). The data are georeferenced and sorted accordingly and can then be edited and prepared in the GIS application. The data from each layer can then be exported individually in FBX format directly into the game engine (e.g., Unreal Engine or Unity).
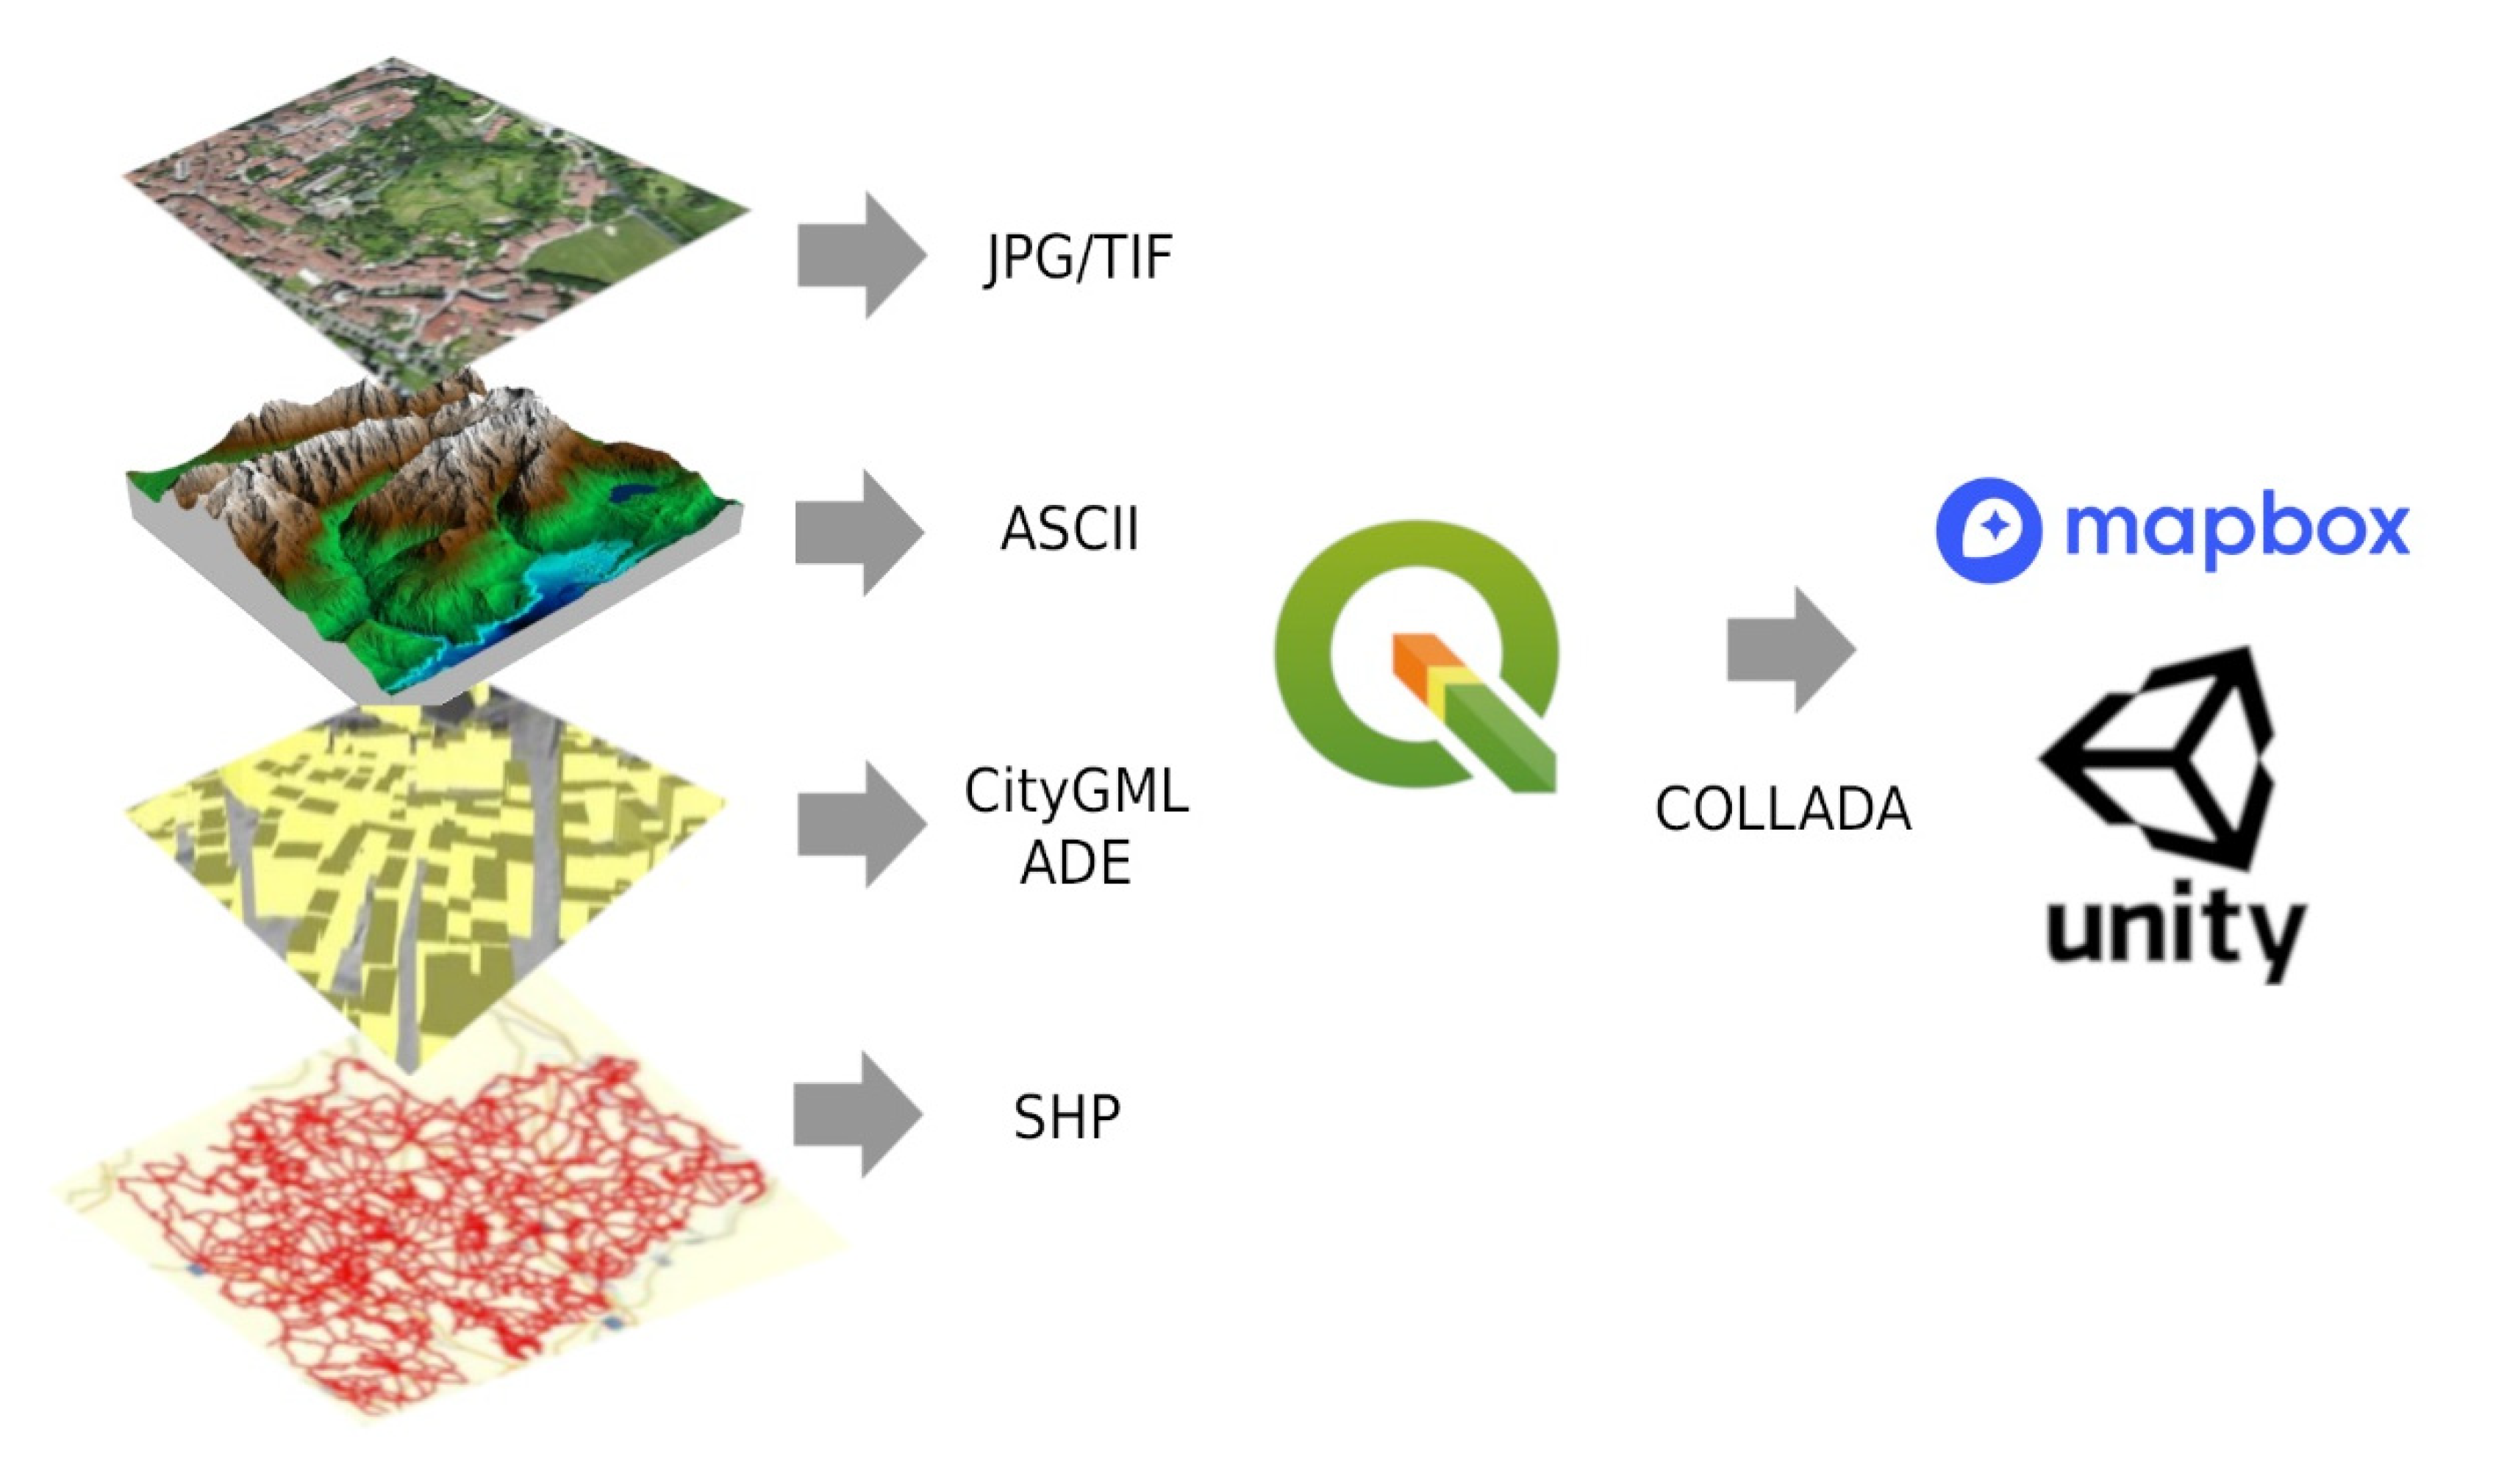
4.4. Open Source Production Pipeline for xR-Technologies
Analogous to the proprietary workflow by Simon [
20], this work develops an alternative and improved open-source workflow as shown in
Figure 4. This workflow should be suitable for small and medium-sized companies, and considers the advantages of integration capability with other planning tools, efficiency and operability, without special programming knowledge.
The central element is the free open-source geoinformation system QGIS. It is there that all official survey data are collected and georeferenced. Digital orthophotos can be easily imported using the standard data formats JPG or TIF. The digital terrain model is imported directly via the ASCII format. The CityGML import of the 3D building data into QGIS is possible in several ways. Currently, several plug-ins are documented [
33]. Especially interesting is the integration of the CityGML Application Domain Extension (ADE). It describes a built-in mechanism of CityGML to extend the data model with additional concepts required for specific use cases [
34].
This allows a simple and standardized import of 3D building data into QGIS without the detour of another software application. Path networks and boundaries can also be imported directly as shapefiles into QGIS without any further detour. To transfer all data georeferenced into a game engine, two further steps are necessary. From QGIS, the data can be transferred directly into the game engine unit with the plugin QGIS2threejs in the open file format COLLADA. The Mapbox SDK for Unity enables the exact georeferencing of official survey data into the game engine.
5. Conclusions
The proprietary production pipeline requires three central software packages (ESRI CityEngine with ArcGIS, Global Mapper, FME) and a game engine (Unity or Unreal Engine). Six different data exchange formats are involved in the entire process (JPG, TIF, ASCII, CityGML, SHP, FBX). The open-source workflow only needs a central software package (QGIS with QGIS2threejs PlugIn) and a game engine (Unity with Mapbox SDK). Five different data-exchange formats are required (JPG/TIF, ASCII, CityGML ADE, SHP, COLLADA). The CityGML ADE enables the definition and development of a standard for the exchange of 3D building data at the city level. It extends the CityGML standard with specific features and properties that are necessary to perform these special processes. This possibility therefore offers an interesting approach for the further standardization and automation of the exchange of 3D building data in interactive GIS applications. The open-source workflow is less time consuming and requires less specialized software and programming knowledge. In contrast to the proprietary workflow, the open-source workflow also enables the exact georeferenced 3D real-time display in game engines. Unfortunately, the Unreal Engine does not yet offer a comparable SDK for georeferenced display.
Last but not least, final products and further developments can be very interesting. Currently, virtual interactive 3D applications in the construction sector are mainly used in two areas—on the one hand, for internal project development and for three-dimensional planning together with the specialist engineers and, on the other hand, to present the project to customers, the client and to the public. In the foreseeable future, however, these two areas will be expanded to include building construction itself, quality control and sustainability of projects. Moreover, it is precisely in these areas that we can eagerly expect further interesting developments in the coming years.
The aims of this research were to find an open-source workflow for project preparation, software installation and hardware setup. Thus, this paper should form a solid basis for decision making and further software development. A sample implementation was intended for a future project. Unfortunately, this issue was beyond the scope of this paper. Furthermore, the graphical quality of the final results of both production pipelines therefore cannot be compared in this paper. Future studies will provide a detailed time/cost comparison for the implementation of the presented workflows, as expected from the perspective of an enterprise. These studies will also cover issues such as usability, graphical quality and performances on different devices, including georeferencing errors, and show detailed results of a sample implementation. Finally, the APITs networking matrix was found by our clients to be very assistive in finding matching partners for project setup and development preparation.


