Article

A Personalized Heritage-Oriented Recommender System Based on Extended Cultural Tourist Typologies

by
Markos Konstantakis
*,
Georgios Alexandridis
and
George Caridakis
Intelligent Interaction Research Group, Cultural Technology Department, University of the Aegean, 81100 Mytilene, Greece
*
Author to whom correspondence should be addressed.
Big Data Cogn. Comput. 2020, 4(2), 12; https://doi.org/10.3390/bdcc4020012
Submission received: 25 April 2020 / Revised: 26 May 2020 / Accepted: 29 May 2020 / Published: 4 June 2020
(This article belongs to the Special Issue Big Data Analytics for Cultural Heritage)

Abstract

:
Recent developments in digital technologies regarding the cultural heritage domain have driven technological trends in comfortable and convenient traveling, by offering interactive and personalized user experiences. The emergence of big data analytics, recommendation systems and personalization techniques have created a smart research field, augmenting cultural heritage visitor’s experience. In this work, a novel, hybrid recommender system for cultural places is proposed, that combines user preference with cultural tourist typologies. Starting with the McKercher typology as a user classification research base, which extracts five categories of heritage tourists out of two variables (cultural centrality and depth of user experience) and using a questionnaire, an enriched cultural tourist typology is developed, where three additional variables governing cultural visitor types are also proposed (frequency of visits, visiting knowledge and duration of the visit). The extracted categories per user are fused in a robust collaborative filtering, matrix factorization-based recommendation algorithm as extra user features. The obtained results on reference data collected from eight cities exhibit an improvement in system performance, thereby indicating the robustness of the presented approach.

1. Introduction

In recent years, user adaptive systems have become popular in many application areas, including the cultural tourism domain, which is nowadays recognized as one of the most important forms of touristic traffic. The proliferation of user-adaptive recommender systems (RS) in this area is growing rapidly, since cultural tourism is an activity strongly related to the personal desires and interests of visitors [1]. The large number of resources and data available online have resulted in the fast dissemination of cultural information, but, on the other hand, they have also contributed to the problem of information overload; that is, the difficulty in identifying those resources best suited to each individual’s needs.
Therefore, managing these voluminous resources with principles and techniques pertaining to big data analytics, in an effort to offer suitable and personalized support to visitors, constitutes one the most interesting challenges in this research field. In this sense, it is of vital importance to be able to segment cultural tourists, taking into account their whole cultural experiences. However, although cultural tourism shows remarkable growth and popularity, little research has been done to categorize cultural tourists by integrating both their cultural centrality (e.g., cultural motivation, importance of culture in the decision to visit) and depth/levels of cultural experience [2,3,4].
In light of the above, further interest in studying cultural tourism and its participants has been developed, as they exhibit their own distinct characteristics. It is an indisputable fact that experiencing cultural assets plays an important role in motivating a person’s travel decisions. Nevertheless, cultural tourism destinations require a more precise categorization of their visitors and their underlying motivations, since not every person is motivated by the same reasons for learning, experimenting or self-exploring. Because of this assumption, that cultural tourists are not alike, most of the literature in cultural tourism follows a segmentation approach, giving emphasis in determining the typology of the cultural tourists [5]. Consequently, McKercher [6] developed a relevant typology by addressing two fundamental dimensions; cultural centrality and depth of user experience. The aforementioned typology provides a useful and functional framework for segmenting cultural tourists and has been further tested and employed in subsequent empirical studies [7,8].
Recommender systems are a key technology in addressing the concerns outlined above and assist travelers in making optimal decisions. In principle, a well-designed and effective RS can help a cultural visitor in exploring, comparing and choosing the most interesting destinations that fit his/hers preferences and needs. Most modern RS operate by modelling both potential visitors and destinations; that is, by studying past interactions of their users and the places they have visited, along with explicit preferences, usually expressed on a rating scale. In order to provide users with personalized recommendations, RS eventually select the most relevant destinations that match with the modelled user’s profile. Therefore, user profiles are an important RS component, playing a key role in its effectiveness [9]. In this sense, any additional information relevant to each user’s taste is expected to further improve the quality of the recommendations.
In this regard, the main goal of this work is the enhancement of the user profiles built by cultural RS through the incorporation into them of additional information regarding the cultural tourist type, as assessed by the McKercher’s framework. More specifically, this work extends collaborative filtering matrix factorization algorithms, considered to be the state-of-the-art in RS, through the inclusion of the each user’s cultural profile in the factorization process, as obtained by the aforementioned framework. To the best of our knowledge, our work is among the first to address cultural recommendations in this dimension, while the outcome of this study provides a better understanding in the areas of segmenting, profiling and recommending for cultural tourists. The rest of this paper is organized as follows; Section 2 presents a literature overview of cultural tourism, visitor profiles and recommender systems. Section 3 outlines the proposed methodology, while Section 4 presents the data used in the experiments. Section 5 discusses obtained results and finally, the work concludes in Section 6, where some general remarks are made and possible future directions are also considered.

2. Literature Review

Cultural tourism is a type of tourism particularly relevant to a destination’s culture and more precisely with aspects such as the lifestyle, history, arts, architecture, religion, heritage and other related elements. Travellers who participate in this form of activity, by visiting cultural places and organizations are considered to be “cultural tourists” [10]. Of course, this definition is too broad; indeed, all tourists may be involved in cultural activities, in one way or another. For this reason, several studies examine the heterogeneous nature of cultural tourists, proposing various typologies and segmentations [11].
Niemczyk [12] considers cultural tourism as a type of travel from a person’s area of residence during vacation, for a period of time not more than 12 months. This involves the individual being aware, to some extent of the place of visit, in which culture (the core element of the tourist experience) plays a significant role when planning the journey. A number of studies [13,14,15] indicate that cultural tourists tend to be better educated and older than the general travelling public. Additionally, they stay longer in a particular area, participate in travel activities more often than other categories of tourists and spend more money in the places they visit [13]. Women constitute an important part of this type of tourism [15], while cultural travellers are more likely to use a variety of sources to gather information when planning trips [14].
Specialized literature attempted to classify tourists on the basis of their chosen activities, motivations, lifestyles and depth of experience. Stylianou-Lambert [10] tried to explain the differences between cultural tourists in art museums, interviewing participants from Cyprus. De Simone [16] studied the relationship between tourist typologies and heritage tourist attitudes, based on demographics, travel behavior, experience and satisfaction. Nguyen [8] categorized heritage tourists in Vietnam, using a questionnaire survey with two basic variables; the importance of cultural tourism in the decision to visit a city and the depth of cultural experience. Also, Konstantakis [17,18] proposed two different methodologies; CURE and REPEAT. The former identifies and extracts cultural user personas by eliminating the requirement of explicit user input, while the latter processes implicit data from users’ mobile devices and explicit data from users’ answers into a questionnaire, in order categorize each visitor and assume the personalization level that fits his/her interests better.
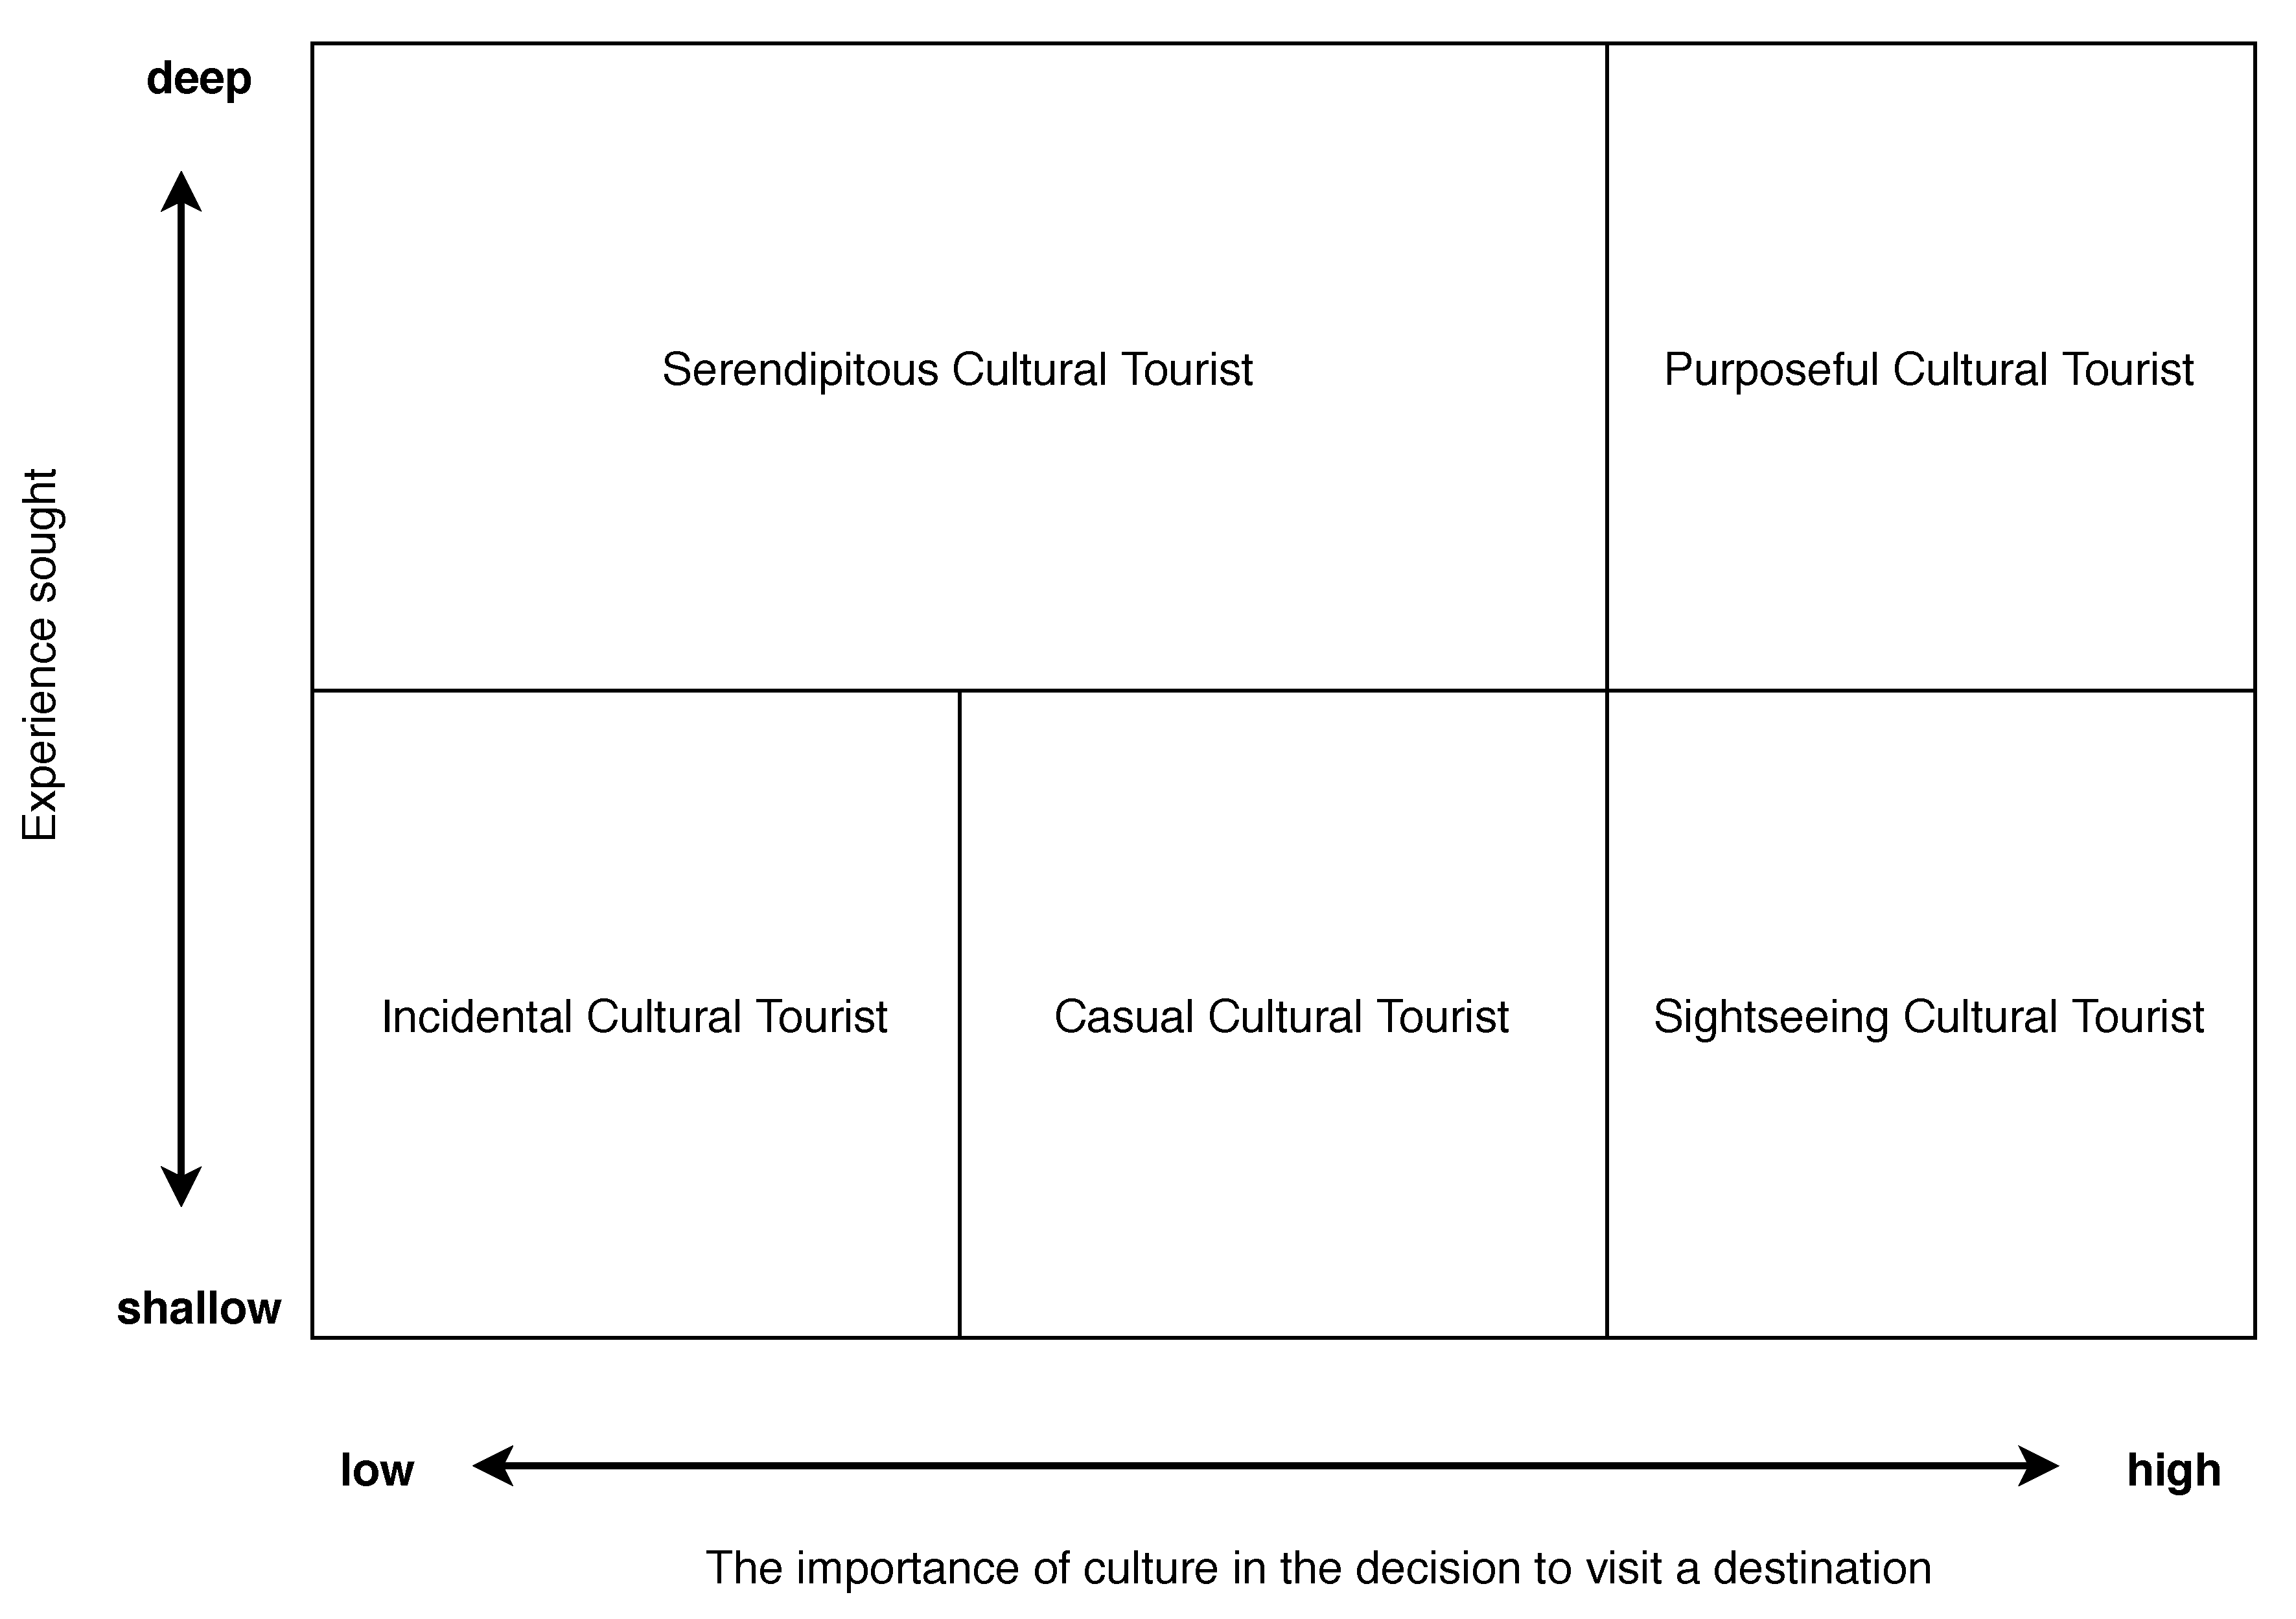
Meanwhile, McKercher [11] developed a cultural tourist typology addressing two dimensions; the centrality of cultural tourism and the depth of cultural engagement, thus providing a useful and functional theoretical framework [4], which has been further tested [11] and employed in subsequent empirical studies. Taking into consideration the importance of cultural heritage in the final decision to visit a destination and the experience the user is seeking, McKercher distinguishes five types of tourists (Figure 1):
  • The purposeful cultural tourist, for whom the main purpose of visit is gaining knowledge of another place’s culture. Learning the cultural heritage of a place is an important reason to visit a destination and this kind of approach creates a deep cultural experience.
  • The incidental cultural tourist, for whom culture does not play any role in the decision to visit a particular cultural destination and even though s/he might visit one, his/her participation in cultural events is minimal.
  • The serendipitous cultural tourist, for whom culture plays little or no role in the decision to visit a particular cultural destination, but if s/he finds himself/herself in one, his/her participation in cultural events is maximal, resulting in a deep cultural experience.
  • The casual cultural tourist, whose focus on cultural matters is of little importance when planning to travel, and even in the event of encountering cultural activities, their cognitive impact is rather shallow on him/her.
  • The sightseeing cultural tourist, who desires to gain knowledge about the culture of another place, but in reality his/her visit is of a rather loose nature, focused on entertainment [12].
Furthermore, Kantanen and Tikkanen [19] were based on McKercher’s typology to examine the impact of cultural tourism on visitors’ perception processes concerning cultural attractions. Finally, Vong [7] examined the cultural tourist typologies in Macau pertaining to an urban game, by employing McKercher’s typology through a questionnaire survey in visiting tourists.
To date, only a handful of studies have attempted to examine cultural tourism experience and the technological impact from a holistic point of view. The integration of information & communication technologies (ICT) has benefited the promotion of cultural experiences. With the development of new technologies, modern types of tourist activities are growing, which are capable of transforming and augmenting cultural tourism experience in a higher level. These new augmented experiences are expected to increase user engagement, allowing technology to function either as a mediator or as the core experience itself [20].
A key element for the introduction of ICT in the cultural heritage domain is the perceived user experience (UX). Cultural institutions should consider that their visitors come from different backgrounds and have mixed expectations during their visits. Their engagement with the exhibits or ICT also varies. Therefore, it is of major importance to be able to understand and adapt the technology in order to offer a meaningful experience to visitors. Cultural spaces should adjust the use of traditional ways of presenting exhibits to a more relevant way, in line with technological changes, whether by using more effective digital media or interactive exhibits [21].
In this regard, RS are one of the principal ways of delivering personalized content to the visitors of a destination. RS are software systems that try to model their users’ unique taste, based on the interactions the latter have with the places they visit [22]. This interaction is typically multimodal; it might be explicit, when a user actively evaluates a place s/he visits and/or implicit; when the interaction between a visitor and a place is deduced by the system itself. In the first case, user opinion might be expressed in a number of ways; e.g., through ratings on a predefined scale (like/dislike, 5-star system, etc.), through answered questionnaires or even through free-form text (comments, etc.). In the latter case, user preference is extracted from his/her actions; e.g., visiting/“checking-in” a place or taking photos. Of course, the former type of interaction is highly desired because it is more closely related to the actual taste of the visitor. However, it requires a high level of user engagement in order to be efficient, which, obviously, cannot be guaranteed for every potential user.
Recommender Systems can be incorporated in the cultural domain in a number of ways. Their most widespread application is probably in proposing places to visits, known as points of interests (POIs), in the form of a ranked list. POIs may range from geographical areas and cities to particular places within a city [23] or even specific locations within a cultural heritage site, such as an archeological site or a museum [24]. An extension of the aforementioned systems are RS that recommend paths or travel routes; in this case, the route is modelled as a sequence of spatially correlated POIs to be visited in a pre-defined order. Again, the route may involve a broad geographical area of POIs that are many kilometers apart, locations within a city [25] or even exhibits within a constrained heritage space (museum, cultural site) [26]. Apart from proposing spatially correlated POIs that are of interest to their users, path RS are also usually bounded by the route itself; in total duration and/or distance. Finally, cultural RS may also be used to suggest experiences, such as activities and events.
In this work, a cultural RS that produces a list of suggested POIs to visit is going to be outlined. The proposed system is going to model implicit user interactions, as this type of data are more robust and can be obtained in an unobtrusive manner, that does not affect the overall UX. In order to produce more efficient recommendations, users are going to be profiled according to their cultural persona type, based on additional variables (apart from centrality and depth of experience), such as frequency of visits, visiting knowledge and duration of the visit. The proposed cultural typology differs from the previous works and provides an enriched information system which, in turn, is going to be fused in the recommendation process, as it shall be described in more detail in the subsequent section.

3. Methodology

In this section, the various components of the proposed approach are discussed, starting with the cultural tourist typology (Section 3.1). Then, the proposed methodology of extracting user personas through questionnaires is outlined (Section 3.2). Finally, details about the implemented RS and the way user personas are incorporated in the recommendation processes are presented in Section 3.3.

3.1. Cultural Tourist Typology

A brief critical assessment of the various cultural tourist typologies reveals that the majority of them do not conform to the behaviors of today’s travelers who, especially when it comes to young ages, organize and often experience their journey with a focus on new technologies and the online social media networks. Equally important is the fact that most typologies do not take into account the reality that travelers often “move” between different typologies, depending on their available time, income, health, family and other obligations. It is also regularly overlooked that decisions concerning a destination are the result of a compromise between the various members of the holiday team (relatives and/or friends).
A modern typology is therefore necessary, taking into account the complex modes of behavior encountered in the socio-economic realities, particularly for cultural travelers. In addition, since the experiences that make up each trip vary, special emphasis should be placed on the opportunities offered by cultural tourism for travelers to embrace different social roles or to enhance their social status and on the importance that tourists themselves attach to their journey in relation to the characteristics of their everyday lives. As it is practically impossible to devise a typology that would reflect the behavior of all travellers, it should be pointed out that, in general, interpretations occasionally proposed for travelers’ motives lead to the conclusion that cultural tourism allows escaping from an existing situation or facilitating the search for another reality. For this reason, and after a thorough study of the relevant literature, this work adopts the McKercher typology [6] of cultural tourists, which is also supported by a number of studies outlined in Section 2.

3.2. Proposed Methodology

The difficulty in building a broadly accepted and valid methodology for determining the number of cultural tourists and the correlation they have with cultural heritage in order to create a RS, is one of the key challenges of this research. Moreover, the main objective is not to devise a new methodology, but to help make suitable suggestions instead, by using tools which are widely applied in academic and research studies, but are often neglected in the cultural management field [27]. However, prior to grouping cultural tourists, there must first be a systematic technique and a very basic questionnaire with information related to socio-demographic data, motivation and behavioral intentions. On the other hand, in order to determine the different types of users and the degree of their cultural attitude, a simple matrix can be created to relate the different variables (activities, duration of stay, purpose of travel etc.).
More specifically, for indoor cultural destinations, where entry and departure can be monitored, various types of tools and technologies (surveillance cameras, GPS and Bluetooth devices, sensors, beacons) can be employed, allowing the verification of the exact number of cultural visitors and the immediate observation of their effective behavior. Therefore, it is possible to determine the relationship these tourists have with the visited space; that is, the duration of their stay, the time spent in each room or area of the visiting cultural place, most attractive artifacts, attitude and interests [28]. However, for outdoor cultural destinations where there are no means of monitoring entry and departure, direct observation is difficult to implement. In such cases, the most suitable solution, despite its limitations, is the questionnaire.
Consequently, in this research, a questionnaire has been used for collecting data related to the issues raised above, from a sample of N = 200 respondents, chosen randomly after completing their visit to the new Acropolis Museum, between 18 February and 25 February 2020. Respondents were approached and asked by the researchers to fill in the questionnaire, providing information on their visits to heritage sites, as well as other relevant information regarding their trip, while interviewers stayed nearby to answer any possible questions the participants might have had. The questionnaire, available in Appendix A, was implemented with close-ended questions and the responses are summarized on Table 1. The questions pertained to three distinct aspects, as outlined below:
  • The tourists’ socio-demographic characteristics (age, gender, level of education, occupation).
  • Information regarding the visit to cultural heritage destinations, such as previous visits, travel motivation, perception of the destination, activities they participated in during their visit, other places they plan to visit during their trip and their willingness to stay longer or to revisit the cultural destination.
  • Information regarding the two dimensions, centrality and depth of user experience, suggested by the model of cultural tourist classification of Section 2 and additional data for the three variables governing cultural visitor types, which have been proposed in our research for categorizing cultural heritage tourists (frequency of visits in a cultural destination—visiting knowledge of the cultural destination—duration of the visit during a cultural trip).
Based on the responses, analysis of variance (ANOVA) tests have been performed in order to evaluate the time spent in tourist activities among the McKercher’s cohorts [4,7]. Our findings indicated that there were distinct differences between tourists with respect to their cultural profile and activity engagement. At the same time, further variables emerged outside of centrality and depth of experience, such as frequency of visits (first time—frequent—infrequent variable), long stay—day trippers and previous cultural space knowledge (no search—little search—very extensive search). Those variables, displayed on Table 2, are at the core of our efforts to create an enriched cultural tourism typology.
Previous studies [29,30] have suggested the length of stay in a cultural destination is related to the activities tourists engage in. In our questionnaire, this variable is determined by the question “How long did you stay in a cultural destination?”, where respondents answered “() Day(s) / () Night(s)”. The analysis of the responses indicated that the average length of stay was 7.5 nights during a cultural visit. Based on this observation, the numeric responses have been collapsed into four categories: (i) short stays (1–4 days), (ii) medium stays (5–10 days), (iii) long stays (11–17 days) and finally, (iv) exceptionally long stays (over 17 days). Additionally, participants were asked how many different sites do they visit on average during a trip to a cultural destination (Appendix A). The responses to this question helped determine the depth of their cultural engagement and those two variables (length of stay, number of experiences) helped determine the degree of cultural centrality, according to Table 3.
According to McKercher’s typology (Section 2), the purposeful cultural tourists are those for whom the cultural profile of a place played a strong reole in their decision to visit a destination, thus resulintg in a high cultural centrality and reception ( the highest ranking among other profiles and visitor types). Likewise, in sightseeing cultural tourists, culture played an important role in their travelling motivation, but in the end, their resulting cultural experience was of low depth. Casual cultural tourists exhibit a moderate level of cultural centrality and depth of experience. For the serendipitous cultural tourists, even though the cultural centrality had been limited at the beginning of their journey, they ended up visiting cultural destinations and gaining a fairly deep level of experience. Finally, the cultural centrality of incidental cultural tourists had been very limited and their cultural experience was moderate [12].
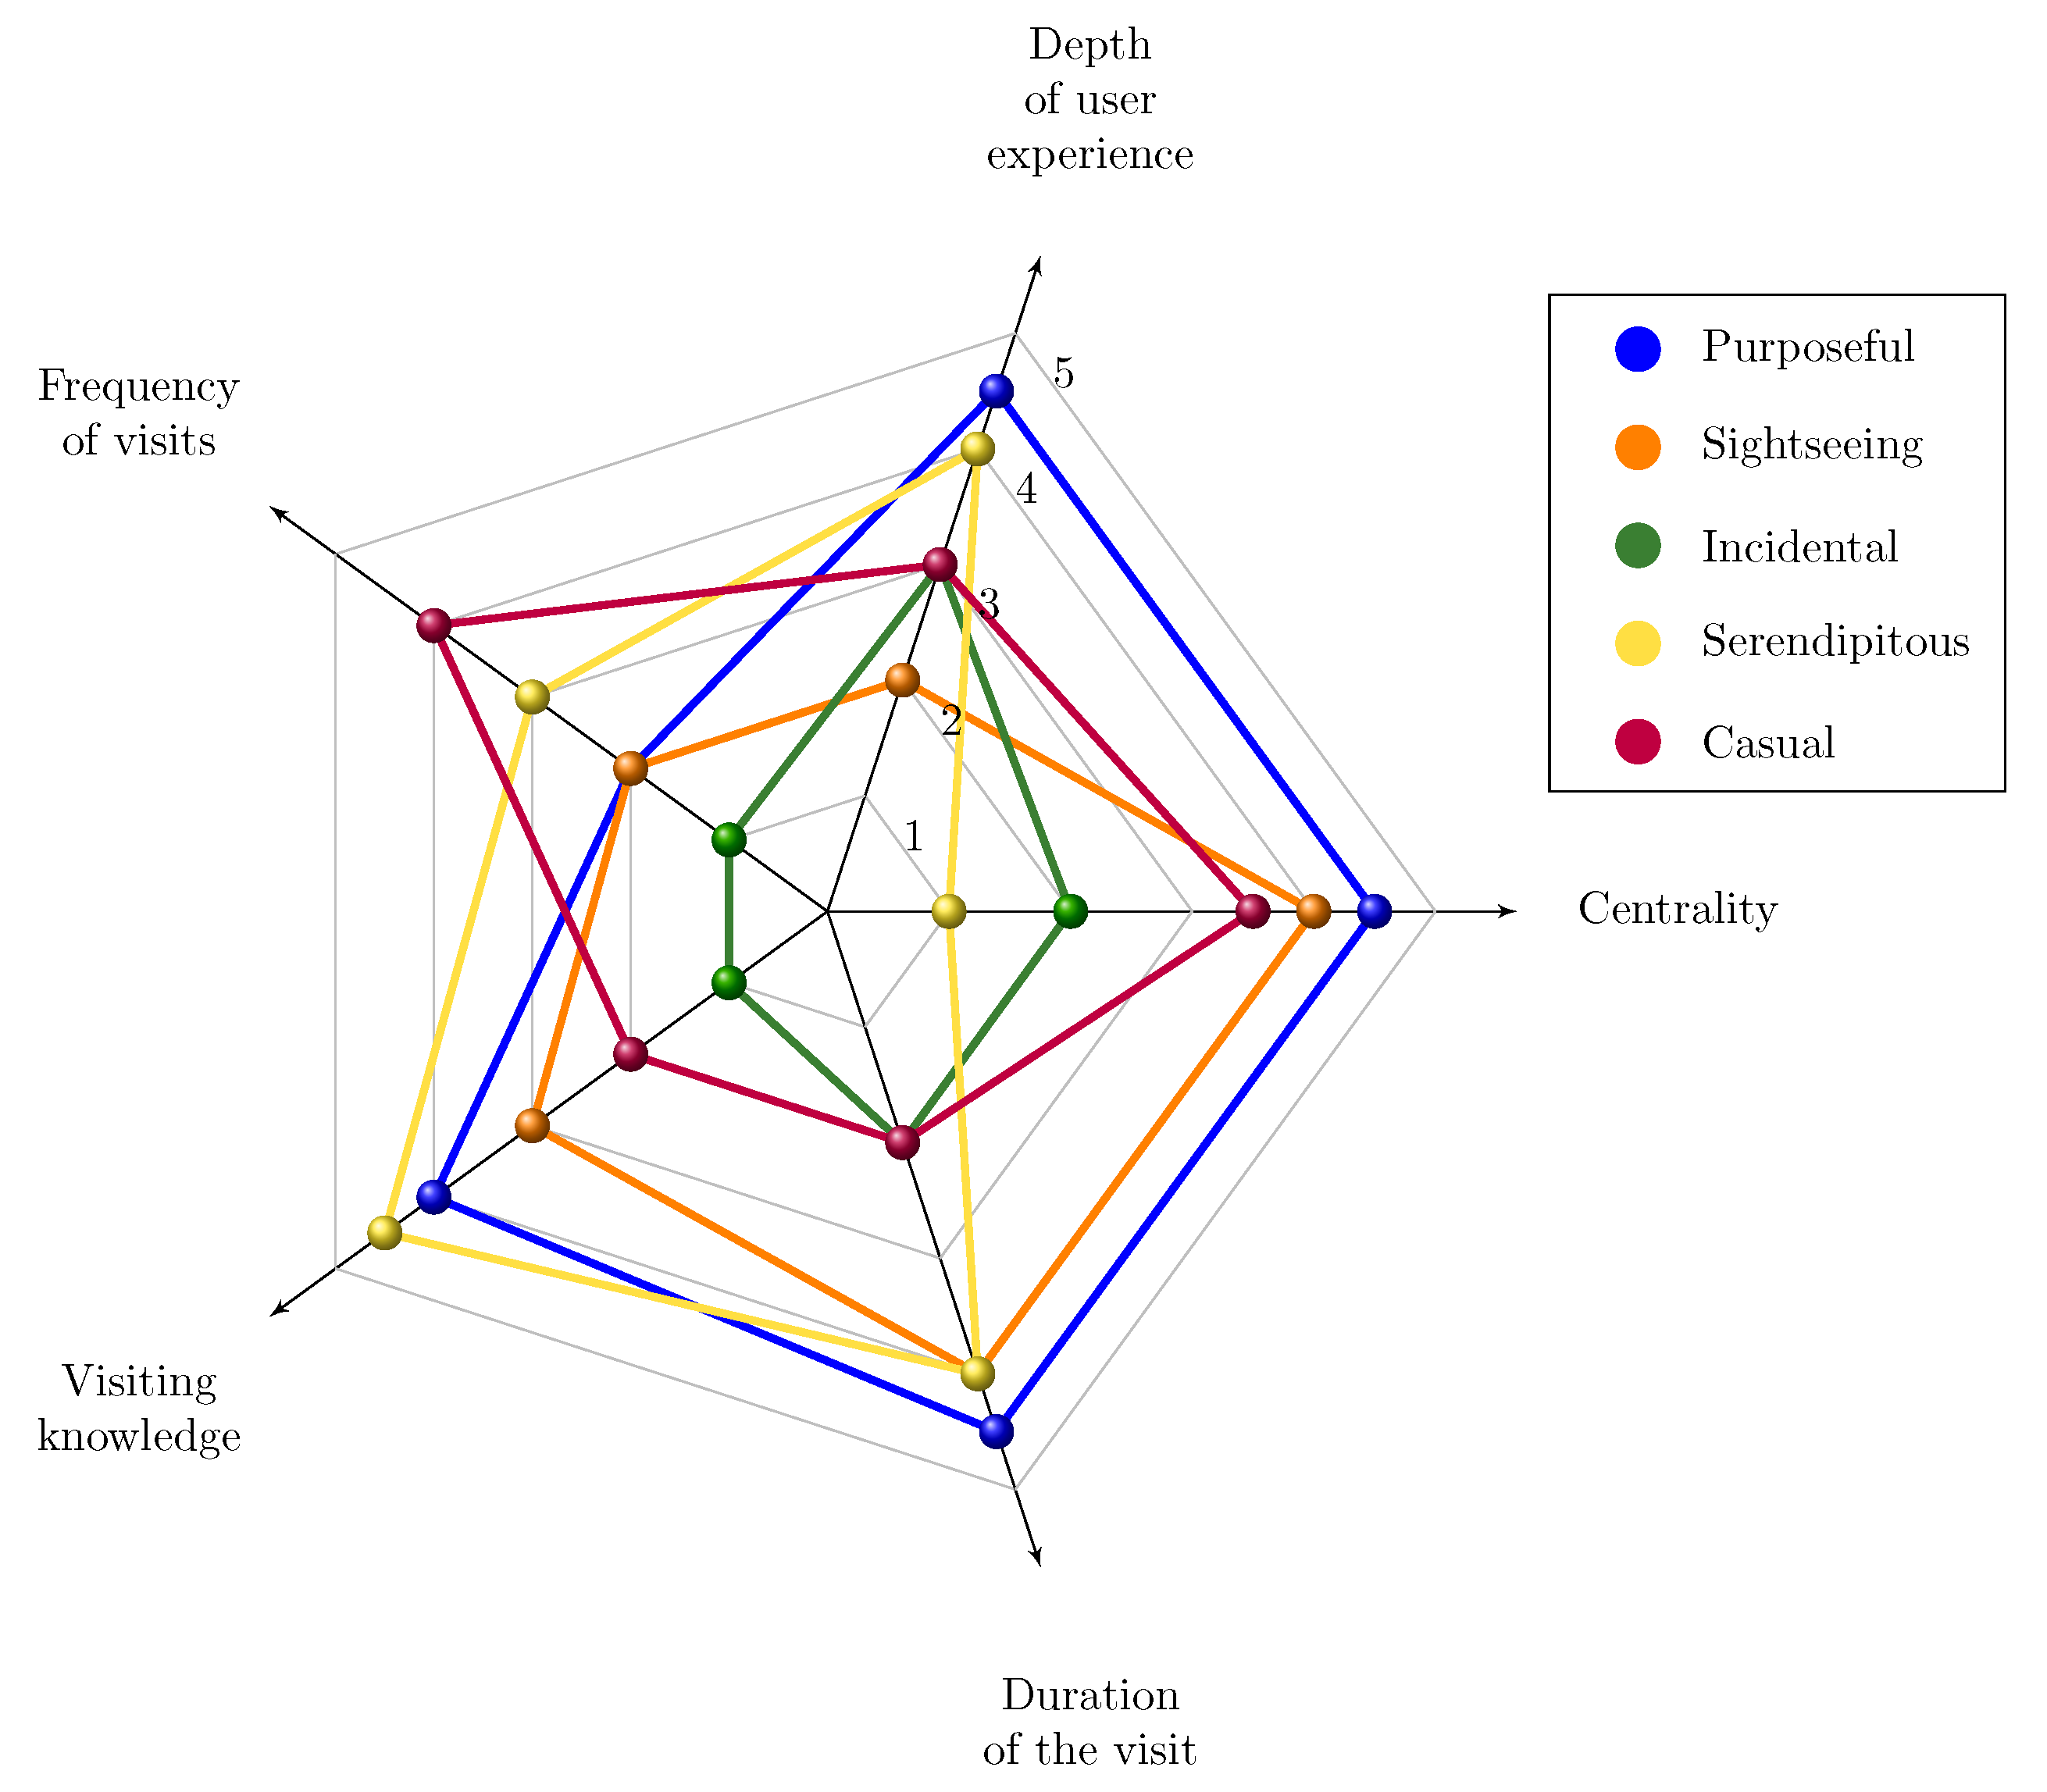
Relevant studies [4,6,7,12] indicate that purposeful and serendipitous cultural tourists conducted extensive research regarding the cultural space prior to arrival (visiting knowledge), compared to the other cultural group types. Casual tourists also seem to visit more destinations (high rate) than others types of tourists (frequency of visits). On the contrary, incidental tourists travel less than the other categories (low rate). Regarding the duration of the visit in a cultural destination, purposeful tourists indicated that they were willing to stay longer (high rate), while casual and incidental tourists had the lowest rate. Concerning general information on a cultural space, as a matter of fact, serendipitous and purposeful tourists conducted extensive information search about the destination prior to arrival (high rate), while the numbers in the other groups were less than 50 % (medium and low rate). Considering the nature of the item measurement, a mean value in [ 1 , 2 ] has been considered to be low, ( 2 , 4 ) medium and [ 4 , 5 ] high. These findings are summarized on Table 4 and on the Kiviat diagram of Figure 2.

3.3. Recommendation System

Having fixed the cultural user typology (Table 4 and Figure 2), it is necessary to fuse it to the cultural POI RS. In principle, the most robust RS algorithms are model-based, collaborative filtering (CF) matrix factorization (MF) techniques [22] and for this reason they have been chosen in this work. At the heart of CF MF approaches lies the interactions matrix M, which is also known as the ratings’ matrix when explicit feedback is provided by the users (Section 2). M is an n × m positive semi-definite, each row of which represent one of the n users of the system (in this case, the cultural visitors) and each column of which represents one of m the available items to be recommended to users (in this case, the cultural POIs). The  ( i th , j th ) defined element of M captures the interaction between visitor i and POI j, either explicit or implicit. In reality, interaction matrices are extremely sparse, usually having less than 1 % of their elements defined.
MF techniques analyze the large sparse matrix M into two denser ones of lower dimensionality (Equation (1)), the  n × f user feature matrix U and the f × m item feature matrix I, so that
M U . I
and f n , m . The  i th row vector of U, whose dimensionality is f, encodes the preferences of user i expressed in M, while, similarly, the  j th column vector of I, whose dimensionality is again f, encodes the evaluations item j has received in M. The extend to which unseen POI k is of interest to visitor i is quantified by computing the dot product of the respective vectors (Equation (2))
p i , k = u i . i k
MF-based CF RS that recommend POIs compute Equation (2) for all unseen items around the vicinity of user i and return a ranked list of the l items with the largest value, which are, according to the RS, those POIs that would maximize visitor’s i satisfaction.
There is an abundance of techniques and approaches in the RS literature that compute the MF of Equation (1). In this work, the methodology of choice has been LightFM [31], for a number of reasons. Firstly, it can cope with cold-start recommendations; that is, it is able to recommend POIs to new users that have not any recorded interactions in matrix M, yet. This group of visitors is of extreme importance, as it represents cultural tourists that visit a place for the first time and they want to get accurate recommendations. The cold-start problem may also affect POIs, in the sense that a new event or exhibition might occur within a given place and therefore the RS should be able to recommended to the appropriate audience. Secondly, LightFM implements a robust MF scheme that supports both explicit and implicit user evaluations. Finally, LightFM is a hybrid MF algorithm, in the sense that it supports the inclusion of additional user and/or item features in the factorization process. In this case, the additional user features to be considered are those of Table 4; the extent to which each visitor to any of the five cultural tourist types discussed in Section 2.
In our adaptation of the LightFM model, the user features u i are extended with user metadata in the form of the computed cultural profile c i for each visitor, which is a 5-dimensional vector, one for each variable (column) of Table 4. Therefore, the extended user vector q i = [ u i , c i ] is the concatenation of u i and c u . System prediction for the i , k pair (Equation (2)) is now given by Equation (3) below
p i , k = f ( q i . i k + b i + b k )
where b i , b k are the scalar bias terms for the user and item latent vectors, respectively. f is a non-linear function that smooths predictions. In our model, we have chosen the sigmoid function. The latent user and item vectors are approximated through maximum likelihood expectation, using asynchronous stochastic gradient descent [32].

4. Experiments

In this section, the experimental procedure used to evaluate the effect of the proposed approach is described in detail. Initially, the selected dataset is presented in Section 4.1, along with its peculiarities and characteristics. Then, the preprocessing steps necessary for extracting the user personas (Section 4.2) are reasoned upon.

4.1. Dataset

The dataset selected for the experiments is the Flickr User-POI Visits Dataset [33,34] (Table 5). It consists of a set of users and their visits to various POIs in eight different cities, spanning three continents. It has been derived from the currently unavailable (as of writing) Yahoo Flickr Creative Commons 100 Million (YFCC100M) Dataset [35]. The visits ensue from the geo-tagged and timestamped photos uploaded to the Flickr Image Hosting platform by its users.
Every entry in the dataset is comprised of a photo identifier (photoID), a user identifier (userID), the date taken (in UNIX timestamp format), a place identifier (poiID), the category of the POI (e.g., Park, Museum, etc.), the total number of photos taken on this POI by all users of the dataset (poiFreq) and finally the travel sequence number. This number groups consecutive POI visits by the same user that differ by less than 8 h, as one travel sequence. Since on a particular visit to a POI, the visitor usually takes more than one photographs, the total number of visits (4th column of Table 5) is derived by counting the unique combinations of userID, photoID and travel sequence number. Finally, the dataset also contains the list of POIs, their name, their exact geographical coordinates, their category and the distance (in meters) in-between them.
Table 6 summarizes all 171,208 photographs in the dataset, grouped by POI category. As it might have been expected, the number of photographs is not evenly distributed in-between the categories, as certain landmarks within each city are much more likely to be visited and photographed, than others. In particular, the POI category distribution in the dataset follows a power law, with the four most popular categories (Historical, Cultural, Museum and Structure) accounting for more than half of the total number of photos taken.
Prior to proceeding with the construction of the cultural tourist typologies, based on the presented dataset, an important decision needs to be made; which POI categories contribute to the cultural experience of a tourist and which do not. For certain categories the decision is rather straightforward; for example, visits to POIs labelled as Historical, Cultural or Museums definitely strengthen the cultural experience of the visitor. The opposite can be said for some other categories like Precinct, Transport or Shopping; these POIs can add virtually nothing to the overall cultural experience. Other categories are harder to decide upon, with the final assignment being open to debate, like Structure, Sport, Religion or Amusement. For those “intermediate” cases, the respective POIs have been examined one-by-one prior to deciding whether the category in-question is to be assigned to the Cultural or Non-cultural destination class. Table 6 displays the final members of the two classes of POI categories, with the majority of the photographs belonging in the Cultural class (102,100 or 66.64 % ).

4.2. Pre-Processing

Table 2 summarizes the 5 variables that are used to determine the cultural tourist type (Table 4 and Figure 2). Out of those variables, only the depth of the user experience cannot be determined from the dataset at hand. Therefore, for the rest of the experimental procedure (and the rest of this paper), this dimension is going to be omitted in the respective estimations and the cultural tourist type is going to be determined based on the other four; that is (i) centrality, (ii) frequency of visit, (iii) visiting knowledge and (iv) duration of the visit.
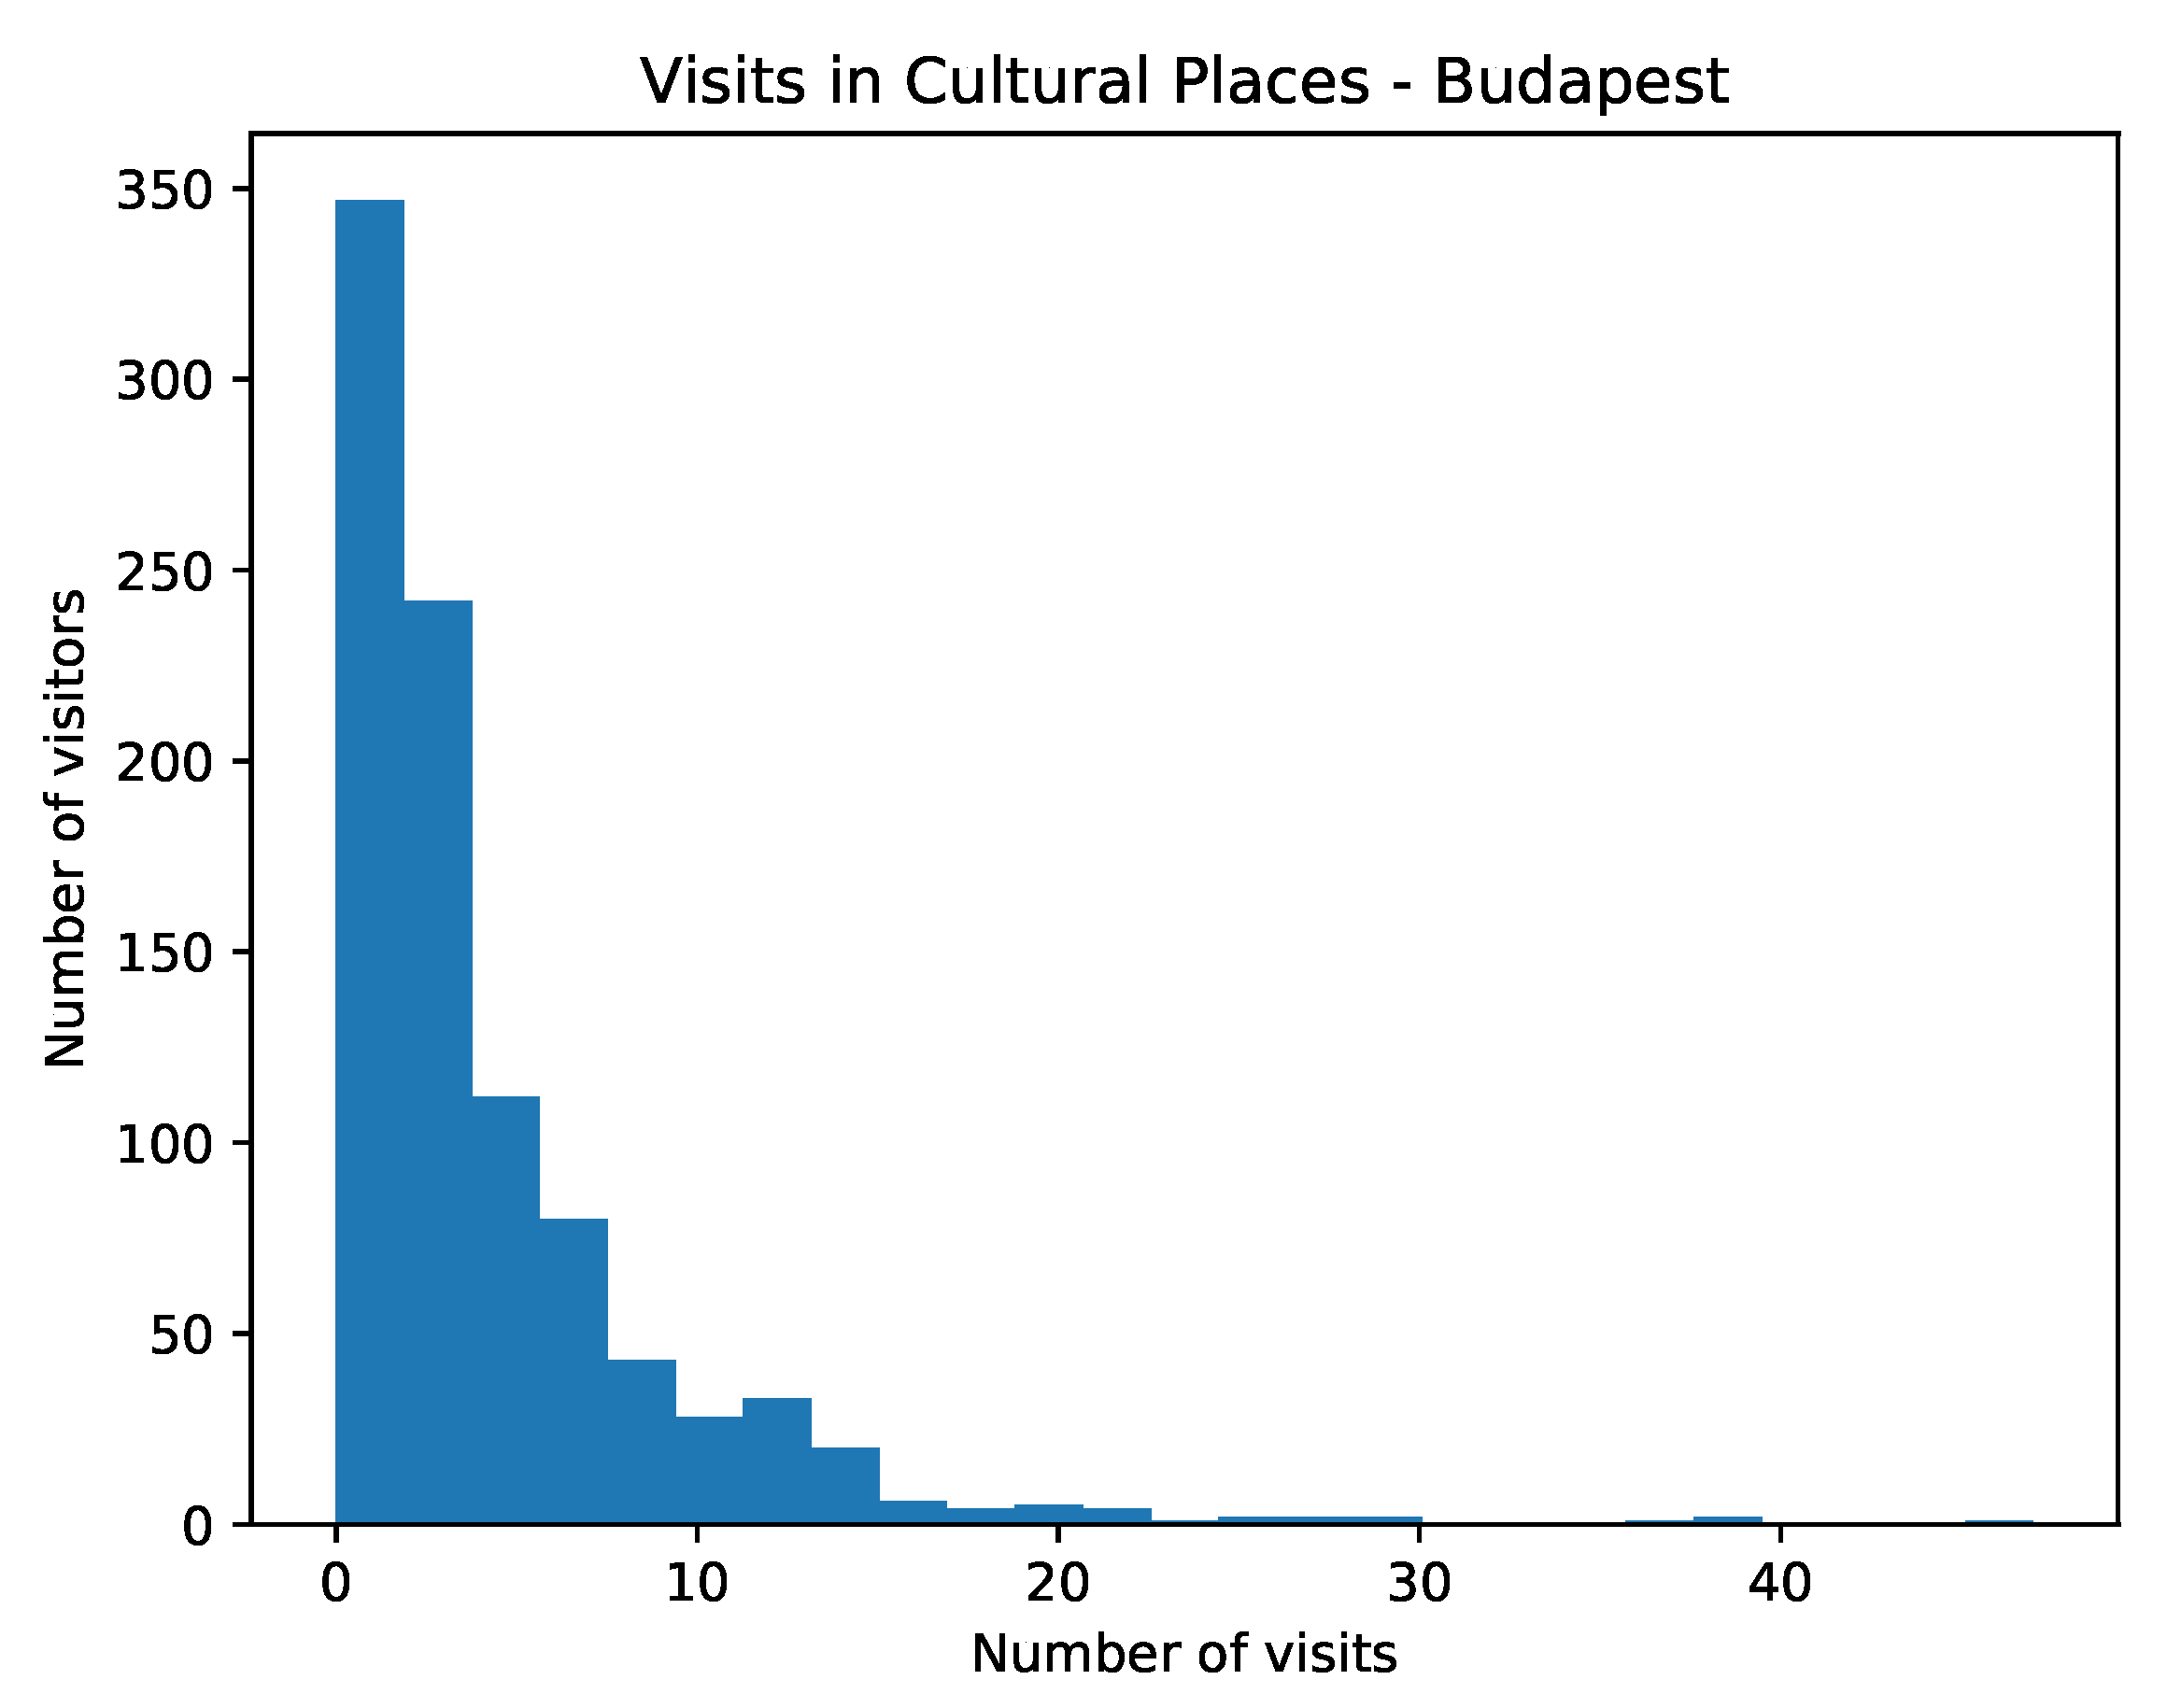
Centrality quantifies the importance of cultural sites to the visitor. The most obvious way to assess this characteristic is to count the number of distinct visits of each tourist to the various cultural places. The more sites s/he travels to, the larger the value of centrality is going to be for him/her. If the number of distinct visits per visitor is aggregated on a histogram, its shape is similar to the one of Figure 3 for Budapest. As it can bee seen, the number of visits follows a power law distribution; the overwhelming majority of tourists visit only handful of cultural sites (less than 10), with very few proceeding to discover more than 20. This is the case for all cities in the examined dataset and most likely resembles the reality in virtually every destination; the majority of tourists limit their cultural experience to just the most distinctive landmarks of the places they visit. For this reason and in an effort to smoothen the effect of the power law, the logarithm of the number of visits to cultural places has been considered for each user and it has been subsequently linearly mapped to the [ 1 , 5 ] range.
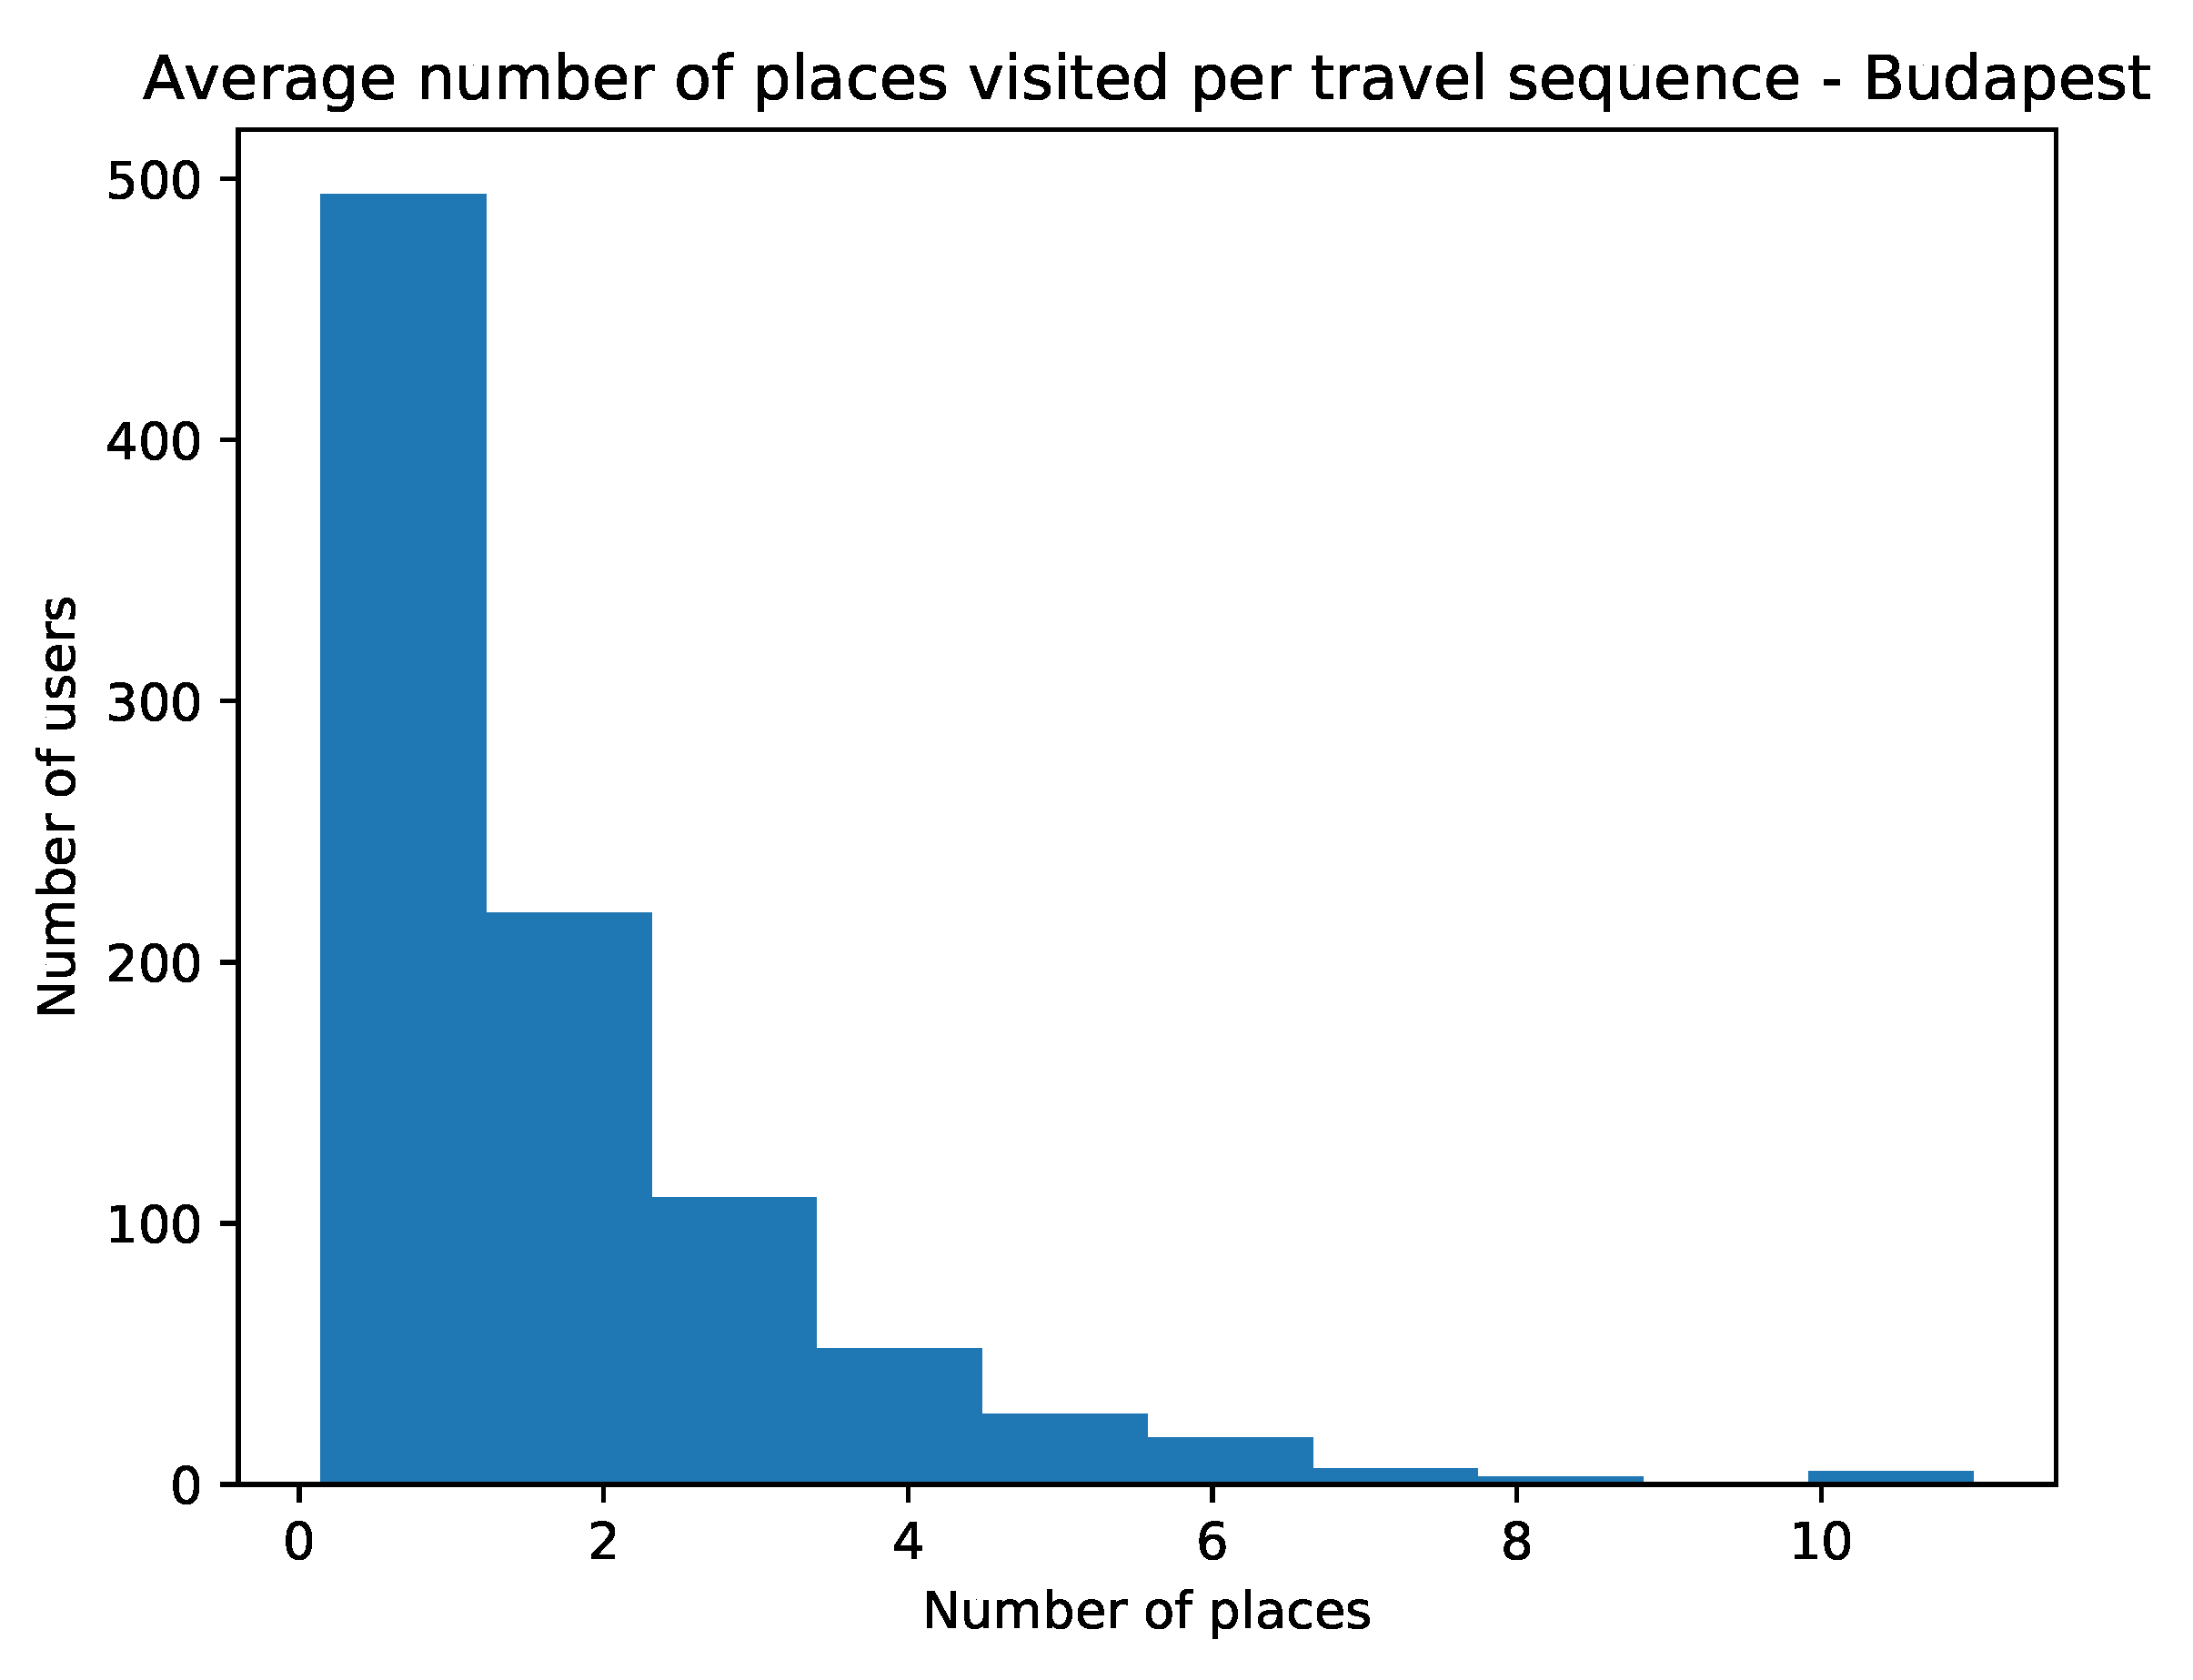
The second variable to be considered, the frequency of the visits, is related to how often a tourist travels. Of course, users are anonymized in the dataset, represented solely by their identifier and as a result, it is impossible to determine whether they are taking photos of their hometown or of a place they are visiting. On the other hand, the timestamps of the photos do reveal when each visit took place, however, in many cases, this information is still incomplete; some photos have wrong timestamps, a few users have taken photos spanning several years, while the vast majority of them has only taken a few shots, corresponding to one or two sequences in the same year. Therefore, in this case, it has been determined that the frequency of visits is better represented by the average value of the ratio of the places visited by a user in one sequence. Figure 4 depicts the histogram of this variable for the city of Budapest, with the other cities in the dataset exhibiting a similar behavior. As it can be seen, it is also following a power law, albeit not as steep as the previous case. Most tourists visit only a couple of places in each sequence, with very few visiting more than 6. Because of the “smootheness” of this histogram, this variable has been linearly mapped to the [ 1 , 5 ] scale.
The visiting knowledge of a place (third variable) can be estimated by the number of visits each POI receives. Cultural POIs with very few visits indicate that they are not popular or well-known attractions and therefore their visitors must have been well-informed about their existence. On the user level, his/her knowledge of the place may be considered to be proportional to the least popular cultural place s/he has visited. POI frequencies also obey a power lay distribution, with a few most popular places within each city attracting the majority of visits. Consequently, the logarithm of the POI frequency has been considered and has been subsequently linearly mapped to the [ 1 , 5 ] scale.
The final variable to be examined is the duration of the visit. This quantity may be approximated as the time difference between the first & last photograph to be taken of a POI within a travel sequence. Based on that assumption, it is possible to compute the average duration of each user’s visits, which, like the other variables discussed so far, also follows a power law distribution, with the overwhelming majority of visits lasting less than one hour. Therefore, for each user, the logarithm of his/her average visit duration is taken and is subsequently linearly mapped to the [ 1 , 5 ] scale.
The pre-processing steps discussed so far help approximate, for each user, the values of the four variables of Table 2, that would eventually classify him/her to one of the cultural tourist typologies of Table 4. This classification may be either hard or soft; in the former case, the user is assigned to the “closest” typology, while in the latter case, a degree of membership on each typology is calculated. Both approaches have been followed in the experiments, however, the soft classification yielded better results and for this reason, it was the only one to be considered in the presented results (Section 5).
User proximity to each one of the five cultural tourist types (Table 4) has been based on euclidean similarity (Equation (4))
s i m ( u , t ) = 1 1 + i = 1 4 ( u i t i ) 2
where u is the user persona vector of the four variables discussed in this subsection and t is the tourist typology vector. Finally, the computed similarities of every user with the five cultural tourist typologies are normalized to unit similarity.

5. Results

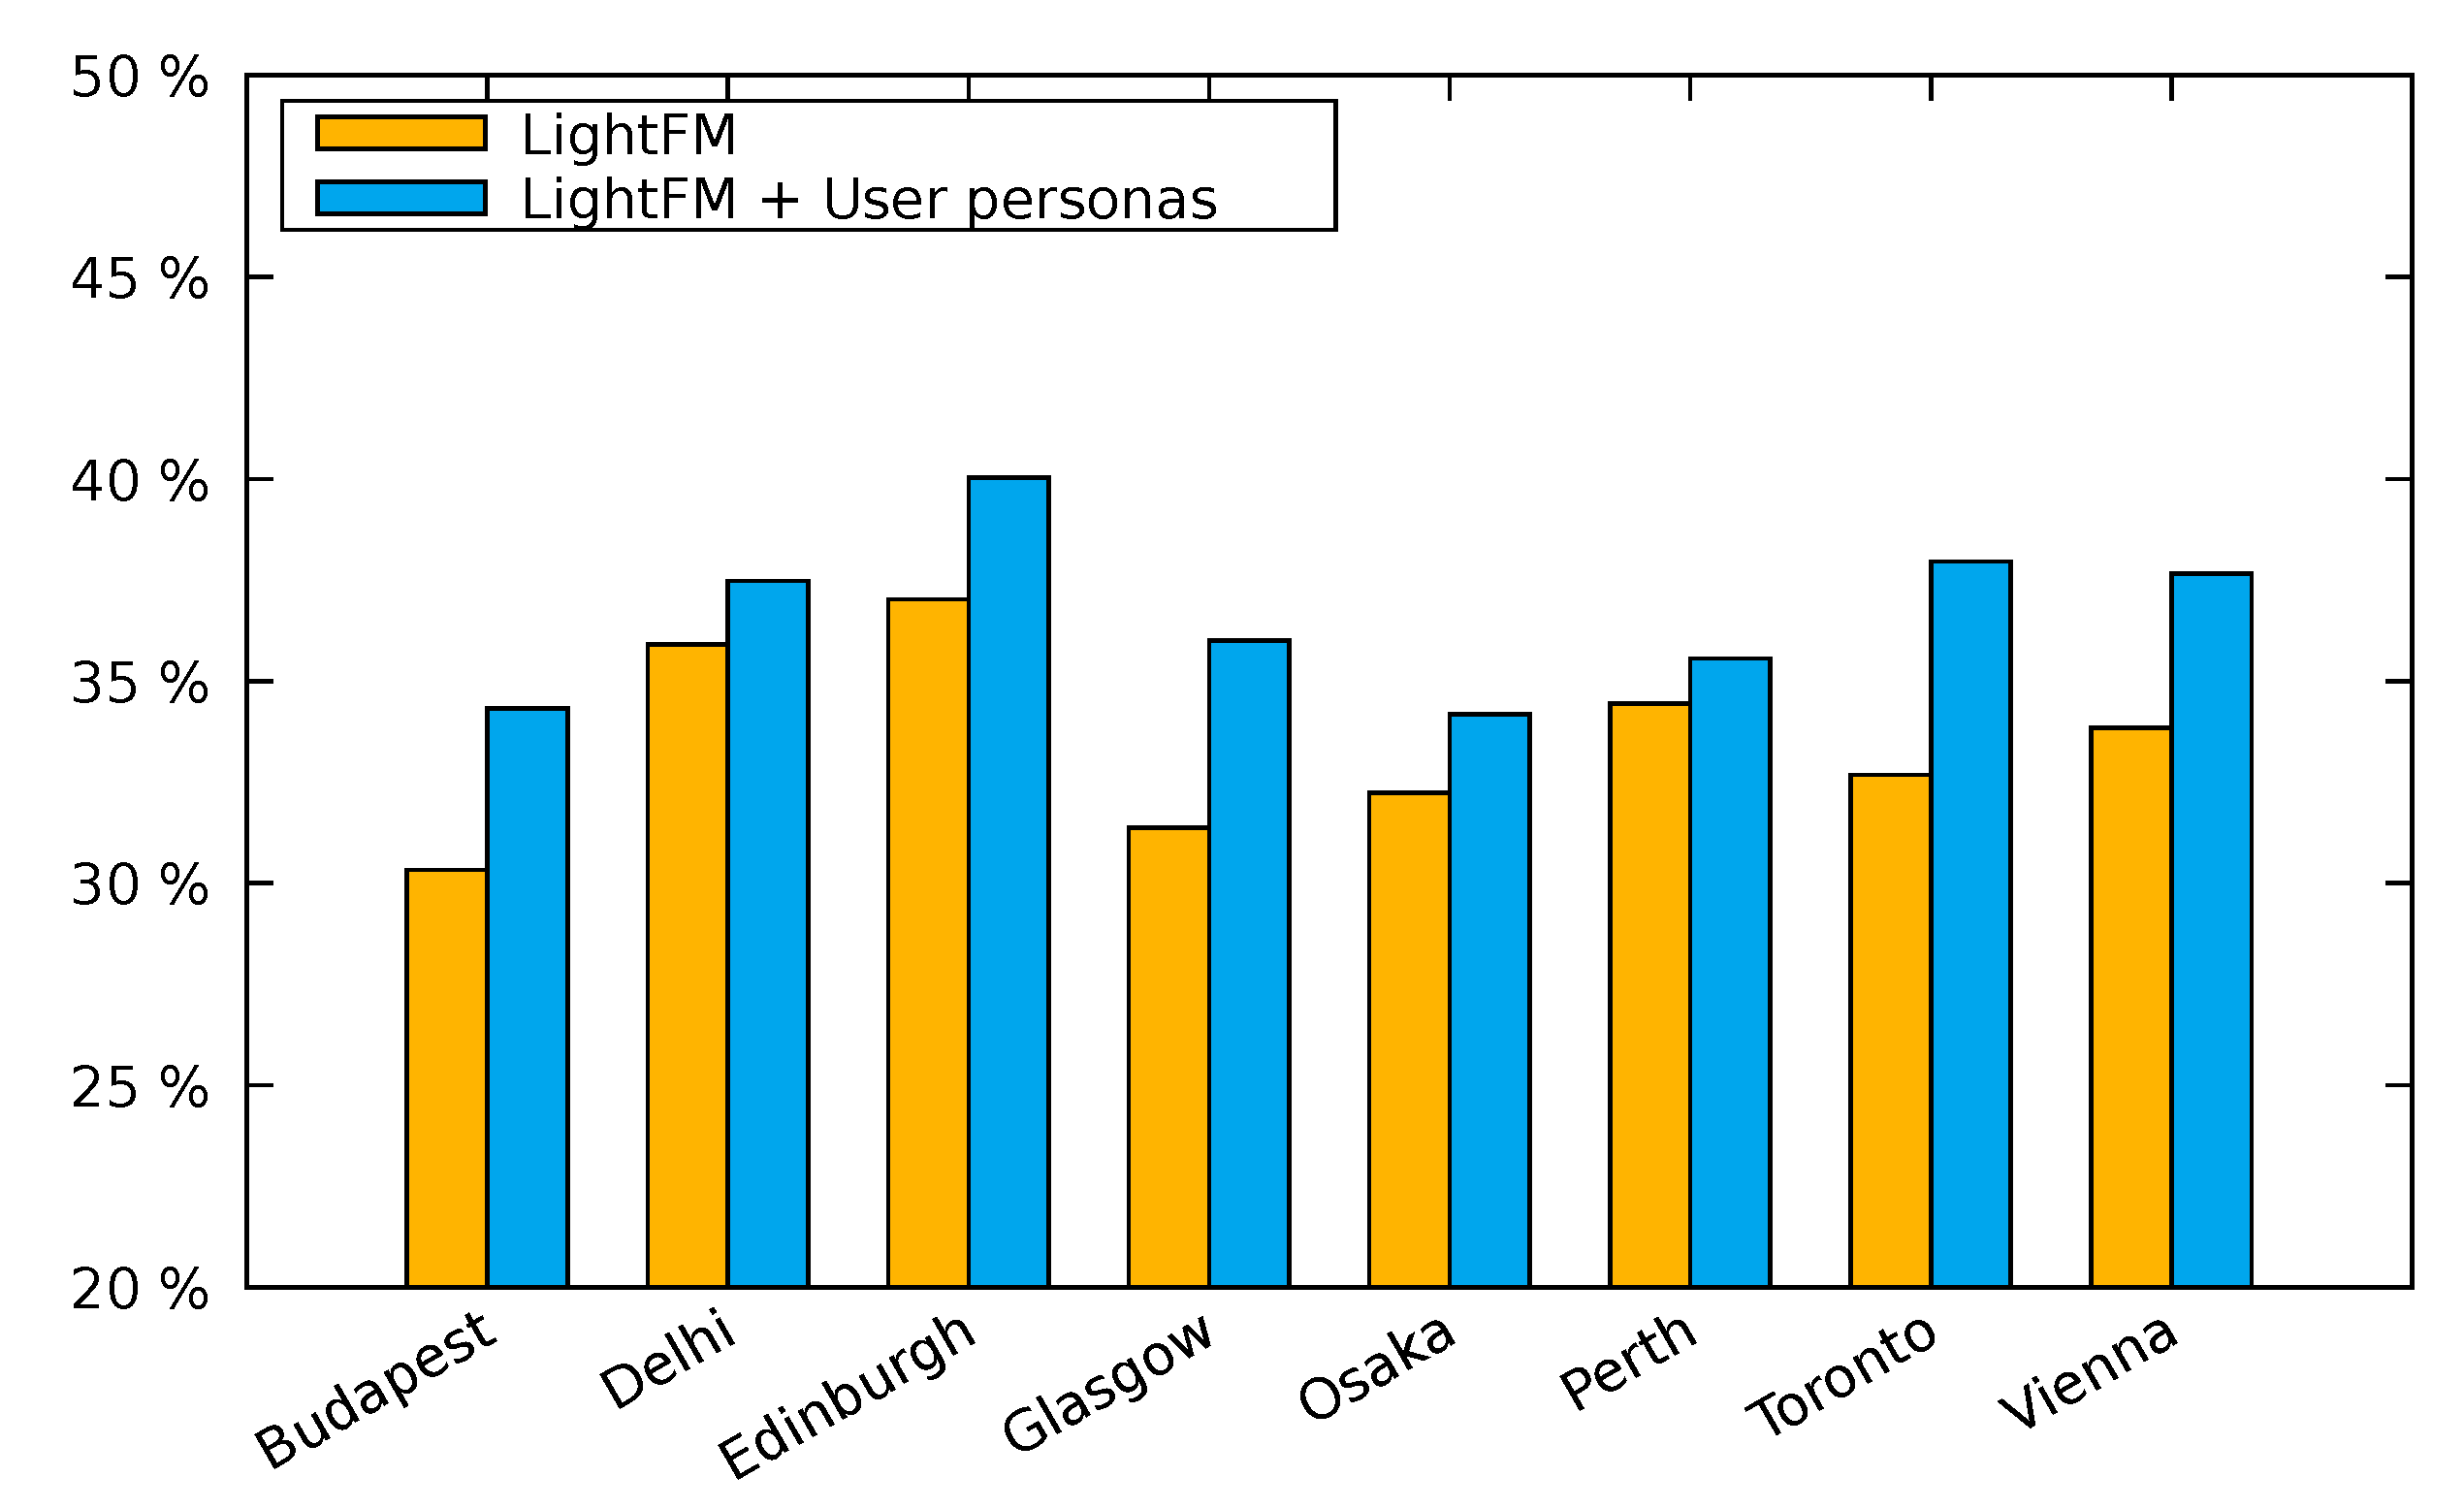
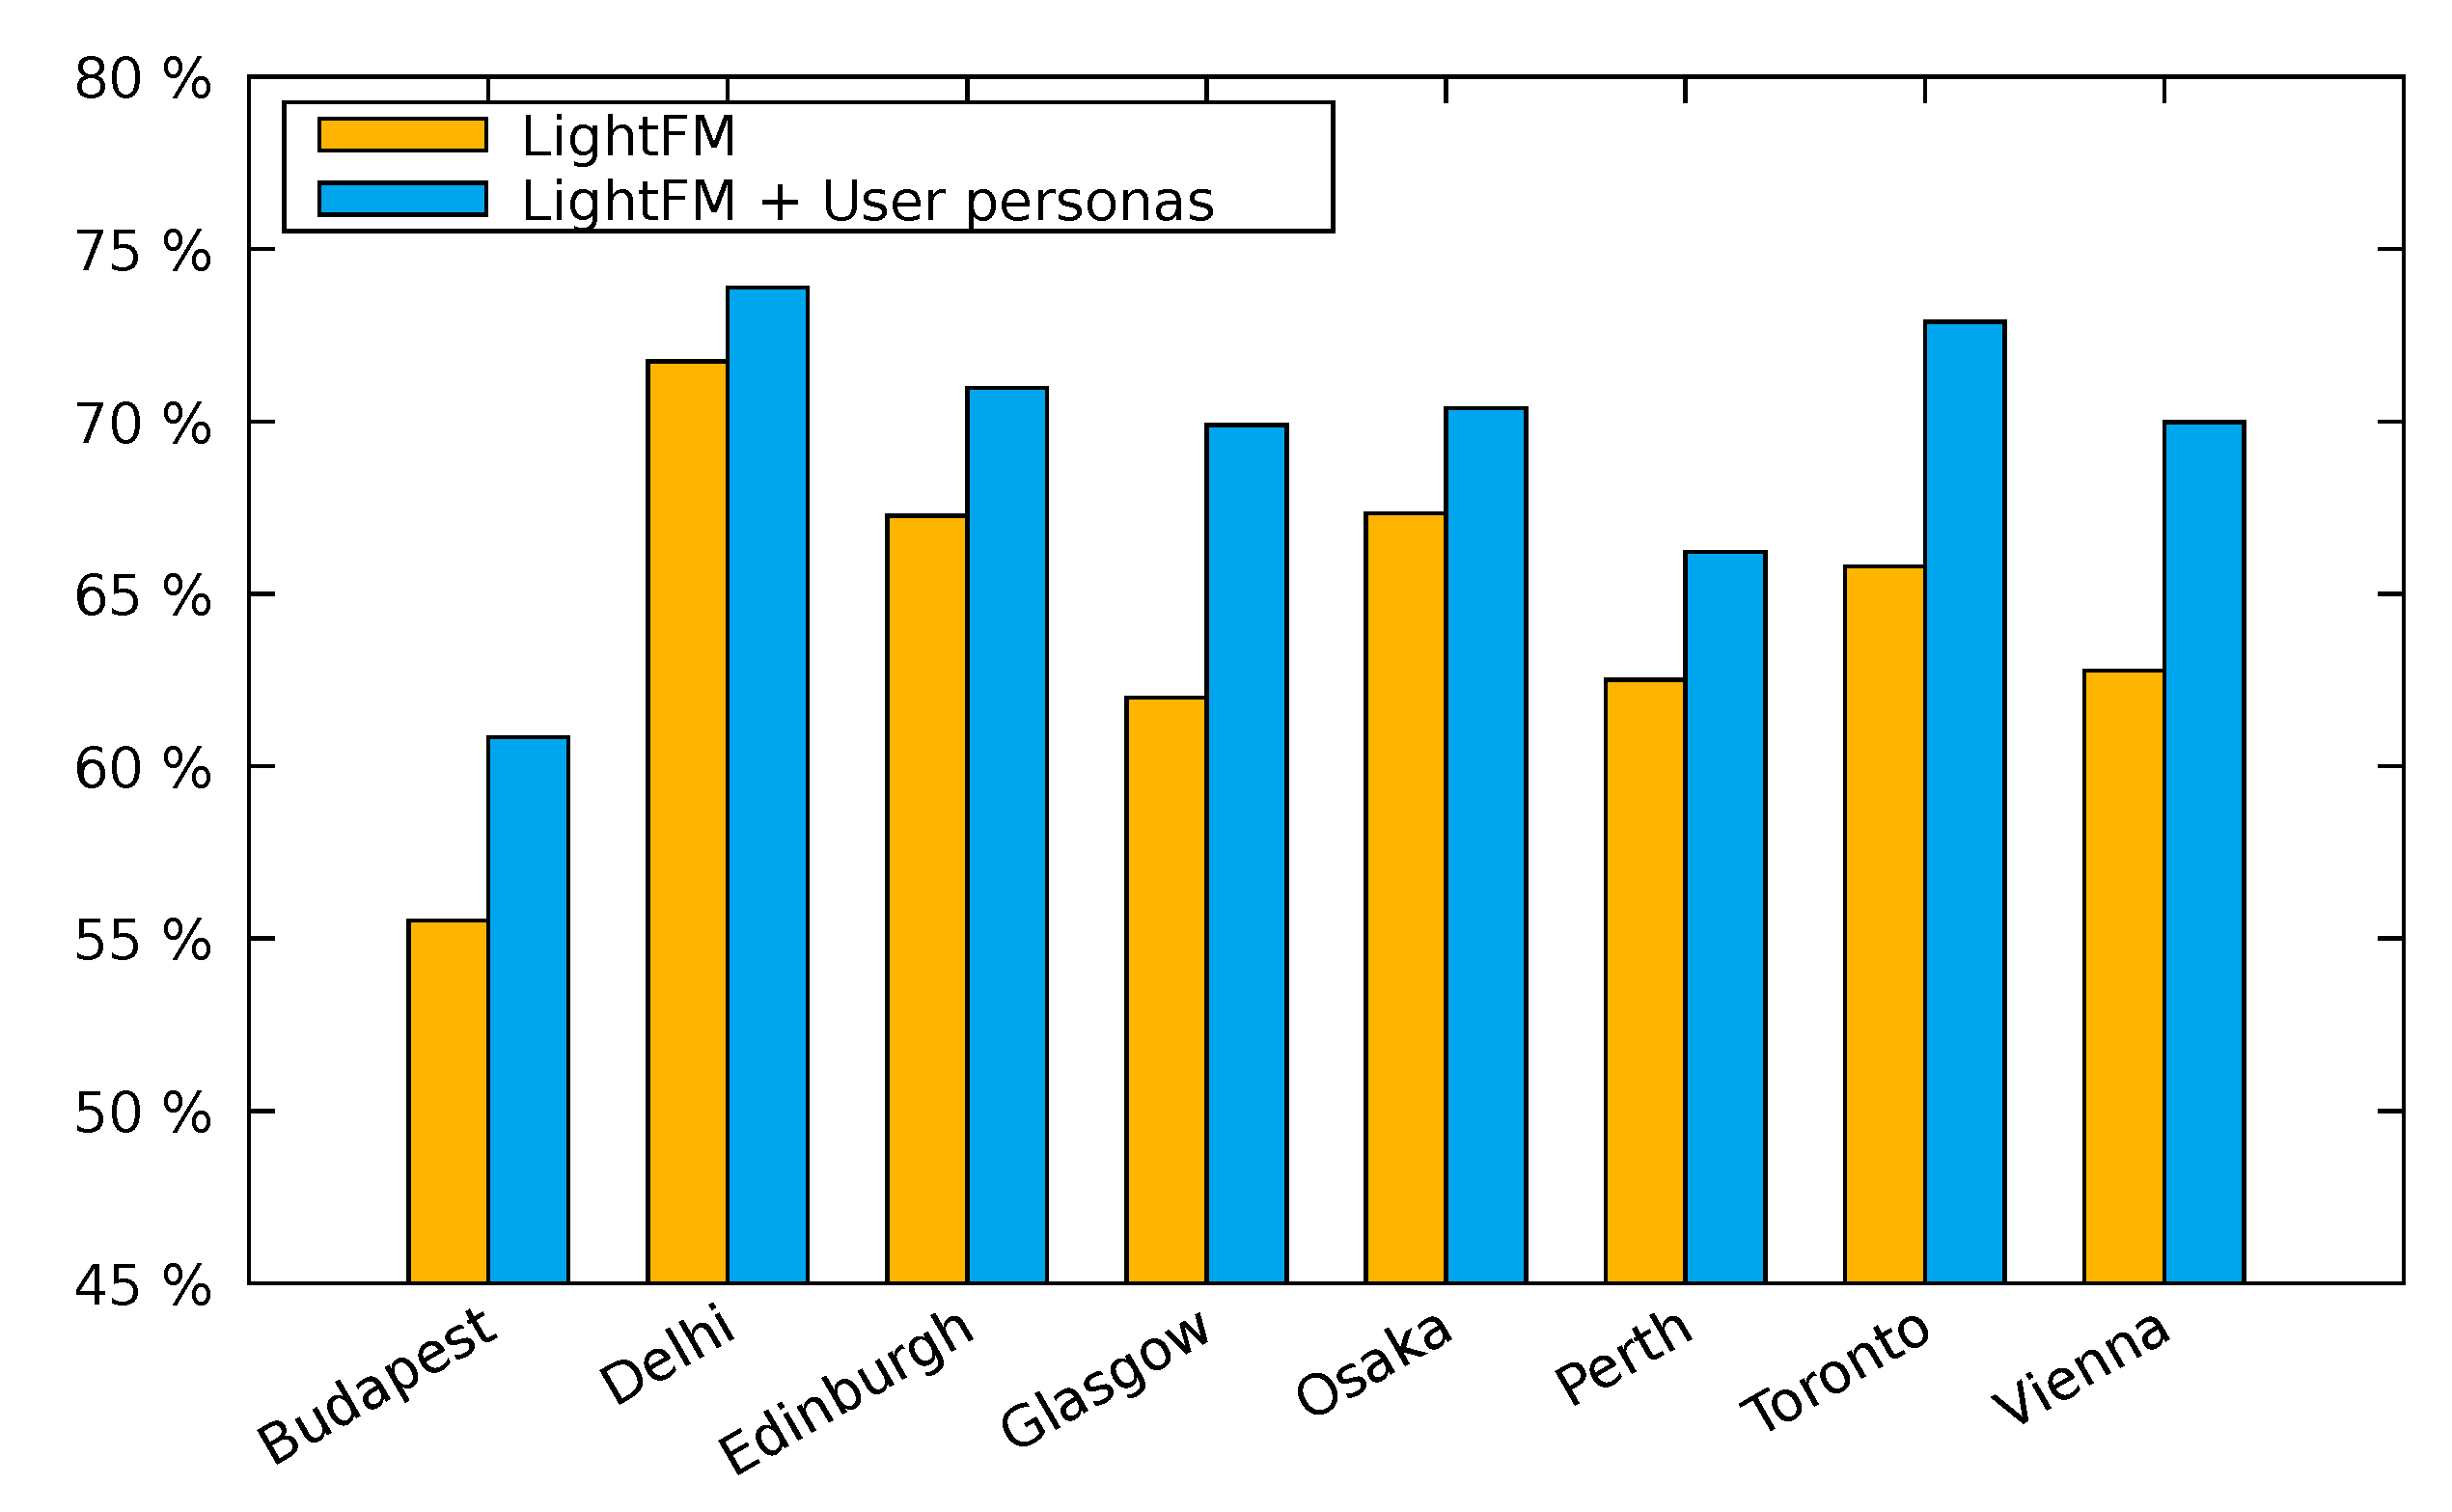
Figure 5 and Figure 6 summarize the results of the experimental procedure for all cities in the examined dataset. Two distinct RS have been considered; the first one is the LightFM [31] CF MF approach outlined in Section 3.3, which factorizes the interaction matrix of user visits to POIs. In order to study the effect of the computed user personas, the second RS is also based on LightFM, but the factorization scheme is hybrid in this case; the user features are augmented with the five additional personas features computed in Section 4.2, designating the extend to which each user belongs to each of the 5 pre-defined cultural tourist type categories (the source code used in the experiments is available at https://github.com/ii-aegean/user-personas-recommender). Otherwise, the rest of the parameters and hyper-parameters are the same for the two RS; the cardinality of the feature space is set to f = 20 , the number of epochs for the factorization process is also set to 20 and the learning rate is set to 0.05 . Additionally, L2 regularization is imposed on the user features, with the optimal value having been determined to be, after experimentation, λ u = 2 × 10 3 for the cities of Vienna, Edinburgh and Toronto and λ u = 5 × 10 3 for the rest. Finally, the test set size has been set to 20 % of the total number of interactions and the results presented in Figure 5 and Figure 6 are the averages of 10 different runs, whose statistical significance is assessed by the Wilcoxon singed rank test ( p v a l u e < 0.01 ).
System performance has been evaluated on a set of two metrics that are commonly used in offline RS evaluation [36]. Both metrics are calculated over a list of personalized recommendations returned by the system for each particular user. The first one is precision, which is the fraction of those items in the recommendation list that are actually of interest to the user, over all items in the list. Naturally, an ideal RS will only produce meaningful recommendations and would achieve a 100 % precision. In practice and when comparing different RS algorithms, a higher precision score is an indication that the examined system adapts better to the taste of the users.
Figure 5 displays the Mean Average Precision (MAP) metric computed over a list of three recommended items. MAP designates the mean of average precision, where average precision for a list of length l and for a user u is defined as
P r ( u ) ¯ = 1 | I u | i = 1 L P r ( i ) × r e l ( i )
P r ( i ) is the precision at cut-off point i in the list, I u is the set of relevant items for u and r e l ( i ) is equal to 1 if the i-th list item is relevant for u and zero otherwise. The presented results indicate that the hybrid factorization scheme that takes into account the user personas produces better recommendations than the vanilla algorithm. More specifically, a performance improvement of about 3 % is achieved on this metric, which the largest difference being recording in Toronto (more than 5 % ) and the smallest in Perth (little less than 2 % ). These differences are attributed to the peculiarities of the dataset (Table 5), since the userbase and the interactions in the city of Perth are among the smallest in the dataset and therefore the extracted personas information is not as rich as in the case of Toronto, which is the biggest subset of the data.
The second metric to be examined is the Mean Reciprocal Rank (MRR), which quantifies how “high” in the recommendation list lie items relevant to the user. Even when a RS is able to produce meaningful recommendations, those should appear higher in the list (e.g., fist, second, etc.). Otherwise, if the first items in the list are not relevant to the user, s/he may be frustrated by the overall experience and interaction with the system. Therefore, when a RS algorithm achieves a higher MRR score compared to another one, it actually means that it is able to place relevant recommendations (to the user) higher up in the produced list. More formally, MRR is defined as
M R R = 1 | T | l = 1 | T | 1 rank l
where rank l designates the position of the first relevant item for the l-th user in the recommendation list. The inclusion of the user personas in the factorization scheme results in relevant items being placed “higher” in the recommendation list, yielding a performance improvement in this case as well, which is 5 % on average; the largest being around 8 % in Toronto and the smallest being 3 % in Delhi. As with the case of the previous metric, those differences are attributed to the properties of the dataset; Toronto is the biggest subset and therefore permits the creation of more complete personas profiles, while Delhi, along with Perth, are the smallest and therefore user personas are not as descriptive in those cases.

6. Conclusions

In this paper, a cultural tourism RS has been outlined, capable of generating personalized POI suggestions, based on an enriched cultural typology. To the best of our knowledge, the presented approach is among the first in the tourist RS domain to make extensive use of cultural user profiles and to incorporate them in the recommendation process. Cultural heritage tourists and their profiles have been examined according to the cultural typologies of McKercher, in terms of an additional three dimensions proposed in this work (visiting knowledge, duration of the visit and frequency of visits). The experimental procedure evaluated the effect of the whole approach on a reference dataset, along with its peculiarities and characteristics. Overall, this work demonstrated that, under certain assumptions, it is possible to augment the recommendation process with information pertaining to the cultural background of tourists and when doing so, the obtained recommendations are of increased quality.
The hybrid CF MF scheme that takes into account the proposed typology achieved a performance improvement over the vanilla approach, recommending meaningful POIs that are relevant to user preference. Therefore, the extra profiling information affects positively the experience of cultural tourists and induces them to learn more about other attractions and activities available in the destinations they visit. Nonetheless, the experimental procedure revealed also certain limitations. Firstly, out of the five variables, the depth of user experience cannot be easily determined. Additionally, in cases of data sparsity (e.g., as in the cities of Delhi and Perth in the examined dataset), the extracted user personas are not as descriptive as in other cases where more data are available (e.g., in Toronto).
In order to overcome the aforementioned shortcomings, a possible future research direction would be the enrichment of the user & item profile representations, by utilizing additional information sources, such as ontologies or the Semantic Web. Enriched user and item features are expected to result to a greater degree of accuracy and thus to make a more meaningful recommendations. Furthermore, in order to increase potential tourists’ prior knowledge and enhance their willingness/motivation to visit a cultural attraction, popular social media applications could also be utilized in displaying an attraction’s culture and heritage, prior to the actual visit.
Author Contributions

Conceptualization, M.K. and G.A.; methodology, M.K.; software, G.A.; validation, M.K., G.A. and G.C.; formal analysis, M.K.; investigation, G.A.; resources, G.A.; data curation, G.A.; writing—original draft preparation, M.K.; writing—review and editing, G.A.; visualization, G.A.; supervision, G.C.; project administration, G.C.; funding acquisition, G.C. All authors have read and agreed to the published version of the manuscript.

Funding

This research has been co-financed by the European Regional Development Fund of the European Union and Greek national funds through the Operational Program Competitiveness, Entrepreneurship and Innovation, under the call RESEARCH—CREATE—INNOVATE (project code: T1EDK-02146).

Conflicts of Interest

The authors declare no conflict of interest.

Abbreviations

The following abbreviations are used in this manuscript:
ANOVAAnalysis of variance
CFCollaborative filtering
ICTInformation & Communication Technology
MFMatrix Factorization
MAPMean Average Precision
MRRMean Reciprocal Rank
POIPoint of Interest
RSRecommender Systems
UXUser experience

Appendix A. Questionnaire

The following anonymous questionnaire has been used in this research. All participants gave their consent in processing their responses for research-related tasks, in accordance to national and European data privacy regulations.

Appendix A.1. Socio-Demographic Characteristics

Gender
(i) Female (ii) Male
Age Group
(i) <18 (ii) 18–25 (iii) 26–35 (iv) 36–50 (v) 51–64 (vi) 65+
Highest Degree
(i) Primary Education (ii) Secondary Education (iii) Higher Education
Occupation
(i) Student (ii) Employee (iii) Self-employed (iv) Unemployed (v) Retired
Marital Status
(i) Married (ii) Not married (iii) Widowed (iv) Divorced
Health condition
(i) Good (ii) Minor impairments (iii) Significant impairments
How familiar are you with new technologies?
(i) Very much (ii) Little (iii) Not at all

Appendix A.2. User Experience

How often do you travel to a cultural destination per year?
(i) 1–3 times (ii) 4–6 times (iii) 7 or more times
Are you travelling
(i) in a group? (ii) with family? (iii) alone? (iv) with friends?
How many different sites do you visit on average during a cultural trip?
(i) 1–2 (ii) 3–4 (iii) 5–6 (iv) 7–8 (v) 9–10 (vi) More than 10
What cultural sites are you interested in visiting?
(i) Science/Technology (ii) Natural History (iii) Archeological (iv) Museum/Libraries (v) Ethnological (vi) Other
Were you familiar with the area prior to your visit?
(i) Familiar (ii) Somewhat familiar (iii) Not familiar at all
How did you become aware of this museum?
(i) Printed media (ii) Internet (iii) Friends (iv) Other
Did you seek any information prior to visiting this museum?
(i) Yes (ii) No
Is this the first time visiting this museum?
(i) Yes (ii) No
Would you download an app for cultural destinations on a smartphone/tablet?
(i) Yes (ii) No
Would you be willing to pay for such an application?
(i) Yes (ii) No
What is the purpose of your visit?
(i) Knowledge (ii) Socializing (iii) Entertainment (iv) Research (v) Professional (vi) Other
How much time did you spend on this visit?
(i) less than 1 h (ii) 1–3 h (iii) 3 h or more
How would you characterize your visit to this place?
(i) Boring (ii) Tiresome (iii) Inaccessible (iv) Indifferent (v) Useful (vi) Interesting (vii) Impressive (viii) Special
Did you use your social media profiles to post material during the visit?
(i) Yes (ii) No
Returning home, how probable is for you to seek more information about this museum?
(i) Highly probable (ii) Not very probable (iii) Improbable

References

  1. Pandolfo, L.; Pulina, L.; Grosso, E. A user model ontology for adaptive systems in cultural tourism domain. In Applications of Intelligent Systems; IOS Press: Amsterdam, The Netherlands, 2018; pp. 212–219. [Google Scholar] [CrossRef]
  2. Rudan, E. The Development of Cultural Tourism in Small Historical Towns. In Faculty of Tourism and Hospitality Management in Opatija. Biennial International Congress. Tourism & Hospitality Industry; University of Rijeka, Faculty of Tourism & Hospitality Management: Rijeka, Croatia, 2010. [Google Scholar]
  3. Di Bitonto, P.; Laterza, M.; Rossano, V.; Roselli, T. A semantic approach implemented in a system recommending resources for cultural heritage tourism. J. e-Learn. Knowl. Soc. 2006, 2, 97–106. [Google Scholar] [CrossRef]
  4. Chen, G.; Huang, S.S. Understanding Chinese cultural tourists: Typology and profile. J. Travel Tour. Market. 2018, 35, 162–177. [Google Scholar] [CrossRef]
  5. Özel, Ç.H.; Kozak, N. Motive Based Segmentation of the Cultural Tourism Market: A Study of Turkish Domestic Tourists. J. Qual. Assur. Hosp. Tour. 2012, 13, 165–186. [Google Scholar] [CrossRef]
  6. McKercher, B. Towards a classification of cultural tourists. Int. J. Tour. Res. 2002, 4, 29–386. [Google Scholar] [CrossRef]
  7. Vong, F. Application of cultural tourist typology in a gaming destination—Macao. Curr. Issues Tour. 2013, 19, 949–965. [Google Scholar] [CrossRef]
  8. Nguyen, T.H.H.; Cheung, C. The classification of heritage tourists: A case of Hue City, Vietnam. J. Herit. Tour. 2013, 9, 35–50. [Google Scholar] [CrossRef]
  9. Boulaalam, O.E. Design of a Tourism Recommendation System Based on User’s Profile. In Advanced Intelligent Systems for Sustainable Development (AI2SD’2019); Ezziyyani, M., Ed.; Springer International Publishing: Cham, Switzerland, 2020; pp. 217–223. [Google Scholar] [CrossRef]
  10. Stylianou-Lambert, T. Gazing from home: Cultural tourism and art museums. Annals of Tourism Research. J. Comput. Cult. Herit. 2011, 38, 403–421. [Google Scholar] [CrossRef]
  11. McKercher, B.; Du Cros, H. Testing a Cultural Tourism Typology. Int. J. Tour. Res. 2003, 5, 45–58. [Google Scholar] [CrossRef]
  12. Niemczyk, A. Cultural tourists: “An attempt to classify them”. Tour. Manag. Perspect. 2013, 5, 24–30. [Google Scholar] [CrossRef]
  13. Kaufman, T.J.; Scantlebury, M. Cultural tourism and the vacation ownership industry. J. Retail Leisure Prop. 2007, 6, 213–220. [Google Scholar] [CrossRef] [Green Version]
  14. Chandler, J.A.; Costello, C.A. A profile of visitors at heritage tourism destinations in East Tennessee according to Plog’s lifestyle and activity level preferences model. J. Travel Res. 2002, 41, 161–166. [Google Scholar] [CrossRef]
  15. Hausmann, A. Cultural tourism: Marketing challenges and opportunities for German cultural heritage. Int. J. Herit. Stud. 2007, 13, 170–184. [Google Scholar] [CrossRef]
  16. de Simone, E. Non-residents’ attitudes towards heritage: Exploring tourist typologies by cultural consumption. Acta Turistica 2012, 24, 177–208. [Google Scholar]
  17. Konstantakis, M.; Aliprantis, J.; Michalakis, K.; Caridakis, G. A Methodology for Optimised Cultural User peRsonas Experience—CURE Architecture. In Proceedings of the 32nd International BCS Human Computer Interaction Conference (HCI), Belfast, Ireland, 4–6 July 2018. [Google Scholar] [CrossRef] [Green Version]
  18. Konstantakis, M.; Aliprantis, J.; Michalakis, K.; Caridakis, G. Recommending user Experiences based on extracted cultural PErsonas for mobile ApplicaTions-REPEAT methodology. In Proceedings of the Mobile HCI 2018, 20th International Conference on Human-Computer Interaction with Mobile Devices and Services, Barcelona, Spain, 3–6 September 2018. [Google Scholar]
  19. Kantaken, T.; Tikannen, I. Advertising in low and high involvement cultural tourism attractions: Four cases. Tour. Hosp. Res. 2006, 6, 99–110. [Google Scholar] [CrossRef]
  20. Neuhofer, B.; Buhalis, D.; Ladkin, A. A Typology of Technology-Enhanced Tourism Experiences. Int. J. Tour. Res. 2014, 16, 340–350. [Google Scholar] [CrossRef]
  21. Konstantakis, M.; Caridakis, G. Adding Culture to UX: UX Research Methodologies and Applications in Cultural Heritage. J. Comput. Cult. Herit. 2020, 13, 1–17. [Google Scholar] [CrossRef] [Green Version]
  22. Ricci, F.; Rokach, L.; Shapira, B. Recommender Systems Handbook, 2nd ed.; Springer Publishing Company, Incorporated: New York, NY, USA, 2015. [Google Scholar]
  23. Liu, Y.; Liu, C.; Liu, B.; Qu, M.; Xiong, H. Unified Point-of-Interest Recommendation with Temporal Interval Assessment. In Proceedings of the 22nd ACM SIGKDD International Conference on Knowledge Discovery and Data Mining, KDD ’16, San Francisco, CA, USA, 13–17 August 2016; Association for Computing Machinery: New York, NY, USA, 2016; pp. 1015–1024. [Google Scholar] [CrossRef]
  24. Alexandridis, G.; Chrysanthi, A.; Tsekouras, G.E.; Caridakis, G. Personalized and Content Adaptive Cultural Heritage Path Recommendation: An Application to the Gournia and undefinedatalhöyük Archaeological Sites. User Model. User-Adapt. Interact. 2019, 29, 201–238. [Google Scholar] [CrossRef]
  25. Aksenov, P.; Kemperman, A.; Arentze, T. A Personalised Recommender System for Tourists on City Trips: Concepts and Implementation. In Intelligent Interactive Multimedia Systems and Services 2016; Pietro, G.D., Gallo, L., Howlett, R.J., Jain, L.C., Eds.; Springer International Publishing: Cham, Switzerland, 2016; pp. 525–535. [Google Scholar]
  26. Cardoso, P.J.S.; Guerreiro, P.; Pereira, J.A.A.R.; Veiga, R.J.M. A Route Planner Supported on Recommender Systems Suggestions: Enhancing Visits to Cultural Heritage Places. In Proceedings of the 8th International Conference on Software Development and Technologies for Enhancing Accessibility and Fighting Info-Exclusion, DSAI 2018, Thessaloniki, Greece, 20–22 June 2018; Association for Computing Machinery: New York, NY, USA, 2018; pp. 144–151. [Google Scholar] [CrossRef]
  27. Galí, N. Identifying cultural tourism: A theoretical methodological proposal. J. Herit. Tour. 2011, 7, 45–58. [Google Scholar] [CrossRef]
  28. Chen, C.; Chen, F. Experience quality, perceived value, satisfaction and behavioral intentions for heritage tourists. Tour. Manag. 2010, 31, 29–35. [Google Scholar] [CrossRef]
  29. Caldeira, A.M.; Kastenholz, E. Tourists’ spatial behaviour in urban destinations: The effect of prior destination experience. J. Vacat. Market. 2018, 24, 247–260. [Google Scholar] [CrossRef]
  30. Kang, S.; Lee, G.; Kim, J.; Park, D. Identifying the spatial structure of the tourist attraction system in South Korea using GIS and network analysis: An application of anchor-point theory. J. Destin. Market. Manag. 2018, 9, 358–370. [Google Scholar] [CrossRef]
  31. Kula, M. Metadata Embeddings for User and Item Cold-start Recommendations. In Proceedings of the 2nd Workshop on New Trends on Content-Based Recommender Systems co-located with 9th ACM Conference on Recommender Systems (RecSys 2015), Vienna, Austria, 16–20 September 2015; Volume 1448, pp. 14–21. [Google Scholar]
  32. Niu, F.; Recht, B.; Re, C.; Wright, S.J. HOGWILD! A Lock-Free Approach to Parallelizing Stochastic Gradient Descent. arXiv 2011, arXiv:1106.5730. [Google Scholar]
  33. Lim, K.H.; Chan, J.; Leckie, C.; Karunasekera, S. Personalized Tour Recommendation based on User Interests and Points of Interest Visit Durations. In Proceedings of the 24th International Joint Conference on Artificial Intelligence (IJCAI’15), Buenos Aires, Argentina, 25–31 July 2015; pp. 1778–1784. [Google Scholar]
  34. Lim, K.H.; Chan, J.; Leckie, C.; Karunasekera, S. Towards Next Generation Touring: Personalized Group Tours. In Proceedings of the 26th International Conference on Automated Planning and Scheduling (ICAPS’16), London, UK, 12–17 June 2016; pp. 412–420. [Google Scholar]
  35. Thomee, B.; Shamma, D.A.; Friedland, G.; Elizalde, B.; Ni, K.; Poland, D.; Borth, D.; Li, L.J. YFCC100M: The New Data in Multimedia Research. Commun. ACM 2016, 59, 64–73. [Google Scholar] [CrossRef]
  36. Herlocker, J.L.; Konstan, J.A.; Terveen, L.G.; Riedl, J.T. Evaluating Collaborative Filtering Recommender Systems. ACM Trans. Inf. Syst. 2004, 22, 5–53. [Google Scholar] [CrossRef]
Figure 1. Cultural tourist types according to McKercher [11].
Bdcc 04 00012 g001
Figure 2. Cultural tourist Kiviat diagram.
Bdcc 04 00012 g002
Figure 3. Histogram of the number of distinct visits to cultural places in Budapest.
Bdcc 04 00012 g003
Figure 4. Histogram of the ratio of distinct places visited per travel sequence in Budapest.
Bdcc 04 00012 g004
Figure 5. Mean Average Precision for a list of three items (MAP@3).
Bdcc 04 00012 g005
Figure 6. Mean Reciprocal Rank (MRR).
Bdcc 04 00012 g006
Table 1. Sample characteristics/Questionnaire responses.
VariableCategoryFrequency (N)Percentage (%)
Socio-demographic characteristics
Age19–2517 8.6
26–3553 26.4
36–5089 44.8
51–6437 18.4
65+4 1.8
Educationprimary1 0.6
secondary10 4.9
higher189 94.5
student19 9.4
employee160 79.9
Occupationunemployed21 10.7
Cultural dimensions/variables
Frequency of the visit in cultural destinations1–3 times111 55.8
4–6 times55 27.6
7 or more times34 16.6
Duration of the visit during a cultural trip<1 h4 2.0
>1 h36 18.4
1–3 h141 70.6
3 h and more19 9.8
Visiting knowledge of the cultural destinationvery low2 0.6
low9 4.3
medium42 21.0
high88 44.4
very high59 29.6
Table 2. Variables governing cultural visitor types.
VariableDescription
1Centralityhow important cultural tourism is for the user to visit the site
2Depth of user experiencelevel of involvement and real knowledge acquisition during the visit
3Frequency of visitshow often s/he travels on average a year
4Visiting knowledgeif s/he has prior knowledge of the visiting Area
5Duration of the visittime spent for an activity within the cultural tour
Table 3. Degree of cultural centrality based on number of experiences and duration of visit.
CentralityNumber of Experiences
Short StayMedium StayLong StayExceptionally Long Stay
Low1 to 23 to 45 to 67 or more
Moderate3 to 45 to 67 to 89 or more
High5 to 67 to 89 to 1011 or more
Table 4. Cultural tourist rating.
CentralityDepth of UserFrequencyVisitingDuration
Experienceof VisitsKnowledgeof the Visit
Purposeful 4.5 4.5 34 4.5
Sightseeing42334
Incidental23112
Serendipitous143 4.5 4
Casual 3.5 3422
Table 5. The Flickr User-POI Visits Dataset [33,34].
CityUsersPOIsVisitsPhotographsTravel Sequences
Budapest93539481018,5132361
Delhi279266823393489
Edinburgh145429785333,9445028
Glasgow60129274911,4342227
Osaka45029137277471115
Perth159259203643716
Toronto139530760739,4196057
Vienna115529532034,5153193
Table 6. POI Categories & Classes.
Cultural ClassesNon-Cultural Classes
CategoryPhotographsPercentageCategoryPhotographsPercentage
Historical25,277 16.50 % Structure16,949 11.06 %
Cultural23,740 15.50 % Sport7944 5.19 %
Museum21,700 14.16 % Shopping7783 5.08 %
Park10,062 6.57 % Beach7394 4.83 %
Amusement7866 5.13 % Transport5032 3.28 %
Entertainment5988 3.91 % Education3536 2.31 %
Palace3688 2.41 % Zoo1830 1.19 %
Architectural1845 1.20 % Precinct640 0.42 %
Religious959 0.63 %
Religion564 0.37 %
Building401 0.26 %
Total102,100 66.64 % Total51,108 33.36 %