Abstract
YouTube is a boon, and through it people can educate, entertain, and express themselves about various topics. YouTube India currently has millions of active users. As there are millions of active users it can be understood that the data present on the YouTube will be large. With India being a very diverse country, many people are multilingual. People express their opinions in a code-mix form. Code-mix form is the mixing of two or more languages. It has become a necessity to perform Sentiment Analysis on the code-mix languages as there is not much research on Indian code-mix language data. In this paper, Sentiment Analysis (SA) is carried out on the Marglish (Marathi + English) as well as Devanagari Marathi comments which are extracted from the YouTube API from top Marathi channels. Several machine-learning models are applied on the dataset along with 3 different vectorizing techniques. Multilayer Perceptron (MLP) with Count vectorizer provides the best accuracy of 62.68% on the Marglish dataset and Bernoulli Naïve Bayes along with the Count vectorizer, which gives accuracy of 60.60% on the Devanagari dataset. Multilayer Perceptron and Bernoulli Naïve Bayes are considered to be the best performing algorithms. 10-fold cross-validation and statistical testing was also carried out on the dataset to confirm the results.
1. Introduction
According to the World Bank, the number of users using the Internet in India are rising exponentially, specifically from 2010. About 34.4% of the total population uses the Internet [1]. As mentioned by [2] about 21% of people visit social media platforms. 16% watch videos, 15% use search engines. Therefore, based on these statistics it is evident that a large number of people are using Facebook, Twitter, WhatsApp, Instagram (social media platforms) and YouTube (to watch videos). According to [3] YouTube India already has 245 million active users in India and it reaches 80–85% of the Internet-using population. After the Internet traffic rates became cheaper in India in 2016 there was a huge demand for the YouTube videos in Indian Languages. The genres such as comedy, food, travel etc. are becoming people’s choice and the demands for them is on rising day by day.
As there are so many active users using YouTube, there is a lot of written feedback given by them on different videos they watch. There is a need to analyze these comments to understand the expectation of the viewers and hence Sentiment Analysis (SA) comes into the picture. SA is known as opinion-mining and it uses natural-language processing to computationally identify and categorize the opinions of the given text into different categories such as positive, negative and neutral. SA can also be defined as the process of understanding the view or opinions of the people on different topics and finding their emotional orientation on specific topics, e.g., a user is happy seeing the video and he/she comments “excellent content” as a comment. In this case, the sentiment orientation of the user is positive. The most common sentiment orientations considered in a lot of studies are positive, negative and neutral [4]. There is lot of SA work done in English language. As the growth of YouTube videos for Indian Languages started rising exponentially only after 2016, the SA research work for them is sparse.
According to [5] 52% of urban youth are bilingual and 18% people are multilingual and in future it is expected to rise. This will indirectly affect the way people will be communicating verbally and on social media platforms etc. Hinglish, Marglish etc. are the new unofficial languages observed on social media platforms and YouTube comments. Hinglish is the combination of Hindi and English Language, wherein the Hindi words are written in English Language, whereas Marglish is a combination of Marathi and English Language and the Marathi words are written in English. An example of Hinglish sentence is “Aap bahut beautiful ho mam” which means “you are very beautiful mam”. Example of Marglish sentence is “khup chan recipe Thankyou” which means “Very good recipe Thankyou”. Multilingual languages are morphologically rich and when they are written together in a text it becomes a challenge to analyze them. There is no multilingual dictionary available to carry out the SA task. This paper aims to take up the challenge to perform the SA on Marglish language on cookery channels.
While performing SA there are lot of steps involved in pre-processing and vectorization, using machine learning or dictionary-based approaches etc. all the steps are explained in detailed below. This paper carries out the SA task using the machine-learning approach. The Marglish data which is extracted using YouTube API is first labeled into different categories and then the pre-processing, vectorization, and machine-learning algorithms are applied to the data. It is necessary to discuss what research questions aim to be answered by this research paper.
Research Questions:
RQ1. Will there be different categories but the comments present will be predominant in a category?
RQ2. Which machine-learning algorithms can be applied to the dataset?
RQ3. Among the different parametric and non-parametric models, which model will give the best result?
2. Related Work
The related work is segregated based on the SA Levels and the current trends in the SA. SA has 3 levels document, sentence and aspect level.
2.1. Document Level
In this process, the SA is carried out on the document or paragraph as a whole. Whenever a document is about a single subject it is best to carry out document-level SA. Examples of document-level SA datasets are speeches of world leaders, movie reviews, mobile reviews etc.
SentiWordNet (SWN) is an opinion-based lexicon derived from WordNets. WordNets is a lexical database which consists of words with a short definition and example. SWN consists of dictionary words and the numeric positive and negative sentiment score of each word. WordNets and SWNs are researchers’ common choice when carrying out SA on document level. Pundlik et al. [6,7] had worked on a multi-domain Hindi language dataset. The architecture was implemented by [6,7] contained two steps—domain classification, which was the first step performed using an ontology-based approach, and sentiment classification, performed using HNSW (Hierarchical Navigable Small World) and Language Model (LM) Classifier. A comparative study done on the results by the HNSW and HNSW + LM Classifiers. The combination of HNSW and LM Classifier had given better classification results as compared to HNSW [6,7].
The workby Yadav et al. and Shah et al. [7,8] showed that SA for the mix-Hindi language could be performed by using three approaches. The first approach was to perform classification based on neural network on the predefined words. The second approach used IIT Bombay HNSW. Third approach performed classification using neural networks on the predefined Hindi sentences. The approaches in [7,8] are explained in detail as follows: The first approach maintained the positive and negative word list. The mix-Hindi words were converted into pure Hindi words and were searched in the positive and negative list which was created manually. If the word was found in the positive word list the positive word count was incremented and if the negative word was found the negative word counter was incremented. In second approach instead of the positive and negative word list the HNSW was used remaining all the steps were same as in the first approach. In third approach seven features were created and applied on the sentences. The features are as follows, to find the frequency of the word, adjective, noun, verb, adverb, total positive polarity and negative polarity of the sentence. These features were sent to the neural network for testing and the polarity of the word was detected. After the comparison of all approaches it was found that the second approach had the best accuracy which was 71.5%.
Ansari et al. [9] introduced an architecture for two code-mix languages, Hindi and Marathi. The architecture included language identification, feature generation and sentiment classification as major steps. Hindi and English WordNet’s and SWNs were used as there was no SWN for Marathi. The Marathi words were first translated into English and the sentiment score of the English words were found and assigned to the words. Also, classification algorithms such as Random Forest, Naïve Bayes, and Support Vector Machine (SVM) were used to find the polarity in the final step. Slang identification and emoticons were also crucial steps in the study. Slang is a group of words which are used informally in a particular language. Emoticons are the representation of different facial expressions. SVM performed the best among all the algorithms with accuracy of 90% and 70% for Marathi and Hindi language.
In the paper, Jha et al. [10] explains that there are a lot of research done in the English language for SA, but little for the Hindi language. The system developed by the authors carried out the SA in Hindi language using two approaches. In first approach, Naïve Bayes was used for document classification and in the second approach, the parts of speech (POS) tagging was done using TnT POS Tagger by using the rule-based approach on the classification of opinionated words was completed. 200 positive and 200 negative movie review documents were web scraped for testing the system. Accuracy of 80% was achieved by the system.
2.2. Sentence Level
Sentence-level SA identifies the opinions on the sentence and classifies the sentence as positive, negative or neutral. There are two types of sentences, subjective and objective sentences, which are required to be identified while performing sentence-level SA. Subjective sentences carry opinions, expressions and emotions in them. Objective sentences are the factual information. Sentence-level SA can be carried out only on the subjective sentences hence it is important to first filter out objective sentences.
SWN (Senti Word Net) is a most common lexicon-based approach used by the researchers. Haithem et al. [7,11] developed the Irish SWN whose accuracy was 6% greater than the accuracy obtained by transliteration of the Irish Tweets into English. The lexicon was manually created. The accuracy difference between the systems was because of the translation carried out into the English language [11]. Naidu et al. [7,12] carried out the SA on Telugu e-newspapers. Their system was divided in two steps. The first step was subjectivity classification. The second step was sentiment classification. In the first step the sentences were divided as subjective and objective sentences. In the second step only, the subjective sentences were further classified as positive, negative and neutral. Both the steps were performed using the SWN which gave the accuracy of 74% and 81% [7,12].
Nanda et al. [7,13] used the SWN to automatically annotate the movie review dataset. Machine-learning algorithms Random Forest and SVM were used to carry out the sentiment classification. Random Forest performed better than SVM giving the accuracy of 91%. Performance metrics used to evaluate the algorithms were accuracy, precision, recall, F1-score [7,13].
Pandey et al. [7,14] defined a framework to carry out the SA task on the Hindi movie reviews. It has been observed that the lower accuracy was obtained by using SWN as a classification technique and hence suggested using synset replacement algorithm along with the SWN. Synset replacement algorithms groups the synonymous words with the same concepts together. It helped in increasing the accuracy of the system because if the word was not present in the Hindi SWN then it find the closest word and assigned the score of that word [7,14]. In the study, Bhargava et al. [7,15] completed the SA task on the FIRE 2015 dataset. The dataset consisted of code-mixed sentences in English along with 4 Indian languages (Hindi, Bengali, Tamil, Telugu). The architecture consisted of 2 main steps, Language Identification and Sentiment Classification. Punctuation and hashtags were identified and handled by the CMU Ark tagger. Machine-learning techniques such as logistic regression and SVM were used for language identification. SWNs of each language were used for sentiment classification. The results of the implemented system were compared with the previous language translation technique and 8% better precision was observed [7,15].
Kaur, Mangat and Krail [7,16] carried out their SA task on Hinglish language, popularly be used for the social media communication. The authors [10] had created a Hinglish corpus which contained movie review domain-specific Hindi words. Stopword removal and tokenization were the pre-processing techniques used in the system, along with TF-IDF as the vectorization technique. Classification algorithms such as SVM and Naïve Bayes were used to carry out the classification task. As future work, the authors in [7,16] are trying to find the best feature and classifier combination.
SVM is the machine-learning algorithm which is among the top choice of researchers. The researchers have even compared the results of the different deep-learning models with SVM [17]. In [7,17] SA task was performed on a Tibetan microblog where Word2vec was used as a vectorization technique. It converts the words into the numeric vector. After the vectorization step the classification of the data was carried out by the different machine-learning and deep-learning algorithms such as SVM, Convolution Neural Network (CNN), Long short-term memory (LSTM), CNN-LSTM. CNN is a type of neural network with 4 layers; Input layer, convolution layer, global max pooling layer, output layer. Convolutional layer is the main layer because as feature extraction is done in this layer. LSTM is the variant of the RNN (Recurrent Neural Network) which are capable of learning long term dependencies and detecting patterns in the data. The comparative study of different algorithms displays CNN-LSTM model as the best model with the accuracy of 86.21% [17].
Joshi et al. [7,18] carried out SA on the Gujarati tweets. Stopword removal and stemming were the pre-processing techniques used in the implemented model. Feature-extraction technique, Parts of Speech (POS) tagging and the classification algorithm SVM was used in the system. SVM performed very well and gave accuracy of 92%. Sharma et al. [7,19] tried to predict the Indian election results by extracting the Hindi tweets for the political domain. The tweets were mainly for 5 major political parties. Three approaches which were implemented to predict the winner in the election. The first approach was dictionary-based in which n-gram was used as a pre-processing technique and TF-IDF was used as a vectorization technique. SWN was used to classify the data and assign the polarity score to the words. Naïve Bayes algorithm and SVM were the remaining two approaches which were used. SVM and Naïve Bayes predicted party BJP (Bhartiya Janta Party) as the winner. SVM had the accuracy of 78.4% which was highest among the three implemented approaches.
Phani et al. [20] carried out SA in three different languages, Hindi, Tamil and Bengali. Feature-extraction techniques, n-grams, and surface features were explored in detail because they were language independent, simple and robust. 12 surface features were considered in the study where some of them were number of the words in tweet, number of hashtags in the tweet, number of characters in the tweet etc. A comparative study was carried out to find out which feature extraction and sentiment classifier algorithm worked best together. The classifiers such as Multinomial Naïve Bayes, Logical Regression (LR), Decision Trees, Random Forest, SVM SVC and SVM Linear SVC were applied to the dataset. Most of the languages worked best with the word unigram and LR algorithm which result the highest accuracy of 81.57% for Hindi [7,20]. Research by Sahu et al. [7,21] was carried out on movie reviews in the Odia language. Naïve Bayes, Logistic Regression, and SVM were used for the purpose of classification. Comparison of the results of different algorithms was done using performance metrics such as accuracy, precision and recall. Logistic Regression performed the best with the accuracy of 88% followed by Naïve Bayes with accuracy of 81% and SVM with the accuracy of 60% [7,21].
Guthier et al. [7,22] proposed the language-independent approach for SA. An emoticon dictionary was created, and scores were assigned to the emoticons. When the tweet contained a combination of hashtags and emoticons, the hashtags were also added to the dictionary. A graph-based approach was implemented in the study. The graph-based approach worked on the principle that if multiple hashtags were present in the sentence then all the hashtags would have the same sentiment score. Also, all the hashtags present in the same sentence could be linked with each other. The work was tested on 5 different languages and the accuracy obtained was above 75%. Average accuracy of the model was 79.8%. The approach worked fairly with the single word hashtags and the hashtags which formed the sentences and accuracy for them were 98.3% and 84.5% respectively.
Kaur et al. [7,23] worked on the Hinglish language dataset. YouTube comments of two popular cookery channels were extracted and analysis was carried out on them. Pre-processing techniques such as stopword removal, null values removal, spell errors removal, tokenization and stemming were performed. DBSCAN which is the unsupervised learning clustering algorithm was used and 7 clusters were formed for the entire dataset. Dataset was manually annotated with the labels of 7 classes. 8 machine-learning algorithms were used to perform sentiment classification. Logistic regression along with term-frequency vectorization outperforms the other classification techniques with the accuracy of 74.01% for one dataset and 75.37% for the other dataset. Statistical testing was also carried out to confirm the accuracy of the classifiers.
Both document-level and sentence-level SA extract the sentiments for the given text but the feature for which the sentiment is expressed cannot be found. This shortcoming is fulfilled by aspect-level SA.
2.3. Aspect Level
Aspect-level SA is carried out in two steps. The first step is to find the features or the components in the text and the second step is to find polarity of sentiments attached to each feature, e.g., mobile reviews are given in the series of the tweets. The companies first find out which part or feature of the mobile the users are talking about and then find out the emotions related to that feature.
In the paper by Ekbal et al. [7,24] the aspect-level SA was carried out on product reviews. The dataset was obtained by web scrapping on different websites. Multi-domain product reviews obtained were analyzed in a two-step process—the first step was aspect extraction i.e., the aspects (features) in the review were extracted using the Condition Random Field Algorithm. Performance evaluation metrics such as F-measure and accuracy were used. SVM gave the accuracy of 54.05% for sentiment classification.
The proposed work by Ray et al. [7,25] is a SA of twitter data. POS tagging was used as a feature-extraction technique. Word embedding was used as the vectorization technique. Word embedding is the method where the words of sentences are converted into vectors of real numbers. Aspects were not directly labeled; instead, they were tagged to a predefined list of categories. Classification of the data was done using three approaches, CNN, rule-based approach, CNN + rule-based approach. The hybrid model of CNN + rule-based approach gave an accuracy of 87%.
Table 1 is the representation of the work done by different researchers in indigenous language [7].

Table 1.
Review Papers.
3. Current Trending Techniques in NLP
The traditional machine-learning and lexicon-based approaches did not give the expected results. With the emergence of the deep-learning techniques such as CNN, RNN, and LSTM, the performance improvements in the results was observed. The main problem with the deep-learning algorithms is that they have high complexity and computational cost. BERT and ELMo are a few pre-trained classifiers which solved the problems of the deep-learning models and outperformed them. This section identifies the different papers in which deep-learning models and advanced models are used.
Hoang et al. [7,29], aspect-based sentiment analysis on the SemEval-2016-Task 5 was performed. There were three models implemented in the paper, the aspect classification model which identified whether the aspect was related or not to the text, sentiment classifier which classified the text into the three sentiment classes positive, negative, and neutral. Both classifiers follow the structure of the sentence pair classifier which takes two inputs, the classifier token and the separation token which were added to the beginning and end of the sentences, respectively. The final classifier implemented was the combined model which identified the sentiments of the text as well as the aspect of the text. The sentence pair classifier is the part of the bidirectional encoder representation from transformer (BERT) model. BERT is a bidirectional and unsupervised language representation model. It considers the context of a word from both left to right and right to left simultaneously and provides better features compared to the traditional models. The performance of the combined model was better than the traditional approaches and was tested on 18 different datasets.
Khatua et al. [7,26] performed SA on Twitter to understand user response on the supreme court verdict of the decriminalization of LGBT. The authors extracted 0.58 million tweets and used different machine learning and deep-learning classifiers such as Naïve Bayes, SVM-R, SVM-P, BLM, multilayer perceptron (MLP), Long short-term memory (LSTM), Bi-LSTM and CNN. Bi-LSTM is a special type of LSTM in which the information is available from forward to backward and backward to forward that is in both directions. Bi-LSTM outperforms with the accuracy of 90%.
Rani et al. [7,28] performed SA on Hindi movie reviews collected from e-newspapers and different online websites. The classification technique used in the paper was CNN. CNN gave accuracy of 95% which was much higher than the other traditional algorithms.
Godino et al. [7,27] carried out SA on Spanish tweets using three different classifier models which were feature classifier, FastText classifier, BERT classifier. Feature classifier extracted the important features from the tweets such as the length of the tweets, number of hashtags etc. and applied these features to the traditional machine-learning algorithms to carry out the sentiment classification. The traditional algorithms used where: Logistic Regression, Multinomial Naïve Bayes, Decision Tree, Support Vector Machines, Random Forest, Extra Trees, AdaBoost and Gradient Boost. FastText Classifier was developed by Facebook AI research and it internally works on the neural network architecture. BERT Classifier was also applied on the tweets. The output of the three classifiers were combined using averaging assembling. The model was evaluated using the F1 score. F1 score of 45% and 46% was obtained on the train and test data of the implemented model.
4. Methodology
In this section, the different steps carried out for performing sentiment analysis on dataset are explained in detail (Figure 1).
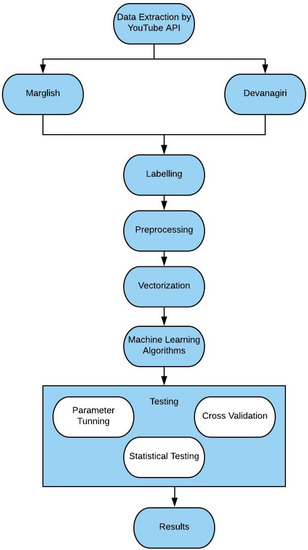
Figure 1.
Architecture of Propose System.
- Data Extraction using YouTube API
- Labeling and Categorization
- Pre-processing
- Vectorization
- Applying Machine-learning models
- Testing
- Data Extraction using YouTube API: The top Marathi Cookery Channels are analyzed, and data is extracted from them using the YouTube API. Python is the programming language we have used for implementing the system. 42,551 Comments were extracted and stored together in the CSV File. The data was manually split into 2 files. The first file (Marglish.csv) contained the Marathi language data written in English and the second file (devanagiri.csv) consisted of the data written in Devanagari script. The initial extracted file also had pure English language comments which were not considered in any of the files. Total of 14,453 and 4145 comments were present in Marglish.csv and devanagiri.csv. The distribution of the different comment categories is shown in Table 2 and Table 3 respectively.
Table 2. Number of comments in each label category for the Marglish dataset.
Table 3. Number of comments in each label category for the Devanagari dataset.
- Labeling and Categorization: The data is been manually labeled into 5 categories as mentioned in the Figure 2
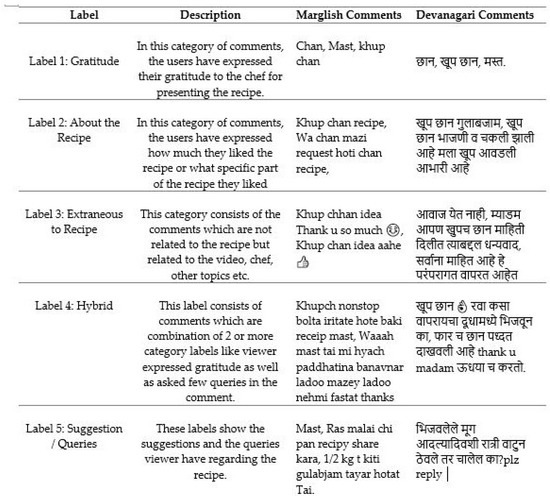 Figure 2. Categories of the Comments.
 - Pre-processing: The data from the Internet is usually unstructured and has lot of unwanted content. In this step various methods and techniques are used which helped in data cleansing process.
- (a)
- Removal of Blank rows: The rows containing empty cells are removed
- (b)
- Removal of Duplicate values: The comments which are repetitive are removed as they can influence the Machine-Learning algorithm response.
- (c)
- Removal of Stop words: Stop words are the words which do not contribute to the meaning or to the sentiment orientation of the sentence. For the Marglish dataset the English stop words are only removed and for the Devanagari dataset the Marathi stop words are extracted from [30], stored in the csv file. Figure 3 sentence explains the stop words removal process. Figure 4 and Figure 5 represent the English and the Marathi stopword list.
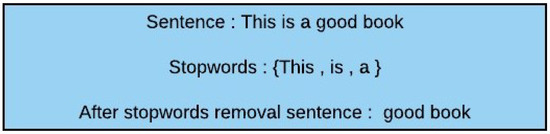 Figure 3. Stopwords Removal.
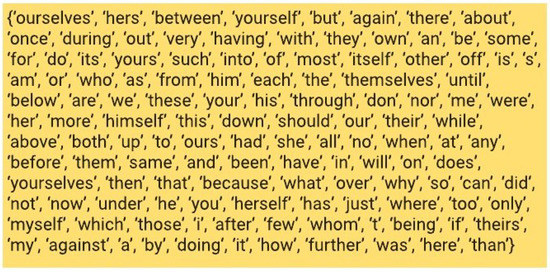 Figure 4. Stopwords English.
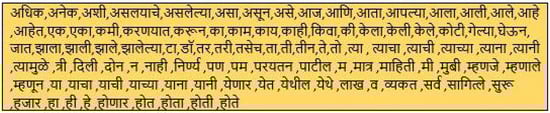 Figure 5. Stopwords Marathi.
 - (d)
- Tokenization: It is the process of breaking down the paragraphs into sentences and sentences into words. These individual words are known as Tokens. Tokenization helps in finding the frequency of the words in the document which directly helps in finding the importance of the word in the document. Figure 6 explains the tokenization process in detail.
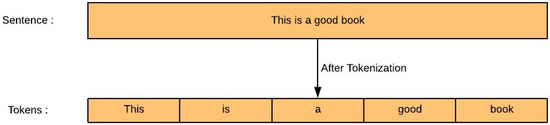 Figure 6. Tokenization.
 - (e)
- Removal of emoticons: Emoticons are the facial expressions present in the text. They do help in interpreting the sentiment orientation of the sentence, but they will be considered to be analyzed in the future scope of work. The Python library demoji is used to find and remove all the emoticons from the text.
- (f)
- Stemming: This is a technique which helps to convert the word from the original form to the root or stem form. The Porter Stemmer algorithm is used in the system. There is not any stemming algorithm available for the Marathi language. Figure 7 and Figure 8 shows the stemming process in detail.
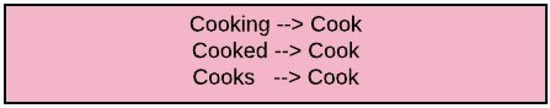 Figure 7. Word Stemming
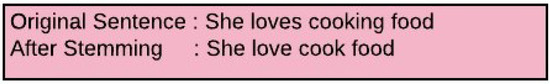 Figure 8. Sentence stemming.
- Vectorization: Machine-learning algorithms do not work with the textual data. Textual data must be converted into the numerical or binary format for the algorithms to understand and process the results. The process of converting the contextual data into the numeric format is known as Vectorization. Three famous vectorization techniques used in the proposed system are:
- (a)
- TF-IDF Vectorizer: Term-Frequency-Inverse Data Frequency (TF-IDF) vectorizer calculates the term frequency and inverse data frequency of the word in the text. Term frequency of word (x) is, the number of times the x appeared in the given text divided by the total number of words in a text. Inverse data frequency of a word (x) is the number of documents divided by the number of documents in which word appeared. The mathematical representation of the TF score and IDF score of the word is as below:
- (b)
- Count Vectorizer: Count Vectorizer also known as one hot encoding creates the vector equal to the size of the vocabulary. Every time a word occurs in the sentence it is checked in the vocabulary and marked as 1. If the word reoccurs in the document its count is incremented. If the words are not present in the vocabulary they are added to the vocabulary. Figure 9 explains the working of the count vectorizer in detail.
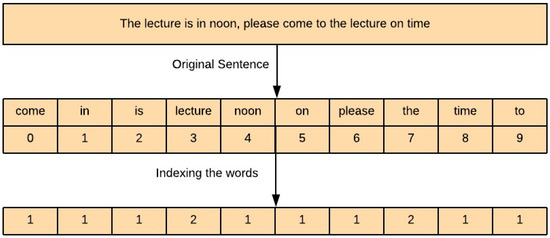 Figure 9. Count Vectorization.
 - (c)
- Hashing Vectorizer: The problem with the above two vectorizers Count and TF-IDF Vectorizer is that they generate a sparse matrix. Also, as the data size increases it becomes difficult to store a vector with the size of vocabulary. The hashing vectorizer solves both the issues as it uses the hashing functionality to convert the text into vector of fixed length. The only disadvantage of the hashing vectorizer is that the inverse vector to text conversion cannot be achieved.
- Machine-Learning Algorithms: Machine learning is branch of artificial intelligence. According to Naqa et al. [31] Machine-learning algorithms are the developed to imitate the human intelligence by learning from the surrounding. The main purpose of any machine-learning algorithm is to predict the outcome of the unseen or future data. Based on the type of data available for predictions the machine-learning algorithms are categorized further into 4 different types, which are mentioned below.
- (a)
- Supervised learning: The data available has features (input labels) and output label are predefined. The data is segregated into training data and test data. The model prepares itself by running the training data and makes predictions for it. The models keep on learning through the training data till the desired level of accuracy is not achieved. The supervised learning algorithms are further classified into classification and regression algorithms. Classification and Regression algorithms differ in the way they predict the output label. In Classification algorithms the output is categorical whereas in regression algorithms the output is numerical.
- (b)
- Unsupervised learning: When the data is not labeled, that is the output feature which is to be predicted is unknown then the unsupervised learning algorithms are used. The model tries to understand the general common rules in the data by understanding the patterns and grouping the data based on the similarity. There are 2 types of unsupervised learning algorithms such as Clustering algorithms and Association rule. In clustering algorithms, the data is grouped based on the similarity trait which they have in common whereas association rule algorithms try to extract the rules which help in finding the best relationships between the variables.
- (c)
- Semi-Supervised learning: It falls between the supervised and unsupervised learning algorithm. The data has both known and unknown output labels. The model must understand the structure as well as predict the unknown output labels. Semi-supervised learning algorithms perform self-training using the concept of pseudo learning in which first the model is trained with the part of the dataset which is labeled. The next step is then to apply the model which gives good results on the unlabeled part of the dataset. The resultant test labels may not be 100% accurate but majority of them will be accurate. All the labels and the features of training and test set will be combined and then model will be trained again as it was done before.
- (d)
- Reinforcement learning: In reinforcement learning the model tries to learn from the past output provided by the system. It tries to maximize the success and minimize the error scenarios. Every prediction of the model is dependent on the previous output and the current input state.
In the proposed system the supervised machine-learning algorithms are used. As the data is labeled into different categories it becomes the case of the classification supervised learning algorithm. Also, the machine-learning algorithms are divided into 2 types based on the type of parameters, such as parametric algorithms and non-parametric models. The major difference between them is that in the parametric models the number of parameters are finite and they are not that flexible where as non-parametric models have infinite number of parameters and the amount of information increases as the data grows, i.e., they are more flexible. Below Table 4 shows the Different classification learning algorithms used in the proposed system:
Table 4. Machine-learning algorithms and their types. - Testing: The machine-learning algorithms cannot be applied directly to the data, testing the data is very important before making any decisions about the application of the models. Testing can be done by applying cross-validation, parameter tuning and statistical testing. It is also considered to be a best practice to apply these three techniques before evaluating the results of the model.
- (a)
- Cross-Validation: When the machine-learning algorithms are applied directly to the structured cleaned and balanced dataset then there are always high chances that the model will give good accuracy and then with the unseen or real data the model performance becomes low. The model learns the training data along with the noise present in it. This is known as overfitting. To avoid the overfitting, one part of the data is hold out and kept for testing purpose but this approach also does not work as expected because there are high chances that model would miss out the important patterns present in the test data. Underfitting is the problem which occurs when the model does not give good performance with the training data and the unseen data. To avoid overfitting and underfitting problems and to validate the accuracy of the data, cross-validation is used. In cross-validation the data is split into different parts for e.g., in 5-fold cross-validation the data is split into 5 parts. Each part at least once will be considered to be a test set and the remaining parts will be considered in the training set this will help the model to understand all the patterns present in the data and reduce the bias. In the proposed system, 10-fold cross-validation is applied on the machine-learning algorithms.
- (b)
- Parameter Tuning: Every machine-learning algorithm has a set of parameters which are either required or optional. The goal of any machine-learning algorithm is to complete the learning in the best possible way. Thus, to achieve the best results, it will be required to change the values or tune the parameters present in the algorithm. Parameter tuning can be performed using different approaches which are mentioned below
- Manual: Manually trying different combination of values
- Grid Search: In this set of different hyperparameter values are added and all the combinations are checked to find the optimal solution. It is time consuming to check for each combination of values.
- Random Search: In this the set of different hyperparameter values are added and randomly combinations of hyperparameters are set. The number of iterations to be performed for searching can be set.
In this proposed system we have used grid search to find out the optimal parameter values. Table 5 represents the different parameters which were tuned to get the best performance of the models.
Table 5. Parameter Tuning. - (c)
- Statistical Testing: Statistical testing is a study done on the machine-learning algorithms to find out whether the algorithms are significantly different from one another and to check the accuracy obtained from the algorithms is stable and can be further used for the real time data. There are different types of statistical testing methods but in the proposed system Cochran’s Q test is used to compare the performance of the multiple classifier algorithms. It is tested to check the hypothesis that there is no difference between the classification accuracies of the classifiers. It is the generalized version of the McNemar’s test, which evaluates only 2 models at a time. The p value for the proposed system is 1.48 × 10−110 which is less than alpha (0.05), hence we reject the hypothesis that the classifiers have similar accuracies.
5. Results
After applying the classification algorithms on the Devanagari dataset and the Marglish dataset the results are shown in Table 6 and Table 7 respectively.
Table 6.
Training Score Results for Devanagari dataset.
Table 7.
Training Score Results for Marglish dataset.
In Table 6 along with the TF-IDF Vectorizer the Bernoulli Naïve Bayes (BNB) works the best with the accuracy of 55.54% again the Bernoulli Naïve Bayes performs best with the Count vectorizer with accuracy of 60.60%. The hashing vectorizer works best with MLP with accuracy of 54.10%. Count Vectorizer with the BNB gives the best results for the Devanagari dataset.
Table 7 show the classification results on the Marglish Dataset. MLP gives the best accuracy with all the vectorizers (TF-IDF, Count and Hashing) with the accuracy of 62.28%, 62.68%, 60.93%.
Table 8 and Table 9 represents the testing score results of the best models which were identified while performing the 10 fold cross-validation.
Table 8.
Testing Score for Devanagari dataset.
Table 9.
Testing Score for Marglish dataset.
6. Discussions
In this section, the limitations and the findings will be discussed in detail.
6.1. Findings
After detailed analysis on the datasets the answers of the initial research questions are found out. Two datasets which were used had both the input and the output labels present and hence supervised learning algorithms were used to carry out the classification. Most of the research limits its research with 4–5 algorithms but here 10 algorithms were used and cross-validation, parameter tuning and statistical testing was carried out to confirm the results. MLP worked best with all the vectorizers for the Marglish dataset (approx 64%); also, BNB performed exceptionally well with Count Vectorizer for the Devanagari dataset. Therefore, based on the results it can be concluded that MLP works exceptionally well when the dataset is large. MLP and BNB were considered to be the best models for the proposed systems.
While carrying out the manual labeling process, 5 different categories were discovered in the dataset. In most of the comments, the viewers were praising the recipe, praising the chef, video and writing their suggestions and queries. The suggestions and queries category comments will be very useful for the YouTube cookery channels because the suggestions and queries can help the channels to improve and grow.
6.2. Limitations
- Marglish is not an official language and hence there is no specific SentiWordNets present for it. Also, there is no predefined stopword list for the language.
- In this paper, only the English stopwords are removed. For the Devanagari dataset the stopwords are extracted from the list and it is not stable.
- There is no official stemming algorithm for both the Devanagari and the Marglish and hence the port stemmer for the English language was used. This could have a significant effect on the accuracy of the models.
- Python code was used to extract the comments using the YouTube API. The search string contains the popular channels being manually identified. For e.g., “Madhuras Recipe” is the most popular Marathi recipe channel it was identified manually and then the search string was set as “Madhuras Recipe”. There were a few scenarios in which the comments from different domains got extracted and had to be manually removed.
7. Conclusions and Future Work
India has the second highest number of internet users in the world. As the Indian population has started using the Internet increasingly, they are addicted to social networking apps and YouTube.
YouTube has a large amount of Internet users (245 million) in India [1]. YouTube has become a popular choice by the people in India because it helps users to learn and share their opinions in the form of videos. There are different genres of data generated on the YouTube. The aim of paper was to help the Marathi cookery channels improve their content by helping them analyze the comments posted by the users. In this study, the machine-learning algorithms MLP along with Count vectorizer outperformed with the accuracy of 62.68% for the Marglish dataset and BNB performed best with the Count vectorizer with the accuracy of 60.60%. So MLP and BNB are the top models and count vectorizer is the best vectorizer according to this study.
As a part of the future scope, deep-learning and advanced deep-learning algorithms will be applied to the datasets. Clustering algorithms such as density-based spatial clustering of applications with noise (DBSCAN) and K-means can be used to simplify the labeling process. New data will be extracted and will be used as a validation set for future analysis. Emoticons will be considered in the dataset. Dataset size will be increased, and data will be analyzed for the other genre such as education, music etc.
Author Contributions
Conceptualization, A.K.; Data curation, J.S.; Formal analysis, S.R.S. and S.S.; Investigation, S.R.S.; Methodology, S.R.S. and A.K.; Project administration, J.S.; Resources, S.S.; Supervision, A.K. and S.S.; Validation, A.K.; Writing—review and editing, A.K. All authors have read and agreed to the published version of the manuscript.
Funding
This research received no external funding.
Conflicts of Interest
The authors declare no conflict of interest.
References
- List of Countries by Number of Internet Users. Available online: https://en.wikipedia.org/wiki/List_of_countries_by_number_of_Internet_users (accessed on 6 January 2020).
- Diwanji, S. Most Popular Smartphone Activities in India as of January 2018. Available online: https://www.statista.com/statistics/309867/mobile-phone-activities-india/ (accessed on 6 January 2020).
- Mitter, S. How YouTube India Spurred a Thriving Content Economy Cutting across Genres, Languages, Demographics. Available online: https://yourstory.com/2019/03/youtube-india-thriving-content-economy-yi37d6xy4u (accessed on 6 January 2020).
- Rao, Y.; Xie, H.; Li, J.; Jin, F.; Wang, F.L.; Li, Q. Social emotion classification of short text via topic-level maximum entropy model. Inf. Manag. 2016, 53, 978–986. [Google Scholar] [CrossRef]
- Nagarajan, R. 52% of India’s Urban Youth Are Now Bilingual, 18% Speak Three Languages. Available online: https://timesofindia.indiatimes.com/india/52-of-indias-urban-youth-are-now-bilingual-18-speak-three-languages/articleshow/66530958.cms (accessed on 6 January 2020).
- Pundlik, S.; Dasare, P.; Kasbekar, P.; Gawade, A.; Gaikwad, G.; Pundlik, P. Multiclass classification and class based sentiment analysis for Hindi language. In Proceedings of the IEEE 2016 International Conference on Advances in Computing, Communications and Informatics (ICACCI), Jaipur, India, 21–24 September 2016; pp. 512–518. [Google Scholar]
- Shah, S.R.; Kaushik, A. Sentiment Analysis On Indian Indigenous Languages: A Review On Multilingual Opinion Mining. arXiv 2019, arXiv:1911.12848. [Google Scholar]
- Yadav, M.; Bhojane, V. Semi-Supervised Mix-Hindi Sentiment Analysis using Neural Network. In Proceedings of the IEEE 2019 9th International Conference on Cloud Computing, Data Science & Engineering (Confluence), Noida, India, 10–11 January 2019; pp. 309–314. [Google Scholar]
- Ansari, M.A.; Govilkar, S. Sentiment Analysis of Mixed Code for the Transliterated Hindi and Marathi Texts. Int. J. Nat. Lang. Comput. 2018, 7, 14. [Google Scholar]
- Jha, V.; Manjunath, N.; Shenoy, P.D.; Venugopal, K.; Patnaik, L.M. Homs: Hindi opinion mining system. In Proceedings of the 2015 IEEE 2nd International Conference on Recent Trends in Information Systems (ReTIS), Kolkata, India, 9–11 July 2015; pp. 366–371. [Google Scholar]
- Afli, H.; Maguire, S.; Way, A. Sentiment translation for low resourced languages: Experiments on irish general election tweets. In Proceedings of the 18th International Conference on Computational Linguistics and Intelligent Text Processing, Budapest, Hungry, 17–21 April 2017. [Google Scholar]
- Naidu, R.; Bharti, S.K.; Babu, K.S.; Mohapatra, R.K. Sentiment analysis using Telugu sentiwordnet. In Proceedings of the 2017 International Conference on Wireless Communications, Signal Processing and Networking (WiSPNET), Chennai, India, 22–24 March 2017; pp. 666–670. [Google Scholar]
- Nanda, C.; Dua, M.; Nanda, G. Sentiment Analysis of Movie Reviews in Hindi Language Using Machine Learning. In Proceedings of the IEEE 2018 International Conference on Communication and Signal Processing (ICCSP), Chennai, India, 3–5 April 2018; pp. 1069–1072. [Google Scholar]
- Pandey, P.; Govilkar, S. A framework for sentiment analysis in Hindi using HSWN. Int. J. Comput. Appl. 2015, 119. [Google Scholar] [CrossRef]
- Bhargava, R.; Sharma, Y.; Sharma, S. Sentiment analysis for mixed script indic sentences. In Proceedings of the IEEE 2016 International Conference on Advances in Computing, Communications and Informatics (ICACCI), Jaipur, India, 21–24 September 2016; pp. 524–529. [Google Scholar]
- Kaur, H.; Mangat, V.; Krail, N. Dictionary based sentiment analysis of hinglish text. Int. J. Adv. Res. Comput. Sci. 2017, 8. [Google Scholar] [CrossRef]
- Sun, B.; Tian, F.; Liang, L. Tibetan Micro-Blog Sentiment Analysis Based on Mixed Deep Learning. In Proceedings of the IEEE 2018 International Conference on Audio, Language and Image Processing (ICALIP), Shanghai, China, 16–17 July 2018; pp. 109–112. [Google Scholar]
- Joshi, V.C.; Vekariya, V.M. An approach to sentiment analysis on Gujarati tweets. Adv. Comput. Sci. Technol. 2017, 10, 1487–1493. [Google Scholar]
- Sharma, P.; Moh, T.S. Prediction of indian election using sentiment analysis on hindi twitter. In Proceedings of the 2016 IEEE International Conference on Big Data (Big Data), Washington, DC, USA, 5–8 December 2016; pp. 1966–1971. [Google Scholar]
- Phani, S.; Lahiri, S.; Biswas, A. Sentiment analysis of tweets in three Indian languages. In Proceedings of the 6th Workshop on South and Southeast Asian Natural Language Processing (WSSANLP2016), Osaka, Japan, 11–16 December 2016; pp. 93–102. [Google Scholar]
- Sahu, S.K.; Behera, P.; Mohapatra, D.; Balabantaray, R.C. Sentiment analysis for Odia language using supervised classifier: An information retrieval in Indian language initiative. CSI Trans. ICT 2016, 4, 111–115. [Google Scholar] [CrossRef]
- Guthier, B.; Ho, K.; El Saddik, A. Language-independent data set annotation for machine learning-based sentiment analysis. In Proceedings of the IEEE 2017 IEEE International Conference on Systems, Man, and Cybernetics (SMC), Banff, AB, Canada, 5–8 October 2017; pp. 2105–2110. [Google Scholar]
- Kaur, G.; Kaushik, A.; Sharma, S. Cooking Is Creating Emotion: A Study on Hinglish Sentiments of Youtube Cookery Channels Using Semi-Supervised Approach. Big Data Cogn. Comput. 2019, 3, 37. [Google Scholar] [CrossRef]
- Akhtar, M.S.; Ekbal, A.; Bhattacharyya, P. Aspect based sentiment analysis in Hindi: Resource creation and evaluation. In Proceedings of the Tenth International Conference on Language Resources and Evaluation (LREC’16), Portorož, Slovenia, 23–28 May 2016; pp. 2703–2709. [Google Scholar]
- Ray, P.; Chakrabarti, A. A Mixed approach of Deep Learning method and Rule-Based method to improve Aspect Level Sentiment Analysis. Appl. Comput. Inform. 2019. [Google Scholar] [CrossRef]
- Khatua, A.; Cambria, E.; Ghosh, K.; Chaki, N.; Khatua, A. Tweeting in Support of LGBT? A Deep Learning Approach. In Proceedings of the ACM India Joint International Conference on Data Science and Management of Data, Swissotel, Kolkata, India, 3–5 January 2019; pp. 342–345. [Google Scholar]
- Godino, I.G.; DHaro, L.F. Gth-upm at tass 2019: Sentiment analysis of tweets for spanish variants. In Proceedings of the TASS workshop at SEPLN (Spanish Society for Natural Language Processing), Bilbao, Spain, 24 September 2019; Available online: http://ceur-ws.org/Vol-2421/TASSoverview.pdf (accessed on 6 January 2020).
- Rani, S.; Kumar, P. Deep Learning Based Sentiment Analysis Using Convolution Neural Network. Arab. J. Sci. Eng. 2019, 44, 3305–3314. [Google Scholar] [CrossRef]
- Hoang, M.; Bihorac, O.A.; Rouces, J. Aspect-Based Sentiment Analysis Using BERT. In Proceedings of the 22nd Nordic Conference on Computional Linguistics (NoDaLiDa), Turku, Finland, 30 September–2 October 2019; Linköping University Electronic Press: Linköping, Sweden, 2019; pp. 187–196. Available online: http://www.sepln.org/workshops/tass/ (accessed on 6 January 2020).
- stopwords-iso/stopwords-mr. Available online: https://yourstory.com/2019/03/youtube-india-thriving-content-economy-yi37d6xy4uhttps://github.com/stopwords-iso/stopwords-mr/blob/master/stopwords-mr.txt (accessed on 6 January 2020).
- El Naqa, I.; Murphy, M.J. What is machine learning? In Machine Learning in Radiation Oncology; Springer: Berlin/Heidelberg, Germany, 2015; pp. 3–11. [Google Scholar]


© 2020 by the authors. Licensee MDPI, Basel, Switzerland. This article is an open access article distributed under the terms and conditions of the Creative Commons Attribution (CC BY) license (http://creativecommons.org/licenses/by/4.0/).