1. Introduction
Formidably sized networks are becoming more and more common, including in social sciences, biology, neuroscience, and the technology space, where the number of nodes and edges may exceed millions or billions. In such cases, the sheer size of the network presents challenges in the processing, visualizing, understanding, or even storing the network [
1,
2,
3].
When the network data exceeds the memory or disk storage capacity of a single computer, big data technology, including distributed filesystems and distributed processing techniques, can be used to store and process the data [
1,
2,
3]. The caveat with big data technology is that parallel algorithms have to be designed and implemented in place of the original, serial algorithms [
4].
Whilst big data technology provides a means to network storage and processing, for visualization and analytical purposes, smaller sized networks are much favored. Thus, coarse-grained representations of the big networks that preserve important network properties is paramount. For instance, many social systems show homophily in their network representations: nodes with similar properties tend to form highly connected groups called communities, clusters, or modules. Community detection algorithms [
5,
6,
7,
8,
9,
10] have been an active area of research, with ample algorithms to identify network communities.
Different approaches to community detection exists [
5,
6,
7,
8,
9,
10]. A more statistically oriented approach is the clustering approach, where sets of points (nodes in the graph; edges information tend not to be used) are categorized into groups called clusters, based on distance or density distributions in the state space [
11]. One popular algorithm is the k-means cluster algorithm, where each point is iteratively assigned to the cluster with the nearest arithmetic mean [
11].
When graph edges are considered, community detection algorithms often have an implicit heuristic intra-community, wherein connections are more abundant than inter-community ones. Thus, the most popular approach is based on maximizing some measures of modularity that quantify the ratio of intra- and inter-community edges, relative to a random network, such as the Louvain algorithm [
12]. However, such approaches suffer from problems of the “resolution limit”, where communities that should be distinct are merged into a bigger community [
13].
Another approach is the information theoretic approach, where we interpret the edges of the network as transportation or flow between nodes. The map equation [
14] provides an associated information cost for describing the movements within the network, given a community partitioning. If a network has regions in which a PageRank random surfer tends to stay for a long time, minimizing the cost of movement as described by the map equation would identify such regions as communities. Thus, this approach takes advantage of the duality between finding community structure in networks and minimizing the description length of a random surfer′s movements on a network. Compared to the modularity approach, which tends to view graph edges as structural connections, and where the detected communities reflect how the network formed, the information theoretic approach sees graph edges as flow, and detects communities reflect network dynamics [
7]. In particular, the InfoMap algorithm [
15] is a greedy algorithm that uses the map equation to partition a network into communities, performing well on both synthetic benchmarks and real networks [
7]. Further, it does not suffer from any resolution limit problems [
16]. It is undergoing active research with successful extensions to include those to capture higher-order flow, capturing time-dependent networks [
17], overlapping communities [
18], and multi-level communities [
19].
In this paper, we adapt InfoMap into a distributed algorithm, given its strength in capturing network dynamics, and numerous extension possibilities. Similar projects exist to parallelize InfoMap [
20,
21,
22,
23], usually involving parallelizing a certain subset of the serial algorithm, with further assumptions of thread-locking or graph locality on top of InfoMap. In this paper, we propose two advancements: first, we develop discrete mathematics to adapt InfoMap into distributed computing framework. This is distinct from other existing works, since the entire algorithm and all data structures are parallelized and distributed, while keeping the algorithm identical to the serial InfoMap. Second, we further develop the mathematics for a greedy algorithm, InfoFlow, which has logarithmic time complexity, compared to the linear complexity in InfoMap. Benchmark results of graphs of up to millions of nodes and hundreds of millions of edges confirm the time complexity improvement, while maintaining community accuracy. Thus, we develop a map equation based community detection algorithm suitable for big network data processing.
This paper is structured as follows: In
Section 2, we adapt InfoMap into a distributed computing framework, and develop the InfoFlow distributed algorithm. In
Section 3, we perform benchmark and review results. In
Section 4, we summarize and discuss future directions.
2. Methodology
In this paper, we build on top of the map equation and InfoMap to found the distributed algorithm InfoFlow, which has improved runtime complexity and can be easily deployed and applied to big datasets. We quickly present the map equation in
Section 2.1 for easy reference. Then, we develop the discrete mathematics in
Section 2.2, which allow InfoMap to be adapted to distributed computing framework. In
Section 2.3, we further develop the discrete math for the InfoFlow algorithm, which has logarithmic time complexity, as compared to the linear time complexity in InfoMap. In
Section 3, I perform benchmarking for the two algorithms.
2.1. The Map Equation
For a given network partition, the map Equation [
14] specifies the theoretical limit of how concisely we can describe the trajectory of a PageRank random surfer on the network. The underlying code structure of the map equation is designed such that the description can be compressed if the network has regions in which the random walker tends to stay for a long time.
Given a network with n nodes indexed in Greek alphabets, we first perform PageRank analysis. The edges in the network will be interpreted as the transition probability, so that given an edge from node
α to node
β, with weight
ωαβ, a PageRank random surfer has probability proportional to the edge weight to transit from node
α to node
β, not accounting teleportation probability yet. Since the edges signify transition probability, the edge weights are normalized with respect to the outgoing node, so that:
then, each node will be associated with its ergodic frequency
pα.
The map Equation [
14] specifies that, if we partition the network nodes into modules, where each module is indexed with Latin alphabets, then the network will have an information entropy, or codelength, associated with its PageRank random walk:
where:
pi is the ergodic frequency of the module. This is simply the sum of the ergodic frequencies of the nodes within the module:
and
qi is the probability of exiting the module, accounting for PageRank teleportation:
ni being the number of nodes within module
i, and
τ is the probability of PageRank teleportation.
2.2. InfoMap
Here, we develop mathematics to construct
pi and
qi, the ergodic frequency, and the exit probability of each module, thereby allowing calculation of Equation (1). In particular, the InfoMap algorithm [
15] starts by having each node being its own module, and then in each iteration, merge two modules into one to reduce codelength. We develop maths to construct
pi and
qi, by providing formulae for the quantities in the merged module based on those in the two modules to be merged.
We can rewrite Equation (4) as:
with:
being the exit probability without teleportation.
We can define a similar quantity, the transition probability without teleportation from module
j to module
k:
Now, if we merge modules j and k into a new module with index
i, the exit probability would be follow Equation (5) with:
and the exit probability without teleportation can be calculated via:
since we are looking at the exit probability of a module, there are no self-connections within modules, so that the specification of
pα ωαβ given
α i,
β i is redundant. Then we have:
which conforms with intuition, that the exit probability without teleportation of the new module is equal to the exit probability of all nodes without counting for the connections from
j to
k, or from
k to
j.
We can further simplify the math’s by expanding the non-inclusive set specification:
Expanding gives:
which by definition is:
So that now, we can calculate
ωi and by Equation (5) we can calculate
qi.
We can do similar for
ωil, if we merged modules
j and
k into
i, and
l is some other module:
and similarly for
ωli:
With these calculations, we are able to construct the modular properties after each pair-wise merging, where the relevant properties include ni, pi, wi, and wij. We can forget about the actual nodal properties; after each merge, we only need to keep track of modular properties.
Now, we can implement the InfoMap algorithm, where initially each node is its own module, and then in each iteration, we merge the two modules that offer the greatest reduction in codelength, with the new module having modular properties according to Equations (8), (9), (16), (5), (20), and (21). The algorithm terminates when no more merges are possible to reduce codelength. Since the maximum number of merges is
e − 1 merges, where
e is the number of edges in the network, the number of merges have complexity
O(
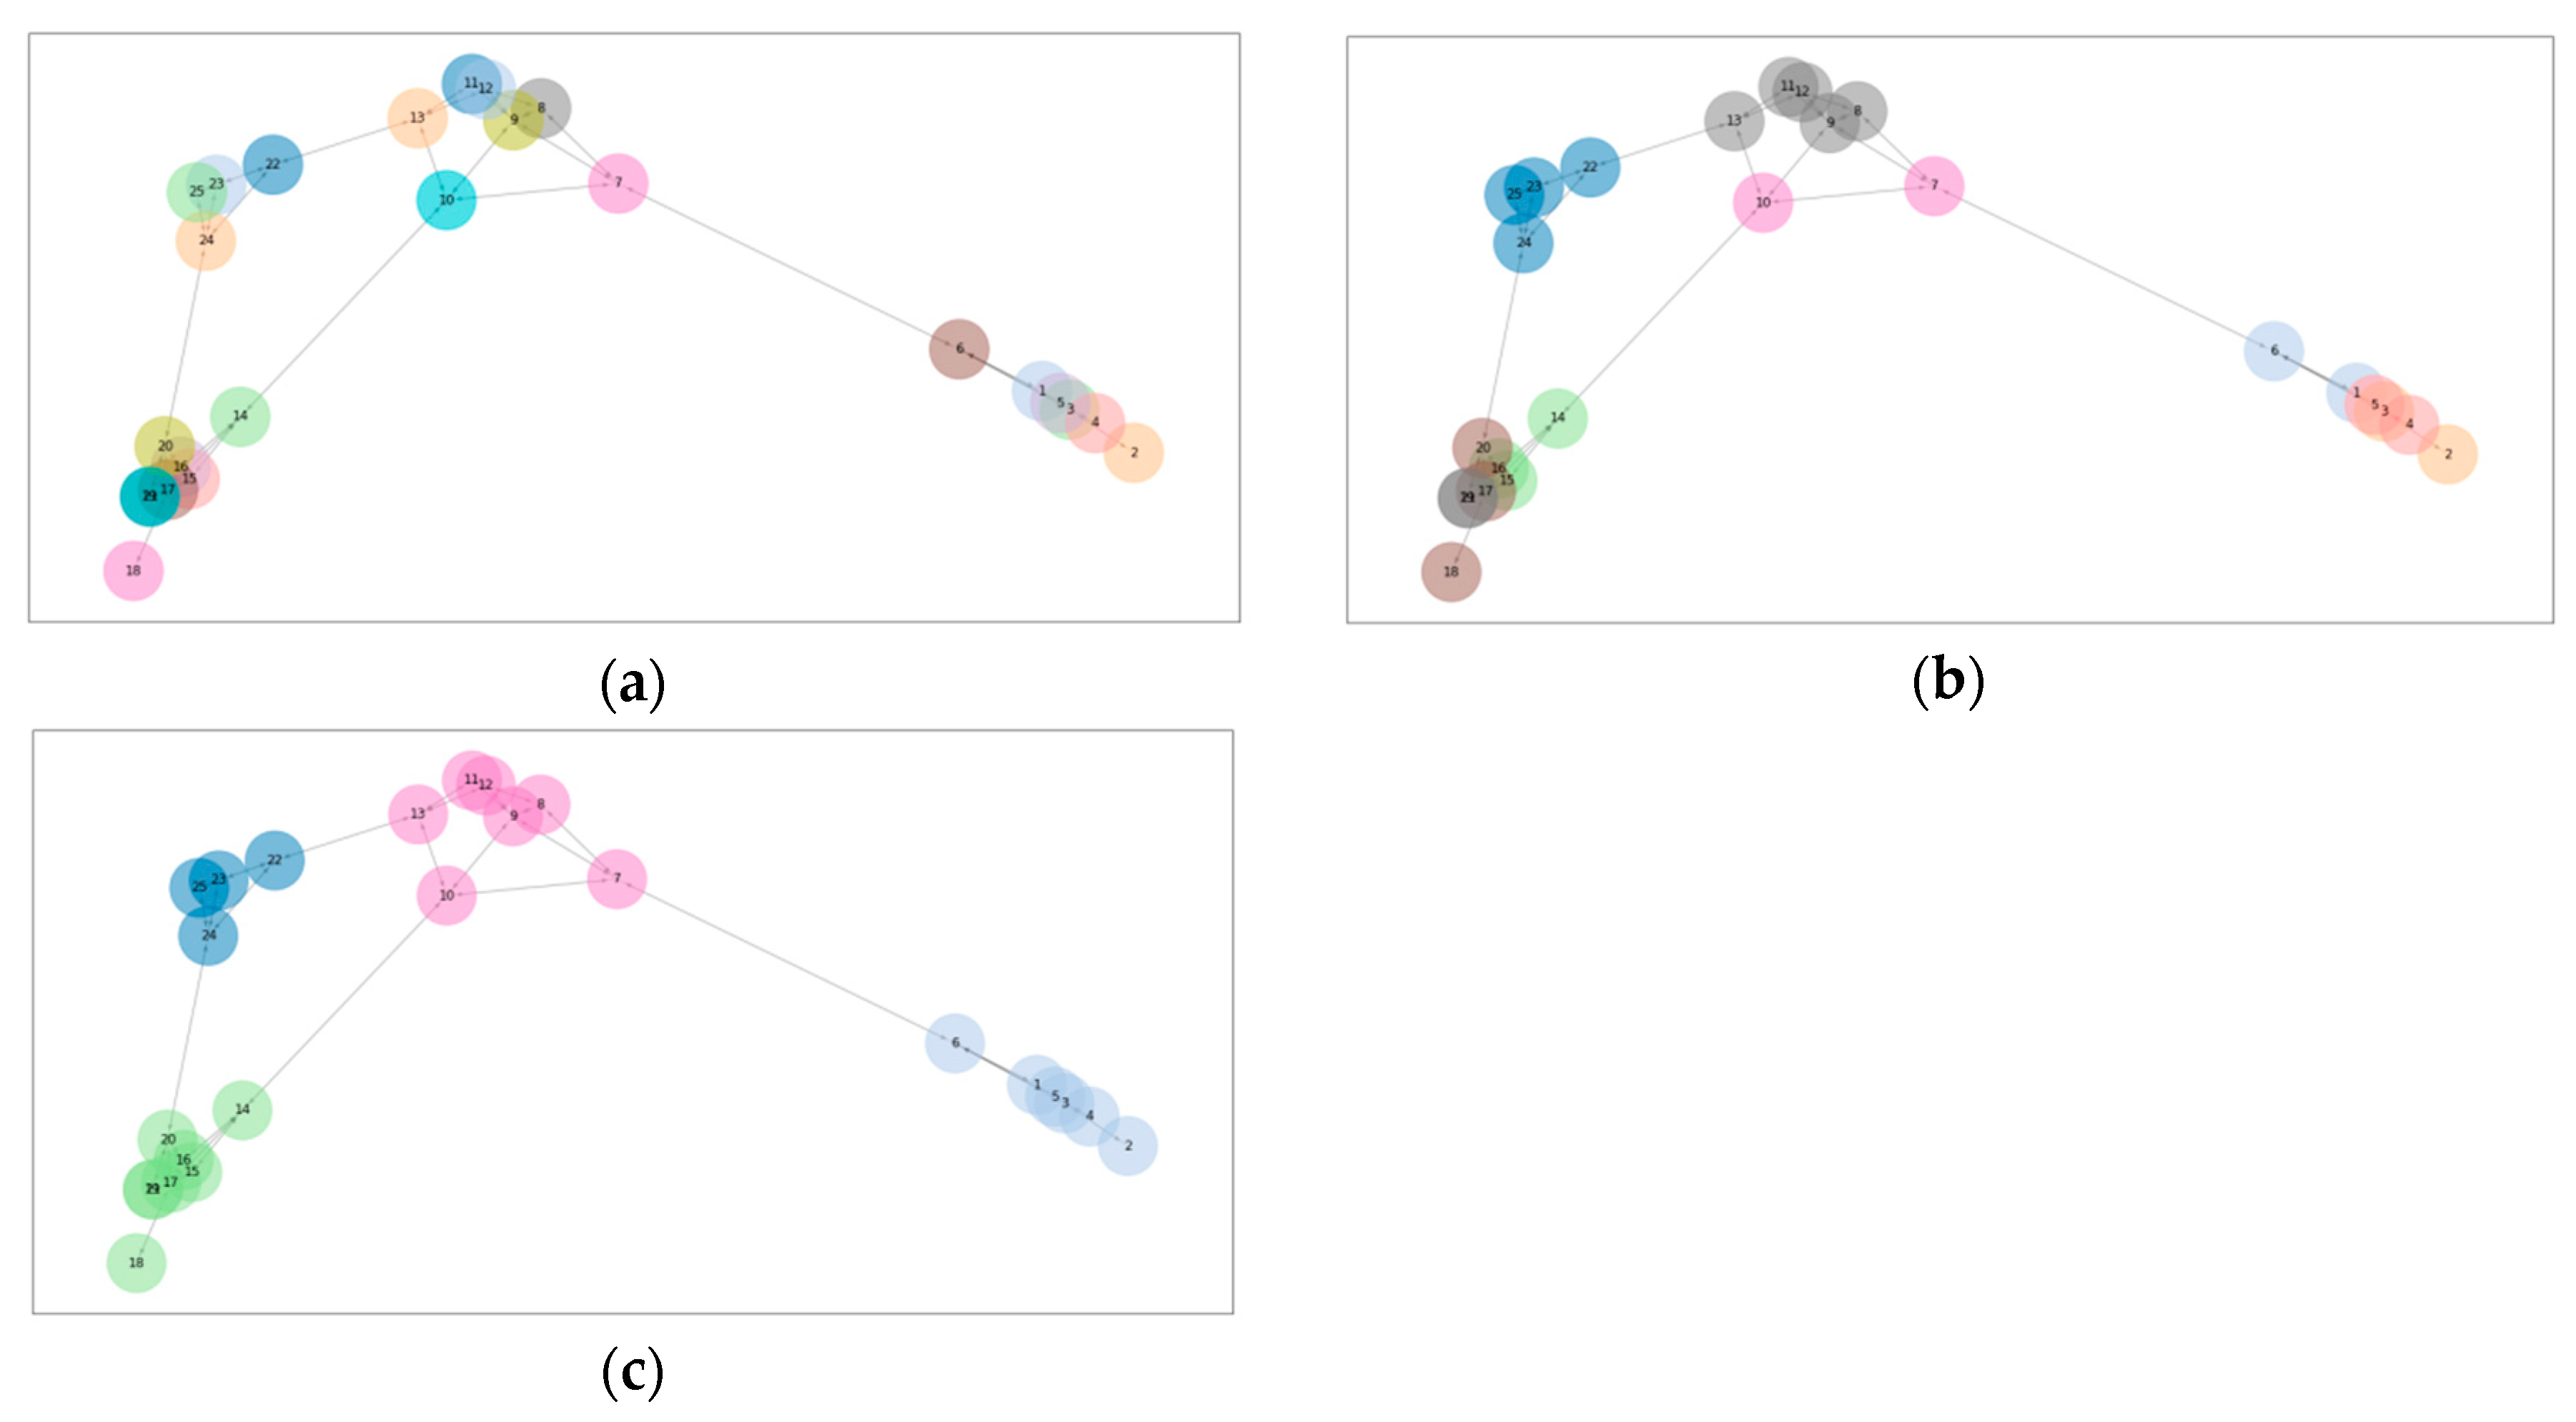
e). A graphical illustration of the InfoMap algorithm is shown in
Figure 1.
2.3. InfoFlow
InfoMap merges two modules on each iteration, giving O(e) loops. One obvious improvement possibility is to perform multiple merges per loop. However, this idea is not compatible with the idea of performing pair-wise merges, unless we can make sure no module is involved with more than one merge at once.
Here, rather than focusing on making sure that no module is involved with more than one merge at once, we can explore the idea of merging multiple modules at once. Thus, we can perform parallel merges in the same loop iteration, where possibly all modules are involved in some merge.
Consider multiple modules ~
Mi merging into a module
M. Another way to express this equivalently is to say that a module
M is partitioned into
i non-overlapping subsets:
Then we can expand the nodal sum over module
M into the sum over all nodes in all submodules
Mi, the exit probability of the merged module
M becomes:
where we expand the second term with respect to the
′s to give:
Combining the first and third terms,
which we can recognize as:
where we can immediately see that Equation (29) is a linear generalization of Equation (16), while Equations (30) and (31) are identical to previous definitions, and may be calculated iteratively as the previous algorithm. We can calculate
by expanding on the partitioning:
so that when we merge a number of modules together, we can calculate its connections with other modules by aggregating the existing modular connections. This is directly analogous to Equation (20).
Thus, the mathematical properties of merging multiple modules into one are identical to that of merging two modules. This is key to developing my multi-merge algorithm, InfoFlow.
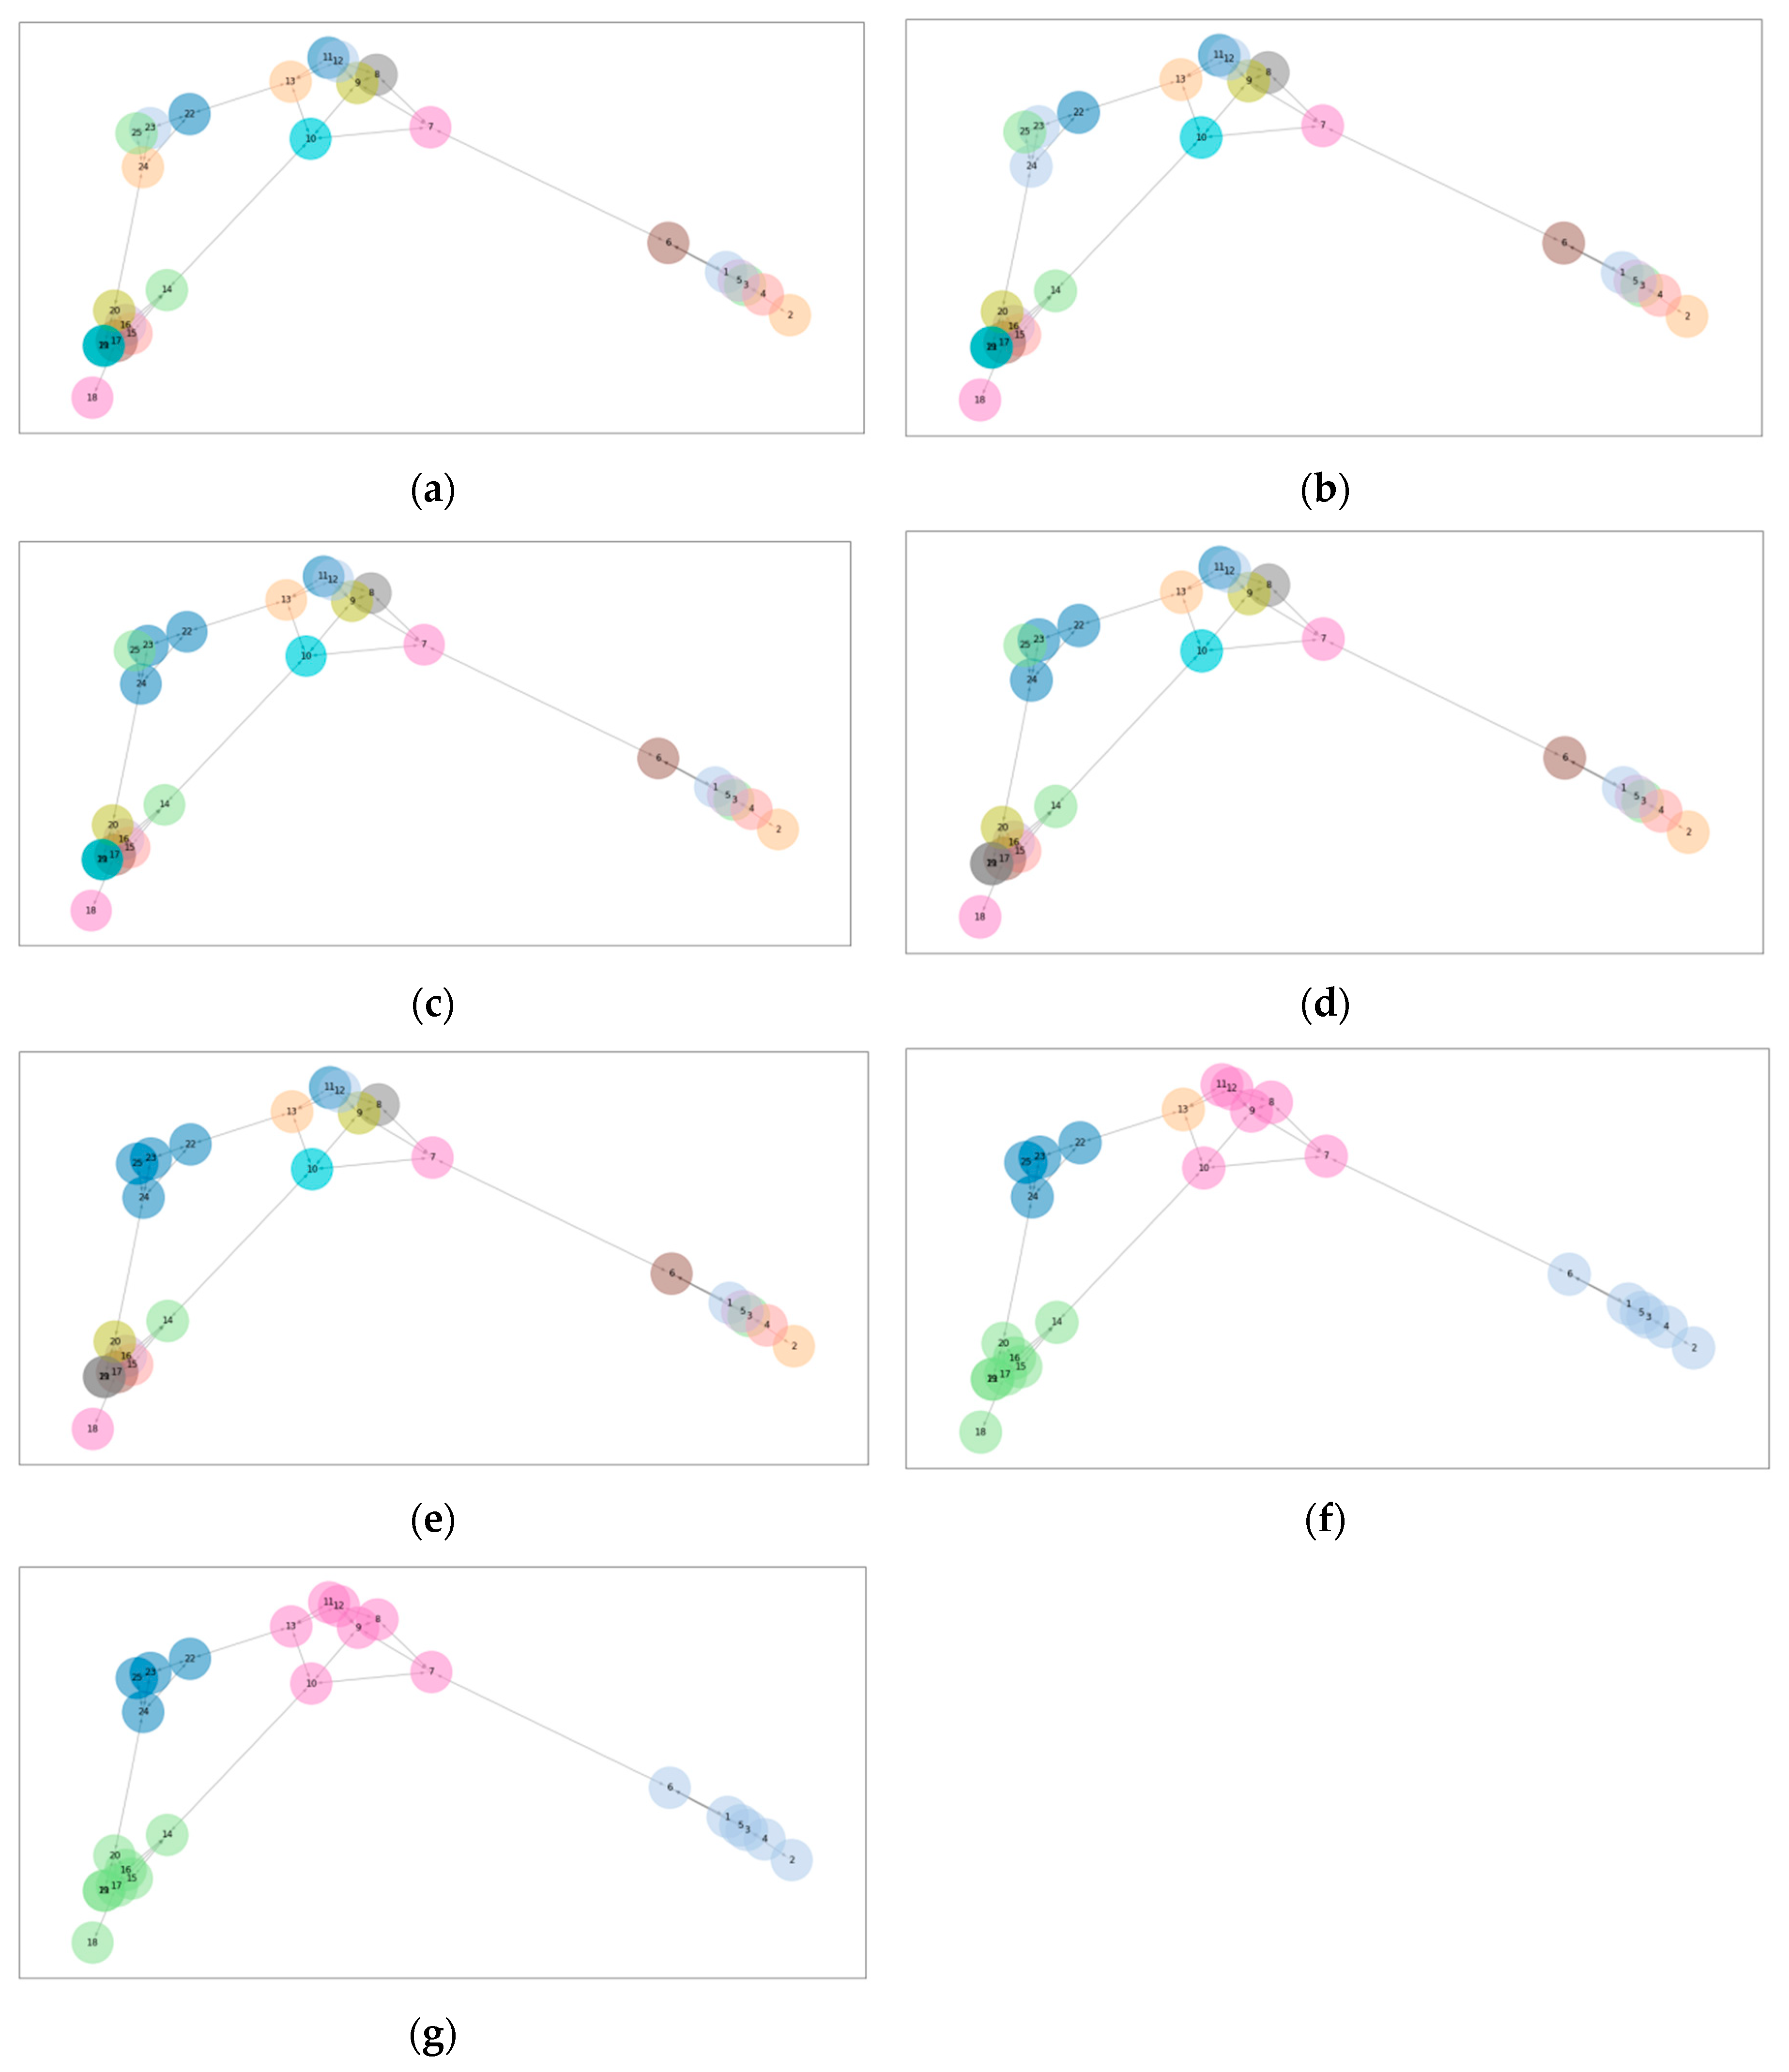
As InfoMap, each node is initially its own module. During each iteration, each module seeks to merge with a connected module that offers the greatest reduction in codelength, if only the merging of the two modules are considered. If no such merge exists, the module does not seek to merge. Then, the weakly connected modular components connected via the merge seeking are merged into one module, according to Equations (29) and (33). This is repeated seek-merging and bulk-merging is iterated until the codelength cannot be reduced. A graphical illustration of InfoFlow is shown in
Figure 2.
Next, n nodes are partitioned into m final modules according to InfoFlow. If we assume in each loop,
k modules merge into one on average, and that there are
l loop, we have:
so that we have
O(
) merges, while within each merge, there is
O(
k) time complexity related to the connected component with
O(
k) modules. Thus, the overall average time complexity is
O(
).
The worst case complexity comes in two cases: first, when we degenerate into InfoMap, i.e., we have O(e) loops, each loop we merge only two modules into one; second when l = 1 and k = n/m, and the overall complexity is O(k) = O(n/m).
3. Simulation and Results
InfoMap and InfoFlow are implemented on Apache Spark [
24] using the Scala language. The code, which is open source and can be accessed online [
25] is set up and run on a local desktop computer, the Dell Precision T3610, running Windows 7 Professional. For easy referencing, the specifications for the computer is Intel Xeon CPU E5-1620 v2 @3.70 GHz 3.70 GHz, with 64 Gb RAM. Apache Spark 2.1.1 and Hadoop 2.7 are used. When possible, RAM disk was used to speed up simulations.
First, we ran real world data of small to moderately sized graphs from [
26,
27,
28], with both InfoMap and InfoFlow, and compared the runtime performance and resultant communities. The results are tabulated in
Table 1, listing the nodes and edges of the graph, the number of loops ran before the algorithms completed, the runtime (for the sake of comparison, common runtime between the two algorithms, including initialization time and PageRank runtime, are not counted), and final partitioning codelength. The normalized mutual information between the community partitioning’s given by the two algorithms is also tabulated.
We see that, for InfoMap, the number of loops and runtime follow a linear complexity relationship with the size of the graph, while the number of loops in InfoFlow is kept within 4, and the runtime within 30 s, so that a pseudo-constant, or logarithmic complexity relationship with the size of the graph, along the estimation of Equation (36), is confirmed. As a solid example of the speedup in InfoFlow, for the graph with 27,770 nodes and 352,807 edges, there are 1000 times less loops in InfoFlow, and the runtime is nearly 3.5 h for InfoMap, and 25 s for InfoFlow, representing nearly a 500-time speedup.
As analyzed in Equations (34)–(36), this speedup in runtime and complexity is a direct consequence of going from pair-wise merge in InfoMap to the multi-merging in InfoFlow. In terms of partitioning accuracy, it might be a concern whether the bulk-merging of InfoFlow might sacrifice partitioning accuracy. From the results of
Table 1, we see that the codelength difference between the two algorithms are very similar, rarely exceeding a 5% difference. The normalized mutual information (NMI) is often kept higher than 80%, so the accuracy in community detection is not compromised when going from InfoMap to InfoFlow.
Having compared the runtime and accuracy between InfoMap and InfoFlow, we now apply InfoFlow to bigger data, with graphs going up to millions of nodes and hundreds of millions of edges [
26,
27,
28], until the limit of the computing resource is challenged on the Dell Precision T3610. The results of the simulations are tabulated in
Table 2. We see that the number of loops is kept within 20, so a pseudo-constant or logarithmic complexity is well followed, while the runtime is kept within a few hours. The runtime does not follow any obvious relationship with the number of nodes or edges, since the processing of the dataset challenges the limit of the computer, and complex performance issues with memory caching and paging comes into play. Importantly, the runtime is in the same order of magnitude with PageRank calculation time. Since the latter is a prerequisite for the map equation approach, the benchmarking results indicate we have optimal runtime complexity within the map equation approach to community detection.
4. Conclusions
With a view of developing a distributed community detection algorithm, we developed discrete mathematics on the map equation to provide formulae for the modular properties for merged pairwise modules, which enabled the implementation of InfoMap algorithm on distributed computing. We then generalized this from a pairwise merge to merging arbitrary number of modules, which prompted the algorithm InfoFlow. Benchmarking results on an Apache Spark implementation confirmed that the runtime complexity of InfoFlow had logarithmic runtime complexity, compared to the linear time complexity of InfoMap, while retaining accuracy in the community results.
Similar projects to develop distributed community detection algorithms, in particular InfoMap, exist [
20,
21,
22,
23]. These projects parallelize certain segments of the algorithm while keeping other segments and data structures in serial, with assumptions on thread locking or graph locality. In contrast, in this paper, we developed discrete math to adapt InfoMap into distributed computing framework, while keeping the algorithm identical, with no additional assumptions being made. In other words, we developed the mathematical formulation that enables parallel and distributed computing, rather than developing an inherently parallel algorithm. This is a significant development in InfoMap. InfoFlow was built with only one additional development of multi-merging, as opposed to the pair-wise merging in InfoMap. Benchmark results showed that this development improves runtime complexity while retaining result accuracy. Thus, the mathematics is a significant contribution to the research in InfoMap, which will be valuable future research in InfoMap extensions such as hierarchical structures, overlapping structures, and higher-order Markov dynamics [
17,
18,
19].
The coding implementation [
25] is open source and implemented in Apache Spark, which is actively maintained, with proven performance, reliability and scalability, with contributions from companies such as Google, Facebook, and IBM [
29]. It can be easily configured and deployed on clusters and cloud platforms. This is in contrast to, for example, the implementation in [
23], which used the GraphLab PowerGraph library [
30] which was not actively maintained. Another example is [
20], which used the Thrill library [
31], which is still in the experimental phase. The choice of distributed computing library framework, along with computational environment, is one of the major factors affecting runtime, memory consumption and other performance metrics. Meanwhile, algorithmic performance, which is agnostic to the coding implementation and library environment, may be measured via theoretical space and time complexity, where the logarithmic runtime complexity of InfoFlow shines.


