1. Introduction
Digital image processing (DIP) is an emerging field in biological sciences such as tumor detection and classification, cancer detection and classification, and testing and examining critical parts of the human body. Automatic brain tumor detection plays a significant role in medical science [
1]. The human body is composed of different types of cells where the brain (also the processor of the body) plays a very significant role [
2]. The most significant portion of our nervous system is the brain. Moreover, it is the kernel of the human central nervous system.
The brain is a complex organ that contains 50–100 billion neurons. It is made up of a large number of cells, and each cell has a specific function. Most of the cells that are generated in the body partition to form new cells for appropriate functioning of the human body. When new natural cells grow, aged or damaged cells die. Then, new cells take their place. Sometimes, new cells are generated when the body does not need them. Moreover, aged or damaged cells do not die as they should. The body produces extra cells that construct a lump of tissue called a tumor. A tumor inlaid in the brain region causes the sensitive functioning of the body to be malformed. It is very difficult and perilous to treat due to its location and spreading capability [
3,
4,
5]. Brain tumors are primarily categorized into two types: benign and malignant. Benign tumors are those tumors which are non-cancerous, and malignant ones are those which contain cancerous cells [
6].
The early detection and recognition of brain tumors is very crucial. Presently, computer-aided diagnosis (CAD) systems are usually used for systematic and specific detection of brain abnormalities [
7]. A brain tumor is the unnatural growth of tissue or central spine that can interrupt the proper function of the brain [
8]. From the report of the national cancer institute statistics (NCIS), death rate on account of brain cancer for USA is 12,764 per year, 1063 per month, 245 per week, and 34 per day. It shows that it is very significant to diagnose brain tumor in advanced levels to save lives. Moreover, the processes of tumor detection should be done with very high speed and accuracy. This is only possible by using magnetic resonance (MR) images, and suspicious regions are extracted through MR image segmentation from complex medical images. The detection of a brain tumor is manually done by experts.
However, there are some problems, such as it taking a large amount of time, and segmentation of MR image by different experts may vary significantly. Moreover, the result of tumor detection may vary under different circumstances by the same physician, and the brightness and contrast of the display screen can vary the segmentation results. For these reasons, the automatic detection of brain tumors becomes significant. Automatic detection of brain tumors can increase the probability of survival of a tumor. In the medical field, there is no standard method that can be constructed for brain-tumor detection. Several research works are attempting to detect brain tumors automatically with improved accuracy, exactness, and speed of computation by minimizing manual effort [
9].
The detection of brain tumors means identifying not only the affected part of the brain but also to the tumor shape, size, boundary, and position. Different imaging technologies such as magnetic resonance image (MRI), computed tomography (CT), positron emission tomography (PET), etc. are used for imaging the brain. Most frequently, the anatomy of the brain tumor can be tested by MRI scan or CT scan. However, the CT scan contains radiation that is detrimental to human body, whereas MRI gives accurate visualization of the anatomical formation of tissues of the brain [
10]. The MRI is a device that conducts a magnetic field and radio waves for generating detailed images of the organs and tissues. Processing of MR images are extremely complicated and constantly scrutinized by researchers to give pathologists an improved experience to diagnose the patients [
11].
In this paper, we propose major contributions as follows:
We propose the TKFCM algorithm that will detect brain tumors with more accuracy, even if the tumor to be detected is very tiny.
The proposed algorithm works more accurately and efficiently than others with an MR image even if it is a noisy MR image.
The performance of the proposed algorithm is better than others such as thresholding, region growing, region splitting and merge, artificial neural network (ANN), TK-means, FCM algorithms, etc. for sensing and specifying brain tumors in an MR image.
The required execution time of the proposed algorithm is very much lower—40–50 s, compared with conventional algorithms such as ANN, which require 7–15 min to execute the output results.
The rest of this paper is presented as follows:
Section 2 presents the related works.
Section 3 presents the conventional k-means and fuzzy c-means algorithm.
Section 4 presents the proposed algorithm. The results and discussion are summarized in
Section 5, and
Section 6 presents the conclusion and future works.
In addition, all parameters used in this manuscript are listed in
Table 1 as follows:
2. Related Work
In DIP, images are captured and processed for doing segmentation and for extracting necessary information. Segmentation of a digital image refers to partition into multiple segments. An apposite segmentation is needed for recognizing abnormality in brain and to provide an alternative representation of an image that is more significant and easier to analyze [
12]. In last few decades, number of segmentation and detection algorithms have been proposed by researchers. Foremost utilized detection techniques are threshold based segmentation, region based segmentation, edge based detection, region splitting and merge segmentation, clustering statistical model (CSM) and artificial neural network (ANN) etc. [
13,
14].
The thresholding method is one of the ordinary brain MR image segmentation technique and effective in image binarization [
13,
15]. Basement of threshold, however, it is collectively used with other techniques too such as classifiers, clustering, ANN etc. This technique is notably appropriate for a picture with region or object of uniform splendor placed against a background of various grey level [
16,
17]. It is based on the separation of pixels in different classes depending on their pixels gray levels [
10]. Brain MR image can be identified as regions with pixels having discrete gray level ranges. The main downside is that it can not be utilized for multi-channel images [
13]. In region growing segmentation (also called similarity based segmentation), large regions are made through pixels or sub regions according to predefined criteria [
18].
This technique starts with a set of “seed” points and from these points make regions by connecting to each seed adjacent pixels that have similar prominence to the seed [
12,
19]. The drawbacks of using this technique are excessive computational cost and also required manual interaction to select the seed points. Moreover, it is very sensitive to noise [
14]. Region growing and splitting is the special case of region growing technique. The principal objective of region splitting and merging is to separate the homogeneity of the image. A splitting technique is employed when the homogeneity criteria is not satisfied by a region after applying region growing technique and then, four regions are generated from a region. The main disadvantage of this technique is boundary leakage [
20,
21].
Edge-based segmentation concentrates on recognizing contour and makes use of the discontinuities in image values to separate regions. The primary limitation of this method is that it is unable to segment the image which is blurry or too complex to identify a given border [
8,
13]. In classifier techniques, it requires a proper pixel classifier for training data. Foremost used classifiers are K-nearest-neighbor (KNN), expectation maximization (EM) etc. Efficient classifier and training data is desired to time consumption and accurate outcomes [
22]. The KNN algorithm is a non-parametric method, works on the basis of a distance function (Euclidean distance) and uses a voting function which is used for the K-nearest neighbours [
23,
24]. Higher accuracy and stability is exhibited by KNN for MR images than other classifiers. This algorithm is by and large very simple to implement and moreover, real time image segmentation is carried out by KNN as it runs more quickly. The cons of using this algorithm is that there is some probability of yielding an inaccurate decision when the acquired single neighbour is an outlier of some other class [
25].
Support vector machine (SVM) is a supervised classifier, performs on the basis of training samples and tries to reduce the bound on the generalization error. It provides better generalization performance and performs at large of dimensionality of the feature space. However, it takes very long time for execution and perfect for tumor classification [
25,
26].
In clustering techniques, K means clustering algorithm, FCM clustering algorithm and expectation maximization (EM) algorithm are most widely used brain tumor detection techniques [
27]. Clustering is a technique of partitioning a set of data into a specific number of groups [
28]. K-means clustering algorithm is an unsupervised algorithm that separates objects on the basis of attributes/ features into k groups (k is a positive integer) [
29,
30]. It is very simple clustering algorithm, aims to produce close fitting cluster and works well for low dimensional data. It performs faster than hierarchical clustering when number of variables are large. However, the cons of this algorithm are, it is very hard to predict K-value and does not perform well with global cluster. Moreover, with different size and density, the performance of this algorithm is very poor [
31,
32].
Fuzzy C-means is a soft clustering technique where each pixels may belong to two or more clusters with varying degree of membership. The sum of distances between cluster centers and patterns describes the objective function [
33,
34]. Although it takes into account only image intensity values and no filtering, it provides highly immune to noise and better segmentation quality [
10,
35]. There is a K-means and FCM algorithm where K-means performs initial segmentation and FCM performs further segmentation on the image and an approximate segmented tumor is detected by FCM technique through exact cluster selection [
28].
The conventional FCM is limited to noise sensitivity whereas it is noise immune in K means clustering. But there should be perfect thresholding before segmentation due to it is very difficult for complicated brain structure [
36]. ANN is currently of the most promising method for tumor detection and classification. ANN is categorized into two parts which are feed forward neural network (FFND) and Recurrent Network or Feed-Backward neural Network (FBNN). ANN technique provides robust parallel ability and fast computing. However, it may take very long time-period for training input images and partial information should be acquainted beforehand [
25,
37,
38]. According to the above discussion, it may be aforementioned that there is no such technique that is ideal. But to induce optimum outcome in this field, we have got to attenuate the limitation of the individual methods describes here.
3. K-Means and Fuzzy C-Means Clustering Algorithm
3.1. K-Means Clustering Algorithm
The
K-means clustering algorithm is a very simple unsupervised learning algorithm. It provides a very easy way to classify a given data set into a certain number of clusters i.e. a set of data such as
are grouped into
K clusters. The major idea behind this algorithm is to define
K centers, one for each cluster [
39]. The
K cluster centers should be selected randomly. Distance measure plays a very important rule on the performance of this algorithm. Different distance measure techniques are available for this algorithm such as Euclidean distance, Manhattan distance and Chebychev distance etc. But, choosing a proper technique for distance calculation is entirely dependent on the type of the data that we are going to cluster. However, we will use Euclidean distance as the distance metric because it is fast, robust and easier to understand [
40,
41]. Step by step conventional
K-means clustering algorithm [
40] is described as follows:
| Algorithm 1K-means clustering algorithm. |
| Assume that, be the set of data points and be the set of centers. |
| 1: Define number of clusters . |
| 2: Randomly, define cluster centers |
| 3: Calculate the distance between each data point and cluster centers. |
| 4: Data point is assigned to the cluster center whose distance from the cluster center is minimum of all the cluster centers. |
| 5: Then, new cluster center is recalculated as follows.
where is the number of data points in i-th cluster. |
| 6: Recalculate the distance between each data point and newly acquired cluster centers. |
| 7: If no data point was reassigned then stop, otherwise repeat steps from 3 to 6. |
The distance which is called Euclidean distance are calculated between each pixel to each cluster centers. All the pixels are compared individually to all cluster centers using the distance function [
42]. The pixel is lead to one of the clusters which is shorter in distance among all. Then, the center is recalculated. Then, every pixel is compared to all centroids again. This process continuous until the center converges and the convergence is evaluated through a maximum number of iterations. The quality of clustering of this algorithm is optimized through repetition of
K-means several several times with different initialization in order to identify best centroids.
It provides improved computational efficiency and supports multidimensional vectors [
43]. So, this algorithm intent to diminish an objective function which is known as squared error function given by:
where
is the Euclidean distance between
and
,
is the number of data points in
ith cluster and
c is the number of cluster centers.
3.2. Fuzzy C-Means Clustering Algorithm
FCM clustering algorithm is introduced by Bezdek that is a technique of clustering where proceeds each pixel of data to belong to two or more clusters. The more the data is near to the cluster center more is its membership towards the particular cluster center [
44,
45]. It depends on reducing an objective function regarding to fuzzy membership set
U of cluster centroids
V.
where
is a
data matrix in Equation (
3) and
m is any real number greater than 1. P, N and C denotes the dimension of each
‘feature’ vectors, the number of feature vectors (pixel numbers in the image) and the number of clusters, respectively.
is called the membership function of vector
to the
i-th cluster, which satisfies
and
,
. The membership function can be expressed as follows:
where
which is a
matrix. Now we calculate the
i-th cluster feature center as follows:
where
m is any real number that is greater than 1, controls the degree of fuzziness
. It is a measurement of similarity between
and
that is defined as follows:
Here, ||.|| can be denoted as either a straightforward Euclidean distance or its generalization like Mahalanobis distance. The feature vector X in MR image presents the pixel intensity . The FCM algorithm repetitively optimizes with the continuous update of U and V, until , 0 to 1, where k is the number of iterations. The step by step conventional fuzzy C-means clustering algorithm is demonstrated as follows:
| Algorithm 2 Fuzzy C-means clustering algorithm. |
| Assume that, be the set of data points and be the set of centers. |
| 1: Fix the number of clusters c, where n= number of data items. Fix, m where . Choose any inner product induced norm metric . |
| 2: Initialize the fuzzy c partition |
| 3: At step b, |
| 4: Calculate the fuzzy membership function using Equation (4). |
| 5: Then, Compute the fuzzy centers using Equation (5). |
| 6: Repeat step 2 and 3 until the minimum value is achieved or |
4. Proposed TKFCM Algorithm
The proposed TKFCM algorithm is an accumulation of the
K-means and fuzzy
C-means with some modification. On the basis of temper or gray level intensity in the brain image, the template is selected along with the conventional
K-means. On the other hand, in FCM, the Euclidian distance and the membership function is modified by the image features. The equation of template based
K-means and improved fuzzy
C-means clustering algorithm for segmentation can be expressed as follows:
where
a binary image matrix and
M and
N are the row and column of
and also
R,
K and
C are described as the centroid of the cluster, number of data points in clusters and number of cluster respectively. The last part of Equation (
7) is described as improved fuzzy
C-means where Euclidian distance relies on the image features. The middle portion is employed as the conventional K-means algorithm, which is expressed as the distance from each point to cluster center. Here,
is the coarse image and Equation (
8) describes the desired template.
The template based window is selected by
which is expressed as:
In Equation (
9), the temper based image matrix
with number of gray level intensity,
G and number of bins,
S is employed to find out the temper of the image
. Herein, the image and convolution of temper based image matrix
aims at attaining the template for the
K -means clustering algorithm. In FCM algorithm, the membership function
whose value is updated with Euclidian distance d(x, v) that depends on the image features such as entropy, contrast, energy etc., degree of fuzziness m and feature center
is described as below:
Euclidian distance was employed on the basis of only one features for example similarity in the preceding research work, but in our proposed TKFCM method this depends on some features like entropy, dissimilarity, contrast, homogeneity, entropy, correlation etc.
Clusters center from where the clusters position and tumor are identified may be outlined as:
where
.
We have extracted six features for the classifiers. These six features are texture based features. Texture feature is an important low level feature in the image, it can be used to describe the contents of an image or a region. A texture can be defined as a set of texture elements or texels occurring in some regular or repeated pattern. Texture provides one of the most significant characteristic that is used to classify and identify objects. Moreover, it is used to find out the similarities between images in multimedia databases. It Characterizes texture using statistical measures computed from gray scale intensities (or colors) alone. It Can be used for both classification of a given input texture and segmentation of an image into different textured regions. Extracted six features for the classifier are described as follows:
Energy: It is defined as the measurement of finite amount of iterative pixel pairs. It provides the volume of affinity in an image and it is given as follows:
where
G is the gray level co-occurrence matrix and
is the image matrix.
Contrast: Contrast is defined as the measurement of pixel intensities and its adjacent neighbor above the image and it is given as follows:
Homogeneity: Homogeneity (HOM) is defined as the measurement of similarity in an image. Moreover, it is called as inverse difference moment (IDM) and it is defined as follows:
Entropy: Entropy is the measurement of randomness of textural image which is defined as follows:
Dissimilarity: Dissimilarity is the textural property of the image which is calculated by considering the alignment of the image as a measure in terms of the angle which is defined as follows:
Correlation: Correlation is the feature which describes the spatial dependencies between the pixels and it is defined as follows:
where
and
are the mean and standard deviation in the horizontal spatial domain and
and
are the mean and standard deviation in the vertical spatial domain, respectively.
Proposed TKFCM Algorithm
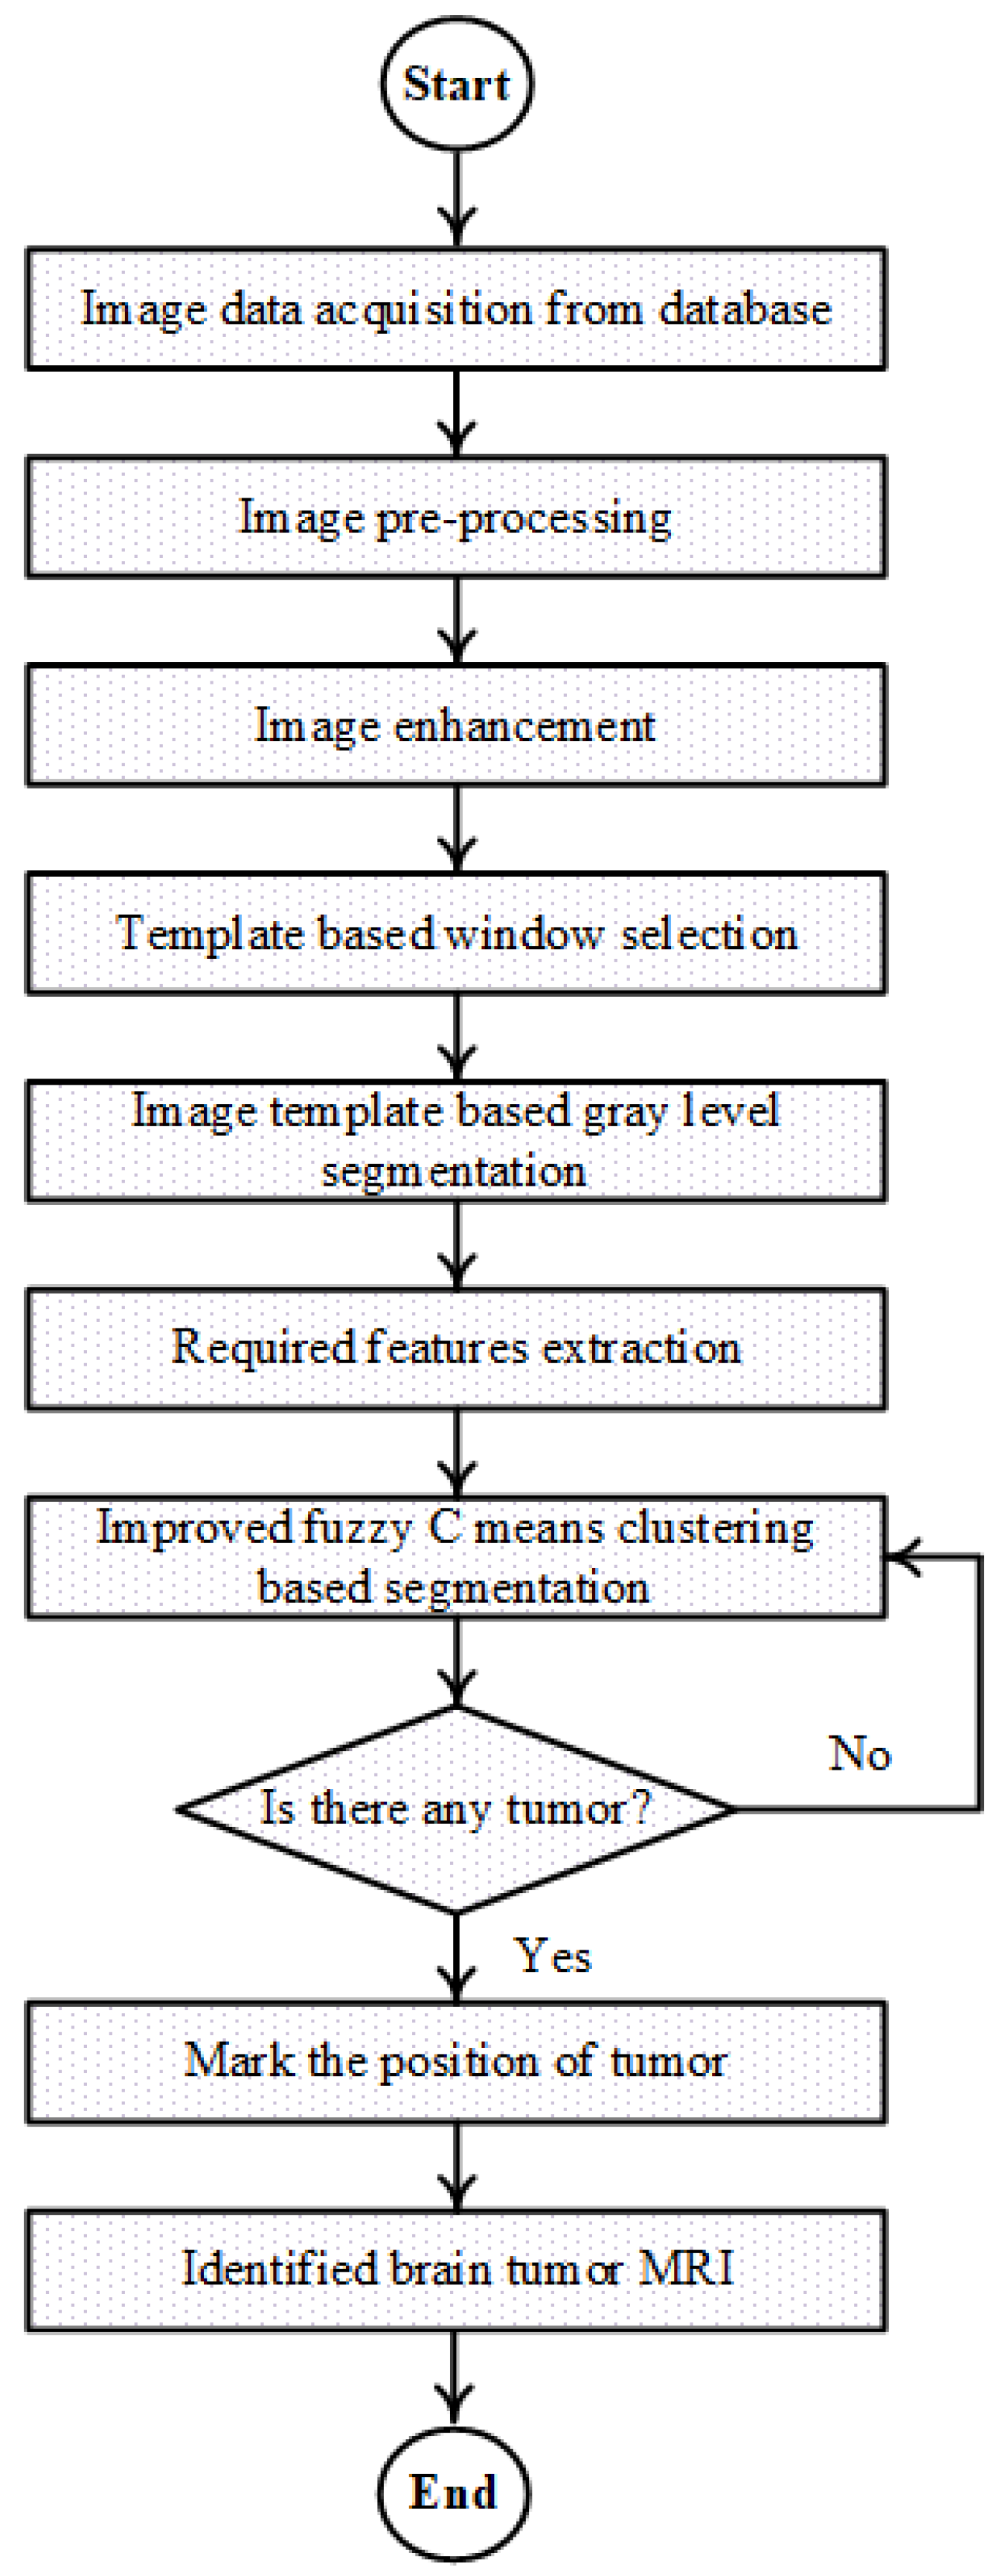
The entire methodology which has been introduced for the detection of tumor in human brain MR image utilizing temper based
K-means and improved fuzzy
C-means clustering algorithm is represented by the subsequent flowchart shown in
Figure 1. At first, the acquisition of the human brain MR image is done and the input image is pre-processed and enhancement of the MR image is also carried out. Furthermore, the template base window is selected and the output of the window has been segmented with the temper based K-means clustering segmentation. After that, required features are extracted. Finally, tumor is acquired by detecting with red line marked by the improved fuzzy C-means algorithm with the updated membership. This is committed through the clustered image which is automatically chosen from the image features.
| Algorithm 3 TKFCM algorithm for tumor detection in Brain MR image. |
| 1: Initialize: Define number of gray level and determine square matrix, A = and image matrix, P = |
| 2: Then, define Template = |
| 3: Determine coarse image, from template, |
| 4: Reshape template based k means segmented image, = |
| 5: Repeat step 2 to 4 until, |
| 6: Post process the |
| 7: Determine cluster centroid, C and degree of fuzziness, m |
| 8: Initialize membership function of FCM |
| 9: Calculate cluster center,, and |
| 10:Determine image features, |
| 11: Update With untill , = 0 to 1 |
5. Simulation Results and Discussion
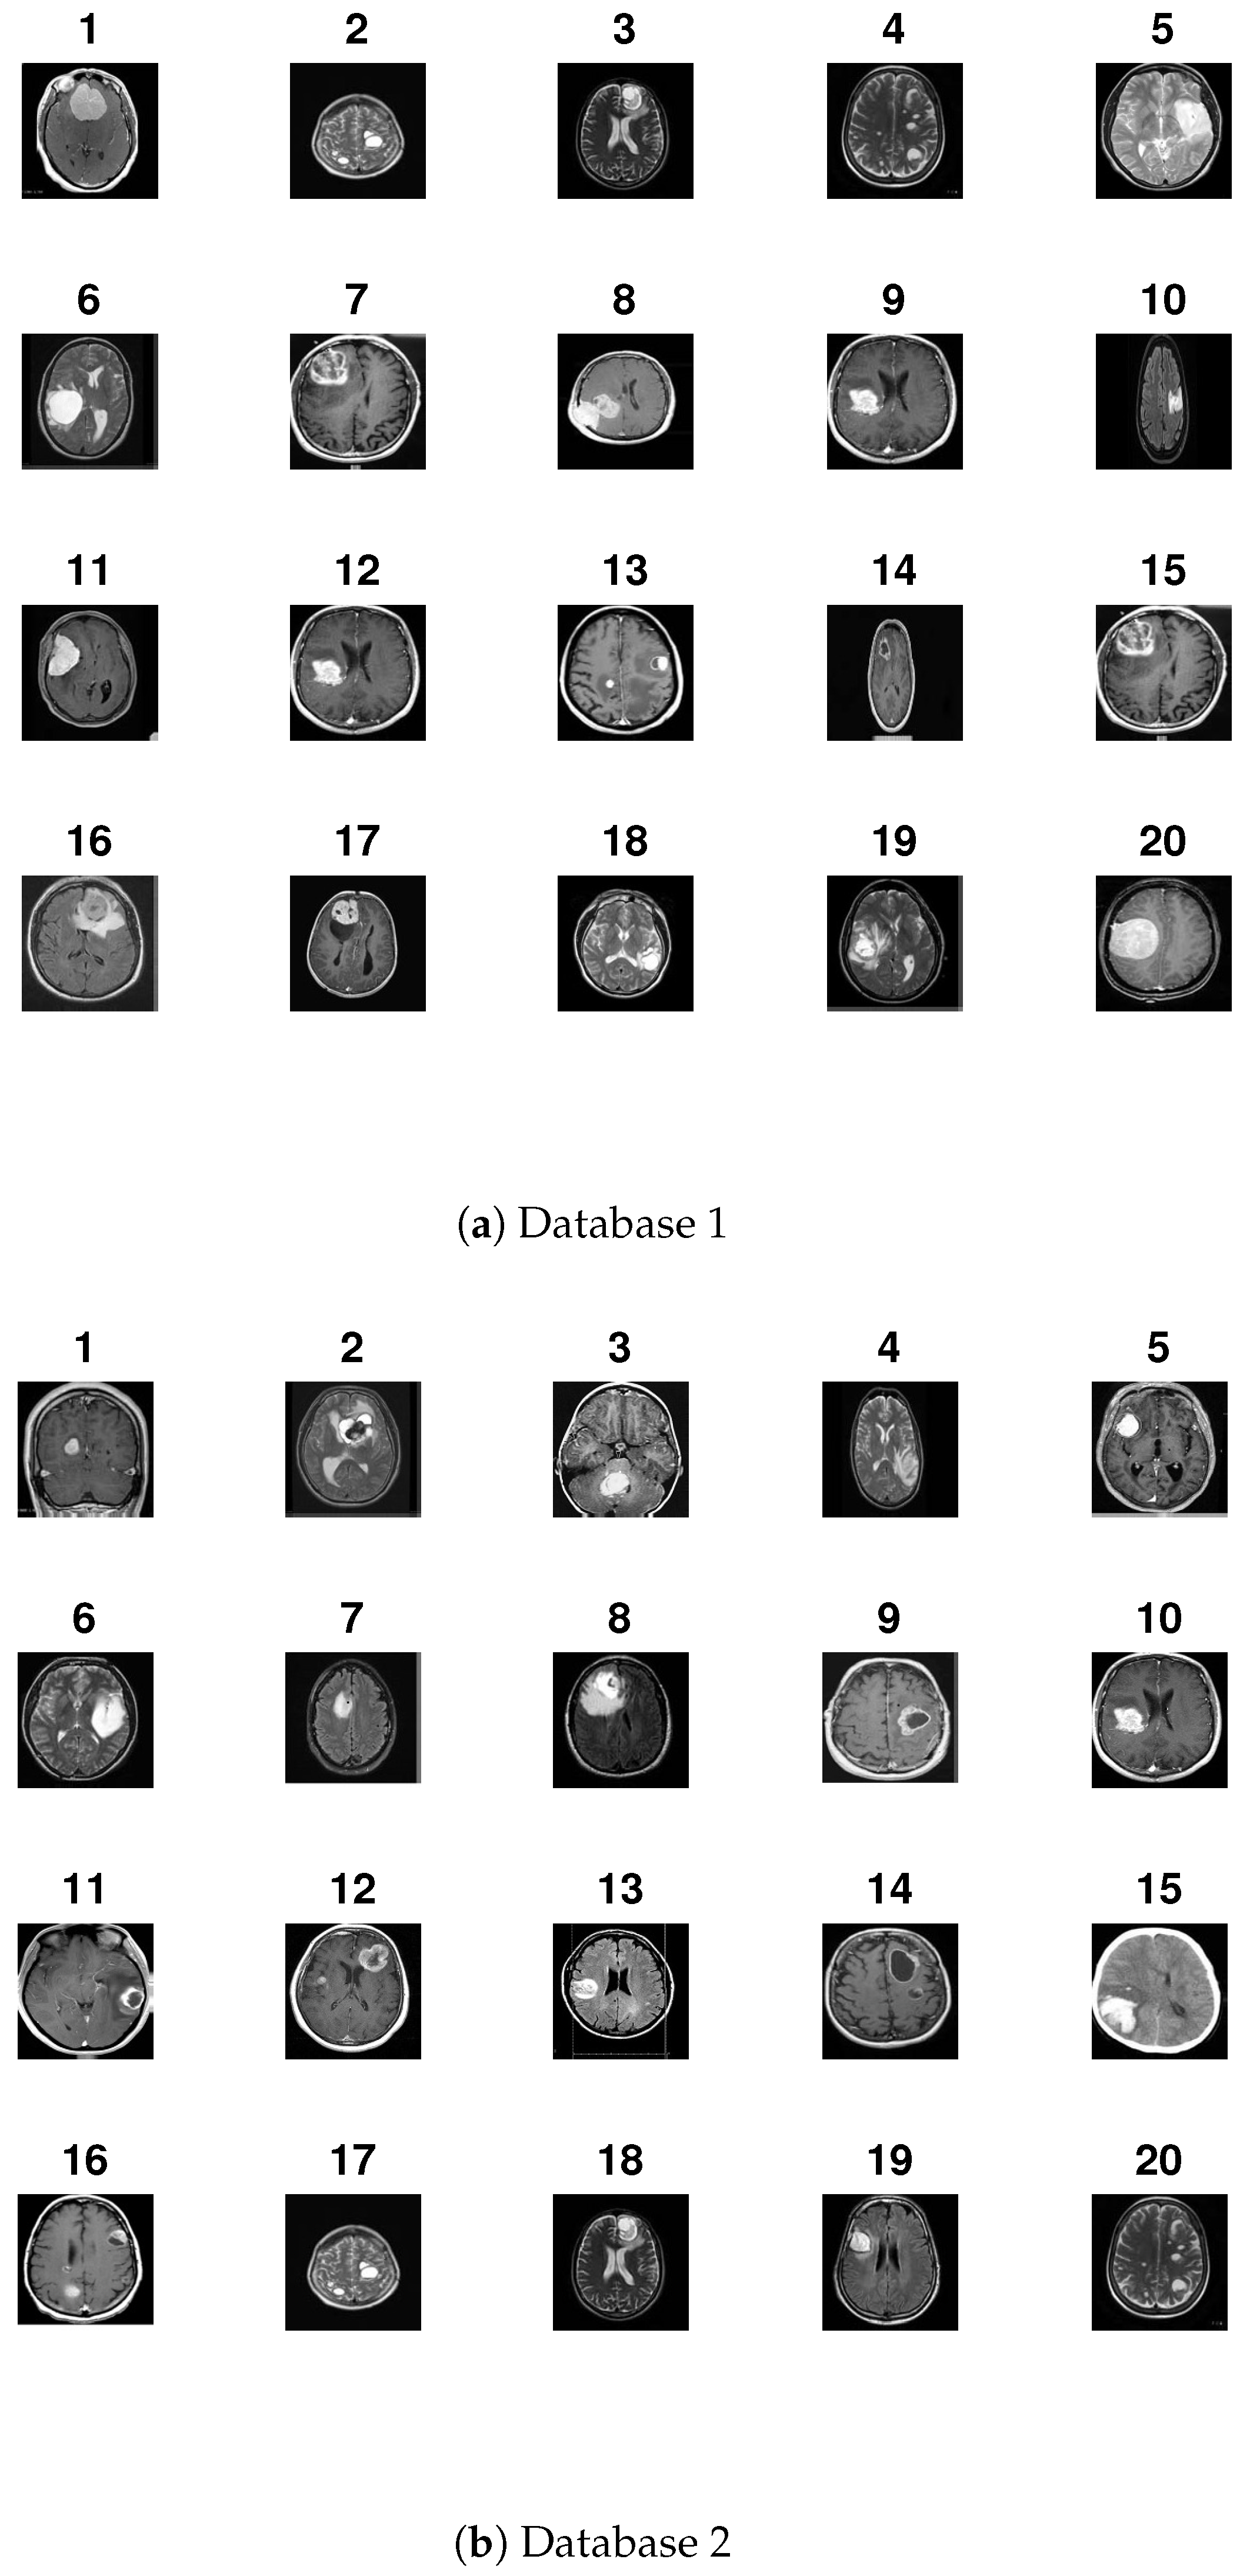
A database of 40 brain tumor images is shown in
Figure 2a,b where the first 20 images are shown in
Figure 2a and the next 20 images are shown in
Figure 2b. The database has been made by collecting different complex brain tumor images. We collected these images from [
17,
18,
19] and pre-processed for the betterment of application in our algorithmic program.Then, we have processed these images by MATLAB 2016(a) and made the database for final use shown in
Figure 2a,b. The tumors in these images are so critical that it is too hard for the common people to detect it so easily.
MR image pre-processing is very significant to ameliorate the visual effect of the image for further processing. Usually the collected images in the dataset are so poor in quality which requires filtering noise and sharpening the image. In pre-processing step, the acquired image in the dataset is converted into a two dimensional matrix and the image is converted into RGB image to gray scale image. To eliminate the noise in the image, a median filter is used. Then, the enhancement of the image is done by performing adjusted operation, histogram based operation and adaptive histogram based operation. Generally, enhancement of an image means improving the contrast of the image. After that different features are initially extracted implicitly.
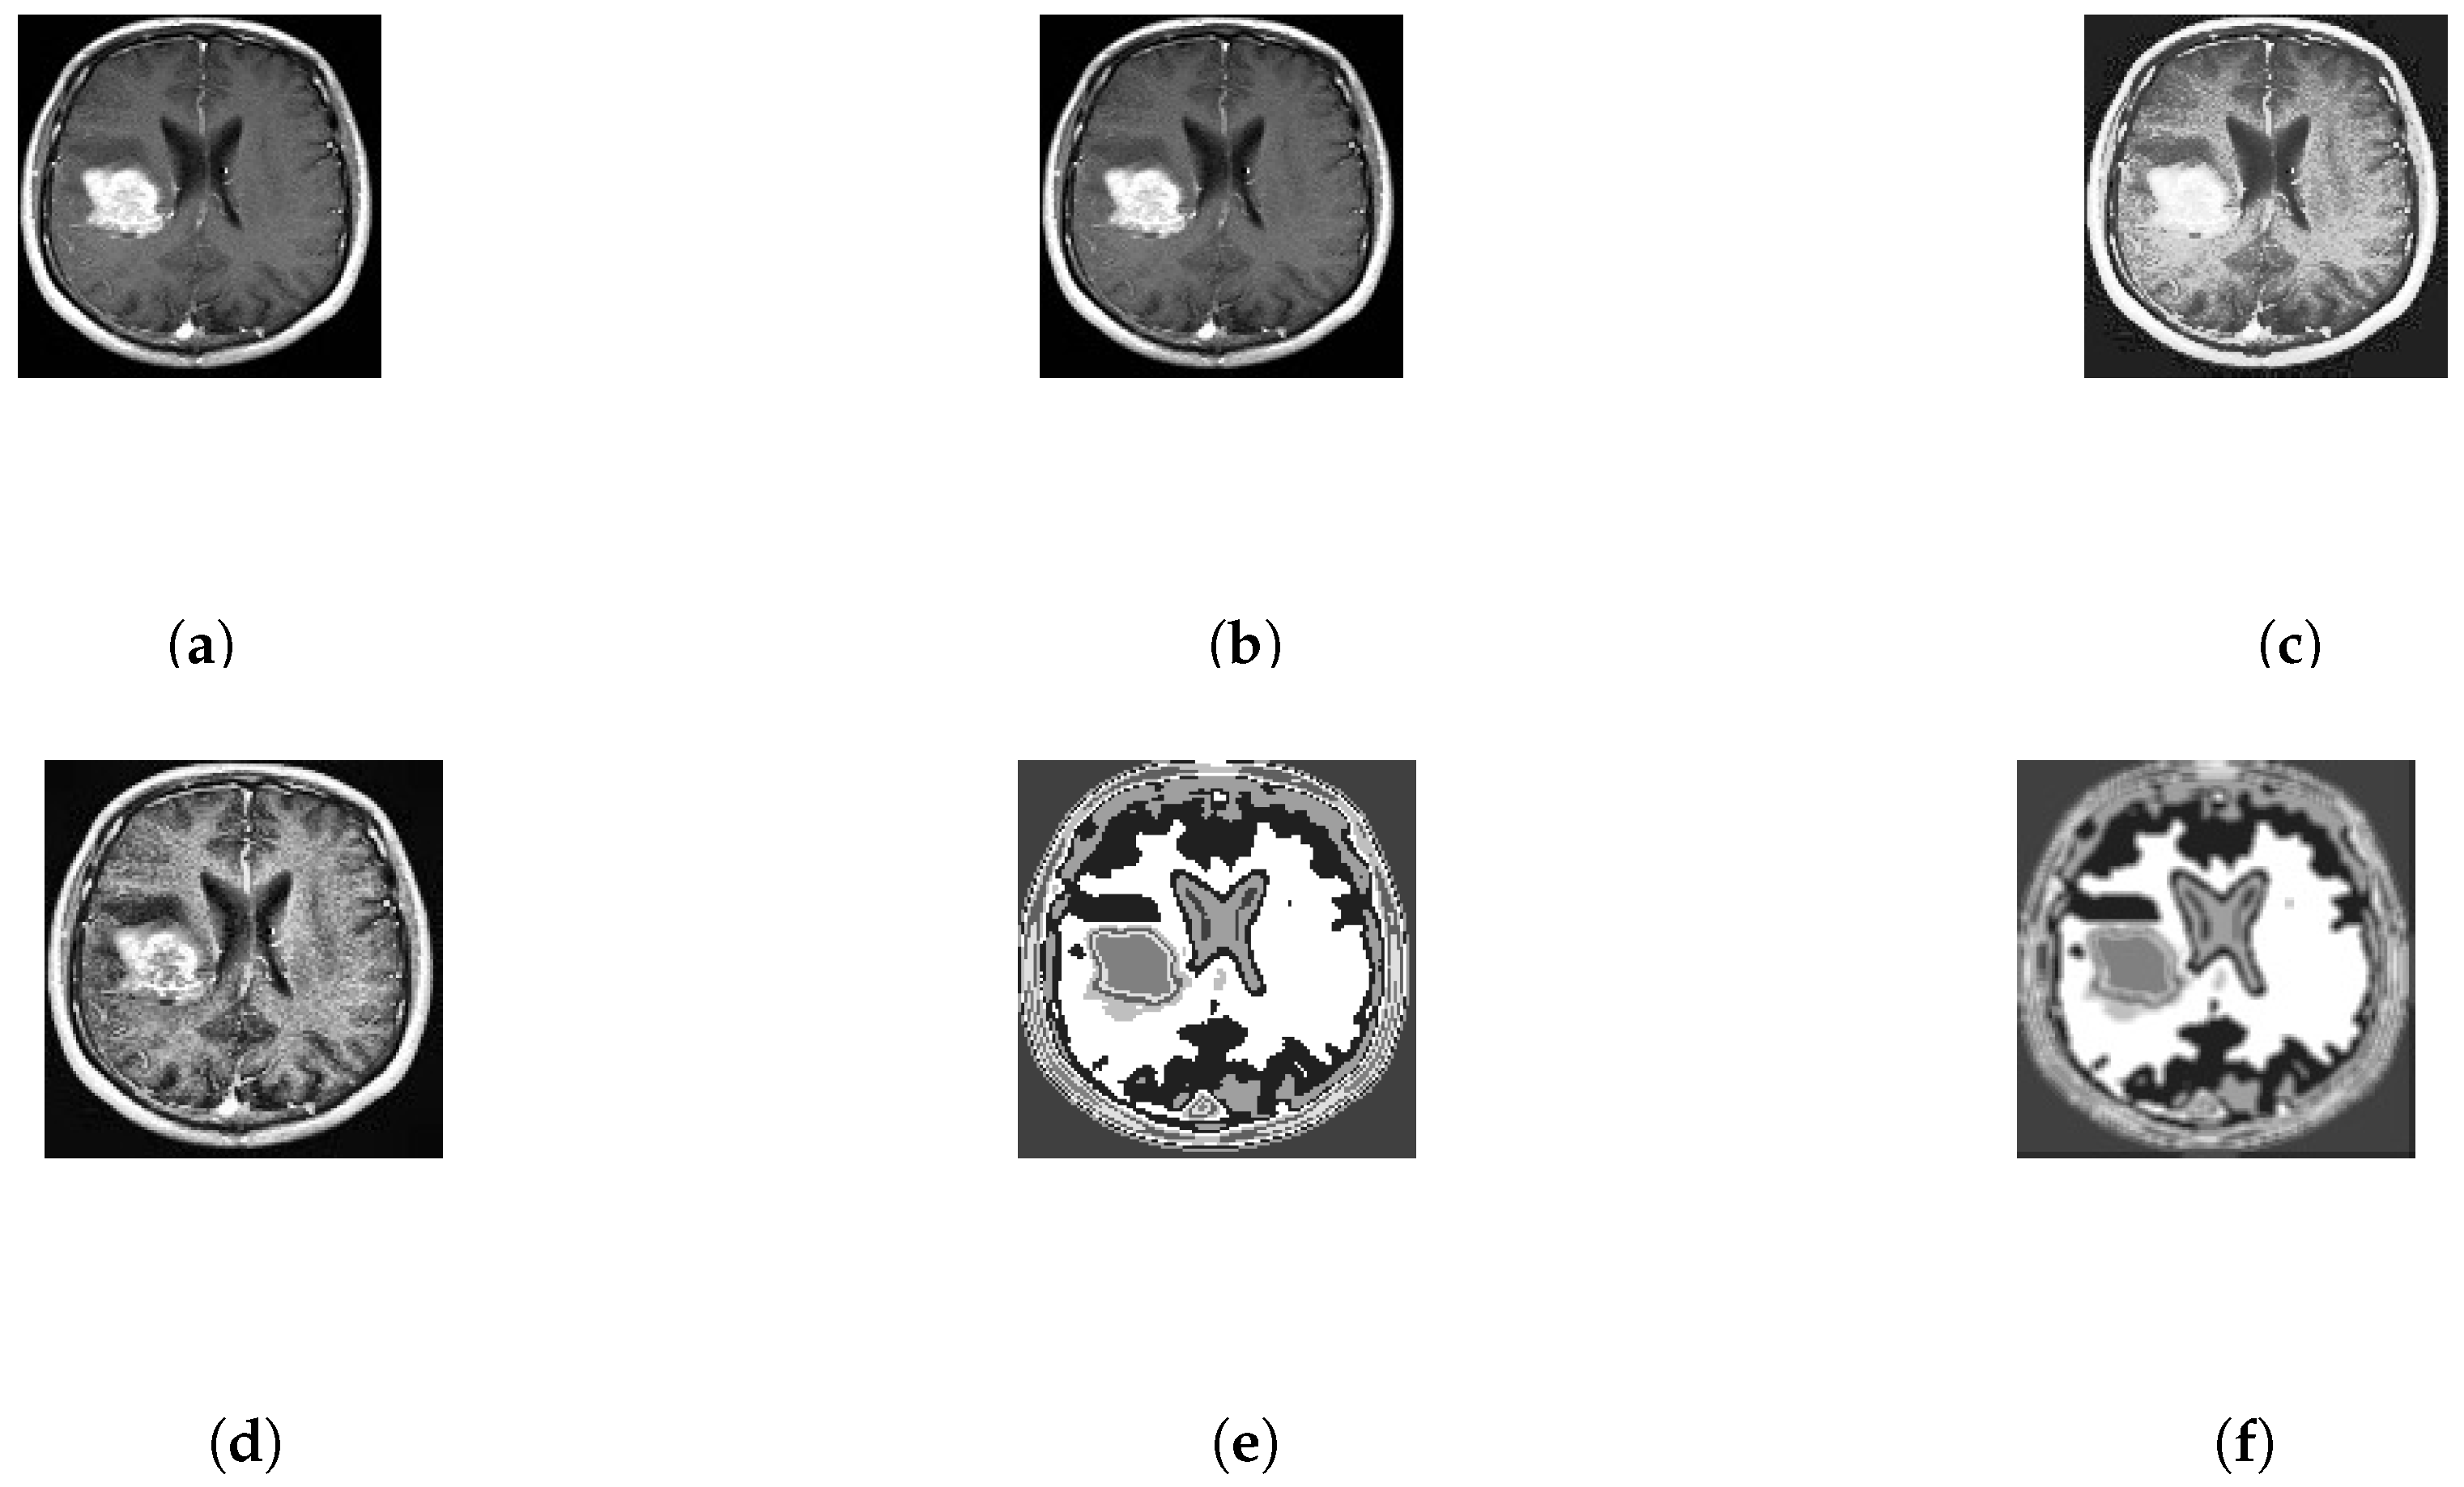
After that, different features are initially extracted implicitly. Every portion of the brain tumor must be selected even a small portion of the brain tumor are not avoided. At frist, the input image is processed through some filter that are described in
Figure 3. Then, in
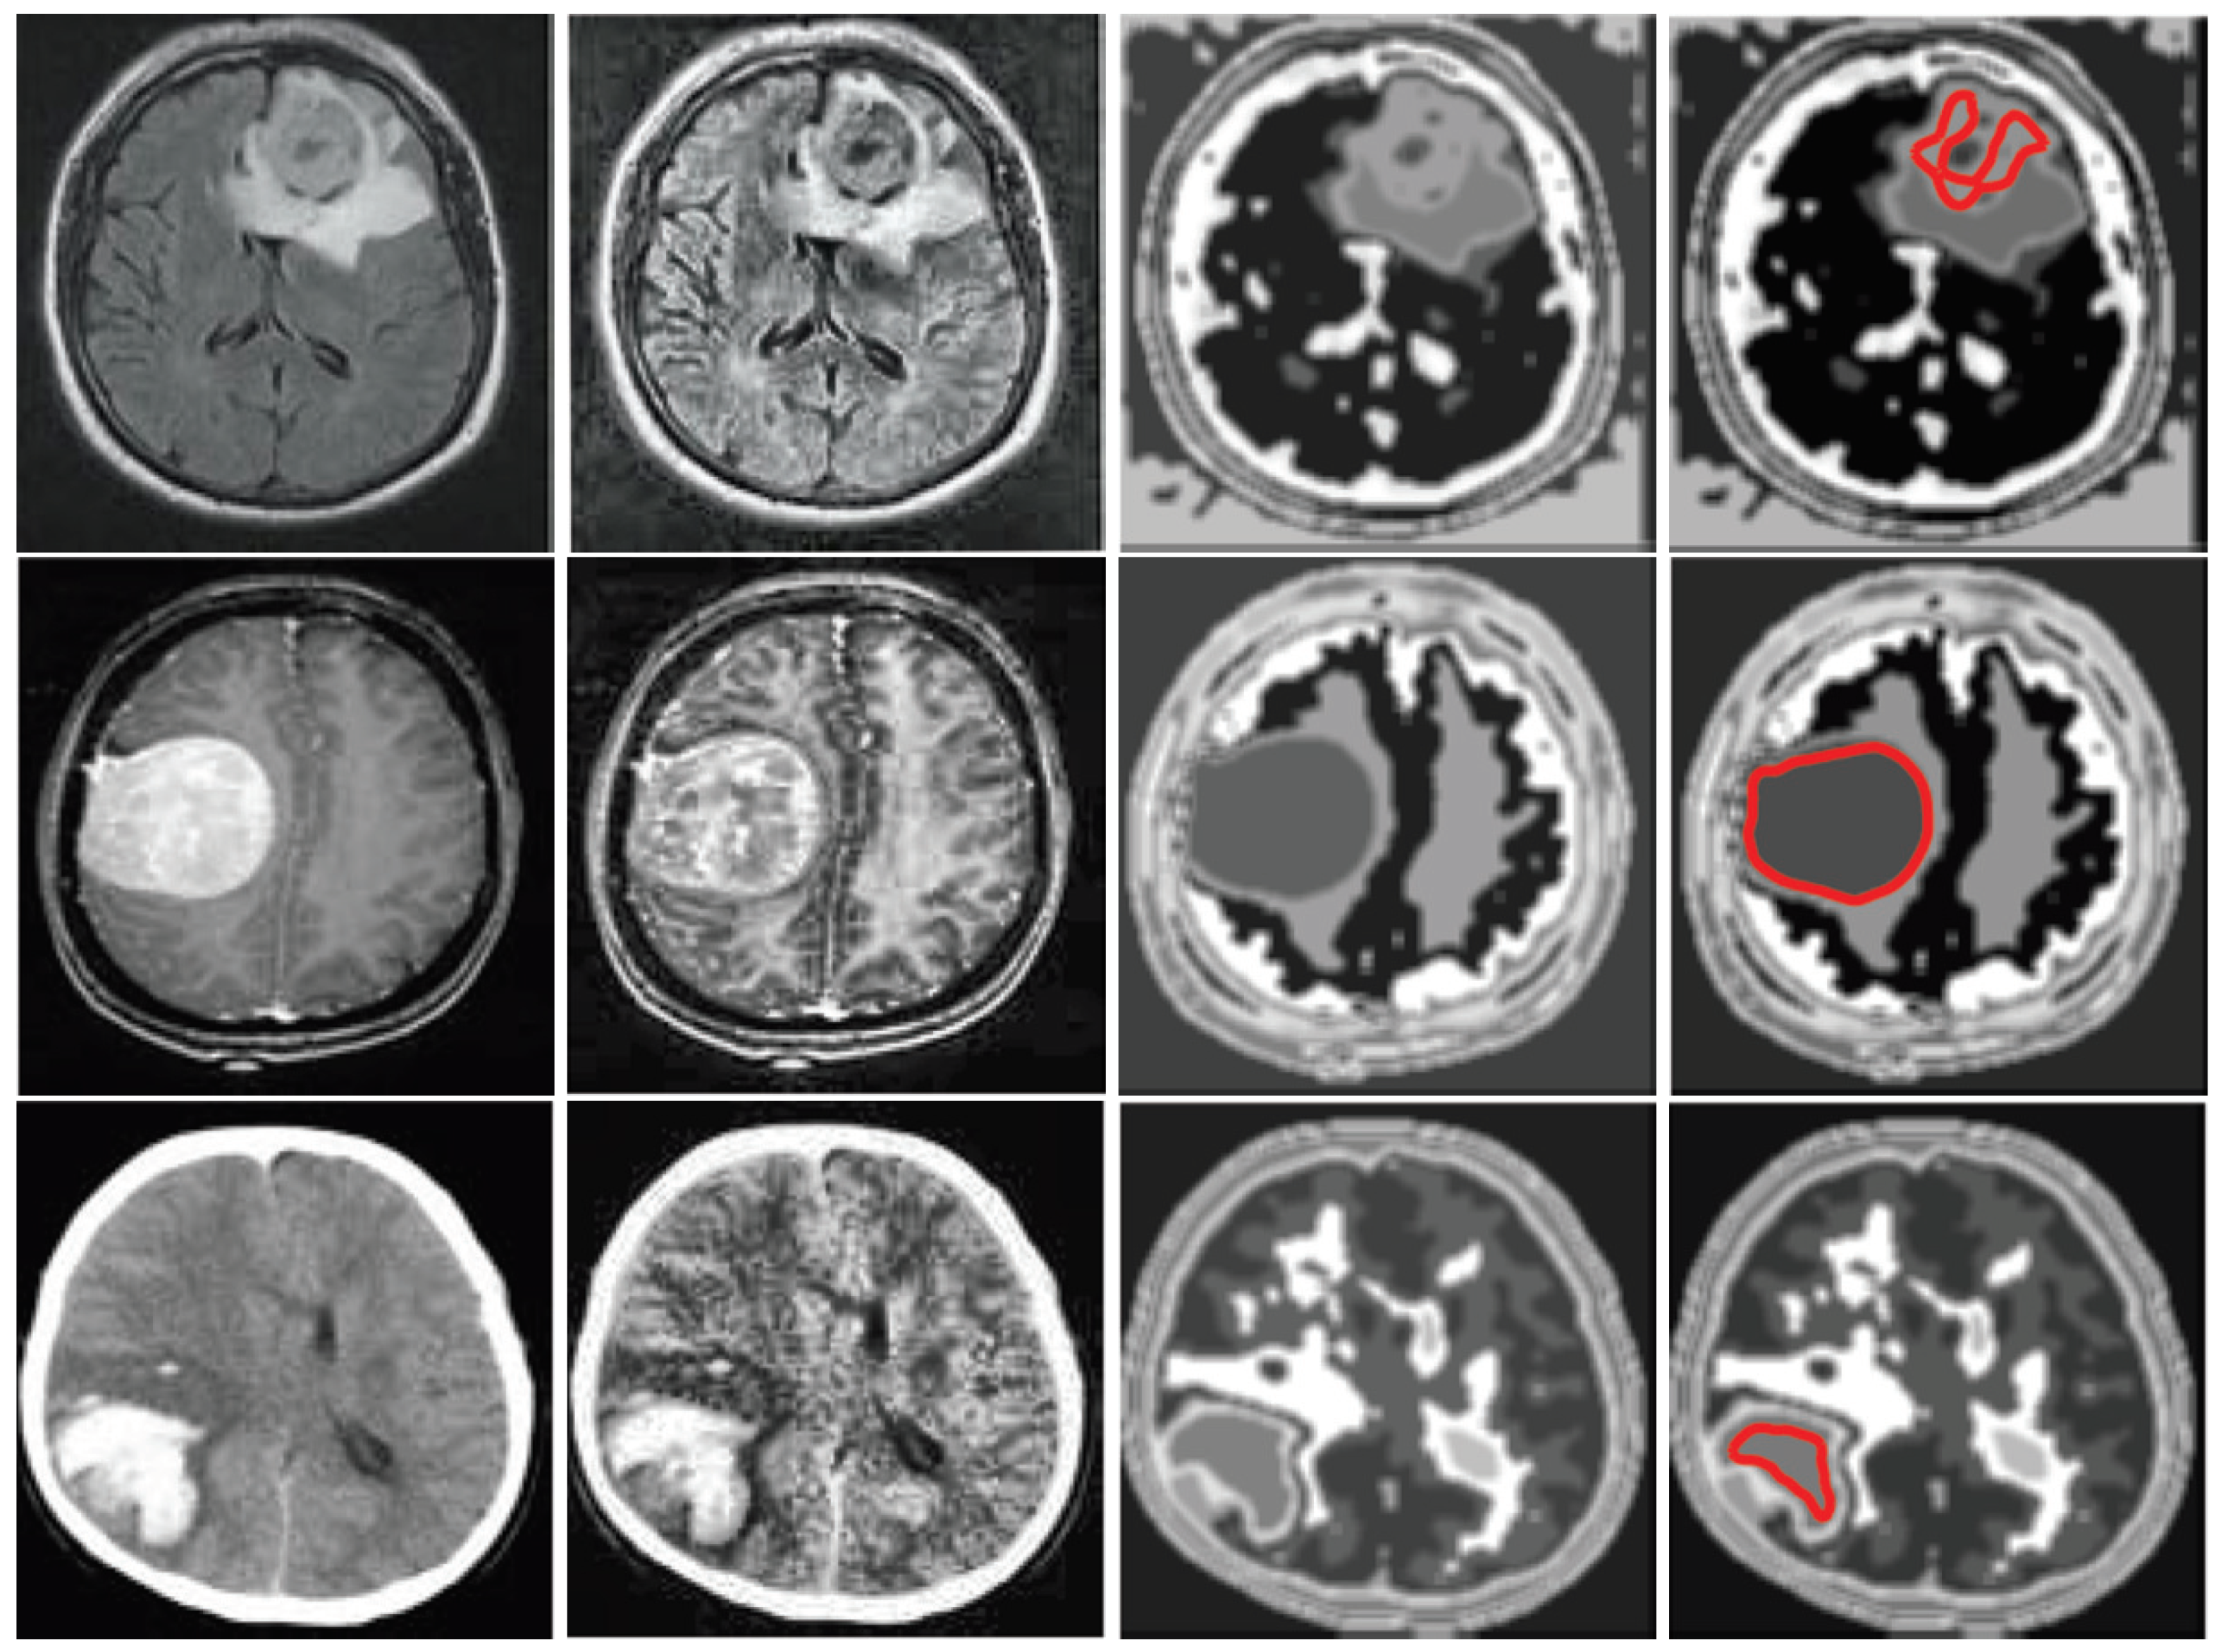
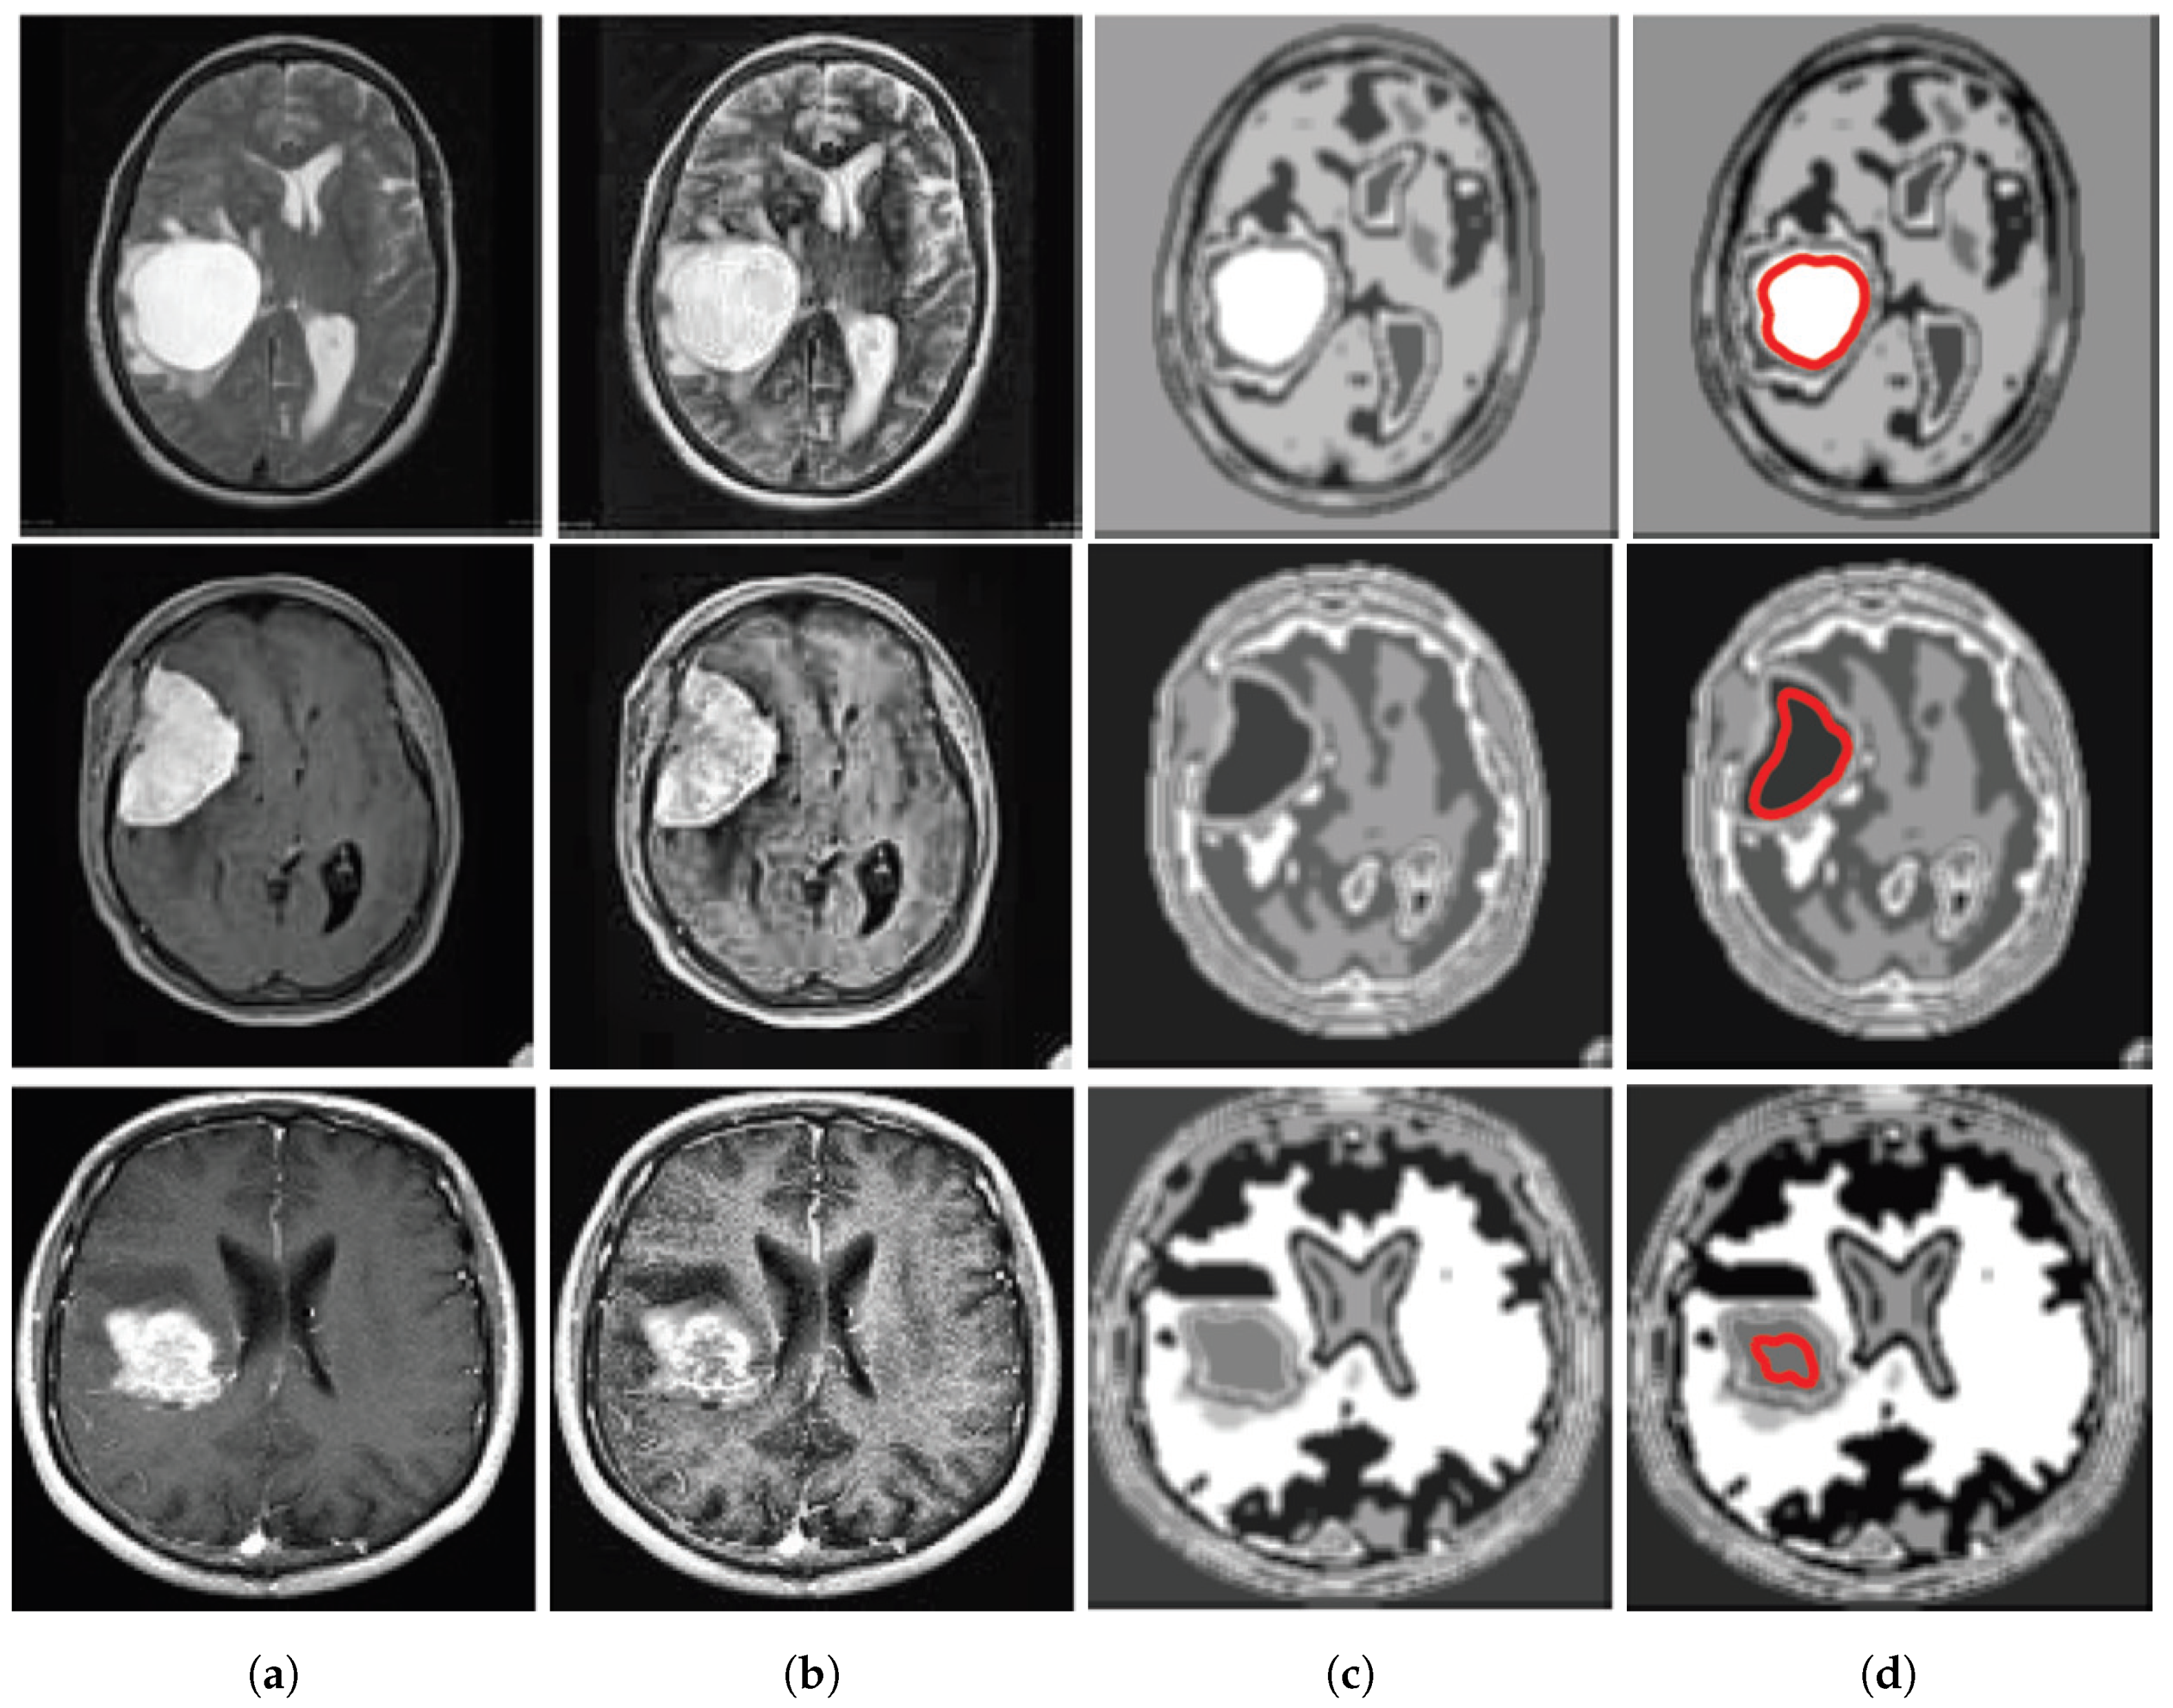
Figure 3e, there is initial segmentation of the image using template based K-means (TK) which is segmented on the basis of there gray level intensity and temper of color where k = 8. After that the tumor is filtered by median filter again. Then, the tumor is detected and marked it as red line using improved FCM algorithm based on the Euclidean distance from cluster centre to each data point which primarily depends on the different features. This could be important to grasp the importance of this changed and incorporated technique.
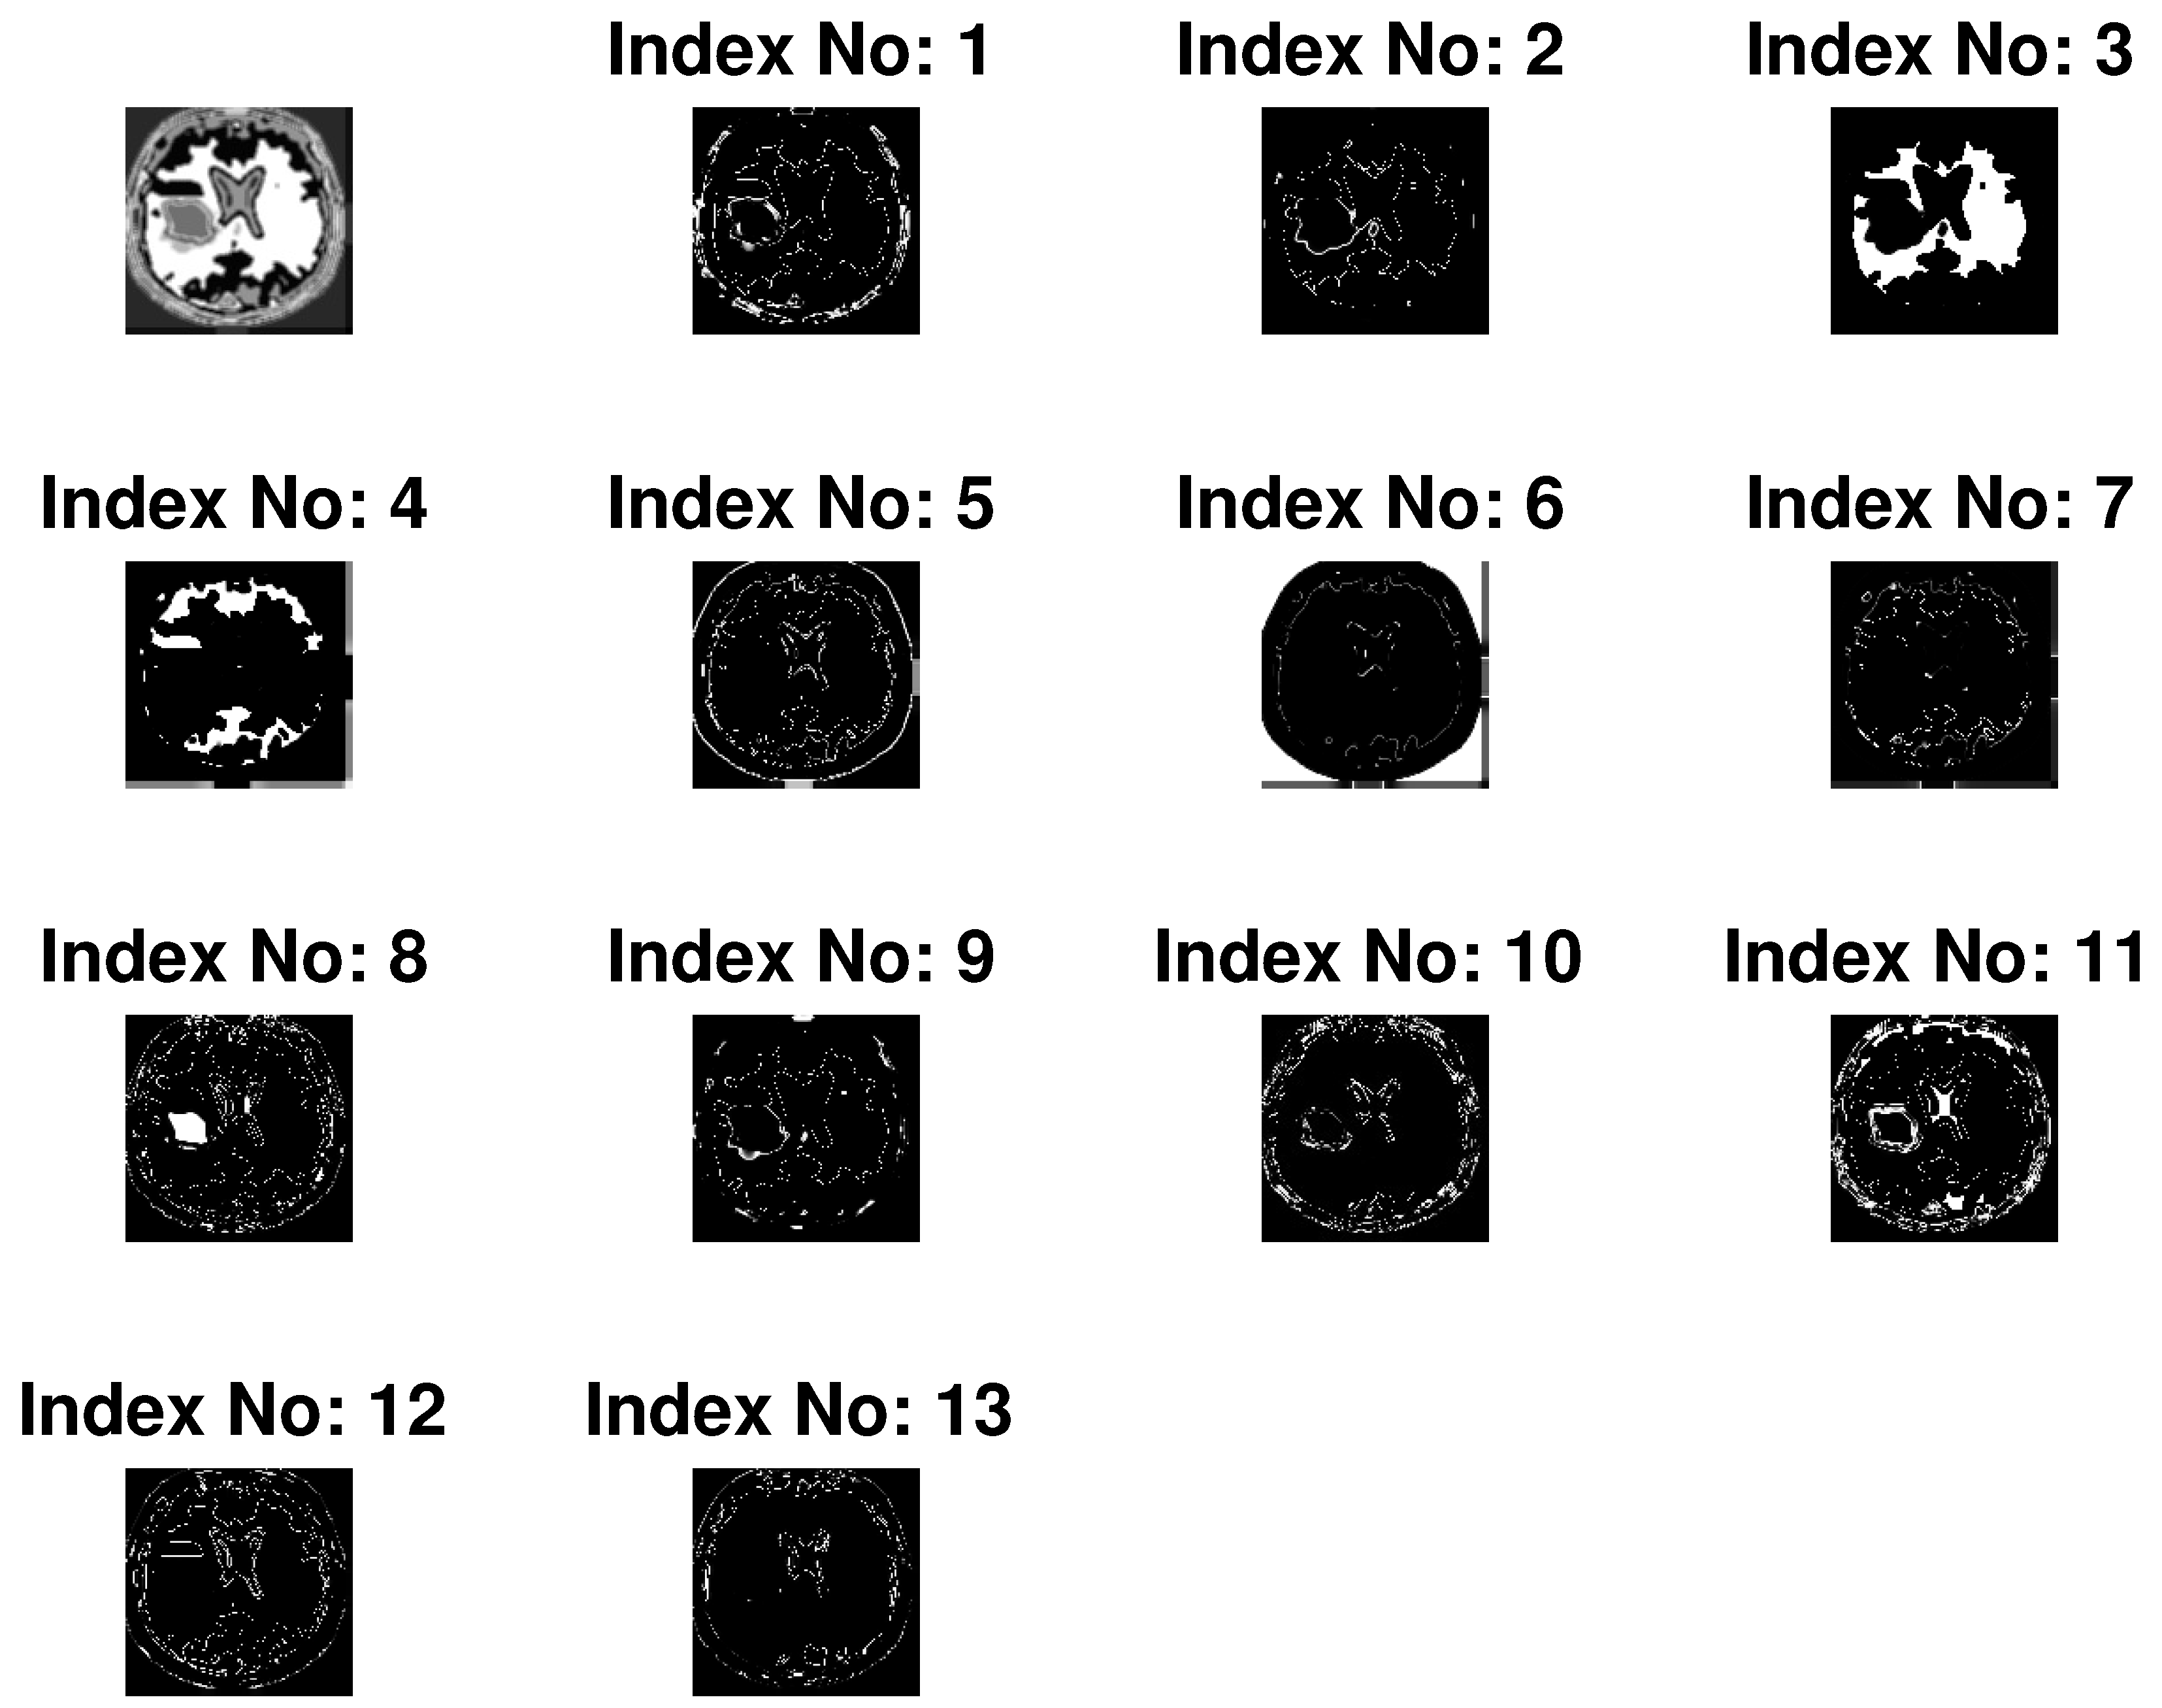
Depending on the grey level intensity the improved FCM is performed for 13 clusters. Clustered image is defined as the image with its smallest gray level and separated from each other with their successive color intensity. For instance, many clustered images for input image no. 10 of database 2 are shown in
Figure 4. Here, the tumor portion with different portion of the image are shown in individualize image and from this, depending on features the tumor is chosen. Here, the index no. 8 is chosen technically and marked as red line in
Figure 5d.
Figure 5 shows the input image no.
and 20 of database 1 and image no. 10 and 15 of database 2 are shown in
Figure 5a and their outputs in
Figure 5d respectively.
System Performance
There is some error rate depending on detecting or not detecting any abnormal tissue in all brain tumor MRI image. These can be measured on the basis of the value of true positive, false positive, true negative, and false negative In this paper, all images in the database have been tested to measure the system accuracy, sensitivity and specificity. For the evaluation of the system accuracy, sensitivity and specificity the following four attributes are used in the measurement.
TP (True Positive): The test result is positive in the existence of the objective abnormality and detected correctly.
TN (True Negative): The test result is negative for non-existing of the objective abnormality and not detected correctly.
FP (False Positive): The test result is positive for non-existing of the objective abnormality and detected correctly.
FN (False Negative): The test result is negative for the existence of the objective abnormality and not detected correctly.
Sensitivity can be defined as the measurement of exact identification of the MRI image that do not contains a tumor. The sensitivity,
is defined as follows:
Specificity can be defined as the measurement of exact identification of the MRI image that do not contains a tumor. The specificity,
is defined as follows:
Accuracy can be defined as the measurement of actual classification. The accuracy,
is defined as follows:
Table 2 demonstrates the Parameters of performance analysis among conventional methods and proposed TKFCM method. In this paper, we have used 40 brain MR images. Different algorithms such as Thresholding, Region growing, Tk-means, FCM, Proposed TKFCM etc. have been performed with these 40 brain MR images. The performance parameters like as True positive (TP), False positive (FP), True negative (TN) and False negative (FN) are calculated with the dataset. The performance parameter ‘True positive’ that is positive for the existence of the object abnormality and detected correctly. The parameter ‘True positive’ of the proposed TKFCM is 42.10%, 37.28%, 47.36%, 36.84%, 44.73%, and 44.73% over the conventional thresholding, Region growing, TK means, FCM, ‘Second order + ANN’, ‘Texture Combined + ANN’, and Proposed TKFCM algorithms, respectively. Moreover, The parameters value of FP, TN and FN are better for proposed TKFCM algorithm is ‘0’, ‘1’, and ‘1’ that are optimum than other conventional algorithms. With the parameter values of TP, FP, TN and FN, the performance measurement parameters such as Sensitivity (
), Specificity (
) and Accuracy (
) are calculated.
Table 3 demonstrates the comparisons among the conventional methods and proposed TKFCM method.
The performance analysis among conventional methods and proposed TKFCM method can be done with the performance parameters TP, FP, TN and FN. In
Table 3, for detecting human brain tumor, three attributes named as sensitivity, specificity, and accuracy play a very significant role. The more the value of these three attributes, the more we have the probability to detect the human brain tumor accurately. With the these parameter values, sensitivity of the proposed TKFCM algorithm for brain tumor detection is 97.43% whereas the conventional thresholding, Region growing, ‘Second order + ANN’, ‘Texture Combined + ANN’, FCM and TK means algorithms has shown 76.9%, 92.8%, 95.5%, 95.45%, 82.7% and 80.00%, respectively. In addition, the specificity of the proposed TKFCM algorithm for brain tumor detection is 100 whereas the conventional thresholding, Region growing, ‘Second order + ANN’, ‘Texture Combined + ANN’, FCM and TK means algorithms has shown 64.25%, 83.3%, 88.8%, 94.44%, 90.9% and 80.00%, respectively. Moreover, the accuracy of the proposed TKFCM algorithm for brain tumor detection is 97.5 whereas the conventional thresholding, Region growing, ‘Second order + ANN’, ‘Texture Combined + ANN’, FCM and TK means algorithms has shown 72.5%, 90.00%, 92.5%, 95.00%, 85.00% and 80.00%, respectively. From the comparison chart, it is observed that TKFCM performs better than others. Very few of them has accuracy better than our proposed TKFCM algorithm whereas the other parameters are not so good.
Table 4 describes the Comparison of computational time among conventional methods and proposed TKFCM method where image size is 128 by 128, processor is Corei3 and the operating system used, is Windows10.
In
Table 4, the average time required for different algorithms are described.From the table, it can be said that most of the algorithm take very long time to compute the actual result such as thresholding, region growing and ANN algorithm takes 3, 10 and 7-15 min whereas our proposed algorithm TKFCM needs only a 40–50 s.
6. Conclusions and Future Work
In this paper, the performance of the proposed TKFCM algorithm obtained better compared with the conventional schemes. Moreover, this algorithm is shown that is an optimum over the conventional schemes. In detecting human brain tumor, the sensitivity of the proposed TKFCM algorithm is 27.07%, 4.75%, 1.98%, 2.03%, 15.11% and 17.89% over the conventional thresholding, Region growing, ‘Second order + ANN’, ‘Texture Combined + ANN’, FCM and TK means algorithms, respectively. In addition, the specificity of the proposed TKFCM algorithm is 27.04%, 16.07%, 11.2%, 5.56%, 9.1% and 20.00% over the conventional thresholding, Region growing, ‘Second order + ANN’, ‘Texture Combined + ANN’, FCM and TK means algorithms, respectively. Moreover, the Accuracy of the proposed TKFCM algorithm is 25.64%, 7.692%, 5.12%, 2.56%, 12.82% and 17.94% over the conventional thresholding, Region growing, ‘Second order + ANN’, ‘Texture Combined + ANN’, FCM and TK means algorithms, respectively. However, the time required to detect brain tumor with the proposed TKFCM algorithm is very short than conventional algorithms.
For future work, we will analyze features to include more features which can be used for detection and accuracy increment, but the required computational time will be high. Moreover, we will analyze for reducing the required computational time and modify the complexity of the proposed TKFCM algorithm compared to the conventional algorithms. However, more specification and standardization of TKFCM can be used for CT, PET, SPECT and neuro imaging.
Author Contributions
The idea was formulated by M.S.A.; The CRN system was designed the experiments and performed the experiments by M.S.A., M.A.H. and M.S.M.; M.M.R. and M.S.M. are both supervised the research; M.S.A., M.A.H., M.K.I., K.M.A., K.T.A. and M.S.M. wrote the paper; M.M.R., B.C.S. and M.S.M. were analytically reviewed and revised the manuscript.
Funding
This research received no external funding.
Acknowledgments
This work was supported by the Department of Information and Communication Engineering (ICE), Islamic University, Kushtia 7003, Bangladesh.
Conflicts of Interest
The authors declare no conflict of interest.
Abbreviations
The following abbreviations are used in this manuscript:
| ANN | Artificial Neural Network |
| CT | Computed Tomography |
| CAD | Computer Aided Diagosis |
| CSM | Clustering Statistical Model |
| DIP | Digital Image Processing |
| EM | Expection Maximization |
| FCM | Fuzzy C-Means |
| FFNN | Feed Forward Neural Network |
| FBNN | Feed Backward Neural Network |
| KNN | K-Nearest-Neighbor |
| NCIS | National Cancer Institute Statistics |
| MRI | Magnetic Resonance Imaging |
| PET | Positron Emission Tomography |
| SVM | Support Vector Machine |
| SPECT | Single Photon Emission Computed Tomography |
| TK | Temper Based K-Means |
| TKFCM | Temper Based K-Means and Fuzzy C-Means |
References
- Selkar, R.G.; Thakare, M. Brain tumor detection and segmentation by using thresholding and watershed algorithm. Int. J. Adv. Inf. Commun. Technol. 2014, 1, 321–324. [Google Scholar]
- Borole, V.Y.; Nimbhore, S.S.; Kawthekar, D.S.S. Image Processing Techniques for Brain Tumor Detection: A Review. Int. J. Emerg. Trends Technol. Comput. Sci. 2015, 4, 28–32. [Google Scholar]
- Mustaqeem, A.; Javed, A.; Fatima, T. An efficient brain tumor detection algorithm using watershed & thresholding based segmentation. Int. J. Image Graph. Signal Process. 2012, 4, 34–39. [Google Scholar]
- Kaur, H.; Mittal, M. Region Based Image Segmentation for Brain Tumor Detection. Int. J. Eng. Manag. Res. 2016, 6, 31–34. [Google Scholar]
- Sinha, K.; Sinha, G. Efficient segmentation methods for tumor detection in MRI images. In Proceedings of the IEEE 2014 IEEE Students’ Conference on Electrical, Electronics and Computer Science, Bhopal, India, 1–2 March 2014; pp. 1–6. [Google Scholar]
- Bahadure, N.B.; Ray, A.K.; Thethi, H.P. Image analysis for MRI based brain tumor detection and feature extraction using biologically inspired BWT and SVM. Int. J. Biomed. Imaging 2017, 2017, 9749108. [Google Scholar] [CrossRef] [PubMed]
- Yazdani, S.; Yusof, R.; Karimian, A.; Pashna, M.; Hematian, A. Image segmentation methods and applications in MRI brain images. IETE Tech. Rev. 2015, 32, 413–427. [Google Scholar] [CrossRef]
- Rana, R.; Singh, P. Brain Tumor Detection through MR Images: A Review of Literature. IOSR J. Comput. Eng. 2015, 17, 7–18. [Google Scholar]
- Mathew, A.R.; Anto, P.B. Tumor detection and classification of MRI brain image using wavelet transform and SVM. In Proceedings of the IEEE 2017 International Conference on Signal Processing and Communication (ICSPC), Coimbatore, India, 28–29 July 2017; pp. 75–78. [Google Scholar]
- Patel, J.; Doshi, K. A study of segmentation methods for detection of tumor in brain MRI. Adv. Electron. Electr. Eng. 2014, 4, 279–284. [Google Scholar]
- Isselmou, A.; Zhang, S.; Xu, G. A novel approach for brain tumor detection using MRI images. J. Biomed. Sci. Eng. 2016, 9, 44–52. [Google Scholar] [CrossRef]
- Prastawa, M.; Bullitt, E.; Ho, S.; Gerig, G. A brain tumor segmentation framework based on outlier detection. Med. Image Anal. 2004, 8, 275–283. [Google Scholar] [CrossRef]
- Gordillo, N.; Montseny, E.; Sobrevilla, P. State of the art survey on MRI brain tumor segmentation. Magn. Reson. Imaging 2013, 31, 1426–1438. [Google Scholar] [CrossRef] [PubMed]
- Selvaraj, D.; Dhanasekaran, R. Mri brain image segmentation techniques—A review. Indian J. Comput. Sci. Eng. 2013, 4, 364–381. [Google Scholar]
- Despotović, I.; Goossens, B.; Philips, W. MRI segmentation of the human brain: Challenges, methods, and applications. Comput. Math. Methods Med. 2015, 2015, 450341. [Google Scholar] [CrossRef]
- Noureen, E.; Hassan, K. Brain Tumor Detection Using Histogram Thresholding to Get the Threshold point. IOSR J. Electr. Electron. Eng. 2014, 9, 14–19. [Google Scholar] [CrossRef]
- Dubey, R.B.; Hanmandlu, M.; Gupta, S.K.; Gupta, S.K. The brain MR image segmentation techniques and use of diagnostic packages. Acad. Radiol. 2010, 17, 658–671. [Google Scholar] [CrossRef] [PubMed]
- Abirami, M.; Sheela, D.T. Analysis of image segmentation techniques for medical images. In Proceedings of the International Conference on Emerging Research in Computing, Information, Communication and Applications, Bangalore, India, 1–2 August 2014. [Google Scholar]
- Deshmukh, R.D.; Jadhav, C. Study of different brain tumor MRI image segmentation techniques. Int. J. Sci. Eng. Comput. Technol. 2014, 4, 133. [Google Scholar]
- Dilpreet, K.; Kaur, Y. Various image segmentation techniques: a review. Int. J. Comput. Sci. Mob. Comput. 2014, 3, 809–814. [Google Scholar]
- Mathur, N.; Meena, Y.K.; Mathur, S.; Mathur, D. Detection of Brain Tumor in MRI Image through Fuzzy-Based Approach. In High-Resolution Neuroimaging-Basic Physical Principles and Clinical Applications; InTech: Rijeka, Croatia, 2018. [Google Scholar]
- Pham, D.L.; Xu, C.; Prince, J.L. Current methods in medical image segmentation. Annu. Rev. Biomed. Eng. 2000, 2, 315–337. [Google Scholar] [CrossRef]
- Xie, X. A K-Nearest Neighbor Technique for Brain Tumor Segmentation Using Minkowski Distance. J. Med. Imaging Health Inform. 2018, 8, 180–185. [Google Scholar] [CrossRef]
- Wasule, V.; Sonar, P. Classification of brain MRI using SVM and KNN classifier. In Proceedings of the 2017 Third International Conference on Sensing, Signal Processing and Security (ICSSS), Chennai, India, 4–5 May 2017; pp. 218–223. [Google Scholar]
- Sharma, K.; Kaur, A.; Gujral, S. A review on various brain tumor detection techniques in brain MRI images. IOSR J. Eng. 2014, 4, 6–12. [Google Scholar] [CrossRef]
- Singh, A.; Parveen. Detection of brain tumor in MRI images, using combination of fuzzy c-means and SVM. In Proceedings of the 2015 2nd International Conference on Signal Processing and Integrated Networks (SPIN), Noida, India, 19–20 February 2015; pp. 98–102. [Google Scholar]
- Van Leemput, K.; Maes, F.; Vandermeulen, D.; Suetens, P. Automated model-based tissue classification of MR images of the brain. IEEE Trans. Med Imaging 1999, 18, 897–908. [Google Scholar] [CrossRef]
- Selvakumar, J.; Lakshmi, A.; Arivoli, T. Brain tumor segmentation and its area calculation in brain MR images using K-mean clustering and Fuzzy C-mean algorithm. In Proceedings of the International Conference on Advances in Engineering, Science and Management (ICAESM), Tamil Nadu, India, 30–31 March 2012; pp. 186–190. [Google Scholar]
- Dhanalakshmi, P.; Kanimozhi, T. Automatic segmentation of brain tumor using K-Means clustering and its area calculation. Int. J. Adv. Electr. Electron. Eng. 2013, 2, 130–134. [Google Scholar]
- Yadav, S.; Meshram, S. Brain tumor detection using clustering method. Int. J. Comput. Eng. Res. 2013, 3, 11–14. [Google Scholar]
- Karypis, M.S.G.; Kumar, V.; Steinbach, M. A comparison of document clustering techniques. In Proceedings of the TextMining Workshop at KDD2000, Boston, MA, USA, 15 May 2000. [Google Scholar]
- Verma, M.; Srivastava, M.; Chack, N.; Diswar, A.K.; Gupta, N. A comparative study of various clustering algorithms in data mining. Int. J. Eng. Res. Appl. 2012, 2, 1379–1384. [Google Scholar]
- Hall, L.O.; Bensaid, A.M.; Clarke, L.P.; Velthuizen, R.P.; Silbiger, M.S.; Bezdek, J.C. A comparison of neural network and fuzzy clustering techniques in segmenting magnetic resonance images of the brain. IEEE Trans. Neural Netw. 1992, 3, 672–682. [Google Scholar] [CrossRef]
- Bhide, A.; Patil, P.; Dhande, S. Brain Segmentation using Fuzzy C means clustering to detect tumour Region. Int. J. Adv. Res. Comput. Sci. Electron. Eng. 2012, 1, 85. [Google Scholar]
- Szilagyi, L.; Benyo, Z.; Szilágyi, S.M.; Adam, H. MR brain image segmentation using an enhanced fuzzy c-means algorithm. In Proceedings of the 25th Annual International Conference of the Engineering in Medicine and Biology Society, Cancun, Mexico, 17–21 September 2003; Volume 1, pp. 724–726. [Google Scholar]
- Pham, D.L.; Prince, J.L. Adaptive fuzzy segmentation of magnetic resonance images. IEEE Trans. Med. Imaging 1999, 18, 737–752. [Google Scholar] [CrossRef]
- Pereira, S.; Pinto, A.; Alves, V.; Silva, C.A. Brain tumor segmentation using convolutional neural networks in MRI images. IEEE Trans. Med. Imaging 2016, 35, 1240–1251. [Google Scholar] [CrossRef] [PubMed]
- Matta, S. Review: Various image segmentation techniques. Int. J. Comput. Sci. Inf. Technol. 2014, 5, 7536–7539. [Google Scholar]
- Vijay, J.; Subhashini, J. An efficient brain tumor detection methodology using K-means clustering algoriftnn. In Proceedings of the International Conference on Communication and Signal Processing, Melmaruvathur, India, 3–5 April 2013; pp. 653–657. [Google Scholar]
- Singh, A.; Yadav, A.; Rana, A. K-means with Three different Distance Metrics. Int. J. Comput. Appl. 2013, 67, 13–17. [Google Scholar] [CrossRef]
- Arzoo, M.; Prof, A.; Rathod, K. K-Means algorithm with different distance metrics in spatial data mining with uses of NetBeans IDE 8.2. Int. Res. J. Eng. Technol. 2017, 4, 2363–2368. [Google Scholar]
- Ahmmed, R.; Hossain, M.F. Tumor detection in brain MRI image using template based K-means and Fuzzy C-means clustering algorithm. In Proceedings of the International Conference on Computer Communication and Informatics (ICCCI), Coimbatore, India, 7–9 January 2016; pp. 1–6. [Google Scholar]
- Singh, K.; Malik, D.; Sharma, N. Evolving limitations in K-means algorithm in data mining and their removal. Int. J. Comput. Eng. Manag. 2011, 12, 105–109. [Google Scholar]
- Shasidhar, M.; Raja, V.S.; Kumar, B.V. MRI brain image segmentation using modified fuzzy c-means clustering algorithm. In Proceedings of the 2011 International Conference on Communication Systems and Network Technologies, Jammu, India, 3–5 June 2011; pp. 473–478. [Google Scholar]
- Hooda, H.; Verma, O.P.; Singhal, T. Brain tumor segmentation: A performance analysis using K-Means, Fuzzy C-Means and Region growing algorithm. In Proceedings of the 2014 IEEE International Conference on Advanced Communications, Control and Computing Technologies, Ramanathapuram, India, 8–10 May 2014; pp. 1621–1626. [Google Scholar]
© 2019 by the authors. Licensee MDPI, Basel, Switzerland. This article is an open access article distributed under the terms and conditions of the Creative Commons Attribution (CC BY) license (http://creativecommons.org/licenses/by/4.0/).

 ,
, 


