Article

An Enhanced Inference Algorithm for Data Sampling Efficiency and Accuracy Using Periodic Beacons and Optimization

by
James Jin Kang
1,2,*,
Kiran Fahd
1 and
Sitalakshmi Venkatraman
1
1
Department of Information Technology, Melbourne Polytechnic, Preston, VIC 3181, Australia
2
School of Information Technology, Deakin University, Burwood, VIC 3125, Australia
*
Author to whom correspondence should be addressed.
Big Data Cogn. Comput. 2019, 3(1), 7; https://doi.org/10.3390/bdcc3010007
Submission received: 24 December 2018 / Revised: 11 January 2019 / Accepted: 12 January 2019 / Published: 16 January 2019

Abstract

:
Transferring data from a sensor or monitoring device in electronic health, vehicular informatics, or Internet of Things (IoT) networks has had the enduring challenge of improving data accuracy with relative efficiency. Previous works have proposed the use of an inference system at the sensor device to minimize the data transfer frequency as well as the size of data to save network usage and battery resources. This has been implemented using various algorithms in sampling and inference, with a tradeoff between accuracy and efficiency. This paper proposes to enhance the accuracy without compromising efficiency by introducing new algorithms in sampling through a hybrid inference method. The experimental results show that accuracy can be significantly improved, whilst the efficiency is not diminished. These algorithms will contribute to saving operation and maintenance costs in data sampling, where resources of computational and battery are constrained and limited, such as in wireless personal area networks emerged with IoT networks.

1. Introduction

In health applications, wearable devices are being increasingly used for various purposes, such as monitoring the cardiovascular system for capturing electrocardiography (ECG), blood pressure, pulse rate, glucose levels etc. Information collected through sensors and implantable devices require smart inference functions for intelligent processing, and to communicate wirelessly with external systems accurately. The purpose of such a smart inference function is to manage huge data loads through filtering, and to ensure that critical information can be transmitted between sensor devices in wireless body area networks (WBAN) and other external networks which provide healthcare services and applications (e.g., IoT or healthcare). The application of such an inference system can include areas such as the office, home, and public spaces [1]. Hence, in the context of big data, the training and sampling of data are critical in determining the quality of data wrangling and accuracy, as well as in having an effect on network performance and capacity. For example, in mobile health networks, transferring data over radio consumes 2.5 times the battery power compared to sensing data by sensor devices [2].
We could improve the accuracy of data by taking a higher number of data points for transferring, however it will increase the battery consumption, which reduces efficiency. Thus, the frequency of data transfer significantly affects the battery life of devices which can be implanted inside the body. Not to mention, the inconvenience of replacing batteries in implanted monitoring devices leads to the questions of how accurately and efficiently data are required to be sampled at the sensors and recovered at the destination. We may improve the efficiency by reducing the number of sampling and transferring, however at the cost of reducing the data accuracy. As there is a compromise between the two aspects of accuracy and efficiency, we propose to enhance the sampling method with these characteristics in mind by incorporating fine tuning aspects in the algorithm.
In this paper, we propose to improve the data inference system at sensor nodes using optimized algorithms to further reduce battery power of sensors when they transfer data to smart devices, which will subsequently forward them to servers in the cloud.
The main contribution of this work is to facilitate sensors to improve accuracy of data sampling, whilst maintaining the same efficiency during data sampling. This is achieved by introducing hybrid methodology of algorithms applied to a raw dataset with fine-mode method (FM) and coarse-mode method (CM) combined with beacon-mode method (BM). These methods are called beacon-fine-mode method (BFM) and beacon-coarse-mode method (BCM). New algorithms are used to compute the best accuracy and efficiency, in addition to the hybrid methodologies, such as BFM and BCM so that these can be further improved for better accuracy without diminishing the efficiency.
The rest of the paper is organized as follows. In Section 2, we provide the methodology of evaluating our proposed data sampling and inference mechanism. In Section 3, we describe the algorithms introduced to intelligently select the data points and inference mechanism using fine FM, CM, BM, BFM, and BCM. The results of our experiments, to compare these algorithms as well as hybrid algorithms, are presented in Section 4. The final section describes the conclusion and future works.

2. Methodology

Some existing methodologies address the issue of improving the reading and the sampling of sensed data. For example, to provide an inference method for social networks dealing with cluster structure modelling, a Bayesian inference method has been proposed to compare the performances of the inference algorithms with infinite rational model and variation Bayesian inference methods [3]. Another Bayesian inference method has been developed for data intensive computing, using Gibbs sampling method in random Bayesian inference algorithm to derive and infer the final result [4].
Sampling data in a distributed sensor networks with non-uniform periods [5] has been proposed, and this can be further considered in a comprehensive situation with large scaled datasets in a rapid growth of big data for real time analysis, such as social networks. The existing normal distribution sampling method can be extended to generate a summary of datasets to help these cases [6].
Our method is using a novel approach, with inference algorithms for accuracy and efficiency, as opposed to existing methodologies for assessment. The advantage of our method is that it allows for the demonstration of the feasibility of using an inference system to save bandwidth and battery power, as opposed to determining the best method for sensing, processing, and transferring data with the best accuracy, which was not within the scope of this project. To assess the efficiency of our proposed inference algorithm, the factors below have been considered for assessment [7]:
  • Efficiency: Ratio of saved (reduced) data volume and actual transmitted data.
  • Savings: Ratio of reduced data and sensed data (%).
  • Accuracy: Ratio of total value of transmitted data and original data (%).
  • Number of Sensed data: Total number of data points sensed by sensors. These data are used to take sample data for inferencing.
  • Number of Transferred data: Total number of inferred data to be transferred to smart devices from the sensor after inference algorithm has been applied.
  • Sum of original DPs: Total number of values of sensed data points, which is the same as the value of heart rate, e.g., DPn: 108 beats per minutes (BPM) = 108 for data point ‘n’.
  • Sum of differences: Total values of gaps between the original DP values and the inferred DP values. These values are used to calculate the accuracy rates.
Efficiency   Rate   ( Er )   = No   of   Sensed   data No   of   Transferred   data No   of   Transferred   data
Savings   Rate   ( Sr )   = No   of   Sensed   data No   of   Transferred   data Number   of   Sensed   data × 100
Accuracy   Rate   ( Ar )   = Sum   of   original   DPs   Sum   of   differences   Sum   of   original   DPs × 100
Gaps between the original and the inferred volume are the areas added below:
S d i f f =   | S u p p e r     S l o w e r | S s u m =   S u p p e r   +   S l o w e r
Figure 1a reflects the gap between the upper and lower lines after application of an inference mechanism. The bigger the gap area (e.g., green and yellow areas in Figure 1a, the less accurate the result is, as shown in Figure 1a. The gap in Figure 1a, as proposed by Kang et al. [8], can be further improved for the accuracy by adjusting the sampling data point, as shown in Figure 1b. To do this, an additional decision-making step is required to calculate the area of S on whether to adjust the sampling data point against the pre-defined threshold data. In this scenario, two (2) data points were added to improve the accuracy, however this was done at a cost to efficiency. To compensate for the loss of efficiency by the added data points, it requires further adjustment. As shown in Figure 1c, the data point w (dark blue) can allow reduction of the existing two data points a and b (light blue) without degrading the accuracy, i.e., area of gap.
Comparing Figure 1a and Figure 1c, the number of total data points of the examined area are the same, whilst the accuracy has been significantly improved. Figure 1 depicts the aforementioned steps and scenarios.

3. Algorithm Development

This section describes the algorithms with steps to implement the analysis and adjustment of data points for better accuracy and efficiency, based on sample data points and historic data, or pre-defined comparison values stored in a database of inference values. This algorithm provides a high-level overview of the proposed implementation, with reference to the following workflow and description. The algorithm compares values of the pre-determined values, sample data points, and S values.
Definitions used in the algorithm are given below (Table 1):
Step 1:
The original data points are monitored and inferred to provide sample data points. The algorithm 2 infers the gap area S, which produces accuracy and efficiency rates between the first and last data point, as shown in Figure 4. The S is composed of   S diff   , which is the absolute value of difference between the original and inferred gaps for the first and last data point, and S sum   , which is an absolute value of summation of original and inferred gap for the first and last data point.
The following steps will be executed for the n − 1 times for a pair of adjacent data points (i.e., n and n + 1) for the following equation:
S sum = | i = 1 n 1 S u p p e r   i ( i + 1 )   +   S l o w e r   i ( i + 1 ) |
S diff = | i = 1 n 1 S u p p e r   i ( i + 1 )     S l o w e r   i ( i + 1 ) |
The Algorithm 1 monitors the original data points and inferred to create sample data points. For example, the original data point range is 1–1800 and the sample (inferred) data point range is 1–70, thus, n = 70.
The Algorithm 1 logic to provide sample data points is as below:
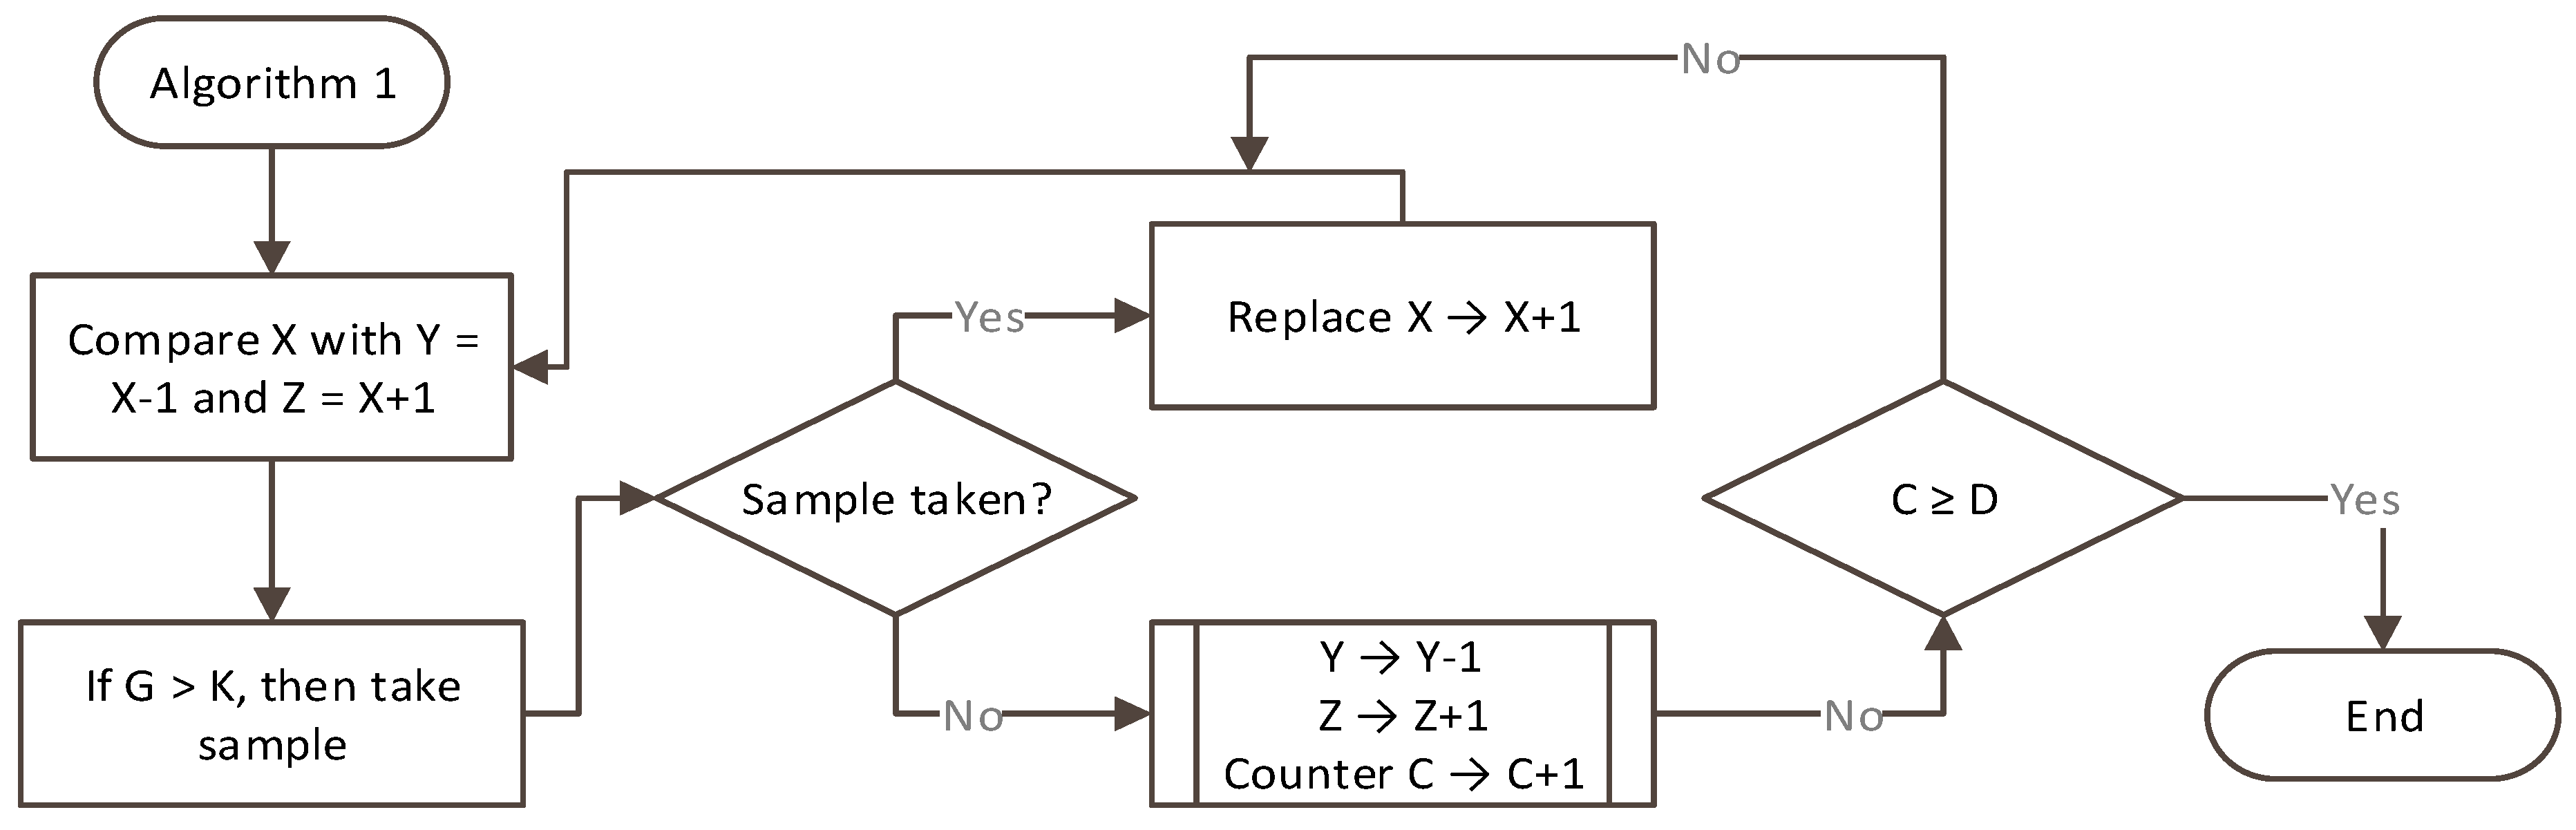
  • Compare the value of data point at X with Y = X − 1 and Z = X + 1. When the value G (gap between X and (X − 1 or X + 1)) is larger than a value of K (this can be percentile, e.g., 2%, 5%, etc., and it determines “fine” or “coarse” method of the inference), the data point is selected as a sample, and moved to the next (i.e., data point at X + 1 to compare with X and X + 2).
  • If a sample is not selected, then it will compare with X − 2 and X + 2. When the gap is larger than K, it will be selected as a sample data point. Counter C increments until a pre-defined value D, which determines the distance to neighbor data points.
  • If a sample is not selected, then do the same till X and Y.
  • If a sample is not selected and C is larger than D, then it ignores X, so move the data point X to X+1 to compare with Y and Z.
Algorithm 1. Creation of sample data collection
1. /* To create a collection of sample data points as SD i [   ]   from the original data points array that is SD O [   ] .*/
2. function retrievePredefinedValues( )
3.  K → retrieve pre-defined threshold values for FM and CM from inference threshold database dbI
4.  D → retrieve pre-defined threshold values for distance to neighboring data point from dbI
5.  return K,D
6. end function
7. function createSampleDataPoints (X,C)
8.  Y = X − C // to store the value of neighbor data point—one prior data point
9.  Z = X + C // to store the value of next consecutive data point
10.  G → Calculategap
11.  if ( G > K ) then
12.     Add X to SD i [   ] // add to collection of sample data array after inference
13.  end if
14. end function
15. -----------------------------Algorithm 1 Logic-----------------------------
16.  K → retrievePredefinedValues( )
17.  D → retrievePredefinedValues( )
18.  select X from SD O [ ] // an array of original sample data
19.   until ( X < N ) do loop // executed for the N-1 times for a pair of adjacent data points
20.   integer C //declare the counter to compare with the pre-defined value D
21.   C = 1 // initialize the counter to compare with the pre-defined value D
22.   createSampleDataPoints(X,C)
23.   if ( G < K ) then
24.     until ( C < D ) do loop // a pre-defined value D to determines the distance to neighbor data points
25.     C = C+1 // increment counter C
26.     createSampleDataPoints (X,C)
27.    end until
28.   end if
29.   X = X+1 //select next data point from SD O —an array of original sample data
30.  end until
31. -----------------------------End of Algorithm 1 Logic-----------------------------
Figure 2 shows the flow of the algorithm to create sample data points.
Step 2:
The gap area S between the selected data points of the sample against the original data points are calculated and denoted as S u p p e r , as shown in Figure 1a. The algorithm (Algorithm 2) checks the difference between S u p p e r   and S l o w e r   to determine the accuracy of the mean value, and uses the outcome in Algorithm 3 so that it can adjust the sample data point.
This outcome is compared against the inference threshold database for a pre-defined value (P), which will determine whether the Algorithm 3 will be executed to adjust the sample data points. For example, S u p p e r in Figure 1a may invoke the Algorithm 3, if it is larger than the pre-defined value P.
Algorithm 2. Calculation and comparison of Gap area
1. // Calculates the Gap area and compares the outcome with the inference threshold database values
2. function retrieveThresholdValue()
3.  P → find pre-defined threshold data from inference threshold database dbI
4.  Q → find pre-defined threshold data from inference threshold database dbI
5.  R → find pre-defined threshold data from inference threshold database dbI
6.  return P,Q,R
7. end function
8. function calculateGapArea(first,last)
9.   S u p p e r → calculateUppergapVolume(first,last)
10.     S l o w e r → calculateLowergapVolume(first,last)
11.     | S d i f f | S u p p e r     S l o w e r
12.     | S s u m | S u p p e r   +   S l o w e r
13.  return | S d i f f | , | S s u m |
14. end function
15. -----------------------------Algorithm 2 Logic------------------------------
16.  for i in 1 .. n-1 loop
17.   integer count1, count 2 // to keep the count of the Sample data points after the inference
18.       | S d i f f ( x y ) | , | S s u m ( x y ) | → CalculateGap(n, n+1)
19.   P → retrieveThresholdValue()
20.   count1 → counti
21.   if ( | S d i f f | > P ) or   (   | S s u m |   > Q )   then
22.    //if the gap difference or gap summation is larger than the pre-defined P and Q respectively
23.    call Algorithm 3
24.    call Algorithm 4
25.   end if
26.  end for loop
27. -----------------------------End of Algorithm 2 Logic--------------------
Step 3:
Algorithm 3 may add a data point to the existing sample data points, taken from the original data points set, to reduce the value of S in comparison to the value P. For example, data point (x) and data point (y) are added from the original data points set in Figure 1b. Algorithm 3 will be executed as a recursive pattern of comparing and adding new data points, until the S is less than the value P.
Algorithm 3. Adjustment of data points sample based on gap difference and summation
1. function adjustDataSample1( [ x , y ] )
2.  if ( x in SDO[ ] and y in SDO[ ] ) then
3.   until (   | S d i f f | <= P ) or ( | S s u m | <= Q) do loop
4.    add ( x , y ) data point in SDI[ ] from SDO[ ]
5.   end until
6.  end if
7. end function
8. -----------------------------Algorithm 3 Logic-----------------------------
9.  adjustDataSample1([x,y])
10.  count2 → Count I
11. -----------------------------End of Algorithm 3 Logic--------------------
Step 4:
Once Algorithm 3 completes the adjustment of the data points, it will compare the total number of data points before and after the adjustment. The comparison is done between a value R, which is a pre-defined threshold value, and a value, that is calculated by the difference of total count of data points before and after the adjustment divided by the total count of before adjustment data points. The comparison of the total number of data points with the pre-defined value (R) may initiate Algorithm 4.
Algorithm 4. Adjustment of data points sample based on total number of data points
1. function adjustDataSample2( w , [ a , b ] )
2.  remove ( a , b ) data point from SDI[ ]
3.  add ( w ) data point in SDI[ ] from SDO[ ]
4. end function
5. -----------------------------Algorithm 4 Logic-----------------------------
6.  if ( ( c o u n t 2     c o u n t 1 c o u n t 1 ) > R) then
7.   // compare the total number of data points between X & Y with before and after the sample adjustment
8.   adjustDataSample2(w, [a,b])
9. end if
10. -----------------------------End of Algorithm 4 Logic-----------------------------
Step 5:
Algorithm 4 compares the adjacent data points up to the metric of M from the said data point, and removes the original sample data point as required to improve efficiency. For example, existing data point (a) and data point (b) in Figure 1c are removed (deselected from the sample), and the new data point (w) is selected along with the recently added data point (x) and (y). Therefore, data point (a) and (b) will be removed from the sample data point set. In consequence, the total number of sample data points are not changed, i.e., (x) and (y) selected and (a) and (b) deselected from the group, whilst the gap area S has been significantly reduced for accuracy improvement.
We depict in Figure 3, the workflow for the implementation of our analysis of data sampling efficiency by adjusting data points in the data points sample based on the original data points.

4. Testing Results and Discussion

Subjects provided their written and informed consent in accordance with ethical clearance codes, e.g., the Australian National Statement on Ethical Conduct in Human Research [9]. Devices used are wearables (Fitbit Charge HR and Intel Basis Peak), Raspberry Pi (Raspberry Pi 2 Model B), PC, Smartphone (Samsung Note 4), and production servers (Fitbit) in the cloud. Data were retrieved from the cloud using a customized program developed by Maple Hill Software [10] for analysis.
Heart pulse rate was monitored over 90 min during walking exercises using a fitness tracker with fine and coarse inference level, with or without beacon sampling. Two subjects are used to collect heart rates with 2 devices each to avoid sensing errors. We observed sensors can omit detection of HR data in sensing due to misplacement of the device on the wrist. To complement the errors, each subject wore two devices in each wrist, and the results have been averaged for preprocessing.
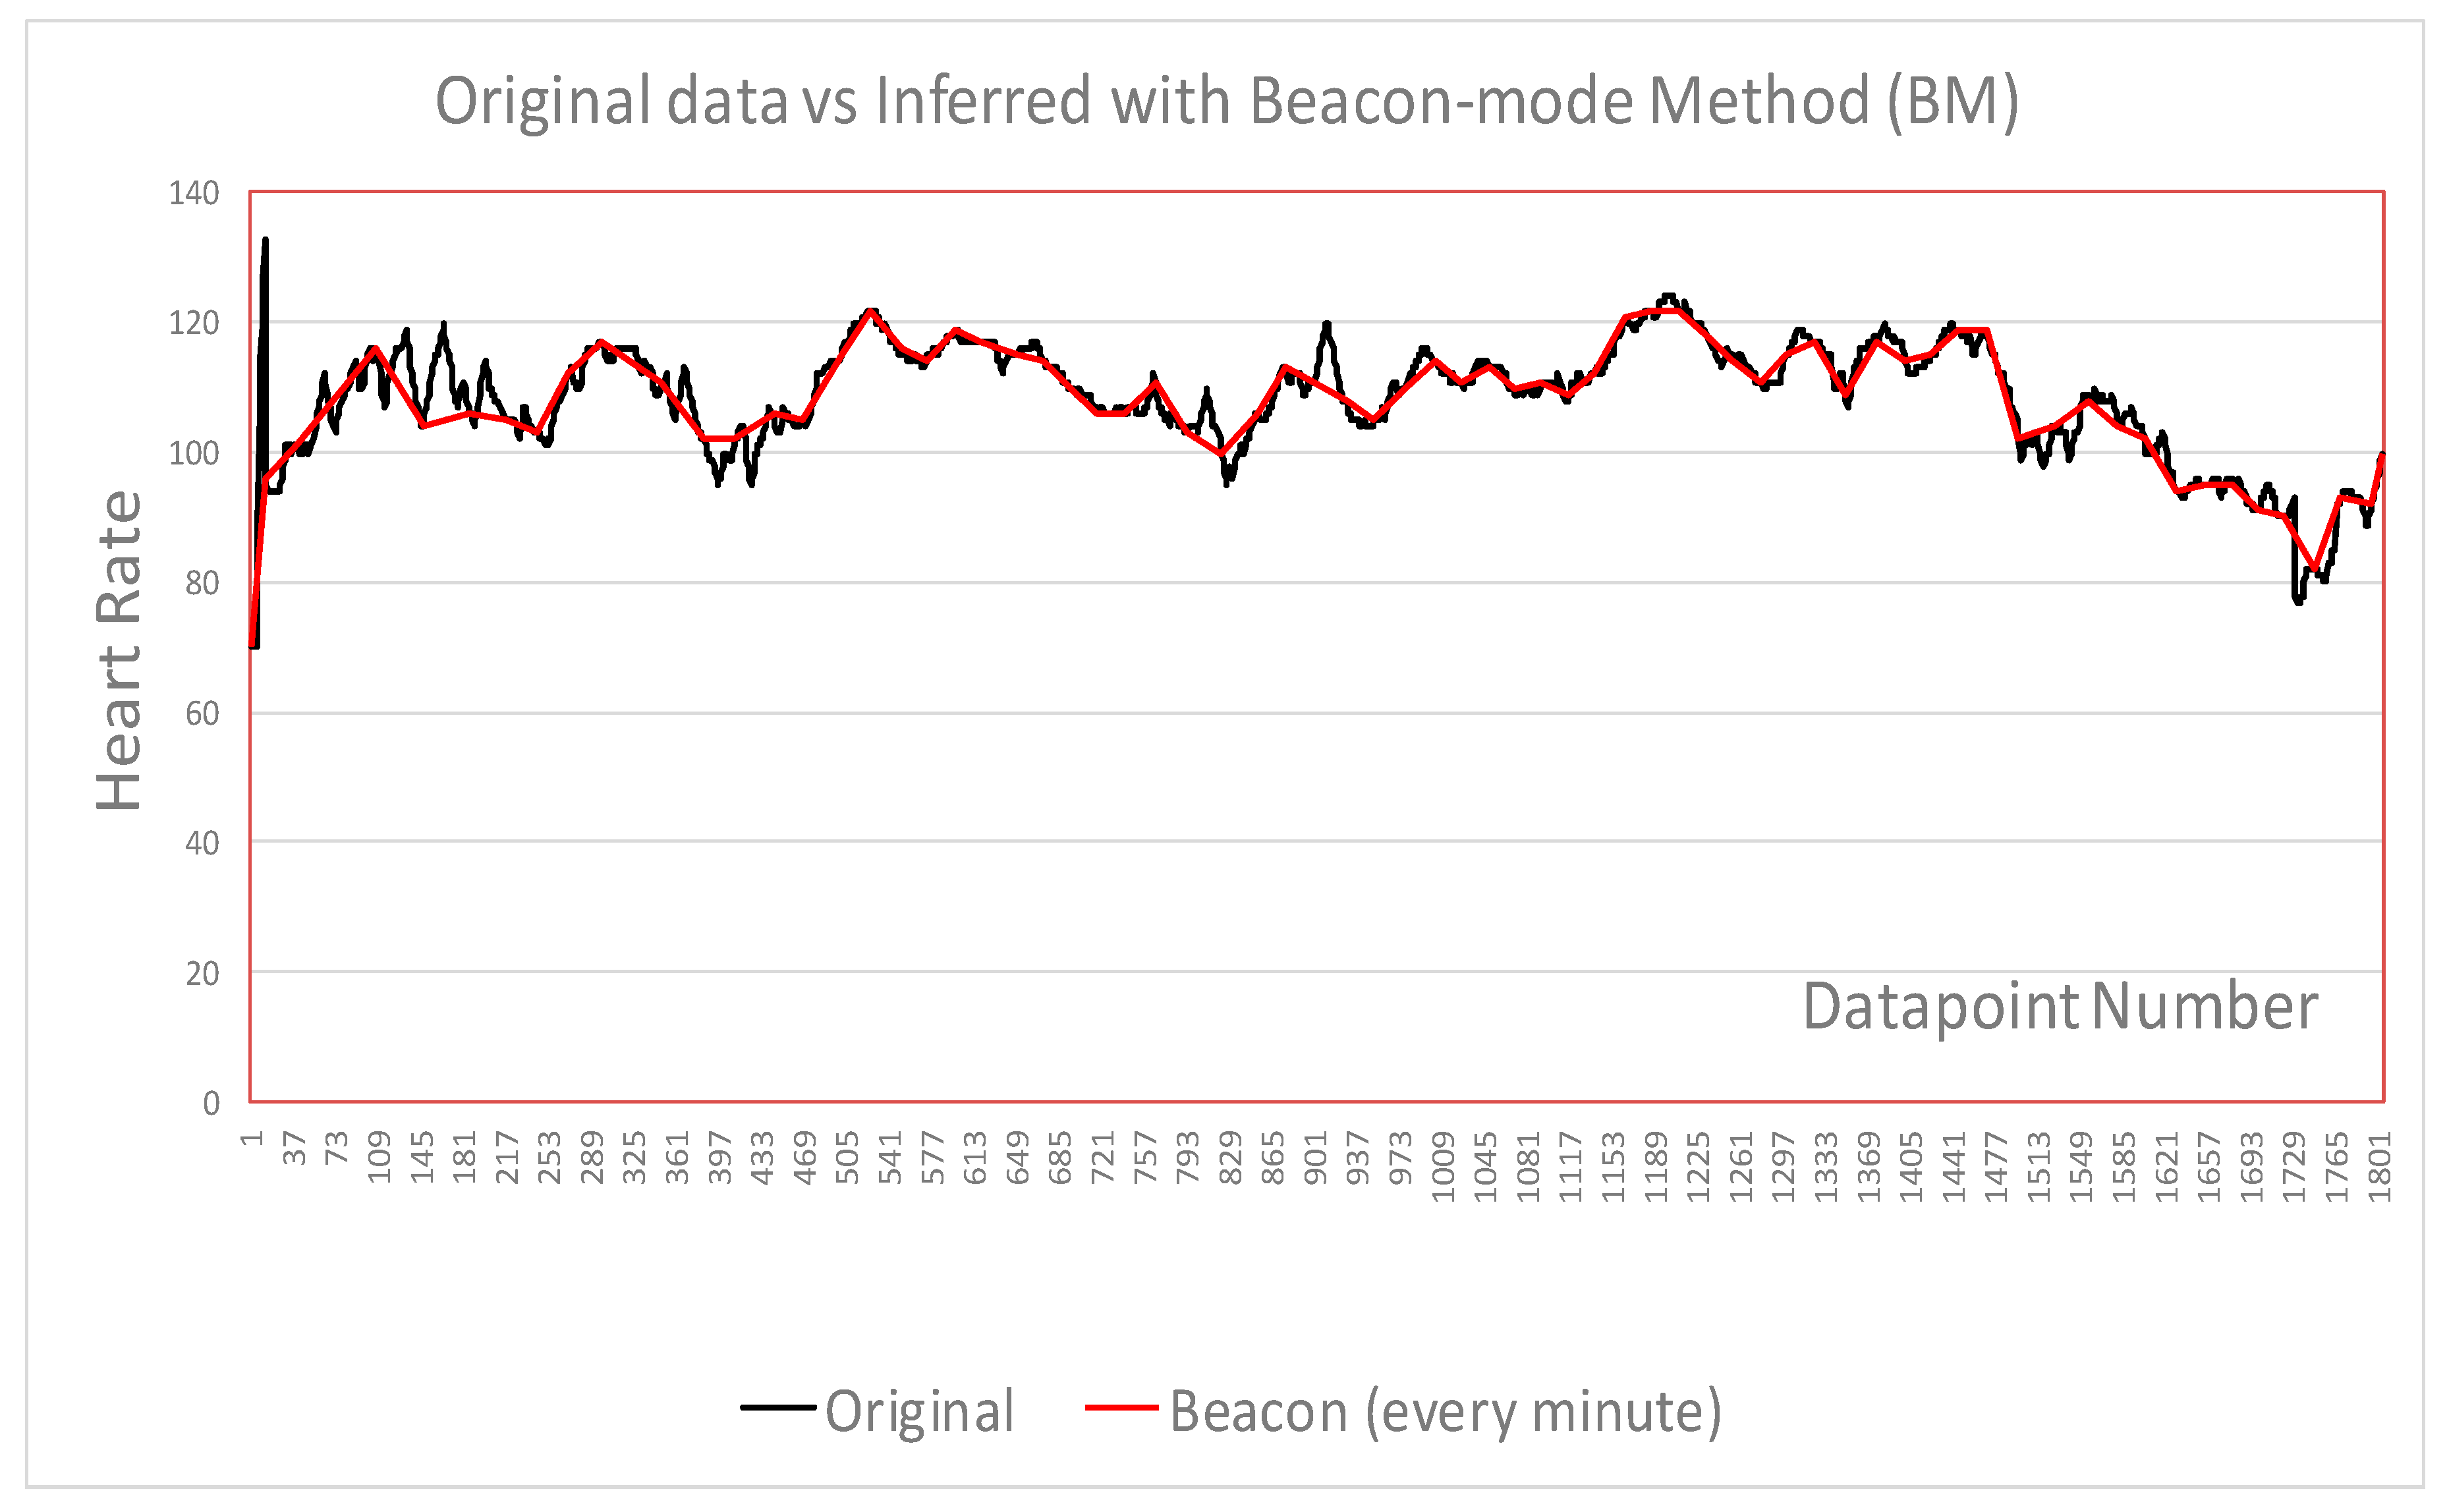
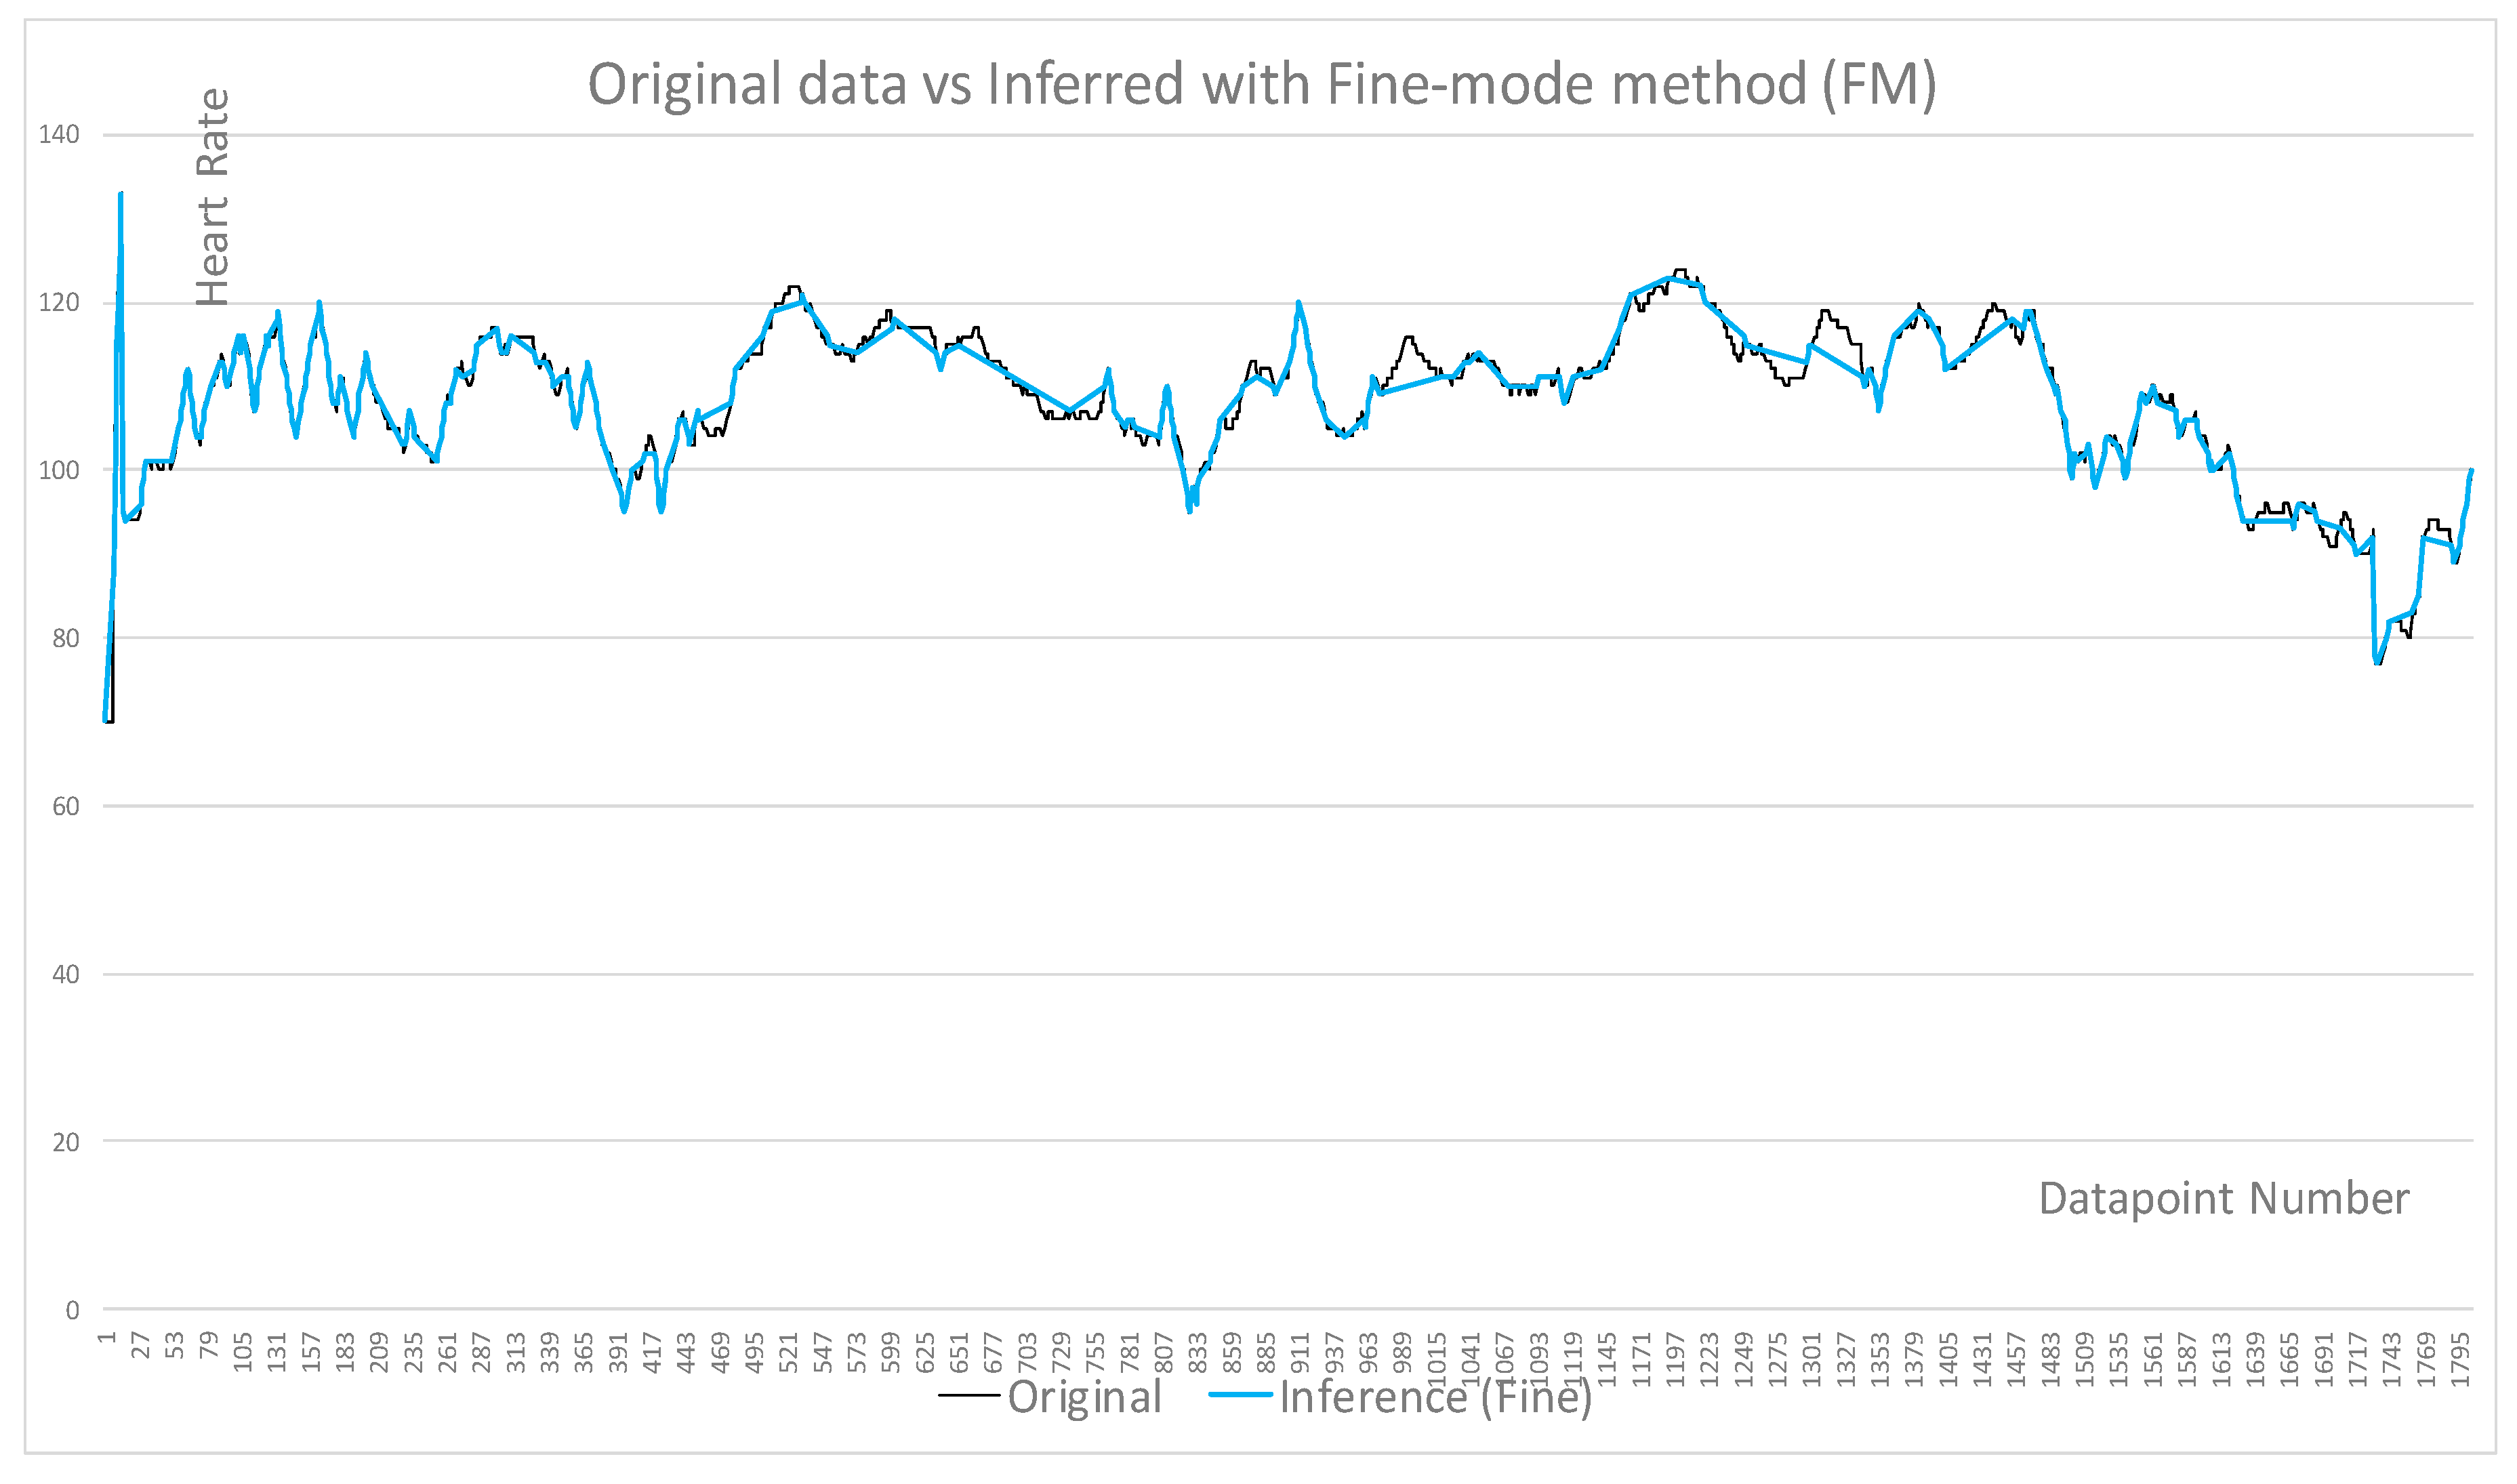
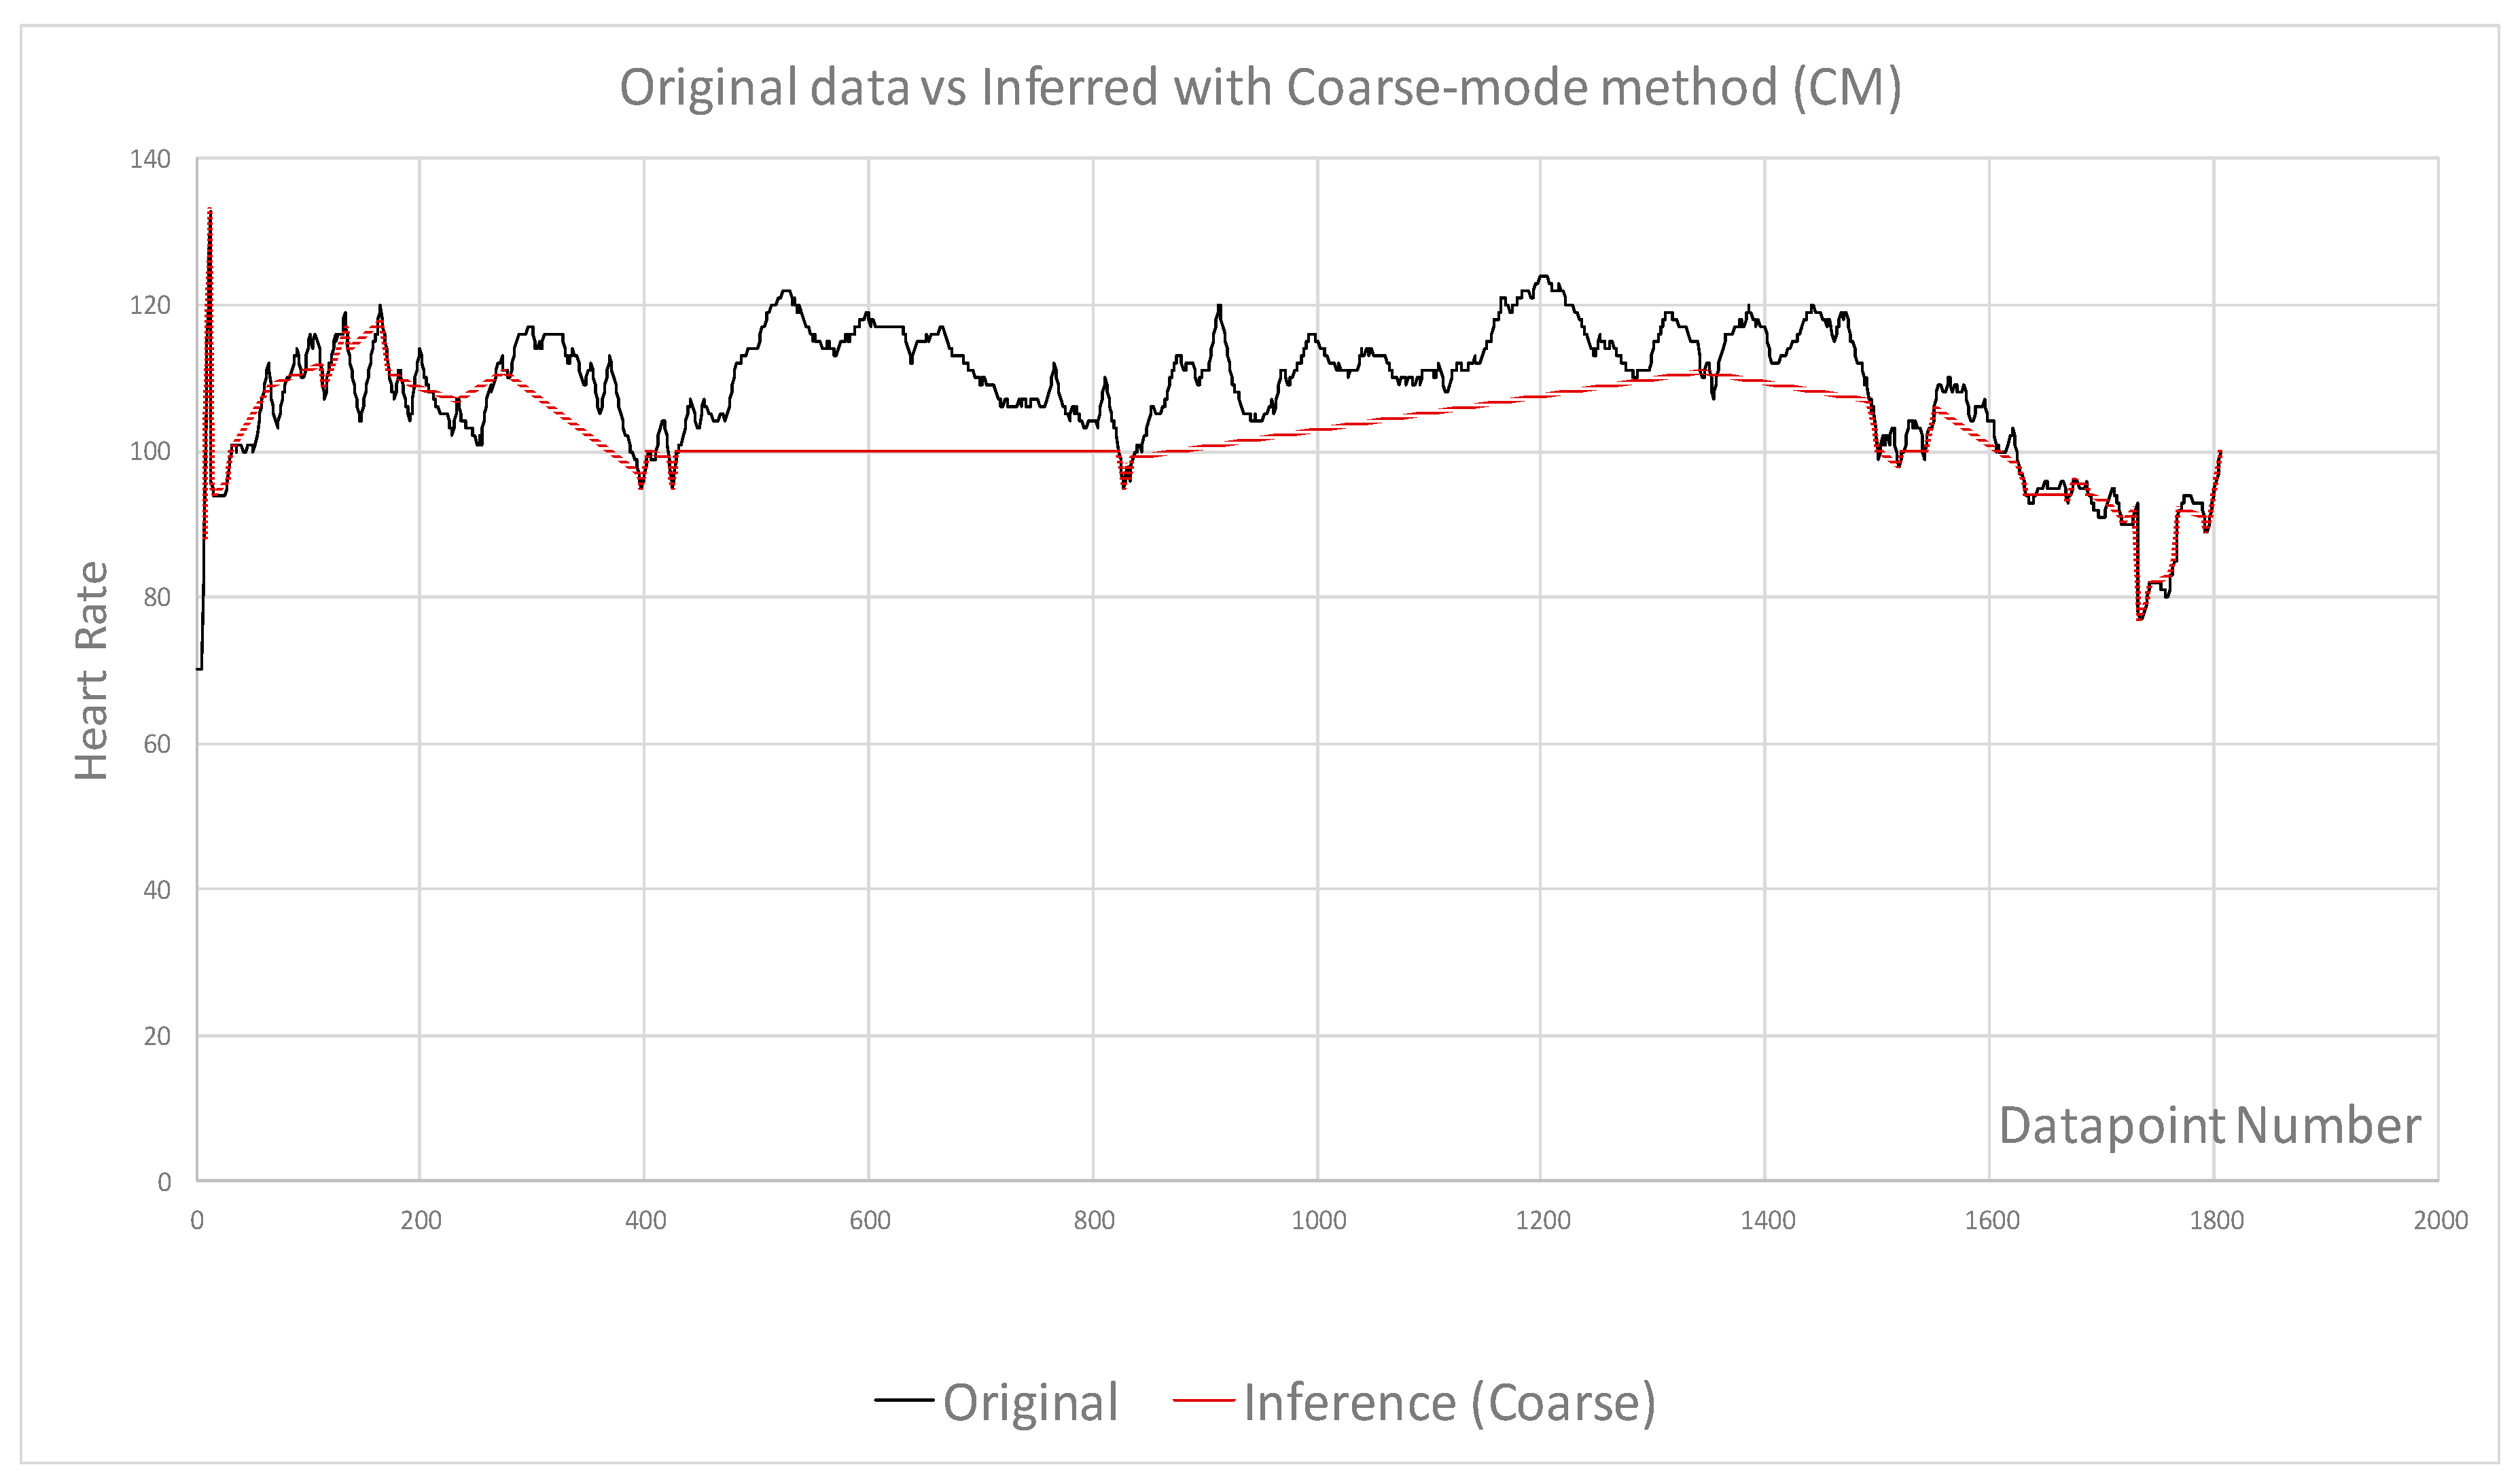
  • Original data points monitored over 90 min and selected 1800 data points as raw data. to be used for inferencing with algorithms to apply based on sensing every second
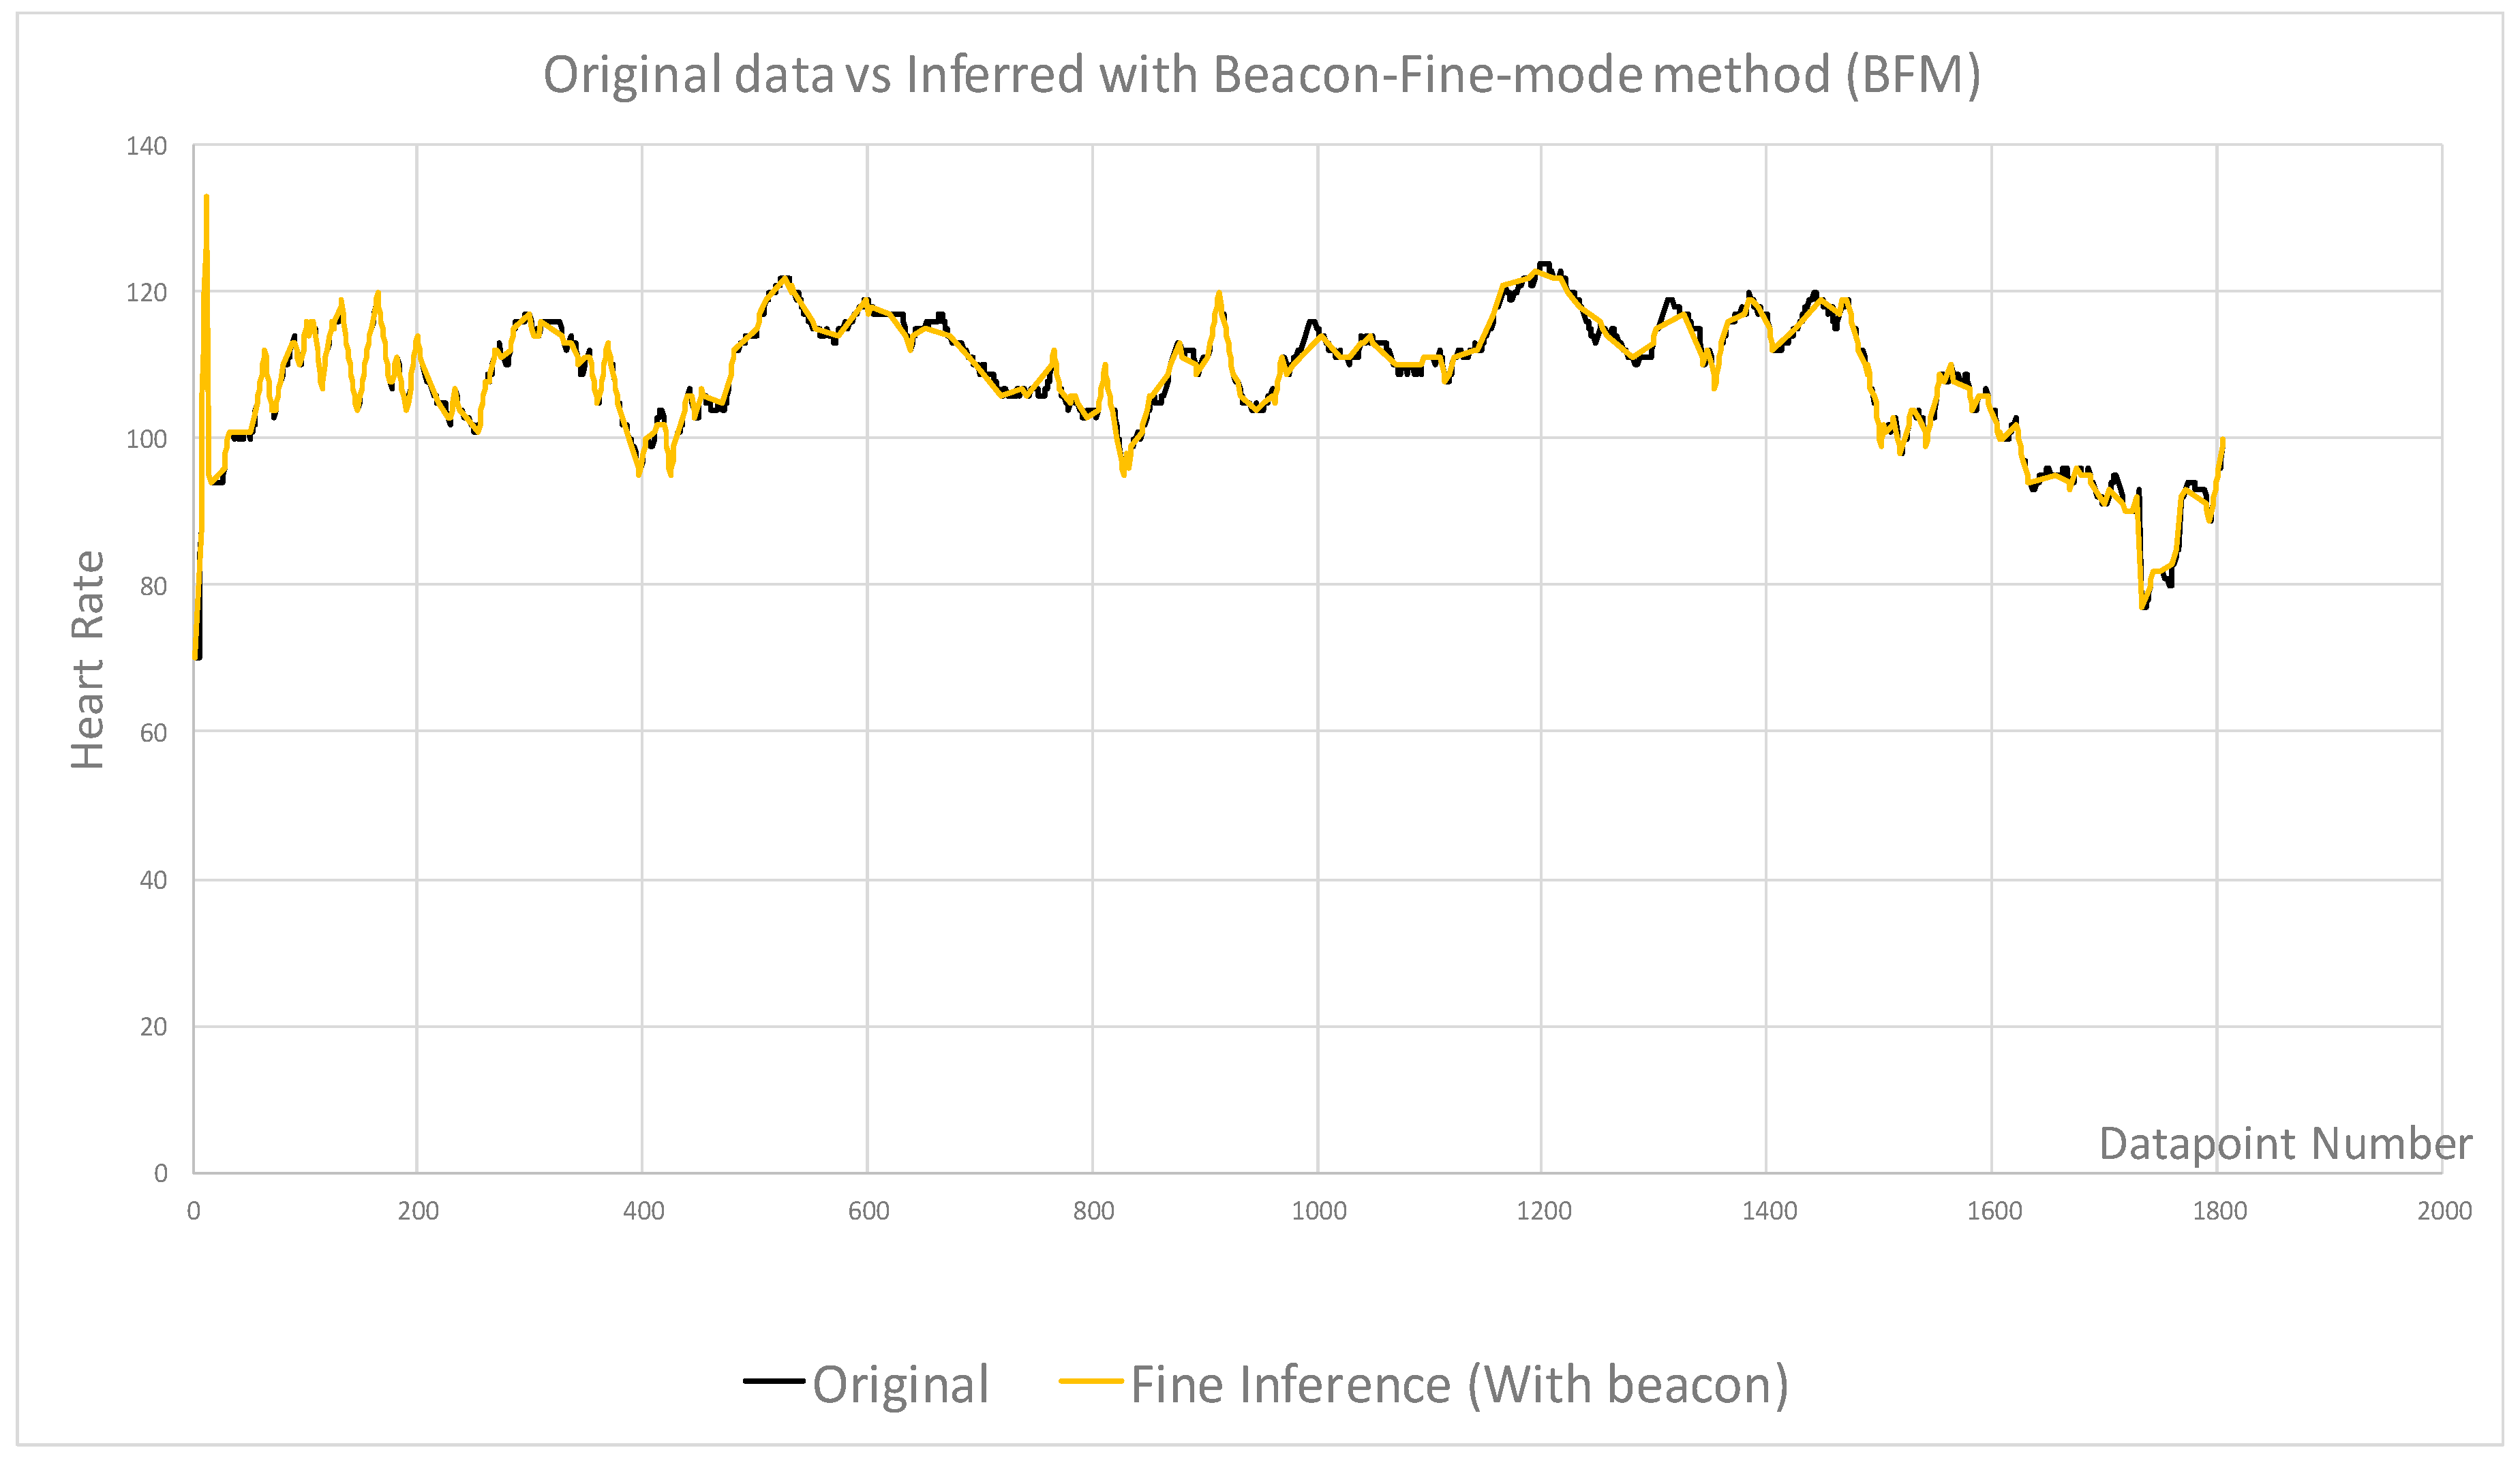
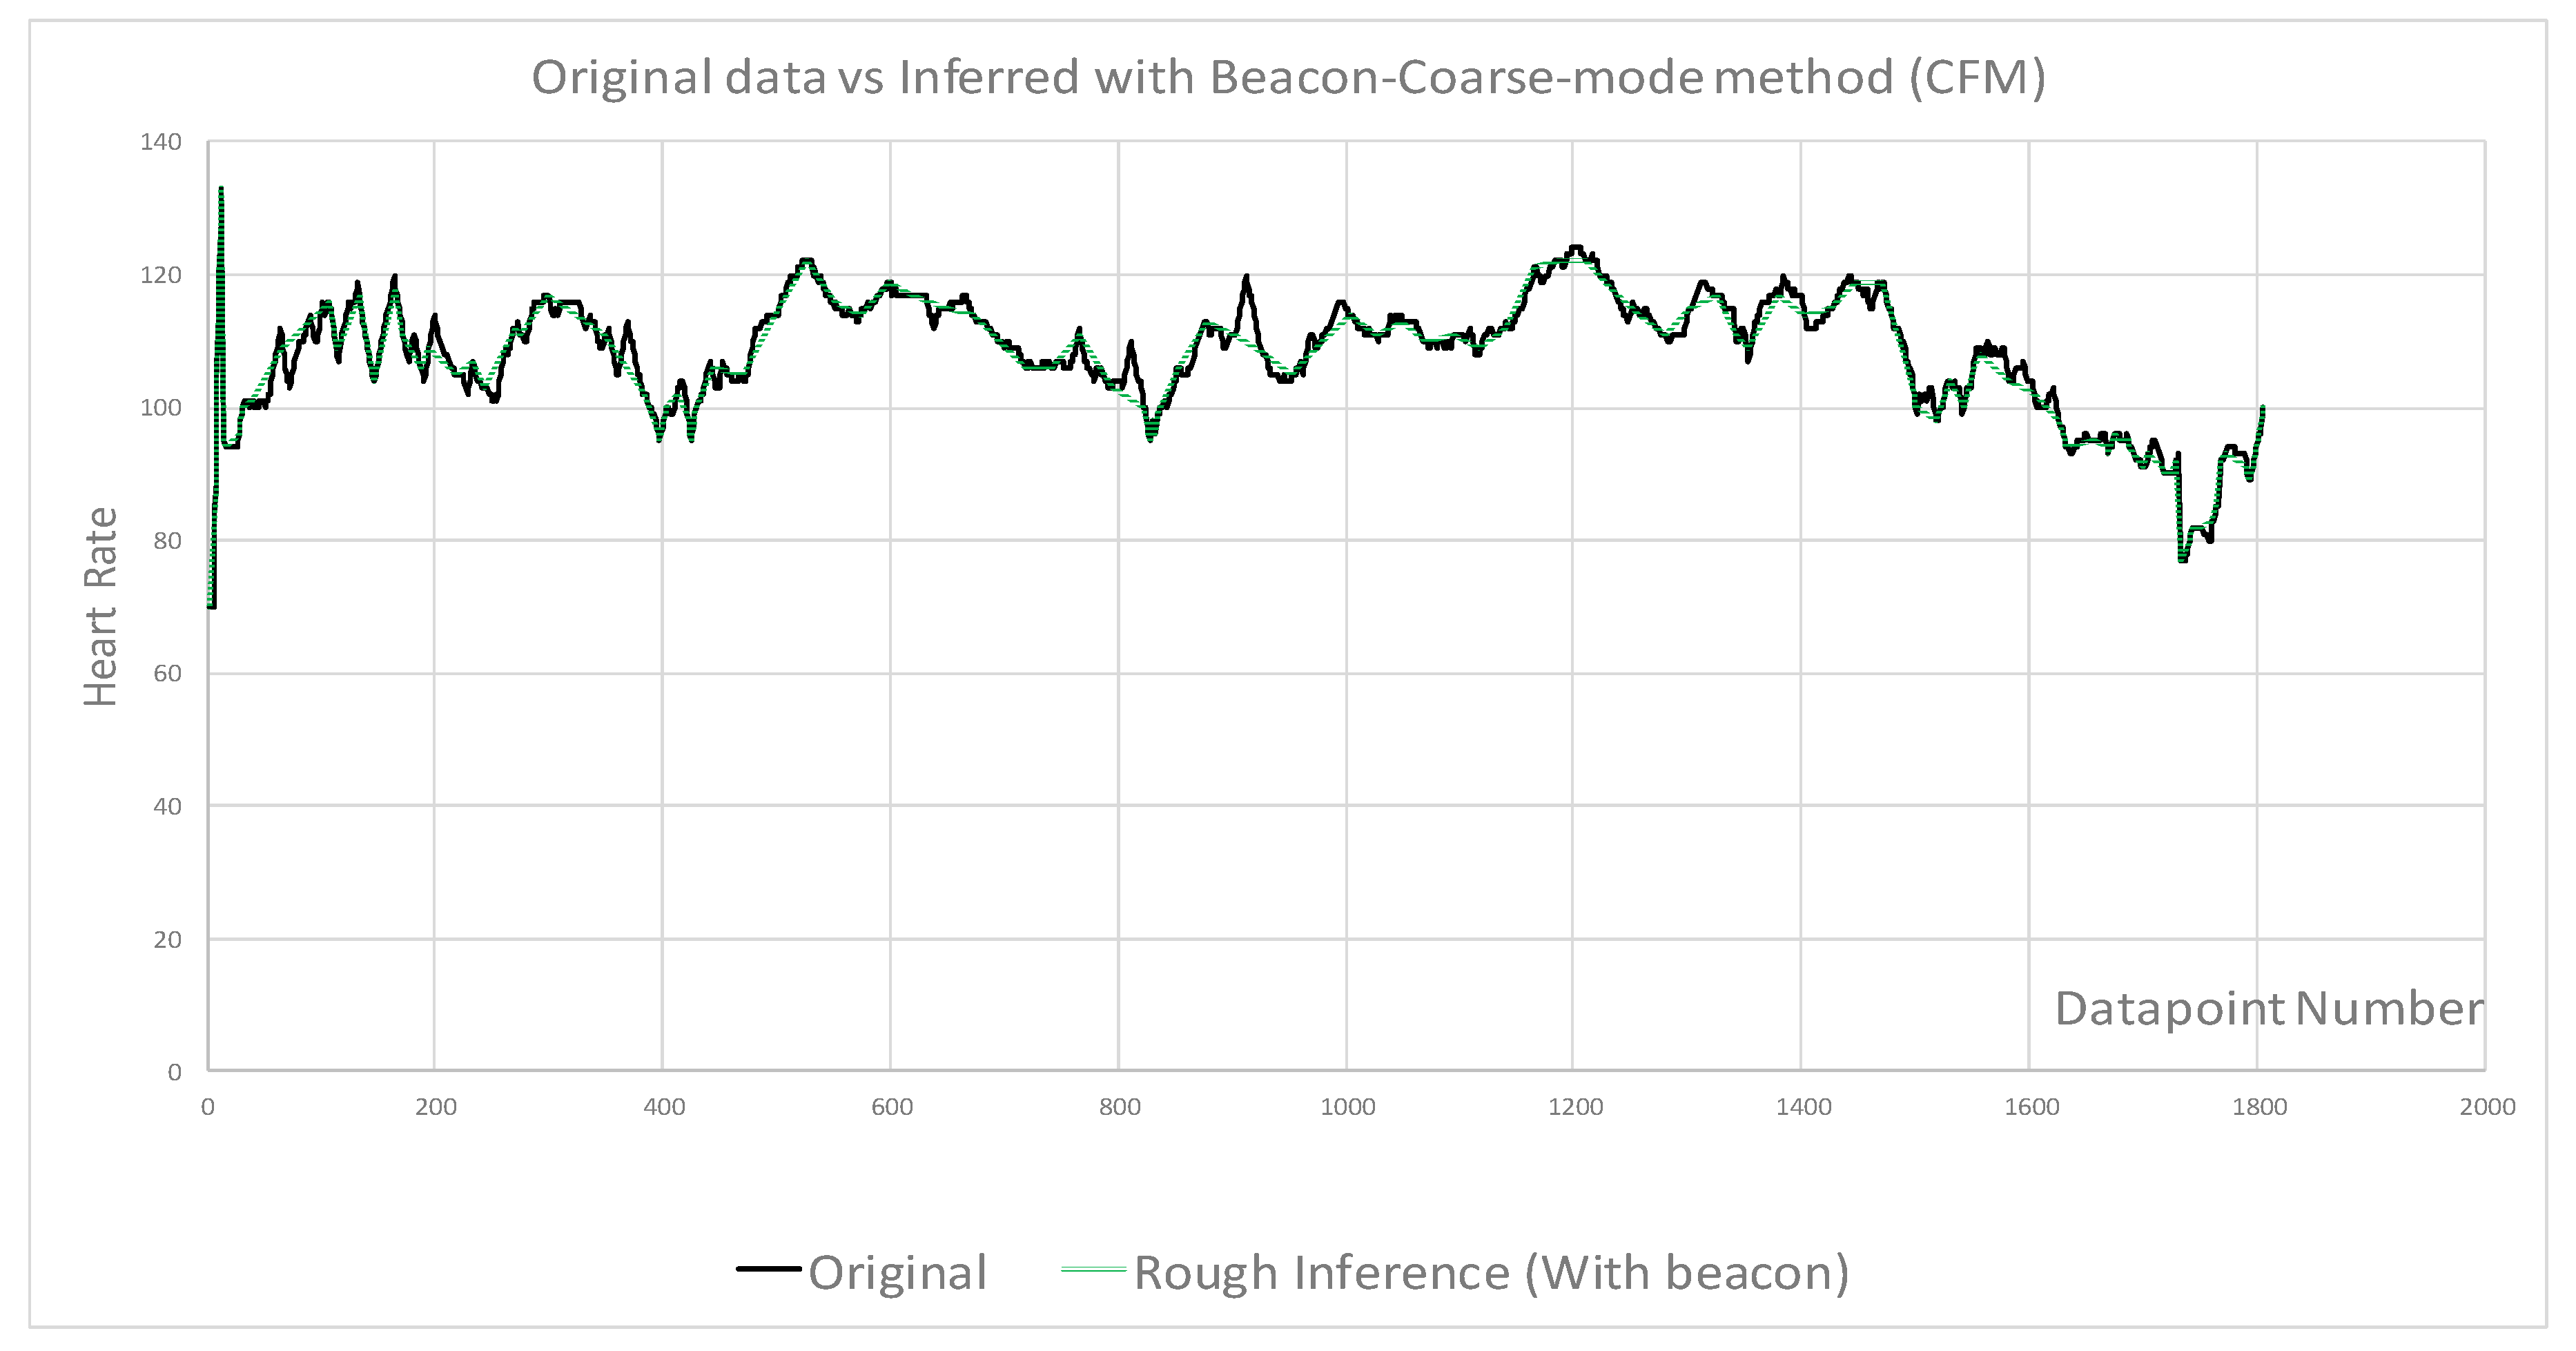
  • Beacon samples selected as baseline to compare with no beacon samples
  • Fine and coarse inference level were used to select samples
  • Beacon data points combined with fine and coarse samples for comparison
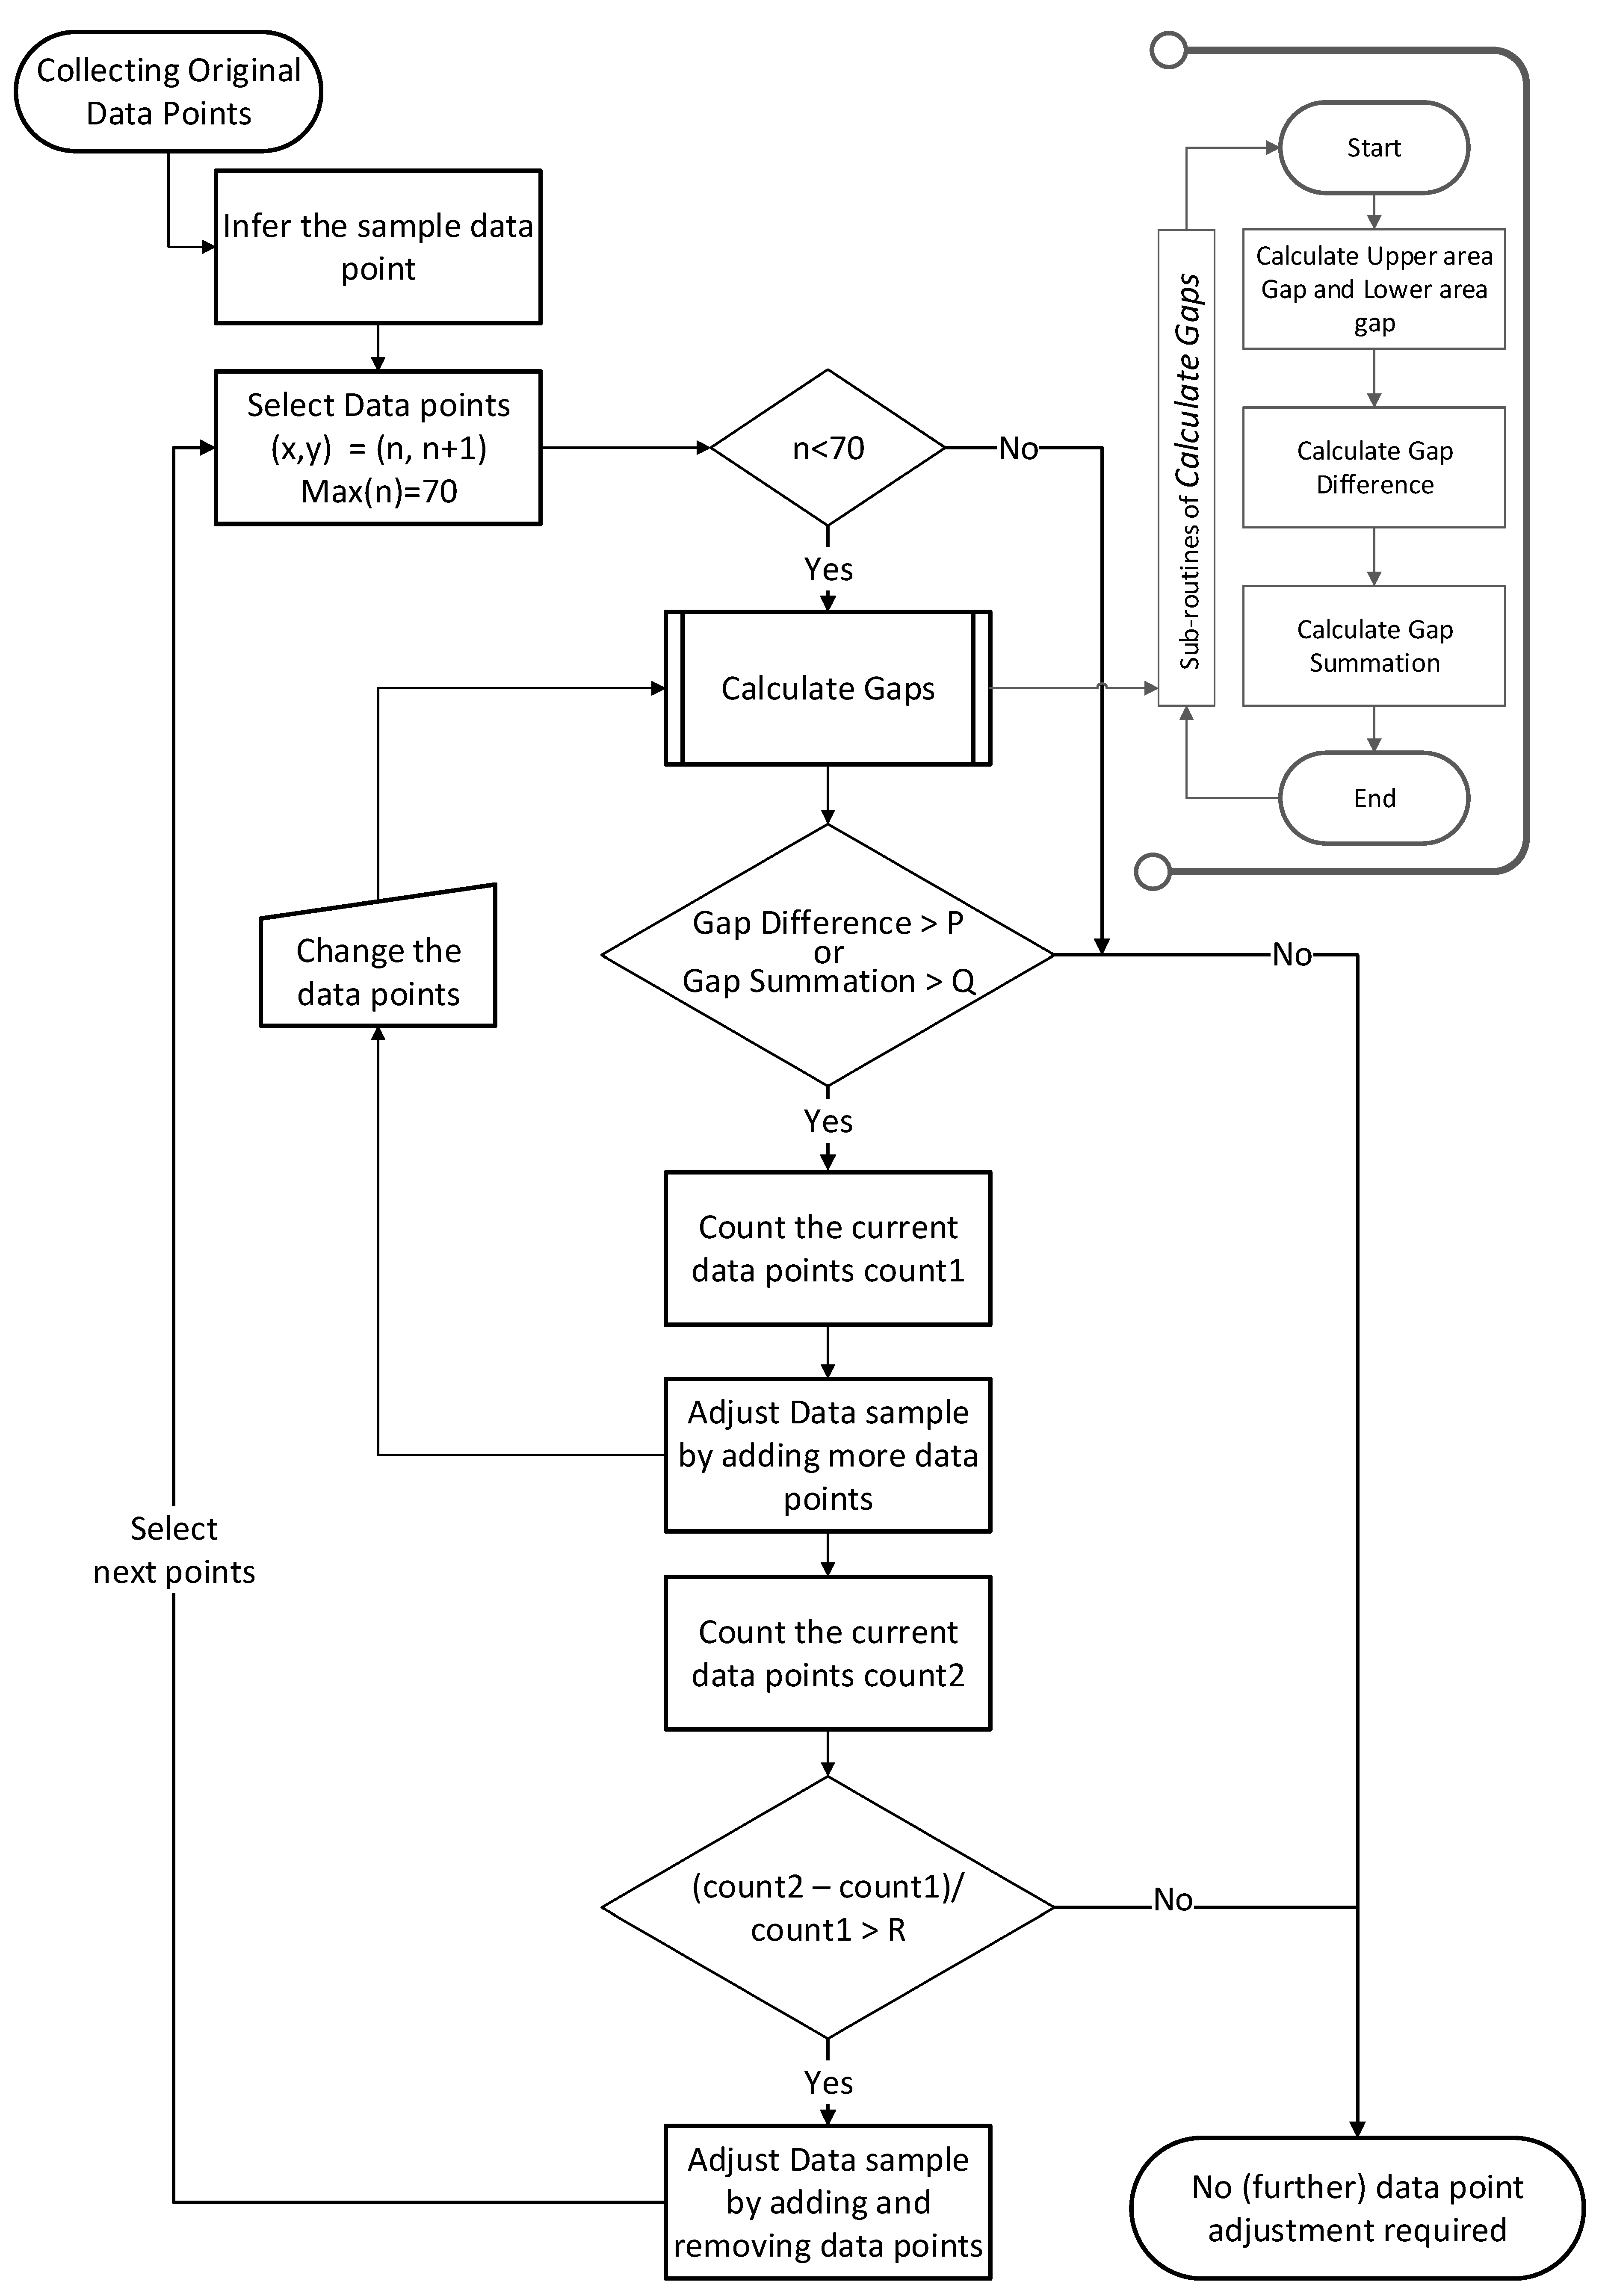
  • Algorithms 3 and 4 are applied to the original data for sampling with further adjustment.
The evaluation approach includes three aspects. Firstly, a coarse method (CM) of inference is used. In Figure 4, original data points sensed on a second basis resulted in 1800 data points, and every minute a sample is taken, which resulted in 70 data points. In Figure 5, the accuracy has been improved a lot with 99%, however the efficiency is very poor with 75.1% savings rate, which is not acceptable. To overcome the efficiency issue of FM method and accuracy issue of CM, a new method is used. It is simply to take samples in a regular interval, referred to as the beacon method (BM). As shown in Figure 6, accuracy is lower than other methods even though the efficiency is good. When the accuracy is less than the expected value, then a fine method (FM) is used to take samples. As shown in Table 2, the accuracy of BM is between FM and CM, with minimum number of samples taken showing the best efficiency.
In order to improve the accuracy in this case, a further hybrid method can be used by combining beacon and other methods. Figure 7 shows the beacon method combined with FM (BFM), which shows the best accuracy rate of 99.5%. CM can also be improved by combining with BM, i.e., beacon and coarse method (BCM), showing significant improvement in accuracy, as shown in Figure 8. In terms of efficiency, both FM and CM fail to show positive improvement, as both take many more data points for samples. As a result, it is concluded as below:
  • Accuracy trades off with efficiency
  • BM produces the best efficiency with a reasonable accuracy rate
  • Combining BM with other methods can improve the accuracy, however the efficiency will decrease
To achieve the best accuracy, BFM can be used with the least efficiency. The following shows the results of the inferencing algorithms applied to a raw dataset for heart rates with FM, CM, and BM, followed by the hybrid methods BFM and BCM.

5. Conclusions and Future Work

This work proposes a novel approach in the inferencing of data from body sensors, which can be used in various real-world applications, such as in health services, transport, smart cities, and various other IoT applications. With big data and convergence with the IoT network, extra demand is expected to overload body sensors with extra transactions and traffic. This paper has proposed a novel inference system that improved data accuracy with the aim of transmitting critical information for timely decision making. We demonstrated several sampling methods to find the optimal sampling data points. BM is a critical method to improve the efficiency, whilst it provides reasonable accuracy. We presented an algorithm in sampling data points for inference to increase the accuracy by adjusting sample data points by reselecting samples within the same (or less) number of samples. Initially, the algorithm adds more samples to increase the accuracy, then reassesses the samples and adjusts the total number of data points. Overall, our model achieved improved accuracy with negligible loss in efficiency.
As future works, we will implement a large scaled database environment to perform real-time evaluation, to automatically present the improvement in data accuracy and efficiency. This will also allow a customized approach, where users can request for expected accuracy and efficiency so that the system can produce the best optimized methodology for individual needs. When health data are collected and processed across heterogeneous networks, it requires compliance using a template, as well as defining data requested for certain applications. To achieve this, it is required to be able to send an automatic data request for immediate inquiries, including data integrity to inference in cloud storage to verify the integrity of a third party for security purposes [11,12,13], when an additional request should be sent out to all networks. We will implement and experiment to measure the network response time with accuracy in this case, as well as how accurately the proposed method can provide the best optimized data sampling at large scale using big data in the cloud server, which may be located in a centralized location, in the context of software defined network (SDN) infrastructure with fault tolerant mechanisms [14,15].
In the case of wide area networks across states and countries, data servers may be required in multiple networks with synchronization to minimize the access time from end users to the server. This may need further study to implement solutions such as SDN or software defined wide area networks (SDWAN). When the knowledge of past historical data is not accurate or is insufficient for processing, the data accuracy may not be enough for inferring, which may cause numerous false positives (FPs). To avoid this case, we will develop algorithms to infer the situation with previous history of accuracy and efficiency rates, to predict how much the algorithm can improve those aspects.

Author Contributions

J.J.K. conceived of the idea, reviewed related works, designed the solution and application, wrote the original draft, and reviewed and edited. K.F. wrote the algorithms and flowcharts. S.V. contributed to the overall quality of the article.

Funding

This research received no external funding.

Conflicts of Interest

The authors declare no conflict of interests.

References

  1. European Standardization Organization (CEN). SSCC-CG Final Report: Smart and Sustainable Cities and Communities Coordination Group; CEN-CENELEC: Brussels, Belgium, 2015. [Google Scholar]
  2. Brain, M. A Typical Mote—How Motes Work. Available online: http://computer.howstuffworks.com/mote4.htm (accessed on 24 December 2018).
  3. Konishi, T.; Kubo, T.; Watanabe, K.; Ikeda, K. Variational Bayesian Inference Algorithms for Infinite Relational Model of Network Data. IEEE Trans. Neural Netw. Learn. Syst. 2015, 26, 2176–2181. [Google Scholar] [CrossRef] [PubMed]
  4. Ma, F.; Liu, W.; Li, T. A Bayesian Inference Method under Data-Intensive Computing. In Proceedings of the 2012 International Conference on Computer Science and Service System, Nanjing, China, 11–13 August 2012; pp. 2017–2020. [Google Scholar]
  5. Zhang, W.; Dong, H.; Guo, G.; Yu, L. Distributed Sampled-Data Filtering for Sensor Networks with Nonuniform Sampling Periods. IEEE Trans. Ind. Inform. 2014, 10, 871–881. [Google Scholar] [CrossRef]
  6. Zhang, H.L.; Liu, J.; Li, T.; Xue, Y.; Xu, S.; Chen, J. Extracting sample data based on poisson distribution. In Proceedings of the 2017 International Conference on Machine Learning and Cybernetics (ICMLC), Ningbo, China, 9–12 July 2017; pp. 374–378. [Google Scholar]
  7. Kang, J. An Inference System Framework for Personal Sensor Devices in Mobile Health and Internet of Things Networks. Ph.D. Thesis, School of IT, Deakin University, Burwood, Australia, 2017; p. 275. [Google Scholar]
  8. Kang, J.J.; Larkin, H.; Luan, T.H. Enhancement of Sensor Data Transmission by Inference and Efficient Data Processing. In Applications and Techniques in Information Security; Batten, L., Li, G., Eds.; Springer: Singapore, 2016; pp. 81–92. [Google Scholar]
  9. NHMRC: National Statement on Ethical Conduct in Human Research (2007)—Updated 2018; Australian Government National Health and Medical Research Council: Canberra, Australia, 2018.
  10. Nielsen, R. Parse Heart Rate 2016. Available online: http://www.mhsoft.com/home.html (accessed on 24 December 2018).
  11. Mazumdar, S. From data integrity to inference integrity. In Proceedings of the 2017 2nd International Conference on Telecommunication and Networks (TEL-NET), Noida, India, 10–11 August 2017; p. 1. [Google Scholar]
  12. Chen, Y.; Li, L.; Chen, Z. An Approach to Verifying Data Integrity for Cloud Storage. In Proceedings of the 2017 13th International Conference on Computational Intelligence and Security (CIS), Hong Kong, China, 15–18 December 2017; pp. 582–585. [Google Scholar]
  13. Hiremath, S.; Kunte, S. A novel data auditing approach to achieve data privacy and data integrity in cloud computing. In Proceedings of the 2017 International Conference on Electrical, Electronics, Communication, Computer, and Optimization Techniques (ICEECCOT), Mysuru, India, 15–16 December 2017; pp. 306–310. [Google Scholar]
  14. Shah, S.A.R.; Sangwook, B.; Jaikar, A.; Seo-Young, N. An adaptive load monitoring solution for logically centralized SDN controller. In Proceedings of the 2016 18th Asia-Pacific Network Operations and Management Symposium (APNOMS), Kanazawa, Japan, 5–7 October 2016; pp. 1–6. [Google Scholar]
  15. Sidki, L.; Ben-Shimol, Y.; Sadovski, A. Fault tolerant mechanisms for SDN controllers. In Proceedings of the 2016 IEEE Conference on Network Function Virtualization and Software Defined Networks (NFV-SDN), Palo Alto, CA, USA, 7–10 November 2016; pp. 173–178. [Google Scholar]
Figure 1. Difference of original and inferred value with gaps (a) and adjusted sampling data point to improve the accuracy (b). This can be improved with further adjustment to compensate for efficiency by matching the data points samples (c).
Bdcc 03 00007 g001
Figure 2. Flowchart of Algorithm 1, which takes samples based on pre-defined fine-mode method (FM) and coarse-mode method (CM) threshold values against neighboring data points.
Bdcc 03 00007 g002
Figure 3. Workflow of adjusting data sampling flowchart.
Bdcc 03 00007 g003
Figure 4. Original data points versus Beacon-mode method (BM) applied for inference (original DP: 1800, 70 beacons). Sensed data every second, and beacon sampled every minute.
Bdcc 03 00007 g004
Figure 5. Original data points versus Fine-mode method (FM) applied for inference (original DP: 1800, inferred DP: 449).
Bdcc 03 00007 g005
Figure 6. Original data points versus Coarse-mode method (CM) applied for inference (original DP: 1800, inferred DP: 139). Data are distorted considerably without beacons.
Bdcc 03 00007 g006
Figure 7. Original data points versus Beacon-Fine-mode method (BFM) applied for inference (original DP: 1800, inferred DP: 496). It has the greatest number of DPs, however, provides the best accuracy rate, representing the best outcome of the original DPs.
Bdcc 03 00007 g007
Figure 8. Original data points versus Beacon-Coarse-mode method (BCM) applied for inference (original DP: 1800, inferred DP: 202). Beacons improve accuracy significantly, as compared to without beacons.
Bdcc 03 00007 g008
Table 1. Definitions of denotation
c o u n t ONumber of original sample data
c o u n t IThe total number of sample data after each adjustment in the sample data
dbI Inference Database
DPre-defined value for distance to neighbor data point
GGap between X and its neighboring data point value
KThreshold value of FM and CM
NTotal number of original data points. According to the Figure 4, N = Total number of DP
nTotal number of sampling data points. According to the Figure 4, n = Total number of Inferred DP
PPre-defined threshold data for decision making in comparison with gap difference
QPre-defined threshold data for decision making in comparison with gap summation
RPre-defined threshold data for decision making
S D I [   ] Collection of sample data after inference
S D O [   ] Collection of original sample data
S u p p e r 
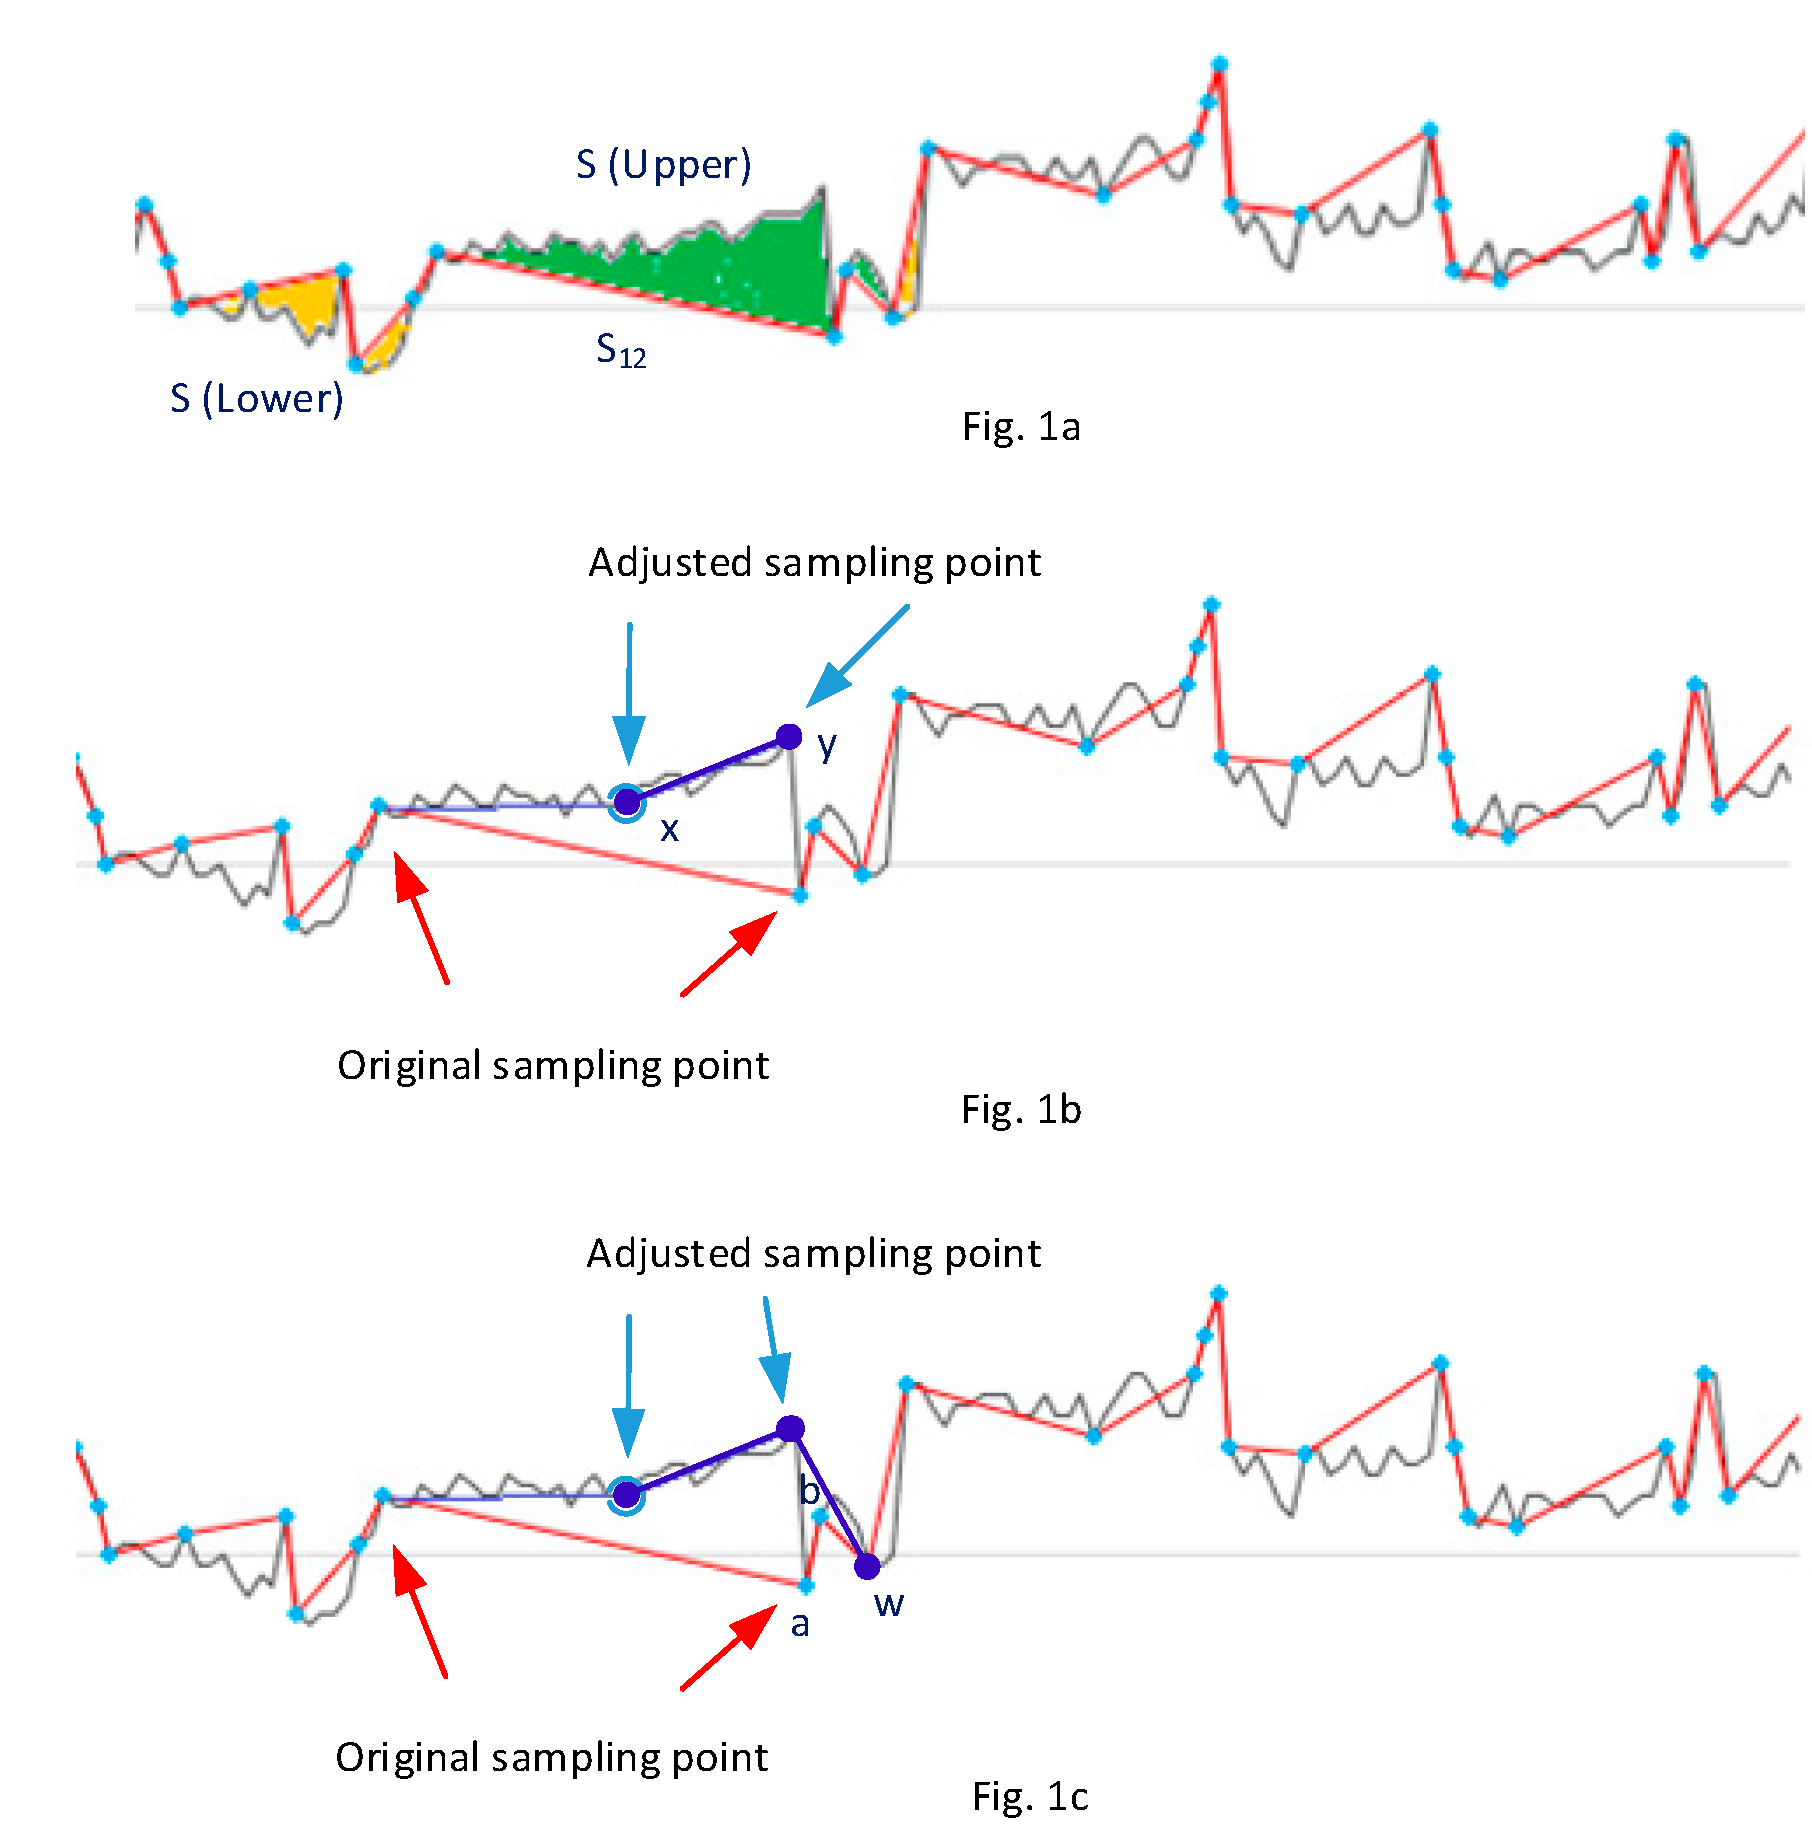
The upper gap after inference has been applied for the first and last data point (x and y)
S l o w e r The lower gap after inference has been applied for the first and last data point
| S d i f f   | Absolute value of difference between the original and inferred gap for the first and last data point
| S s u m | Absolute value of summation of original and inferred gap for the first and last data point
[ x , y ] Data points to be added to SD I from SD O
XCurrent selected Data points to be compared for gaps
[ ( a , b ) ] Data point to be removed from SD I
Table 2. Summary of samples and inference results. Efficiency rate is not shown in this table as it can be calculated from Savings rate. Beacon fine-mode method (BFM), Beacon coarse-mode method (BCM)
Variance RateOriginalBMFMCMBFMBCM
Data points180070449139496202
Savings (%)n/a96.075.192.172.388.5
Efficiencyn/a24.3311.92.67.91
Accuracy (%)n/a97.599.094.199.598.3
FiguresFigure 4Figure 4Figure 5Figure 6Figure 7Figure 8

