1. Introduction
A smart grid (SG) is a pervasive network of densely distributed energy and resource-limited wireless things (e.g., smart devices), all capable of gathering and transferring in real-time large volumes of heterogeneous environmental data. However, due to the current energy computing bandwidth limitations of the wireless domain, to date, a system of this complexity has been unfeasible [
1]. Through the notion of Internet of Things (IoT), the future Internet is bringing SG machines, devices, and sensors connected to the internet [
2,
3]. By interconnecting the machines with the Internet they become smart, with the ability to react and make decisions on their own. IoT devices are connecting wirelessly or directly through network switches and devices. Many of the devices have closed interfaces that make it hard to extract information. Some devices are old, some are new, and all of them communicate with different protocols, thus give rise to interoperability issues. With machines and sensors recording data in real time every second or minute, the amount of data can be massive. Latency can be a big issue when real-time decisions need to be made [
2,
4,
5,
6,
7]. When multiplied by hundreds of machines across multiple plants the amount of data can be too much for the network to handle when it finally reaches the cloud data center. Finally, trying so many machines and devices together means exorbitant customization costs. In such circumstances, reaching a consensus on where to install the compute and storage resources becomes a critical research thrust for the academia, industries, R&D, and legislative bodies [
8]. The centralized cloud computing (CC) model, though having virtually unlimited resource pooling capabilities, ceases to welcome its proponents because of its failure in building common and multipurpose platform that can provide feasible solutions to the mission critical requirements of an IoT-aided SG [
9].
Fog computing (FC) is a distributed computing framework installed on the intermediary network switches, devices sensors and machines to eliminate the connectivity, bandwidth, and latency issues prevalent in CC. FC is a natural extension of CC and is foreseen as a remedy to alleviate such issues [
10]. Both these platforms complement each other to form a mutually beneficial and interdependent service continuum between the Cloud and the endpoints to make computing, storage, control, and communication possible anywhere along the continuum. A robust FC-based SG topology will allow dynamic augmentation of associated Fog Computing Nodes (FCN), thus rejuvenating the elasticity and scalability profiles of mission critical SG requirements. The objective of FC is to standardize and ensure secure communication between all devices, SG components, old and new, across all vendors, so that customization and service costs are kept to a minimum. The FCNs are placed on or between devices and the cloud. The notion is to allow machines to speak directly to each other without going through cloud by connecting machines, devices and sensors directly to each other (at only one or few steps) enabling real-time decisions to be made without transmitting vast amount of data through the cloud. The FC objective is also to connect all devices to the cloud with open communication standards [
11]. The result is a smart network of devices that are able to make decisions themselves and react in real-time to a changing environment or supply chain such as SG. Further it will facilitate the following.
- (a)
Make electric utilities smarter.
- (b)
Help accelerate the transformation of cities into smart cities.
- (c)
Accelerate industries into smart manufacturing.
- (d)
Make SG logistics even more efficient, and many more.
Since the FC elements are heterogeneous and resource constrained, proper orchestration among them is very essential to attain a near optimal performance. Moreover, the workload allocation in FC should be performed so that the resource utilization rate is maximized. In other words, for efficient execution of FC, the resources should be provisioned to guarantee an optimal balance of attributes defining architectural Quality-of-Service (QoS) (e.g., power consumption, carbon footprint, etc.) and Quality-of-Experience (QoE) (near real-time response) of user. As the FCNs exhibit diverse cost profiles, it is necessary to have an optimal user-to-FCN association such that the corresponding upload latency is minimized. Also, the number of successful connections is limited by the number of bandwidth units (BU) or computational resource blocks (CRBs) available at each FCN. For each workload to be allocated, finding a proper set of FCNs to host the virtual machines (VMs) for each application is also a key issue to cost minimization. Therefore, in this paper, we are motivated to investigate the QoS guaranteed minimum cost resource management problem in fog enabled SG architectures. The key contributions of this paper are as follows.
We synoptically revisit the current state of cloud based SG. Correspondingly, we also examine how the Fog Computing (FC) models can serve as an ally to cloud computing platforms and how far an optimal mix of both computation models will successfully satisfy the high assurance and mission critical computing needs of SG.
We present a three layer architecture of fog-based SG describing the composition and working of each layer.
We present a mathematical framework for defining the cost profiles in both cloud and fog-based execution. Successively, a cost-efficient optimization framework for cumulative assessment of user to Fog Computing Node (FCN) association, workload allocation, and VM placement constraints, is proposed towards viable deployment of FC.
The model is then solved using Modified Differential Evolution (MDE) algorithm for comprehensive cost comparison of FC (Fog-assisted cloud) over generic cloud computing techniques, through metrics such as latency cost, power consumption cost.
The rest of the paper is organized as follows. In
Section 2, works related to fog computing in SG and workload allocation in FC are presented.
Section 3 presents the theoretical background of FC in SG infrastructures. In
Section 4, simulations and algorithmic setup are presented to solve the proposed optimization model. Results and discussions are presented in
Section 5.
Section 6 concludes the manuscript by providing insights, challenges and future prospects or FC-based sustainable SG deployments.
3. Theoretical Background
The FC framework will potentially abridge the silos between personalized and batch analytics in SG informatics. The FC is an architectural setup for federated as well as distributed processing where application specific logic is embedded not only in remote clouds or edge systems, but also across the intermediary infrastructure components. A robust fog topology allows dynamic augmentation of associated fog nodes thereby improving the elasticity and scalability profiles of mission critical infrastructures. In this section we first examine the use of FC in the context of SG applications. In the next subsection we present a three-layer architecture of fog-based SG describing the composition and working of each layer. We also present the networking model and optimization framework for defining the cost profiles in both cloud and fog-based execution.
3.1. Smart Grid as Use-Case for Fog Computing
In this section, we outline the FC paradigm and examine its preeminence over the cloud computing in SG context. We highlight some key SG characteristics that motivate the analytics utilities to relinquish the current cloud adoption and opt for analytics at the edges of the SG networks.
3.1.1. Decentralization and Low Latency Analytics
The data generation and consumption sites of SG entities and stakeholders are sparsely distributed all over the SG network. The centralized cloud model succumbs to serve as the optimal strategy for SG applications that are geographically distributed. For instance, together with a centralized control, the sensor and actuator nodes deployed across the smart home or Electric Vehicle (EV) infrastructures also require geo-distributed intelligence. The domain of information transparency may need to be extended from mere Supervisory Control and Data Acquisition (SCADA) systems to a scale that ensures national level visibility. However, since majority of the SG services are consumer centric, they demand location aware analytics to be performed closer to the source of the data.
The contemporary cloud infrastructures pose serious latency issues for power applications operated by real-time decisions. For instance, the SCADA system employed in a modern data driven SG is so timed that it may produce glitches when operated over ubiquitous TCP/IP protocols. Fortunately, the FC is there to harness the store and compute resources latent in the underutilized SG resources such as vehicles [
31,
32], gateways, PMUs, etc. [
11]. The fog model complements the cloud computations with dedicated and ad hoc computational resources [
33], to be performed on the edge nodes of an IoT-aided SG thereby reducing the networking latency.
3.1.2. Limited Resource Distribution for Individual IoT Endpoints
Compared to mega servers in cloud computing, each individual IoT devices such as sensors and actuators have limited store and process capabilities. The front end mobile devices may fail to perform complex SG analytics due to hardware restrictions such as draining of battery, or other middleware limitations. Often the data needs to be sent to cloud to meet the processing demands and meaningful information is then relayed back to the front end [
34]. However, if carefully designed, such resource scraps may be aggregated and utilized for dedicated purposes. Think of a smart vehicle having limited processing and storage resources, thanks to the parked vehicular cases where these underutilized resources can be aggregated, utilized to perform alluring services such as Internet of Vehicles (IoV), Social Internet of Vehicles (SIoV), infotainment services, etc. Moreover, for many of the SG use-cases, not all data from a front end device will need to be used by the service to construct analytical workloads on the cloud. Potentially, data can be filtered or even analyzed at such fog nodes equipped with spare computational resources, to accommodate data management and analytics tasks.
3.1.3. Energy Consumption of Cloud Data Centers
The energy consumption in mega data centers is likely to get tripled in in coming decade. Adopting energy aware strategies becomes an earnest need for SG utilities. Offloading the whole of smart grid applications into the cloud data centers causes untenable energy demands, a challenge that can be alleviated by adopting sensible energy management strategies. There are plenty of SG applications that can be run without significant energy implications [
35]. For such trivial services, instead of overloading data centers, the analytics can be made ready at SG fog nodes such as RTUs, SCADA systems, roadside units (RSU), base stations, and network gateways.
3.1.4. Handling Data Deluge and Network Traffic
The population IoT endpoints in SG architectures is growing at an enormous rate, as can be discovered from the smart meter installation landscape in [
36]. As an illustration, consider a smart meter that is reporting data at frequency four times per hour. It will generate 400 MB of data a year. Thus, a utility serving AMI to a million customers will generate 400 TB of data a year. In 2012, BNEF predicted 680 million smart meter installations globally by 2017—leading to 280 PB of data a year. This is not the only data utilities are dealing with, the generated data volume is anticipated to come from other SG attributes such as consumers load demand, energy consumption, network components status, powerline faults, advanced metering records, outage management records, forecast conditions, etc. The Electric Power Research Institute (smartgrid.epri.com) estimates the exponential boom in the quantities of smart grid data for a vertically integrated utility serving about one million customers [
36].
One solution to cope with such a big data avalanche is to have an expansion of data center networks that can mitigate the analytical workloads. However, this again raises concerns related to sustainable energy consumption and carbon footprint. Attempts to undertake analytics on the edge device is restrictive due to their resource limitations. Also in many cases, aggregated and collective analytics becomes unfeasible. Added to this is the volume of network traffic and complexity in SG that worsens the reliability and availability of analytics services [
37]. Leveraging the SG architectures with dedicated fog nodes deployed at a few hop distances (mostly one hop) from the core network, will complement the computations of both front end device as well as back-end data center.
3.1.5. Security Concerns
In the context of SG applications security is defined to mean the safety and stability of the power grid, rather than protection against malice, as the latter comes under the privacy umbrella. The malignancy of casual justification of Consistency Availability Partition tolerance (CAP) theorem or Brewer’s theorem is manifested in the current position of SG cloud security [
38]. In current SG designs, whole data finds its way into cloud storages comprised of a huge number of servers and storage components having peculiar horizontal and vertical elasticity. Unfortunately, the existing cloud based security and privacy enforcements are precisely erratic, and many a times the threats may enter from cloud operators’ side. In a competitive plus shared cloud SG environments the worry is that the rivals may spy on proprietary data, leading to cyber physical war among nations.
Gartner claimed that the cloud platforms are fraught with security risks and suggests SG like customer must put rigorous questions and specifications before the cloud service providers [
39,
40]. They should also consider a guaranteed security assessment from a neutral third party prior to making any commitment. Rigorous efforts are on headway across the power system and transportation communities to come up with SG cloud utilities and platforms leveraged with robust protective contrivances where the stakeholders could entrust the storage of sensitive and critical data even under concurrent share and access architectures [
41].
The distinguishing geo-distributed intelligence provided by FC deployments make it more viable for security constrained services as the critical and sensitive tasks are selectively processed on local fog nodes and are kept within the user control, instead of offloading the whole universe of datasets into the vendor regulated mega data centers.
3.2. Fog Computing for Smart Grid Architecture
A SG offers a rich use-case of FC. Consider an IoT-aided SG architecture, where we have a large-scale, geographically distributed micro grid (e.g., wind farm) system populated with thousands to millions of sensors and actuators. This system may further consist of a large number of semiautonomous modules or subsystems (turbines). Each subsystem is a fairly complex system on its own, with a number of control loops. Established organizing principles of large-scale systems (safety, among others) recommend that each subsystem should be able to operate semi-autonomously, yet in a coordinated manner. For that, controller with global scope, implemented in a distributed way may be employed. The controller builds an overall picture from the information fed from the subsystems, determines a policy, and pushes the policy for each subsystem. The policy is global, but individualized for each subsystem depending on its individual state (location, wind incidence, and conditions of the turbine). The continuous supervisory role of the global controller (gathering data, building the global state, and determining the policy) creates low latency requirements, achievable locally in the edge centered deployment also known as the fog. Such system generates huge amounts of data, much of which are actionable in real time. It feeds the control loops of the subsystems, and is also used to renegotiate the bidding terms with the ISO whenever necessary. Beyond such real-time network applications, the data can be used to run analytics over longer periods (months to years) and over wider scenarios (including other wind farms or other energy data). The cloud is the natural place to run such batch analytics. The SG requires a store and computing framework leveraged with efficient communication network connecting the subsystems, the system and the internet at large (cloud).
The underlying notion of FC is the distribution of store, communicate, control and compute resources from the edge to the remote cloud continuum [
3]. The fog architectures may be either fully distributed, mostly centralized, or somewhere in between. In addition to the virtualization facilities, specialized hardware and software modules can be employed for implementing fog applications. In the context of an IoT-aided SG, a customized fog platform will permit specific applications to run anywhere, reducing the need for specialized applications dedicated just for the cloud, just for the endpoints, or just for the edge devices. It will enable applications from multiple vendors to run on the same physical machine without reciprocated interference [
9]. Further, the FC will provide a common lifecycle management framework for all applications, offering capabilities for composing, configuring, dispatching, activating and deactivating, adding and removing, and updating applications [
42]. It will further provide a secure execution environment for fog services and applications [
3].
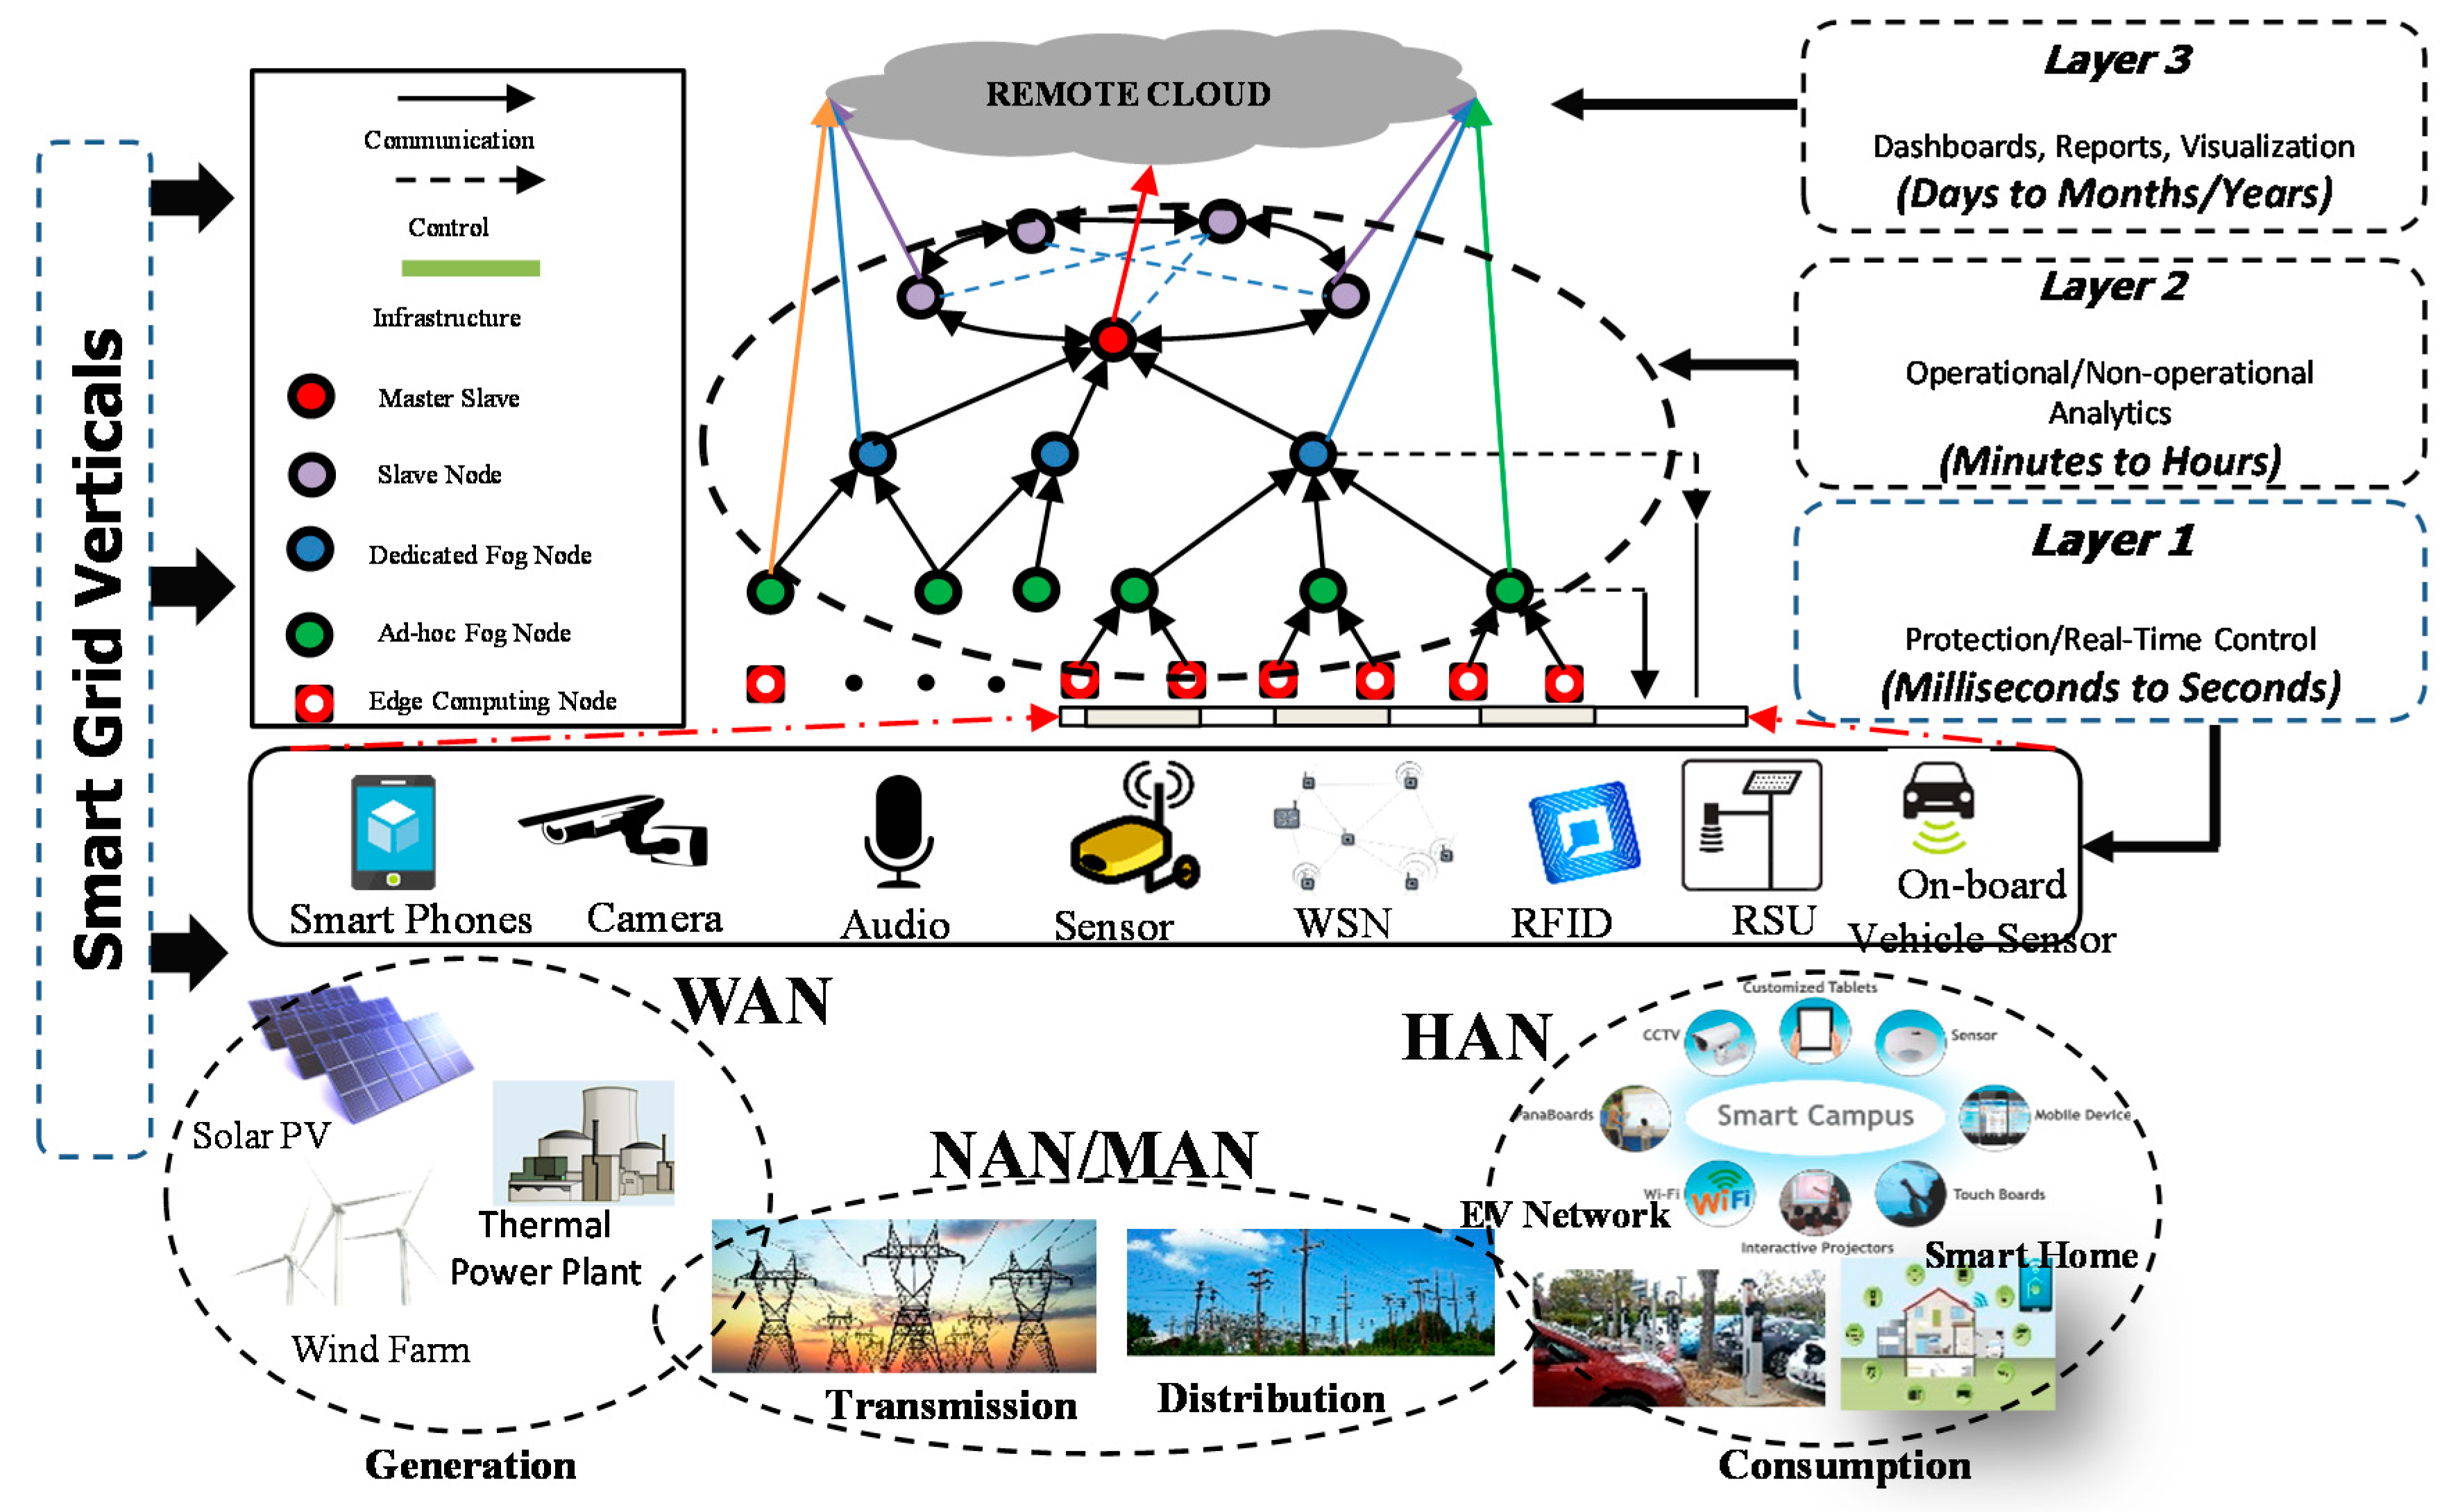
A multi-tier fog-assisted cloud computing architecture is shown
Figure 1, where a substantial proportion of smart grid control and computational tasks are nontrivially hybridized to geo-distributed FC nodes (FCN) alongside the data center-based computing support. The hybridization objective is to overcome the disruption caused by the penetration of IoT utilities into SG infrastructures that calls for active proliferation of control, storage, networking and computational resources across the heterogeneous edges or end-points. The framework facilitates the comprehensive enactment of IoT services in a fog landscape supporting big data analytics of SG data and guaranteeing optimal resource provisioning in the fog.
3.2.1. Layer 1
The lowermost tier consists of smart grid physical infrastructure populated IoT devices, that are further meshed by noninvasive, highly reliable, and low cost sensory nodes, deployed across the SG horizontals i.e., generation, transmission, distribution, and consumption [
42]. Thus, the physical components of this tier comprises of RFIDs, devices, cameras, infrared sensors, laser scanners, GPSs, and miscellaneous data collection entities.
3.2.2. Layer 2
The next tier also called FC tier functions as the prime component of a typical FC model. Though the notion of FCN were mainly proposed by Cisco [
43] and Bonomi [
14], the distribution, computational, and storage capacities; their interaction; and their deployment as a service (FaaS) scheme has not been clearly classified. The FCNs are expected to analyze the datasets based on the nonfunctional requirements of supporting applications such as latency, QoS, reliability, etc. Further, the massive sensing data streams generated from these geospatially distributed sensors have to be processed as a coherent whole.
The FC layer in
Figure 1 (within dashed oval) integrates the intermediate computing services into various sub layers. The lowest layer, closest to the physical layer, comprises of multiple low-power and high-performance computing nodes or edge devices such as dedicated routers, cellular network base stations, etc. Each edge device covers a group of sensors in its domain for performing traces of local and instant analytics. The outputs of edge devices may either fully assimilated within the SG applications or may be offloaded to the upper tier for further processing. The later may be reports of accomplished tasks or some preprocessed datasets that are made ready for upper level analysis. For example, the instant output can be used to provide real-time feedback control to a local infrastructure, e.g., to inform police authorities in response to any isolated and small threats to a monitored electric vehicular network.
The higher sub layer consists of dedicated computing nodes named as FCN, either connected to edge nodes from lower layers or to upper layer cloud data centers through reliable communication links. Sometimes, the FCNs at same depth are paralleled to nodes lying below in the hierarchy to undertake tasks. In many cases the FCN may form further sub trees of FCNs, with each node at higher depth in the tree managed by the ones at lower depth, in master slave paradigm [
44]. A typical association of such hierarchies is depicted FC layer of
Figure 1. To be specific, consider a SG power transmission scenario where the FCNs are assigned with spatial and temporal data to identify potential hazardous events in transmission lines, viz., power thefts, intrusion in the network, etc. In such circumstances, these computing nodes will shut down the power supply from the distribution substation and the data analysis results will be feed backed and reported to the upper layer (from village substation to SCADA, to city wise power distribution center or to generation bodies) for complex, historical, and large-scaled behavioral analysis and condition monitoring. The distributed analytics from multi-tier fogs (followed by aggregation analytics in many use-cases) performed at the FC layer acts as localized “reflex” decisions to avoid potential contingencies. Meanwhile, a significant fraction of generated IoT data from smart grid applications is not required to be dispatched to the remote clouds; hence response latency and bandwidth consumption problems could be easily solved.
3.2.3. Layer 3
The uppermost tier is the Cloud Computing or data center layer, providing global or centralized monitoring and control. The data centers are leveraged with high performance distributed computing and storage elements that allow to perform complex, long-term (days to month or years), and grid-wide behavioral analysis. The results of cloud scale analytics may be large-scale event detection, long-term pattern recognition, and relationship modeling, to support dynamic decision making. One major objective of cloud level analytics is to ensure the grid and service vendors to perform large scale resource and response management activities and to be prepared for blackouts or brownouts.
3.3. Network Model for Fog Computing
In a cloud computing model the Mega Data Center (MDC) provides sharable resource pool available for on-demand use. Since the MDCs are far away from the data generation sites, data migration and service latencies give rise to infeasibilities for real-time and interactive SG applications. However, in fog architecture, low/battery powered FCNs are deployed at the dedicated edges of the network to offer store, compute and networking support for SG mobility, real-time response, and geodistributed intelligence. Consider an FC architecture customized to BDA in SG applications, in which data and computation are selectively offloaded to either cloud or fog scale processing, guided by an application specific logic. Without loss of generality, respectively, let us assume the sets D, F, and N represents the set of data centers, fog nodes, and number of consumers having cardinality D, F, and N, respectively. An instance of SG network can be modeled as a connected cellular graph of order (N + F) whose vertices are constituted by data consumer set (N) and FCN set (F). Let be the frequency of workload arrivals on fog node i. For simplicity it is assumed that the FCNs are equipped with homogenous processing elements (having same processing power) each having service rate . An FCN j is reachable from query source node k if j is in the preference list L, dynamically maintained by FCN j.
Consider a pilot SG analytics service to be delivered from the hierarchical fog architecture shown in
Figure 1. Over the time frame considered, out of volume
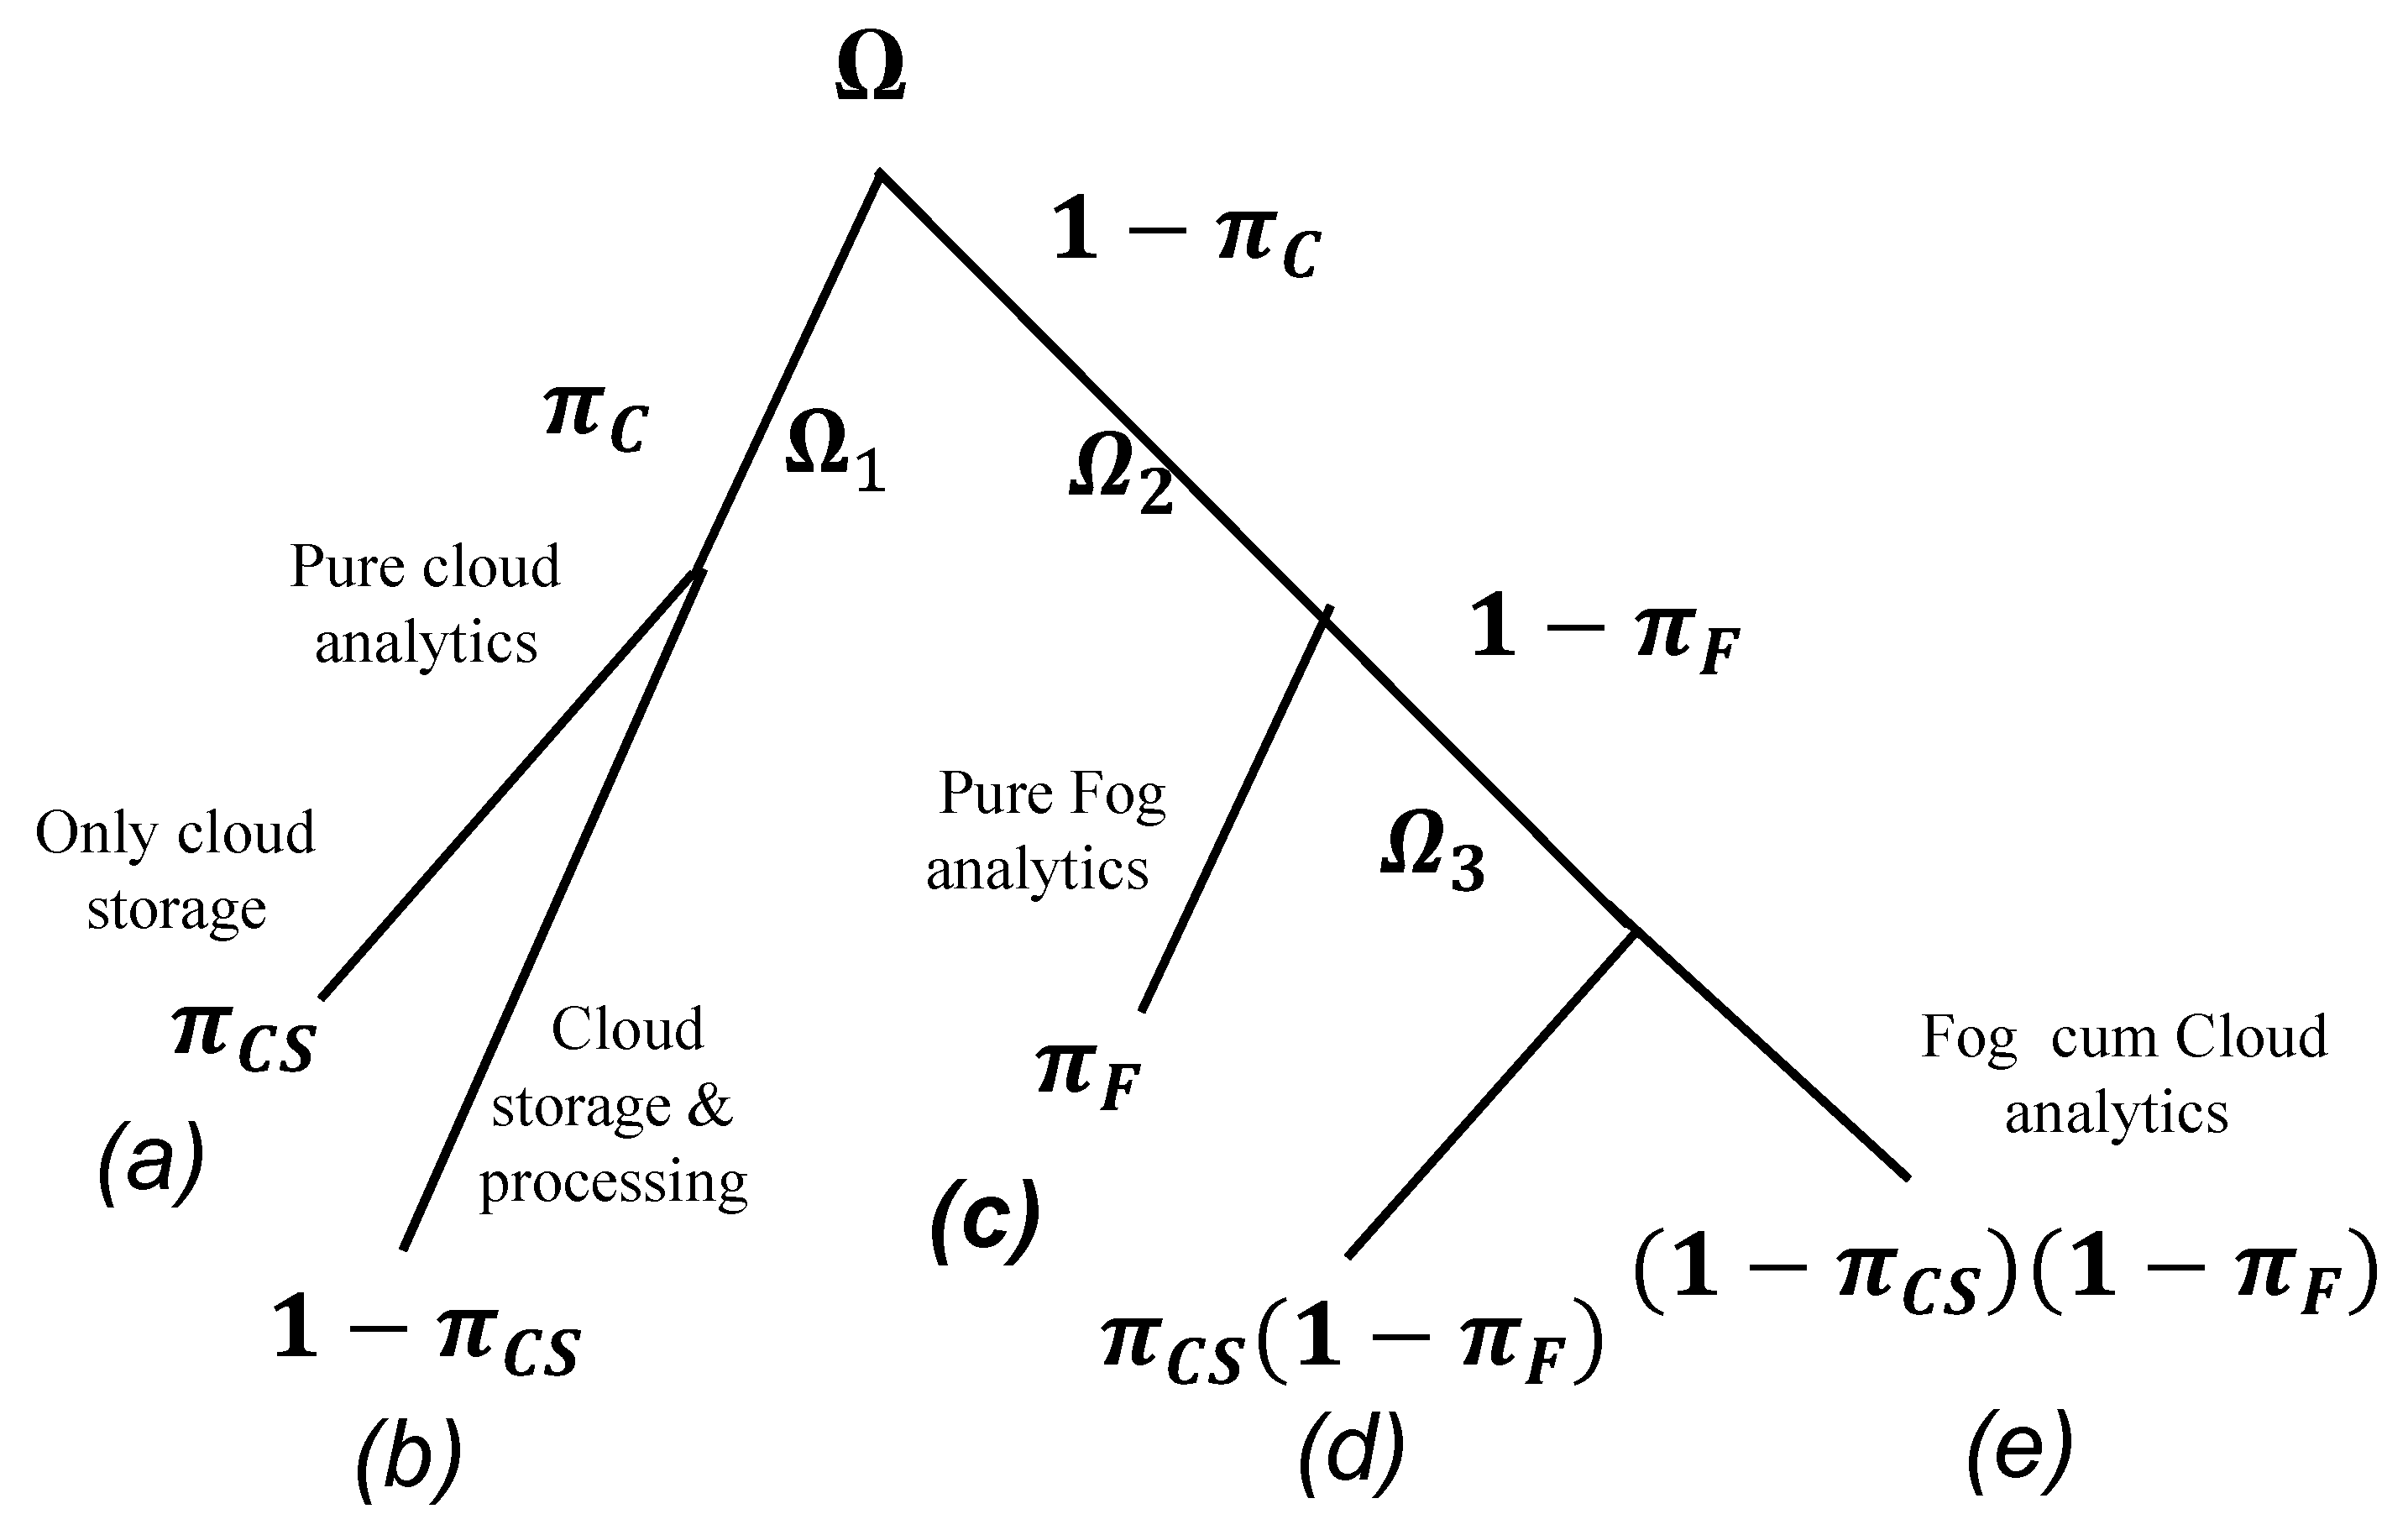
of generated workload, the sensing and offloading schemes directly dispatch (towards the left subtree of root in
Figure 2) the less critical datasets
(demanding historical analytics on power market operational data, forecasting data, etc.) for cloud scale processing. The latency critical datasets
are uploaded to the associated FCNs with probability
. A fraction of datasets (
) demand sequential execution of both cloud and fog scale algorithms, where the results of fog analytics are used for reflex and real-time decision making, and consecutively dispatched to remote clouds for operations such as large scale event detection, behavioral analysis, prediction, pattern analysis, etc. The uncertainties associated with such multimodal execution are captured through probability terms appearing in the leaves ((a) to (e)) of decision tree in
Figure 2. An ideal Fog–Cloud framework is leveraged with robust inferencing logic and intelligent filtering devices to undertake instant decisions on where to distribute the produced datasets. Following these assumptions, in this section, we establish a mathematical framework for defining the cost profiles in both cloud and fog scale processing. The objective of the proposed framework is to minimize the overall cost incurred due to power consumption, latency, and carbon footprint.
3.3.1. Cost Profile for Generic Cloud Processing
The term
in Equation (1) represents the total cost of a traditional data center-based computational infrastructure. The addend terms are respectively source to cloud communication latency cost, cost of storage and analytics, cost corresponding to electricity consumption, and cost reflecting the volume of carbon footprint from these data centers.
3.3.2. Cost Profile for Fog-assisted Cloud Processing
The term
in Equation (2) denotes the net cost of fog-assisted cloud architecture. The first term gives the cost corresponding to the edge level processing for data demanding real-time or time critical processing. An optimal workload allocation algorithm filters the datasets which are less latency sensitive or that demand bulky resources and offloads them directly to the cloud level processing logic. Thus the cost profile of second term in (2) is similar to generic cloud analytics as shown in (1). The uncertainty associated with workload offloading is captured through variable
shown in
Figure 2.
Without loss of generality, the cost term corresponding to fog level processing in (2) is given by
where, the addend terms are analogous to (1), i.e., cost due to fog communication latency, cost of computation, cost of power consumption, and the cost corresponding to carbon footprint in Fog-assisted cloud network. The cost of communication
in (4) includes the overheads corresponding to data upload delays from user applications to FCNs, processing latency at candidate FCNs, and inter-fog communication delays. It also includes latency cost in fog to cloud dispatch and price of cloud level batch analytics.
Equations (5)–(9) define the each cost term involved in (4), respectively. For application(s) associated to fog node
k via link
j of bandwidth
w, the upload latency is given by (5). Assuming a queuing system, for the fog device
i with the traffic arrival rate
and service rate
, the computation latency is given by (6) that involves queuing delay while waiting for service, service time, and time taken for VM installation. The equation may also be extended to capture the scenario when the task (depending upon the size of data) needs to be paralleled to multiple fog nodes. We omit additional latency term due to aggregation of results from any such concurrent computations. Often, the data passes through multistage fog computations involving inter-fog communication delay, given by (7). A significant fraction of data coming out from the fog network also needs to be dispatched to the cloud for permanent storage and historical analysis. The delay due to transmission of data over the fog to cloud WAN transmission link is captured in (8).
The processing in cloud data server is characterized through an
M/
M/
n queuing model having cloud response time of the order given by (9), where
is the Erlang’s
C formula [
45] and
is the computational performance index defined as the ratio of traffic arrival rate to the service rate. If VM
i and
j are installed into FCN
f and
f’, respectively, the aggregate traffic cost or the cost of computation
is given by
The net power consumption term in a typical FC model involves energy expended due to transmission of byte stream from data generation nodes to cloud data center(s) via fog node(s) and due to computations across FCNs and data centers. Thus
is given by
where, the terms inside square braces denotes power consumption at the network while transmitting the byte-stream. The second and third addend in (11) represents power consumption profile for FCNs and cloud servers, respectively. The energy consumption profile of a typical fog node (
) can be represented as a quadratic, monotonic increasing and strictly convex function of computation volume
. The function satisfies the fact that marginal power consumption of fog nodes increases proportionally with time. It also ensures that computation power consumption to be proportional to the amount of analytics activities performed. Thus,
Similarly, if each data center is assumed to host homogenous computing elements (machines) of identical CPU frequency
, the power consumption component
of each computational element at cloud server can be approximated as a function of
, given by
where
and
are positive constraints. In realistic scenarios,
varies between 2.5 and 3. All three attributes can be obtained by curve fitting against empirical measurements when profiling the system offline [
42]. The net power consumption across the architecture given by (11) is mapped to corresponding cost term
through energy to cost conversion parameter
. Thus,
Equation (15) calculates the cost term due to emission given in (3), in terms of cost of carbon footprint (USD per gram) and the average carbon emission rate found from weighted contribution of different fuel types (gram per KWh).
3.3.3. Illustrative Example
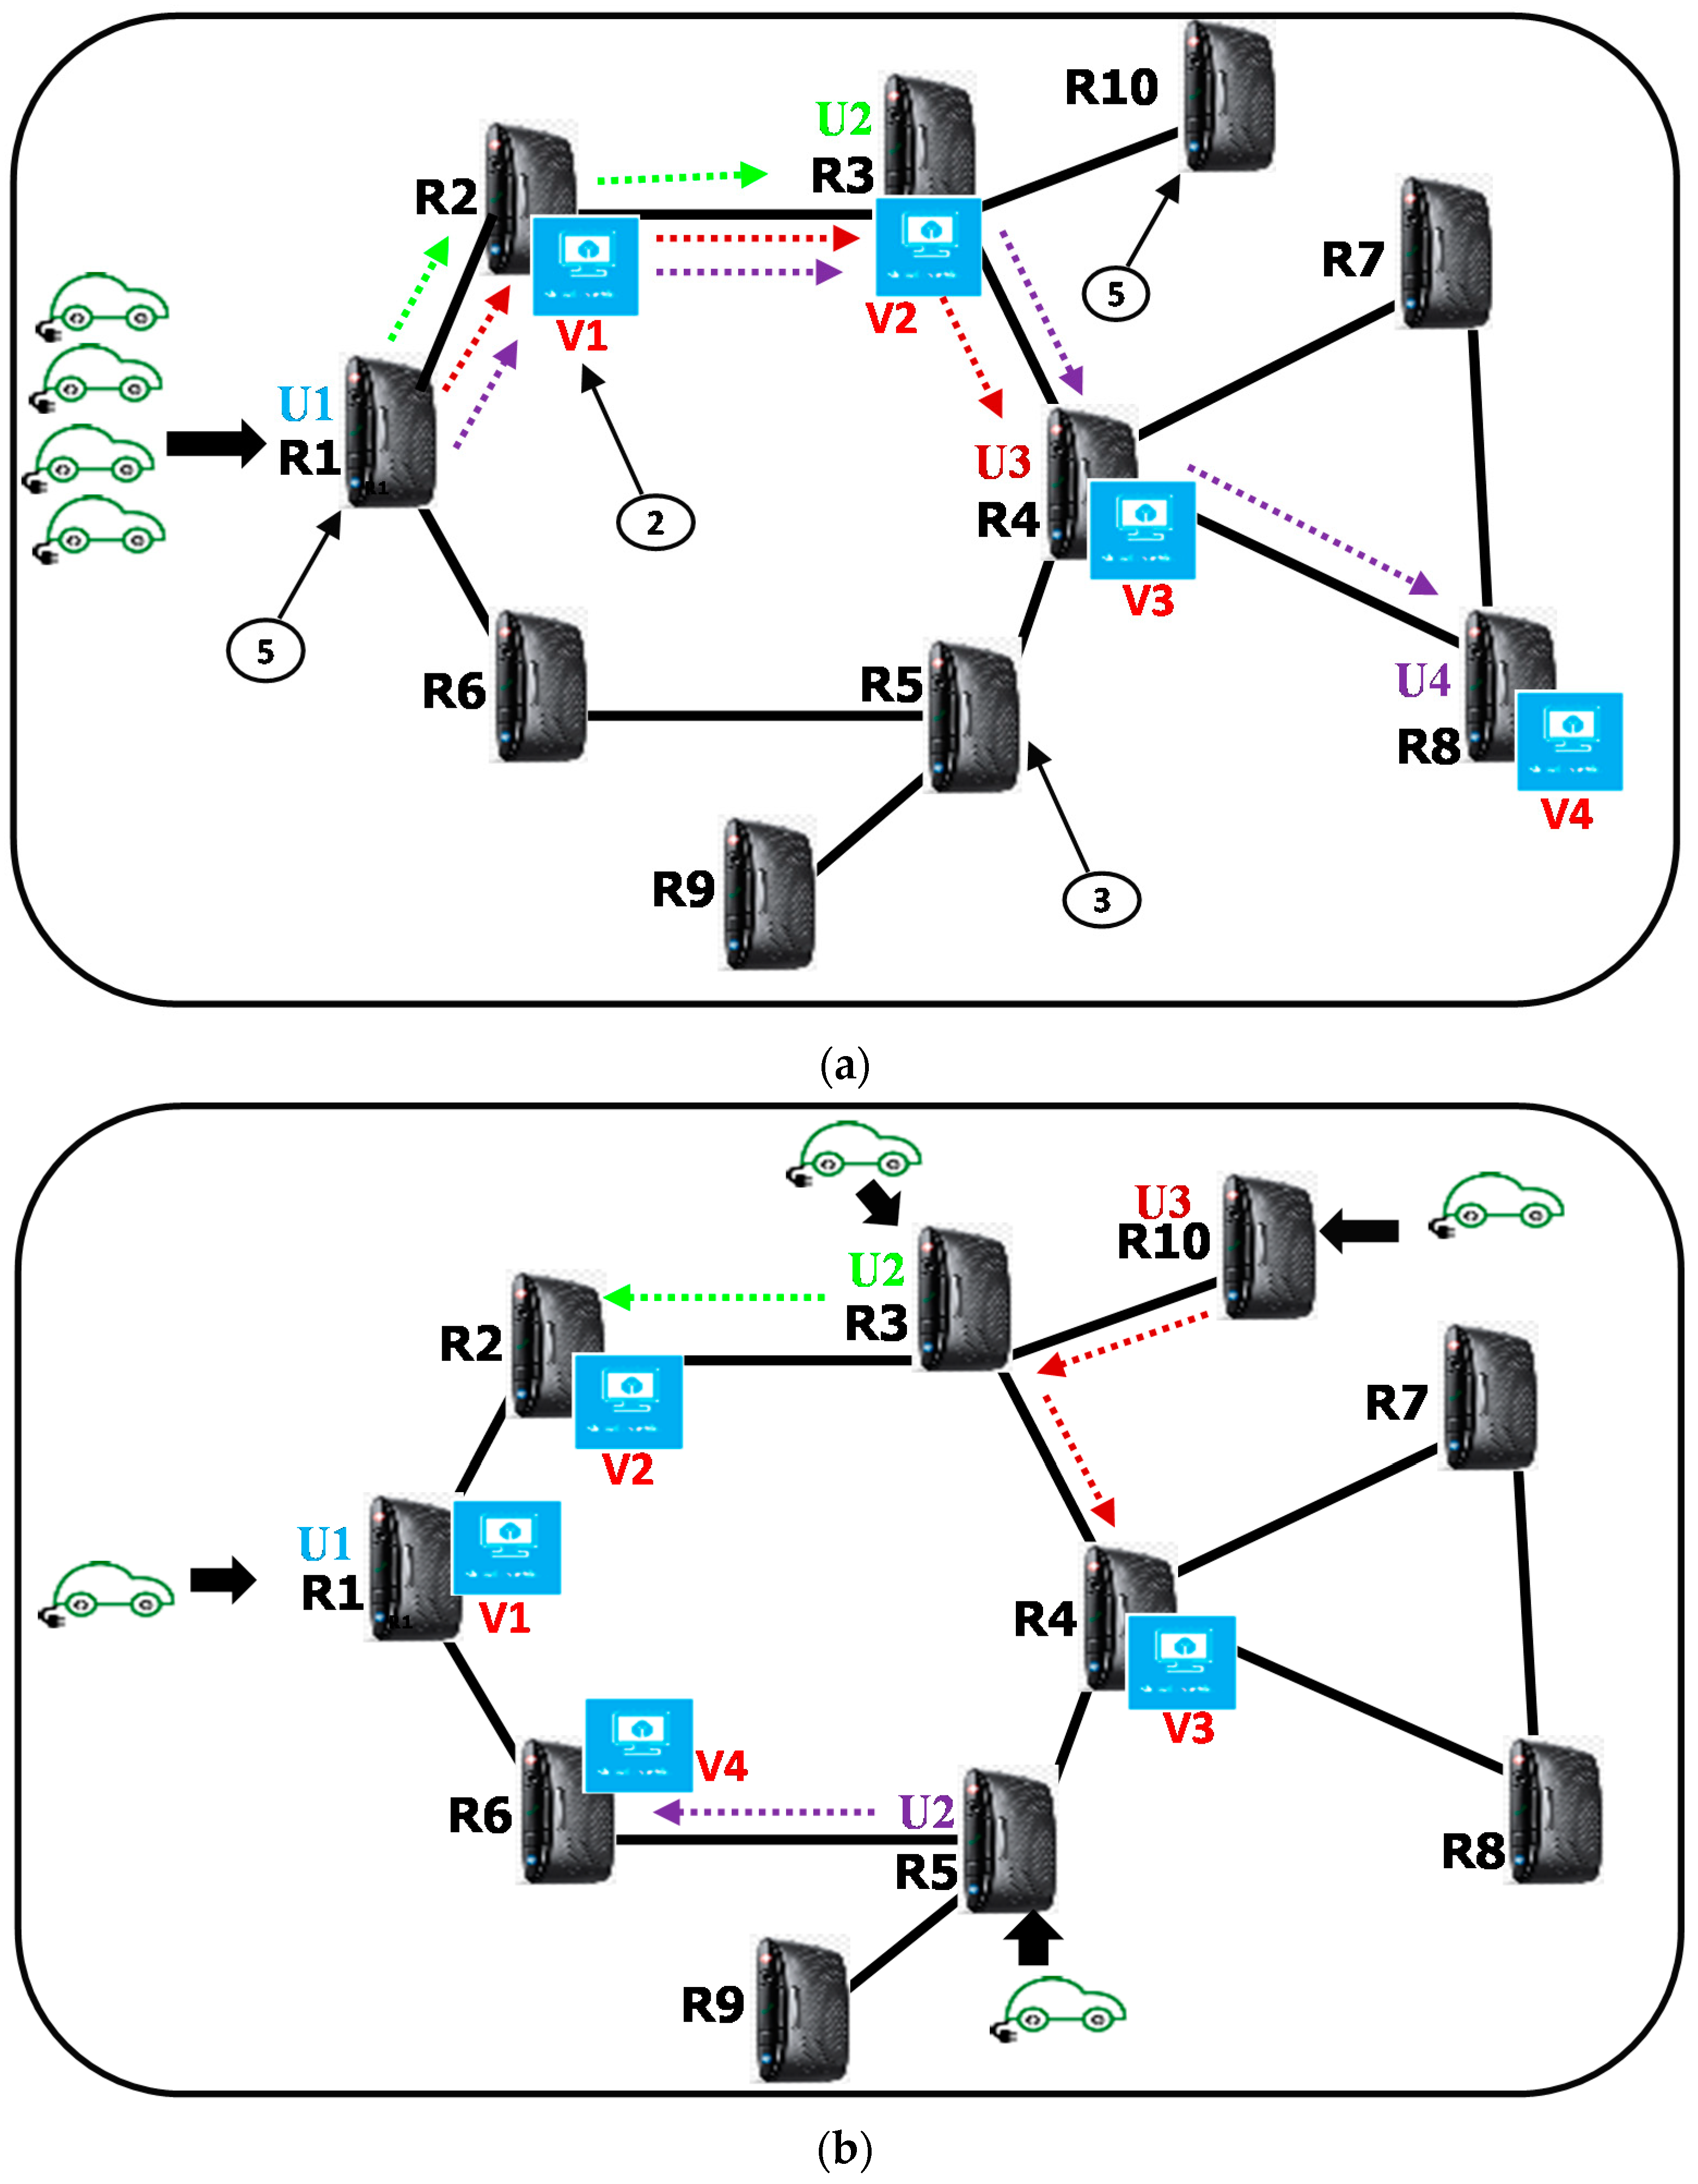
In order to have an optimal and cost preserving FC model, it is indispensable to investigate the constraints pertaining to user–FCN association, workload allocation and VM deployment towards cost-efficient FC architecture. To have further insight, let us consider an illustrative connected vehicular network shown in
Figure 3a,b. The toy example describes how the QoS parameters such as the upload latency, processing latency and communication latencies etc. are improved when the mode of task association/distribution, virtual machine deployment, and resource allocation/association are altered.
The vehicular network (VANET) shown in
Figure 3a,b comprises of four electric vehicles having each driver using a smart charging app (single application) that recommends the optimal location of an electric vehicle charging station (EVCS). The recommendation criteria may be on economic power tariff, lowest queuing delay, shortest distance, or any/all combination of these. There are ten roadside units (RSU) each having four bandwidth units (BU). Each RSU can contribute for an uploading data rate of one per time unit and are deployed across the VANET.
The RSUs fetch different attributes, behavior, location, etc. of the commuters as input and process it to regulate the fleet dynamics. All RSUs are also interconnected through WSN or wired links having a five unit communication delay between each neighboring pair. Each RSU charges two per time unit for hosting one VM. The RSUs also incurs an application uploading cost. In our example (shown in
Figure 3a,b as arrows with weighted tail), we assume RSUs R1, R2, R5, and R10 have uplink costs of 5, 2, 3, and 5 units, respectively. For case 1, shown in
Figure 3a, we assume that all the vehicles are associated to R1 and data requests from all four drivers are uploaded through R1 and then processed in R1, R3, R4, and R8 respectively. RSUs R2, R3, R4, and R8 are used to host virtual machines for user applications U1, U2, U3, and U4, respectively. Our aim is to minimize the total unit cost that includes cost due to total VM deployment, queuing delay, application/request uploading and inter-RSU communication.
Thus the uploading cost for
Figure 3a is 5 + 5 + 5 + 5 = 20, whereas the VM deployment cost and cost due to inter-RSU communication (2 + 2 + 2 + 2 = 8) and (0 + 2 × 5 + 3 × 5 + 4 × 5 = 45), respectively. The multiplication factors in inter-RSU communication correspond to number of hops required for the packet to reach destinations. Each of those paths is labeled as green, red, and violet, respectively. Hence, the total cost will be 20 + 8 + 45 = 73. The uploading latency incurred by each driver in this case is 1 because each application can use only one BU of R1. If there would have less number of BUs available to each user there would be queuing delay that further raises the latencies.
Now let us reconsider the network dynamics by incorporating some changes in the user-RSU association, VM deployments and resource (BU) allocation, as shown in
Figure 3b. Suppose that R1, R2, R4, and R6 are used to host the VM for applications U1, U2, U3, and U4, respectively. The respective users are now associated to R1, R3, R10, and R5. Keeping the remaining network attributes and the QoS parameters intact the cost due to request uploading, VM deployment, inter-RSU communication, and total cost are (5 + 2 + 3 + 5 = 15), (2 + 2 + 2 + 2 = 8), (0 + 5 + 5 × 2 + 5 = 20), and (15 + 8 + 20 = 43). The uploading delay of all users is now decreased to 1/4 thanks to full occupancy of all four BU of corresponding RSUs. It can be inferred from this illustration that if proper task association/distribution, resource allocation, computing machines deployment strategies are employed the network/infrastructure resources, and the QoS can be significantly improved. For this specific example the cost reduction is (73 − 43)/73 × 100 = 41.09%.
Since, an optimal solution of user-to-FCN association, BU allocation, VM deployment, and workload distribution not only contributes to lower total cost but also improves Quality of Experience (QoE) of applications (e.g., the response time), it is necessary to investigate these factors for QoS guaranteed minimum-cost SG applications in FC environments. The optimization framework proposed in this work includes an extensive range of constraints to investigate base station association, task distribution, and virtual machine placement to ensure an optimal QoS for a fog archetype in SG.
In this section, we present an MINLP formulation on the minimum cost problem with the joint consideration of data consumer association, workload allocation, VM deployment, and networking constraints for communication infrastructure.
3.3.4. User–FCN Association Constraints
Since the SG have both mix of static as well as dynamic data consumers, at each time epochs the FCN maintains a dynamic list L to track the reachable data consumers, user i can only be associated to FCN j only if j is reachable from i. In other words, FCN j is reachable from query generation source node k if the former is in the preference list L.
Therefore,
where,
is a binary variable indicating if user node
i is in the list
L. Also, an FCN
j can associate user
i only when it has at least one available bandwidth unit (BU). If
S denotes the set of BUs corresponding to FCN
j, then
Since there is no restriction on the number of BUs allocated to a consumer from a fog node; but one BU can be only allocated to at most one consumer, i.e., there is a many one mapping from each set of BU to those of FCN, i.e.,
Equation (19) is an assignment constraint that ensures that every consumer must be associated with one and only one FCN. This is a single source constraint that is derived from (40), that granulates the QoS of applications. For simplicity, each consumer request is assumed to be atomic and is routed to the FCN which is nearest to the source. The objective is to minimize the packet transmission delays from data source to FCN.
3.3.5. Workload Allocation Constraints:
Since the data streams may undergo sequential fog processing, constraint (20) indicates that fog node
f can distribute application data to processing at fog node
f ′ only when it is associated with application consumers in the list
L’ of
f’. Thus,
If
denotes inter-fog (
f −
f ′) data arrival rate, then
Corresponding to each application request, if the task need to be accomplished by more than one fog nodes, constraint (22) ensures that all uploaded data are completely processed and total data received from data consumers through fog node
f shall be equal to data finally processed at all fog node
f ′.
3.3.6. VM Deployment Constraints
In principle, the FCN may serve the connected IoT devices according to all three general models, namely, the Infrastructure as a Service (IaaS), Platform as a Service (PaaS), and Software as a Service (SaaS) [
46]. However, due to the stringent hardware and software resources limitations of the of the IoT devices in SG environments, only the SaaS model seems to be the most feasible one. According to Cisco [
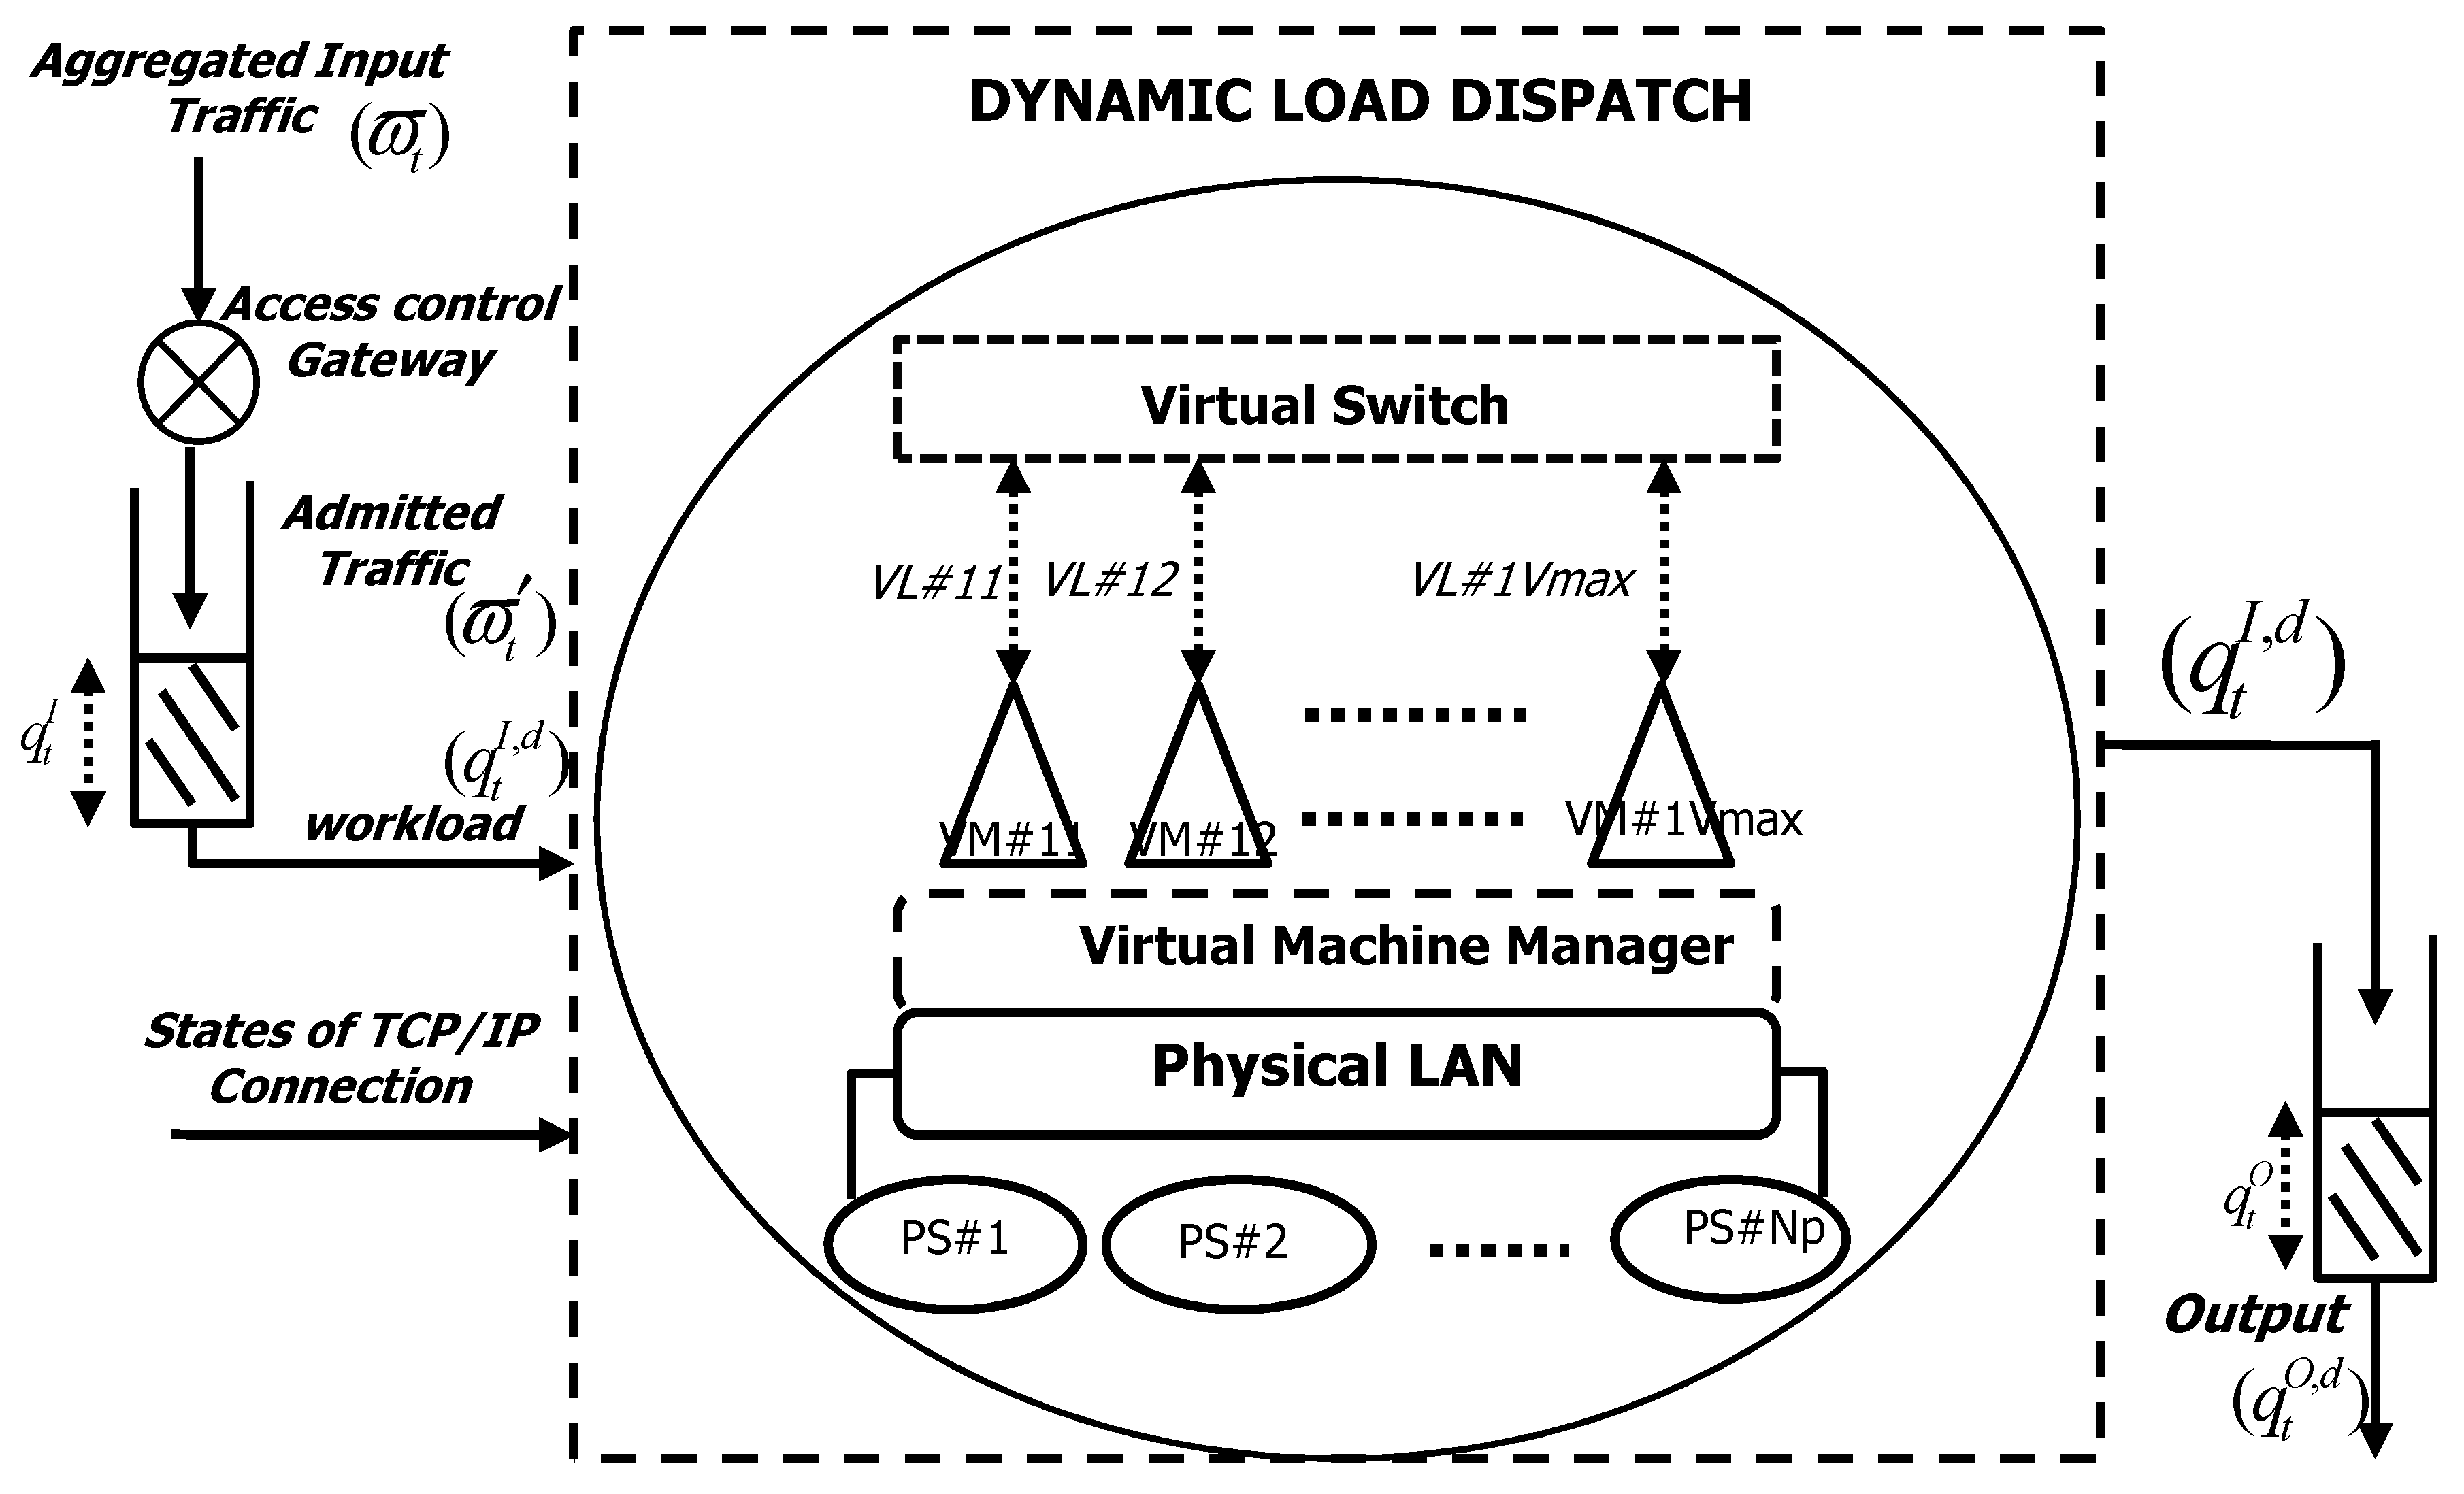
47], a state-of-the-art FCN is an IoE-compliant SaaS-oriented software that aims at mapping raw sensor data into actionable information. Roughly speaking, an FCN defined for our purpose is composed of five components as shown in
Figure 4.
- (a)
Admission Control Router (ACR): For defining the admission control policy, it maintains loss-free input and output queue.
- (b)
Input buffer: A time-slotted G/G/1/NI FIFO queuing system for modeling the input queue.
- (c)
Output buffer: A time-slotted G/G/1/NO FIFO queuing system for modeling the output queue.
- (d)
VLAN: It consists of a reconfigurable computing platform and the related switched Virtual LAN
- (e)
Adaptive scheduler: It reconfigures and consolidates the available computing-communication resources and also performs the control of the input/output traffic flows.
Let each fog node (FCN) is equipped with
NP physical servers. Each server can host at the most
Vmax number of VMs. Thus the maximum number of VMs hosted by an FCN
i is given by
In a virtualized FCN, each VM processes the currently assigned workload by self-managing own local virtualized storage and computing resources. When a request for a new job is submitted to the FCN, the corresponding resource scheduler adaptively performs both admission control and allocation of the available virtual resources. At the end of time slot
t, new input requests arrive at the input of the ACR (
Figure 4) following Poisson distribution. For
, the random process
defining the arrival pattern is presumed to be independent from the current backlogs of the input/output queues. At the end of slot t, it is assumed that any new arriving packet that is not admitted by the ACR is declined. Thus, out of
if
is the number of BUs per slot that are admitted into the input queue, then
The respective time evolutions of the backlogs in input and output queues are given by
For the data stream generated by application
a to be processed in FCN
f′, i.e.,
and corresponding VM must be deployed in
k and vice versa. Constraints in Equations (27) and (28) are defined respectively for that case.
if
,
, and
respectively denote the resource requirements of any application
a and the storage capacity of FCN
f, and its processing capability, then Equations (25) and (26) say that requirements of any application at any time is limited by storage and computational capacity of deployed VM, i.e.,
where,
is a scaling factor to indicate the relationship between processing speed and allocated computation resource.
3.3.7. Network Constraints for FC
In addition to constraints (5)–(8), at any instant, constraint (27) maintains the stable queuing equilibrium by keeping the service request rate less than the service rate. Constraint (28) ensures that the expected delay for any application or consumer at any instant should not exceed the specified delay limit imposed by QoS requirements.
3.4. Optimization Model
In this section, we present an MINLP formulation on the minimum cost problem with the joint consideration of data consumer association, workload allocation, VM deployment, and networking constraints for communication infrastructure. The objective of the proposed framework is to minimize the overall cost incurred due to power consumption, latency and carbon footprint. By summarizing the constraints discussed above, the cost optimization problem can be formulated as a mixed-integer nonlinear programming (MINLP) problem, i.e.,
4. Simulation and Algorithmic Set-Up
The essential nodes in the system include set of cloud servers
D, fog nodes
F, and data users
N. The architecture is virtually deployed on the essential nodes in an arbitrary SG network. For simulating the pilot SG topology, the 100 most populated places around the world are considered (i.e.,
), the corresponding population for representing the number of consumer/data generation nodes and the corresponding geographical coordinates are used to determine the relative Euclidian distance [
48]. The consumer endpoints within a particular city are logically grouped to form a cluster and are associated to an FCN. The generated data traffic will be proportional to the population of internet users of the corresponding city. The number of servers across the globe is considered to be 8, the pairwise Euclidian distance is stored in 2D variable
when their geo-location is determined through clustering of city population.
Each instruction is of size 64 bits. The user to fog links allows transmission of packets of 34 to 64 K bytes following Poisson arrival pattern having 8 byte instruction size and having mean packet arrival rate being 1 packet per node per second. The capacity of the links between data generators and FCNs is considered to be 1 Gbps whereas the inter-fog communication link capacity is taken as 10 Gbps. However, WAN communication between the FCNs and the cloud servers is assumed to take place through bandwidth unconstrained channels. The total number of data consumers in the system is treated as a variable, within the range (10
6,10
7), to assess the system performance against varying network conditions. The cloud servers transmit their data through access points distributed across each SG network. Each homogenous cloud server is assumed to accommodate the varied number of IoT devices within the discrete set (16 K, 32 K, 64 K, 128 K), based on the network traffic to be processed. Energy consumption rate of each FCN is taken to be 3.7 W while for cloud servers it is taken to be proportional to the number of IoT devices associated to each of them and taken from the range (9.7, 19.4, 38.7, 77.4) MW. The cost corresponding to consumed power is uniformly distributed between USD 30/MW h and USD
$70/MW h [
49]. For cost analysis, the cost of a 1 Gbps and 10 Gbps gateway router port is kept at USD 50 each per year while cost of server is USD 4000 per year [
49]. These routers are assumed to consume electricity at 20 W and 40 W, respectively. Upload tariff is USD 12 per byte while storage cost is kept in the range of USD 0.45–0.55 per hour. The penalty corresponding to CO
2 emission is kept USD 1000 per tons of CO
2 emitted [
50]. For easy understanding,
Table 1 depicts some important parameters used in the simulation.
In order to obtain an optimal value of probability
(best estimates that maximizes fog utility in (16)), Monte Carlo (MC) simulations are performed, having number of trials set to (1000,
), where
is the number of required MC trials that ensure a 95% confidence interval of an error less than 1% [
51]. Further to improve the efficiency of scenario generated through MC, Latin Hypercube Sampling (LHS) [
52] is used. LHS is a low discrepancy technique that generates evenly distributed random samples with small variance.
The formulated optimization model is a multistage, discrete,
non-convex, constrained mixed-integer nonlinear programming problem (MINLP). Usually classical mathematical programming techniques fail to provide tractable solutions to such problems. Evolutionary optimization algorithms specifically metaheuristic methods such as differential evolution (DE) [
52] provide promising approach to solve an MINLP. DE is a population-based evolutionary optimization method which had proven to be very simple yet powerful to solve minimization problems with nonlinear and multimodal objective functions. It differs from conventional evolutionary algorithms in that instead of having a predefined probability distribution function (
pdf) for mutation process, it utilizes the differences of randomly sampled pairs of objective vectors for its mutation process [
44]. Such variations will ensemble the topology of the objective function towards optimization procedure thus providing more efficacious global optimization capability. In order to reduce the fitness of similar offspring’s, we employed a modified version of differential evolution with a fitness sharing function of niche radius (
). For each individual population
i and given a threshold value of niche radius
, the DE calculates the shared fitness
according to (34).
Calculating the shared fitness
before selection operation supplements significant computations for evaluating values before executing selection operation. The underlying principle of employing fitness sharing is to cluster the population into smaller groups defined by a similarity measure. In this work the similarity is defined by a distance function
that satisfies Equation (30).
The individuals which lie in same group will share the corresponding fitness value and in the selection operation, clusters having larger fitness sharing value will be selected for producing the next generation offspring. The fitness sharing function is given by
The niche count
for every individual
i can be calculated as
Since during selection process, individuals with large fitness survive and used for mutation or recombination purpose, the value of shared fitness can be calculated by
However, for our purpose, since the evolution strategy is focused to obtain minimal optimal value, the shared fitness
is obtained from the equation
where,
controls the crossover constant commonly determined on a case to case basis having
as the control parameter and often set as
. In order to guarantee the fact that the best offspring always appear for next generation, elitism is employed. Algorithm 1 shows the progress of modified DE employed. When the BUs are exclusively allocated to an application user, the update latency cost is determined by the uplink rate
(see Equation (5)), regardless of the data volume. Similarly, the inter-FCN communication cost and WAN dispatch latency is determined by the actual network traffic
(where
is the request rate for application
a from FCN
i to FCN
j) and WAN communication bandwidth
, respectively. The overall goal is to maximize utility function (33) having best settings of
,
,
, and
. The decision variables for (33) are the workload
assigned from user
i to FCN
f workload
dispatched from FCNs to data center
j, the traffic rate
dispatched from FCN
f to data center
c, and CPU frequency
of homogenous servers installed at these data centers and the number of turned-on machines
on server
i. After applying MDE algorithm we obtain optimal workloads
and
. Correspondingly power consumption, latencies and total cost of architecture for both fog and cloud scale processing can be calculated.
| Algorithm 1 |
Initialize main population set P with Evaluate the population P Copy elite solutions to elite set E with While stopping criteria not met do - -
{Generate hybrid population H with - -
For each individual in the population, Find using (34) - -
do {
} While (mixed population is full)
- -
do where is the combined population set. - -
do descending sort on - -
Copy first elite solution from to form new elite class - -
do
|
5. Results and Discussions
In this section we presented a comprehensive comparison of cloud and fog scale execution in terms of performance metrics namely response times (service delay), electricity consumption, and cost of architecture. We depict the overall latency profile of fog-assisted cloud architecture with a generic cloud execution scenario. The upload latency, inter-fog communication delay and delay due to fog to cloud dispatch is abstracted in transmission latency term while the delay caused due to computations and analytics at VM fog nodes and cloud servers is covered under processing latency term. The overall response time (service delay) is given by algebraic sum of transmission latency and processing latency. We define Fog Network Efficiency (FNE)
in Equation (39) as the ratio of data packets dispatched to cloud core to the number of packets entering into the fog network through consumer to fog gateways. A higher value of
indicates that a larger fraction of applications demand real-time responses.
For instance, means only 20% of consumer requests demand fog plus cloud scale computations and is better than because in that case almost (99%) of data traffic needs cloud scale processing also. Such scenario extrapolates to pure cloud paradigm (even worse if response time is the only QoS of the system) for very low magnitudes of . For , the offloading model degenerates to pure edge computing model.
The Fog–Cloud delay statistics are shown in
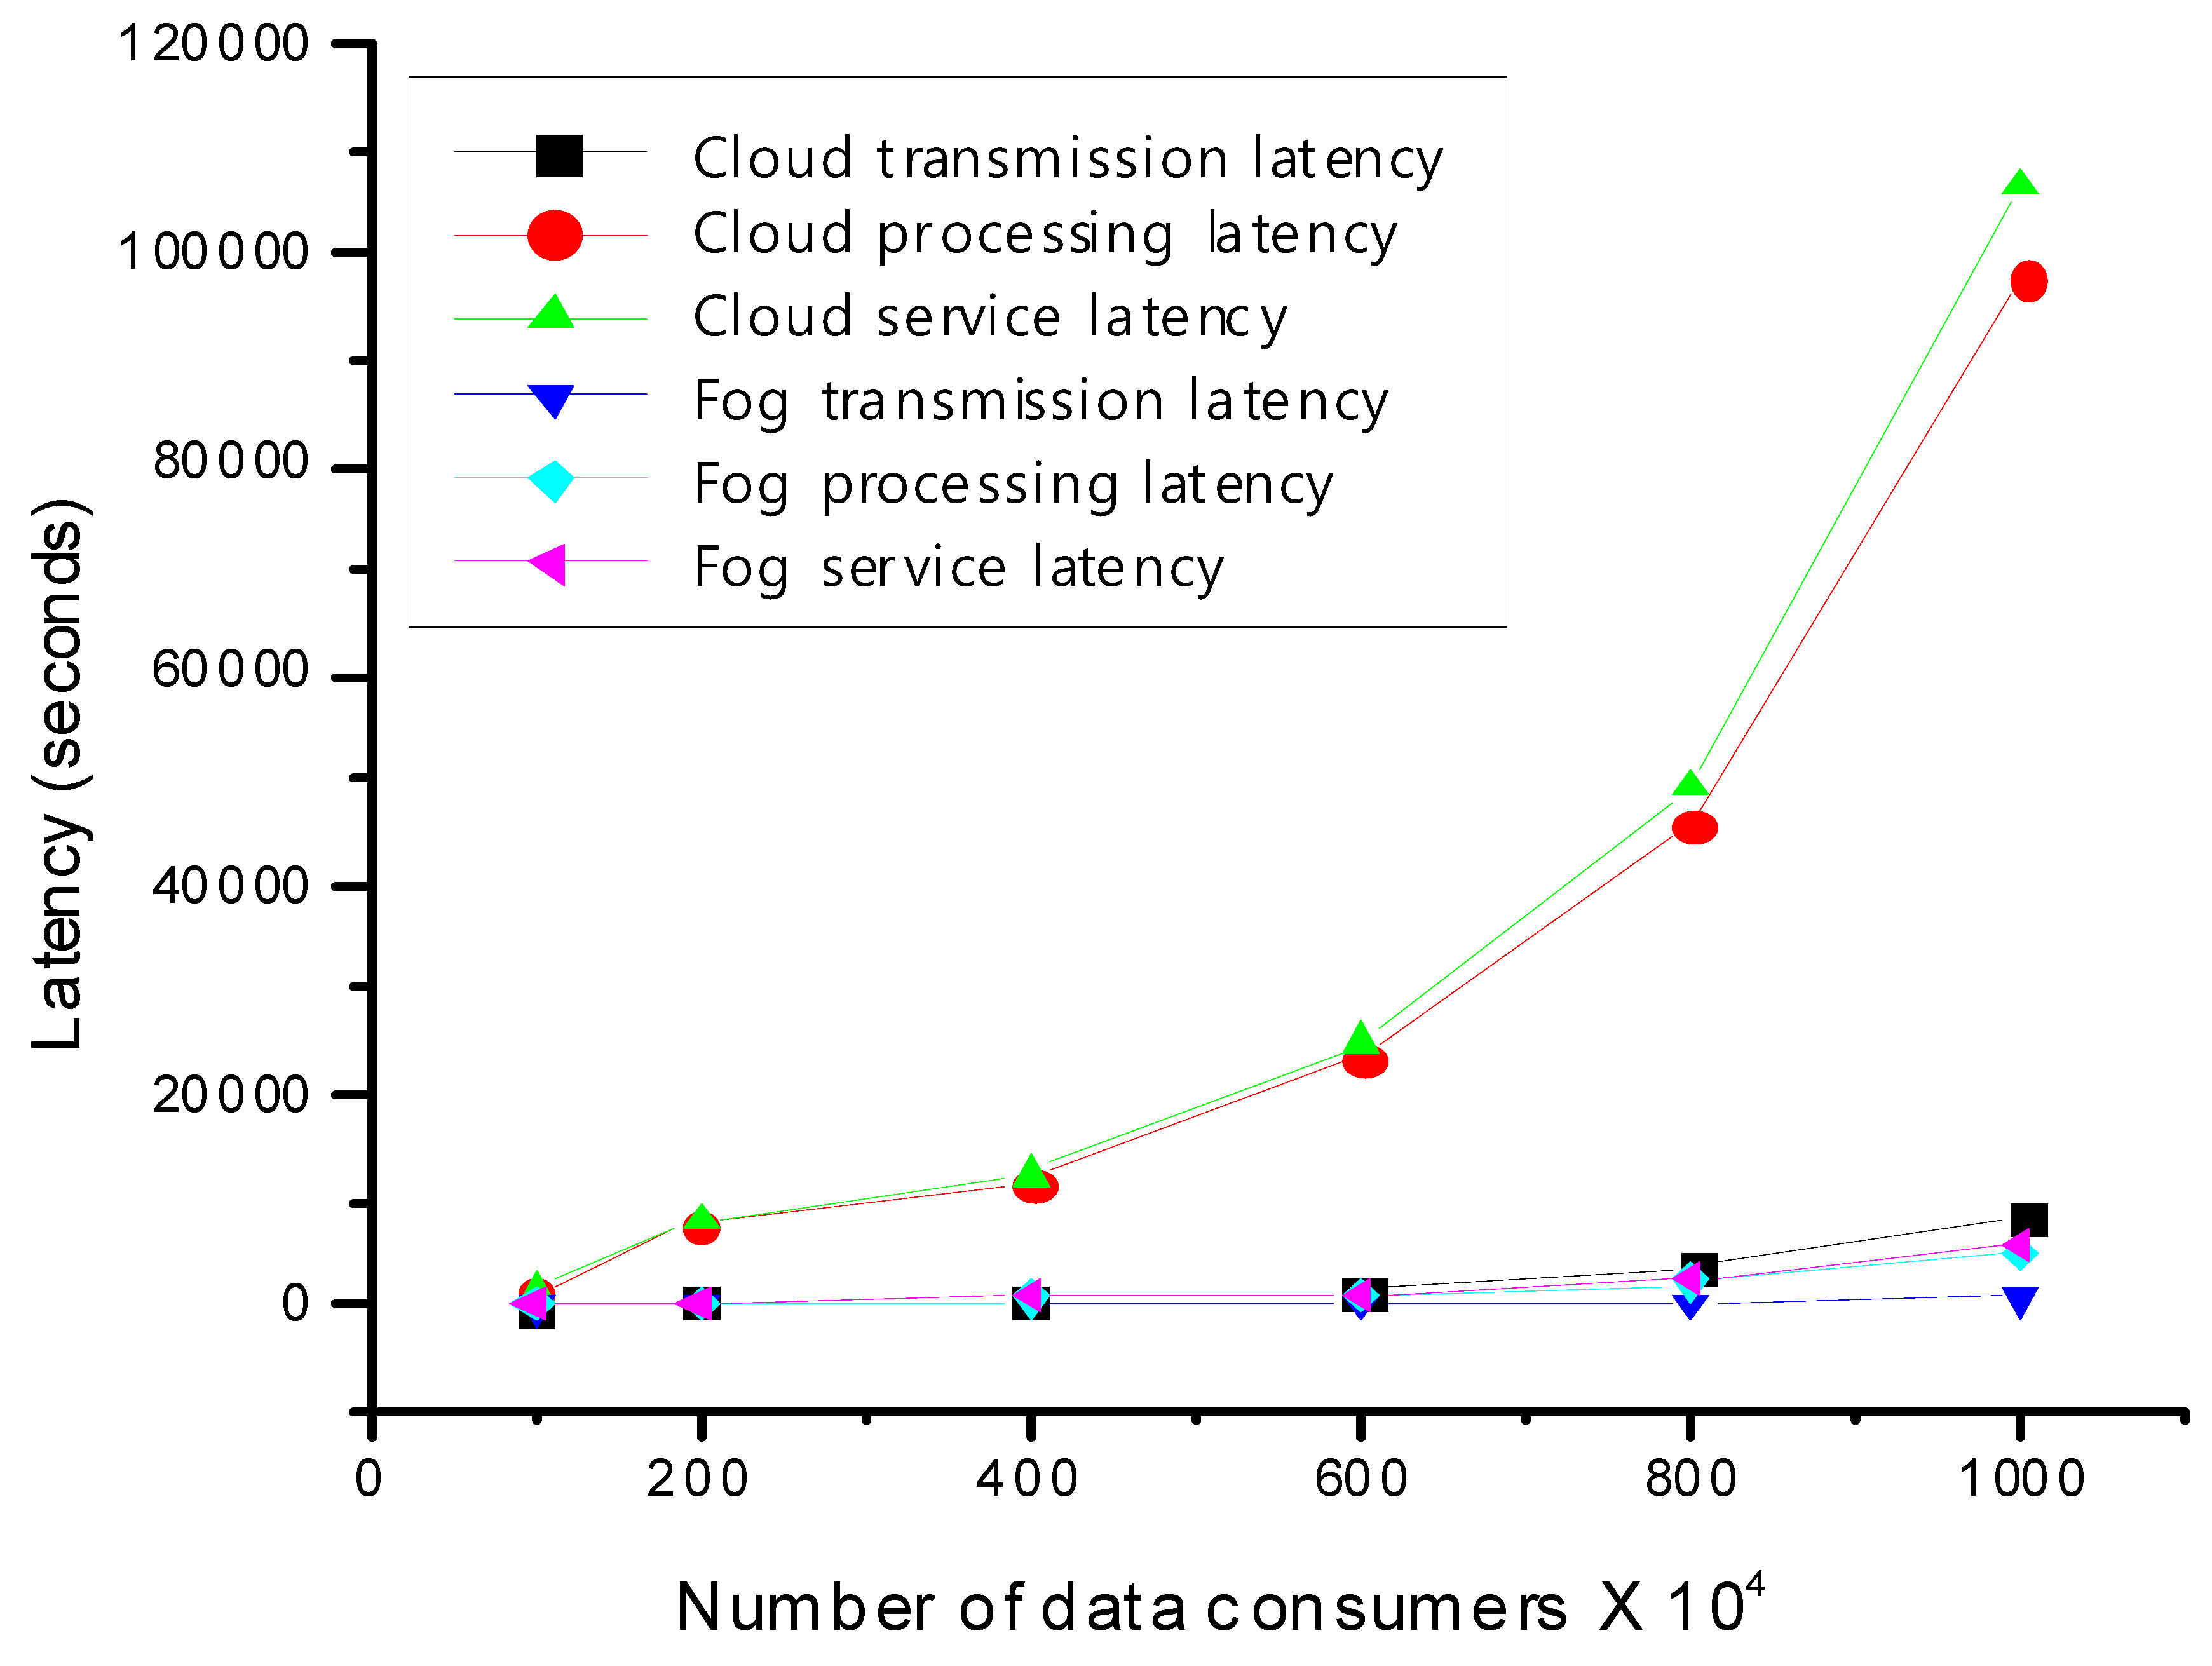
Figure 5 for
(half of consumer requests are served within fog alone). The mean transmission latency mean processing latency and service latency are plotted, separately for both cloud and fog platforms, against variable number of consumer nodes (in the order of 10
6). It can be observed that for both the fog as well as cloud platforms the latency is proportional to the density of data generators (traffic). Meanwhile the performance of fog-assisted cloud execution outperforms the cloud counterparts for every magnitude of data traffic.
We consider the changes of the magnitude of Fog Network Efficiency
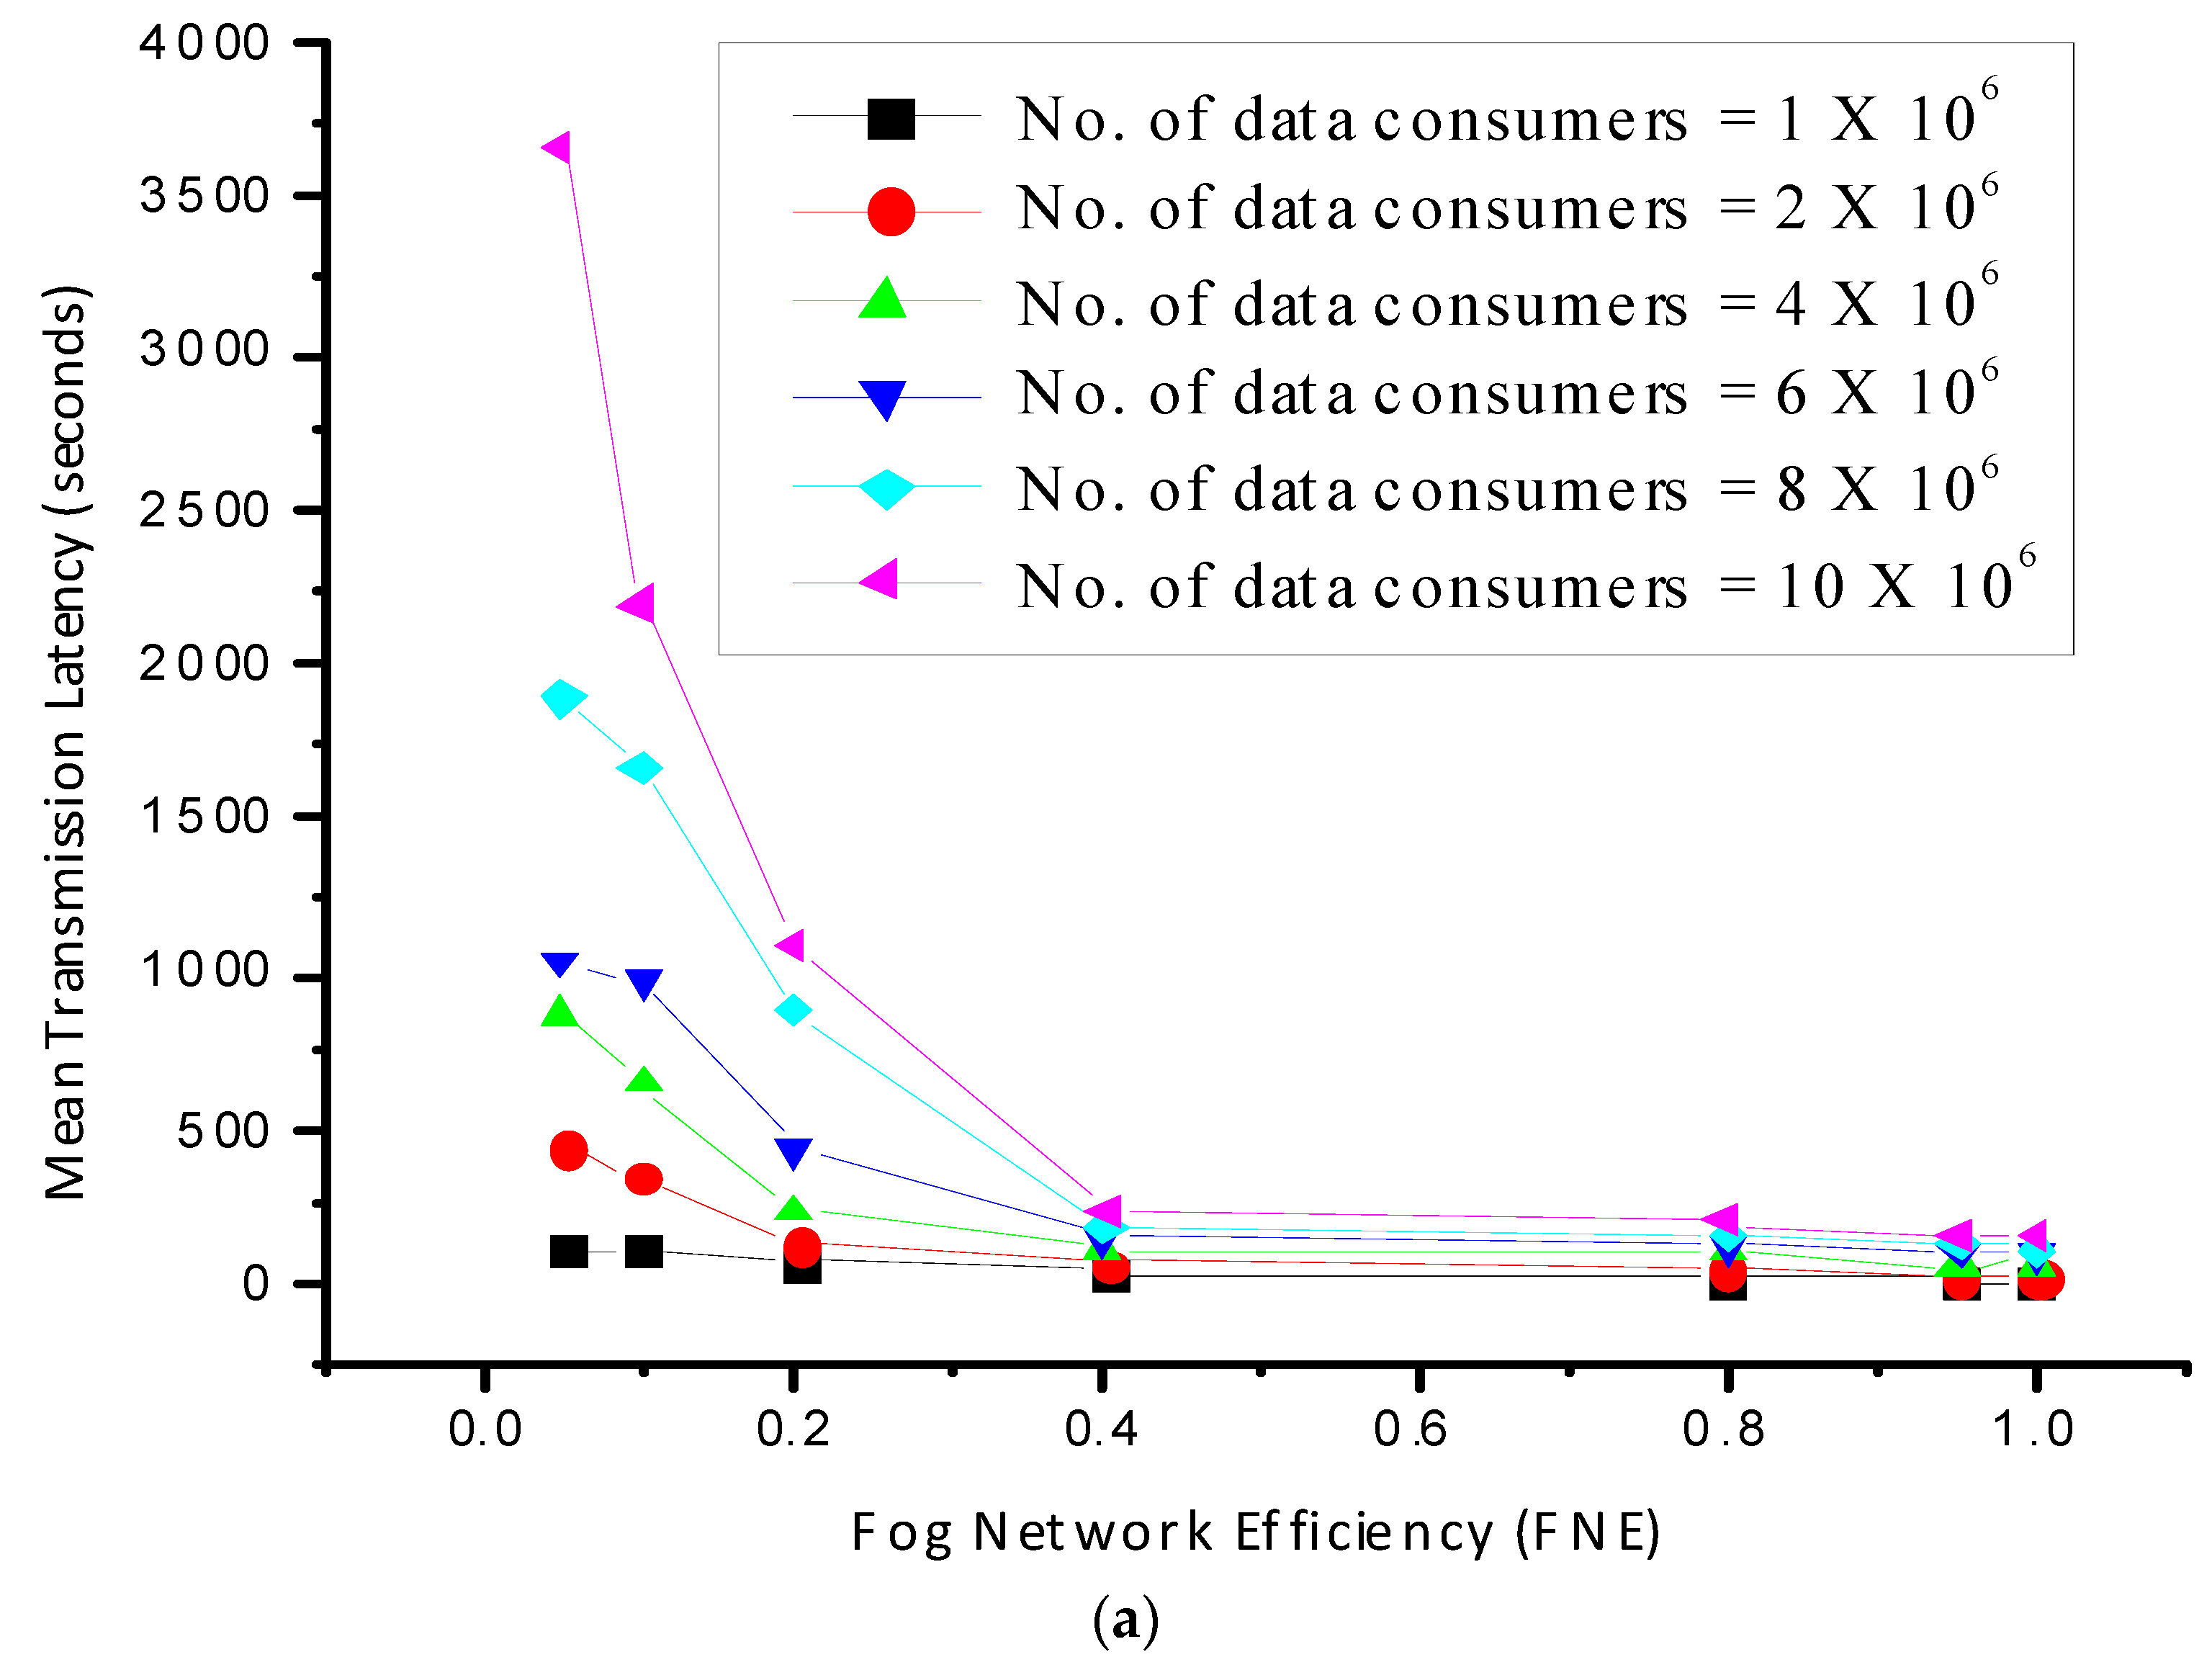
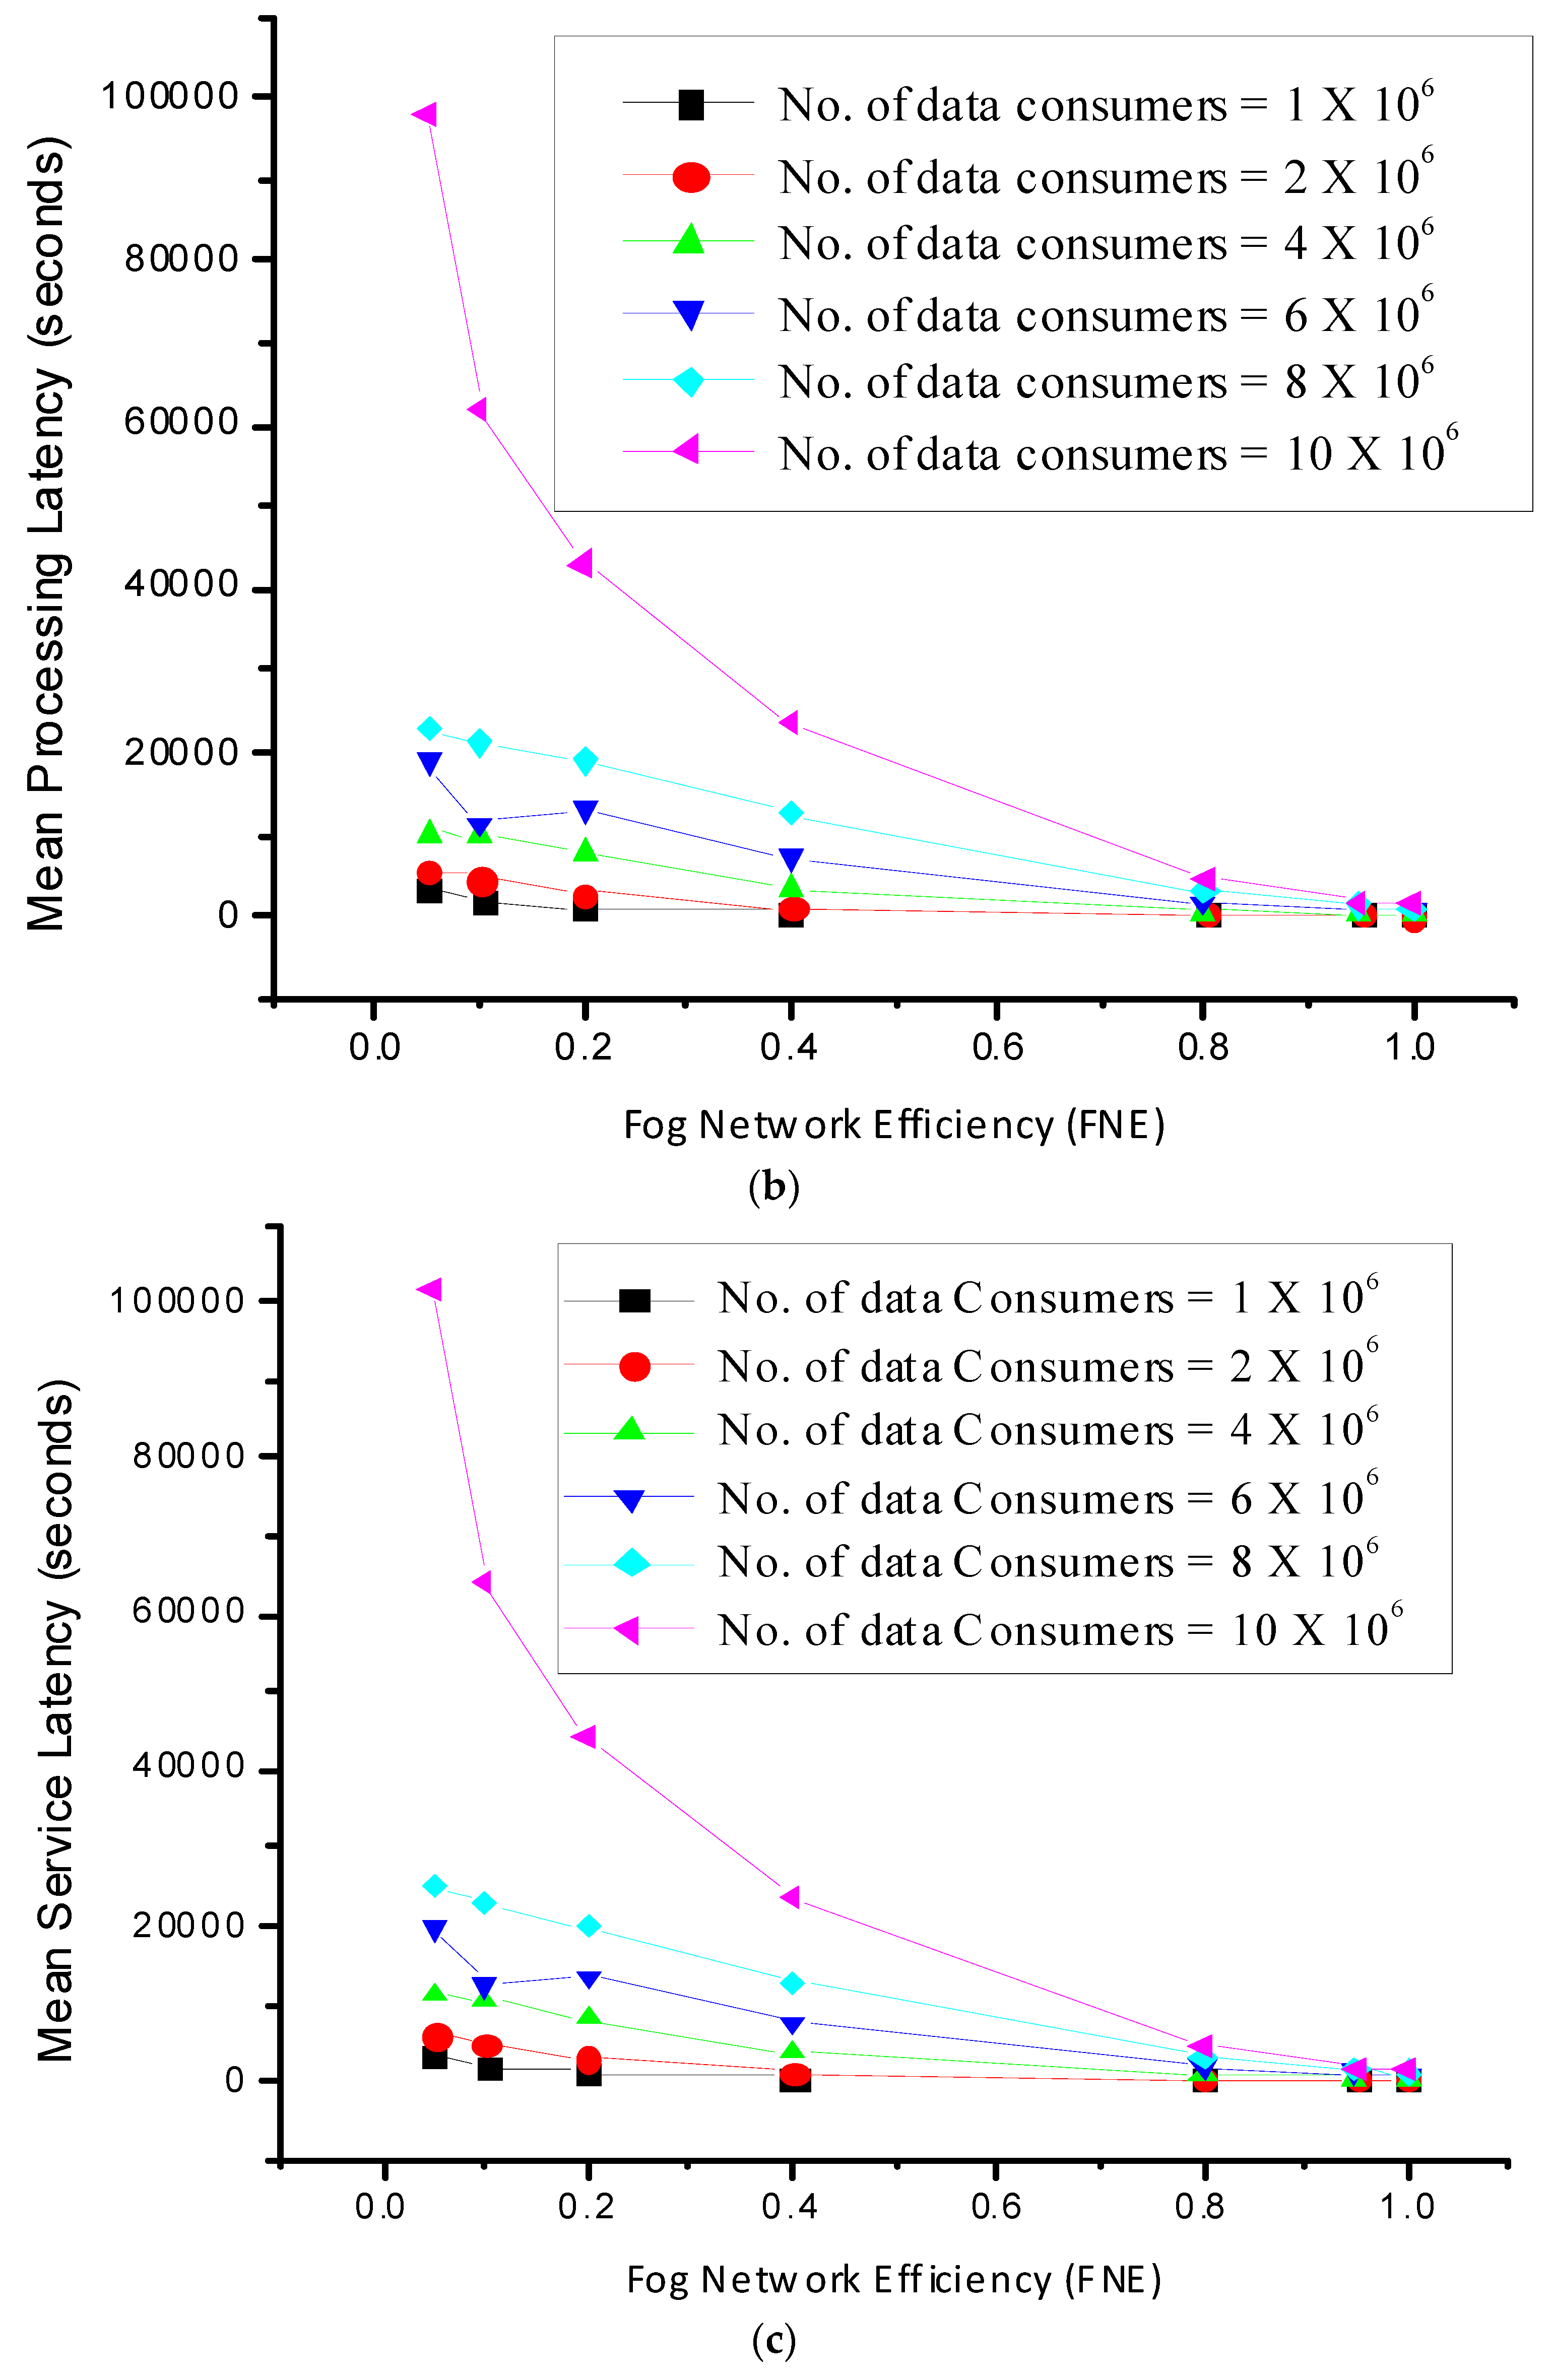
defined in (39) in the range (0,1) as shown in
Table 2, and plot the transmission latency and processing latency, and observe the change in the corresponding service latencies in
Figure 6. It can be observed that as the value of
is scaled from 0.05 (5%) to higher magnitudes, the response time is significantly improved i.e., the overall network latencies (average transmission latency
Figure 6a, average processing latency
Figure 6b and average service latency
Figure 6c) is reduced.
Figure 6a–c shows the most significant observation of the proposed model that, with the increase in the magnitude of
i.e., as more number of application requests demand real-time and latency-sensitive services (workload percentage on the FCNs increases), the mean transmission latency, and the mean processing latency are significantly reduced. For an infrastructure with
applications requesting real-time services (i.e.,
), the overall service latency for FC is noted to get reduced to almost half of that of pure cloud paradigm. Also, with the increase in the number of workload generators (consumer nodes), the latencies increase. For lower number of consumer nodes and at low values of
(<0.13 in
Figure 6a–c, red and black colored curves), the latencies are almost same for both cloud and fog platforms. This indicates that adopting FC is viable only when the data traffic is huge (Big Data Analytics) and is not economic for small scale computations. Also, in the context of IoT-aided environment such as SG, if the percentage of applications demanding for real-time services is low, then FC may come with an overhead compared to the traditional cloud computing.
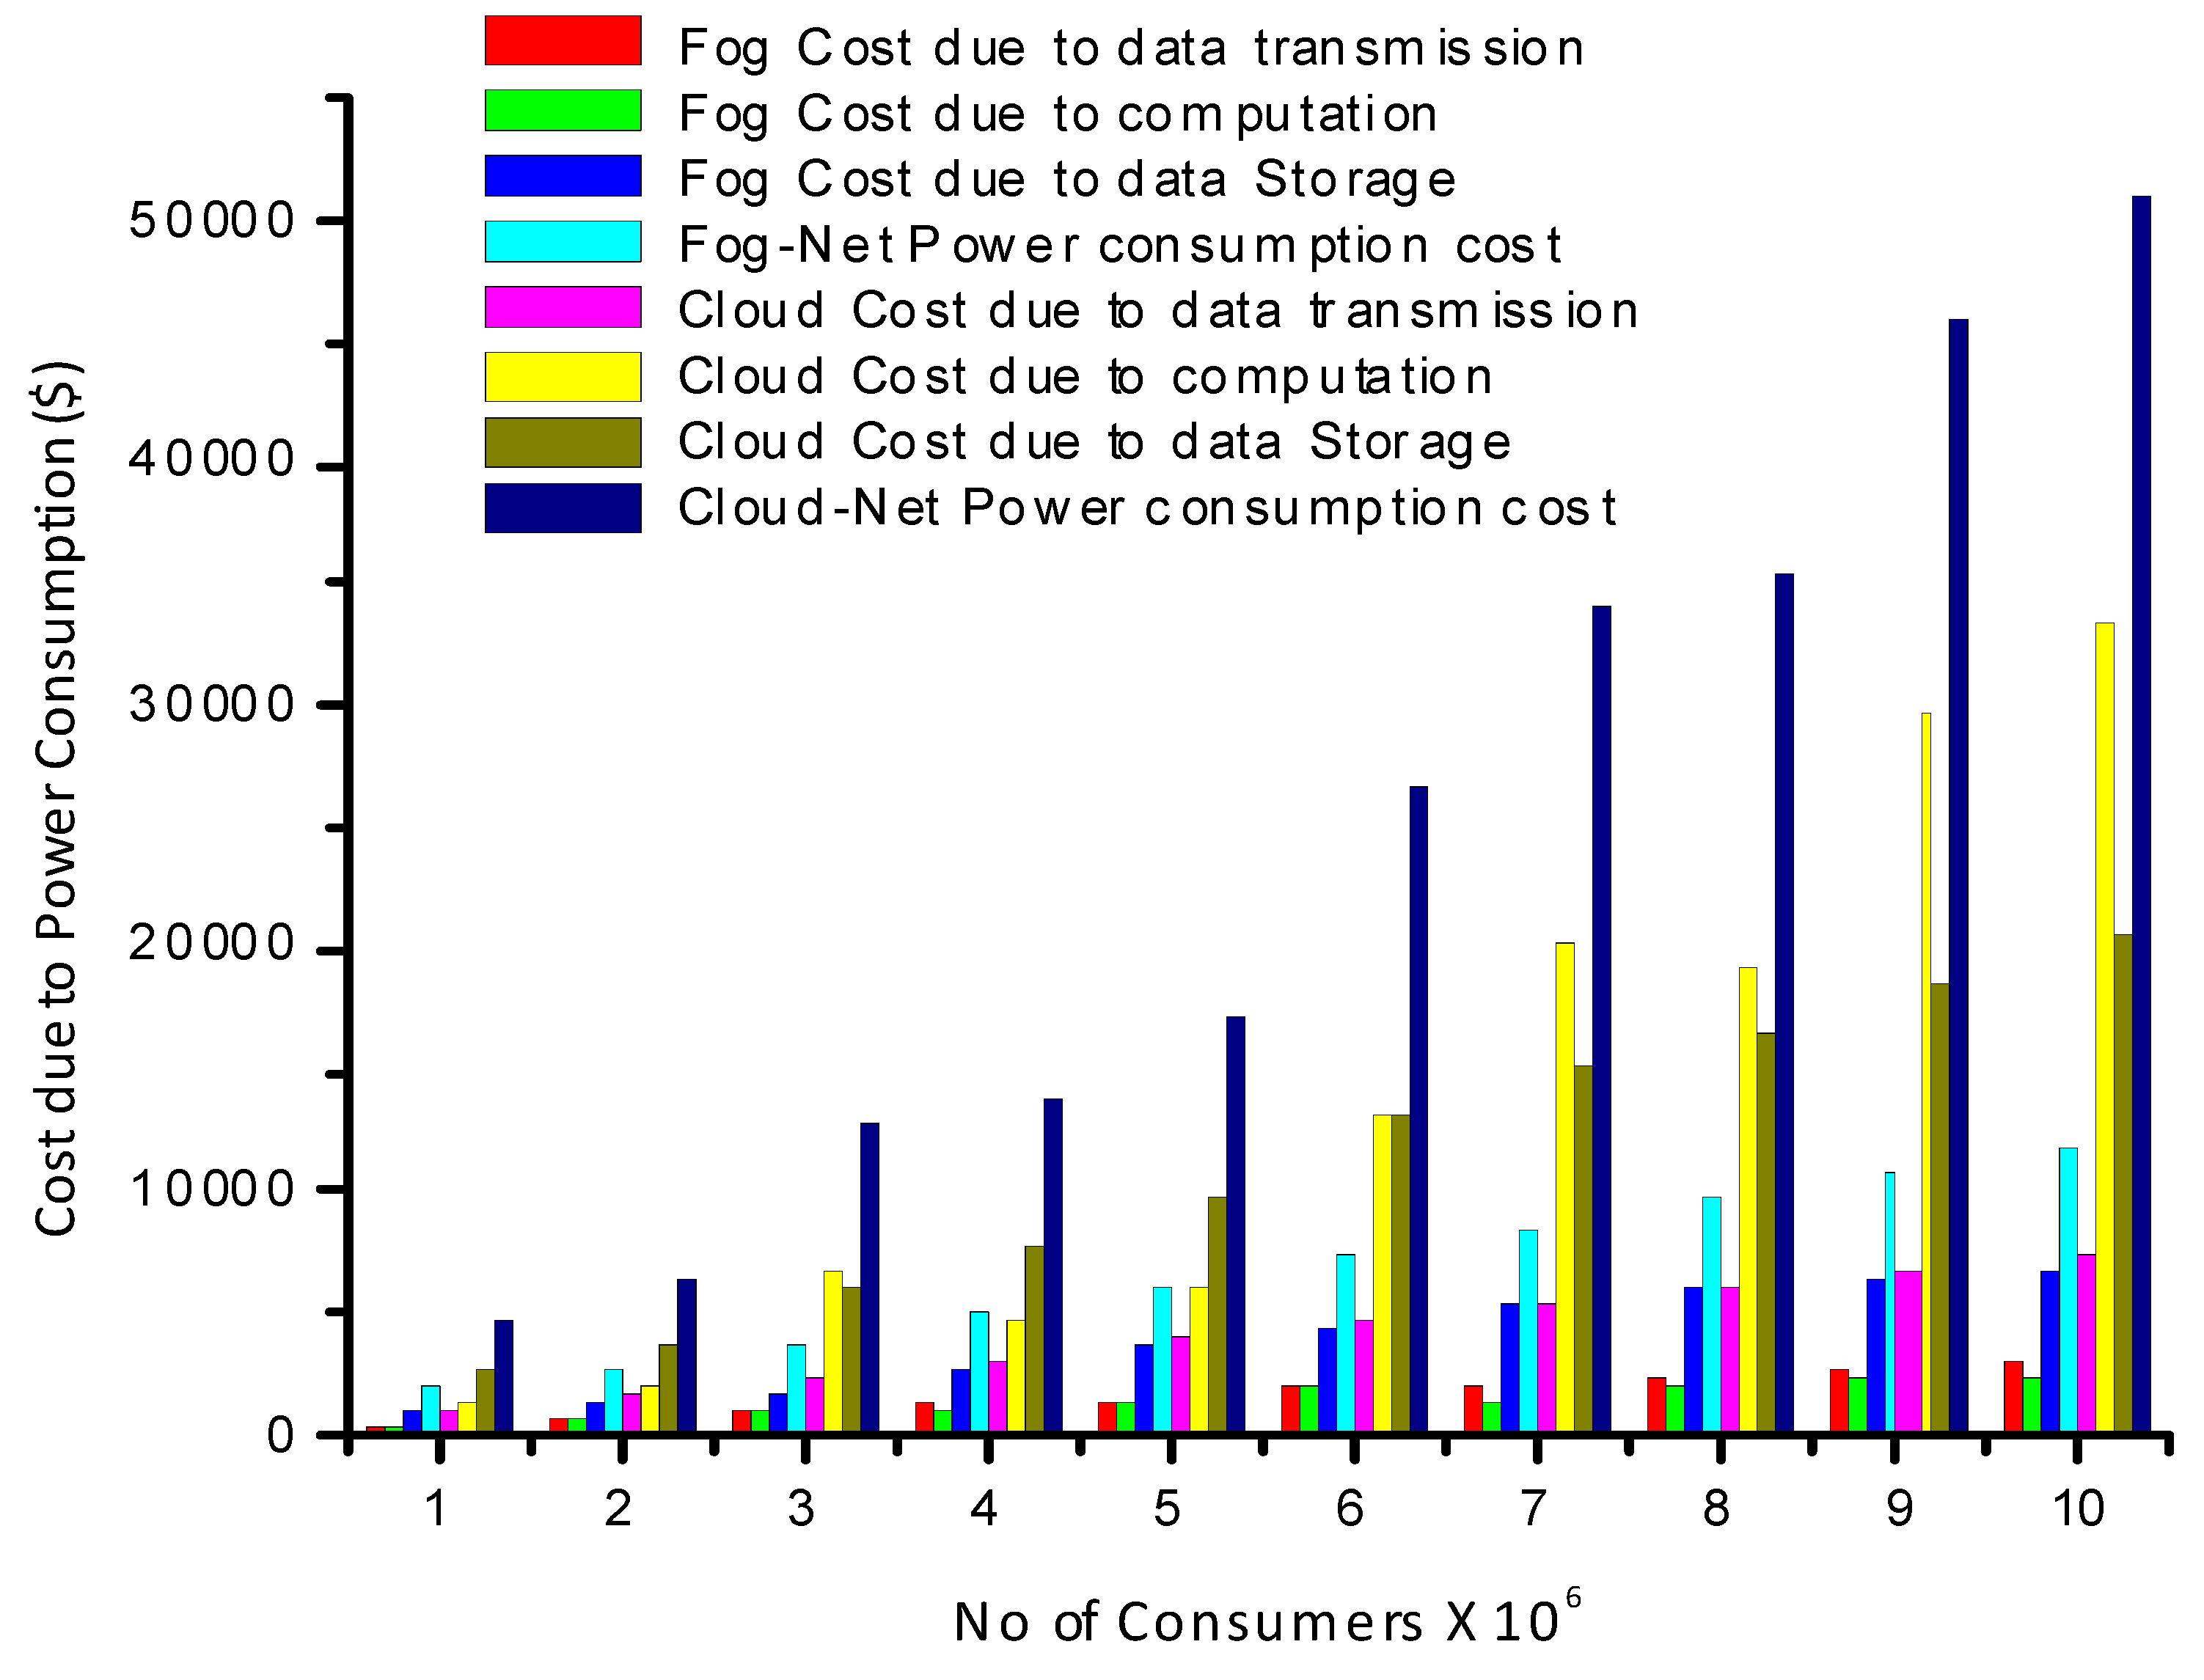
In
Figure 7 the electricity consumption pattern due to transmission/dispatch of each bytes-stream and computation (at both fog and cloud servers) is analyzed. It can be observed that with the rise in the population of service consumers the overall power consumption show near piece-wise linear growth and is significantly lower than the conventional cloud framework. The fog-assisted cloud framework betters the aggregated electricity consumption over the cloud computing paradigm by more than 44%.
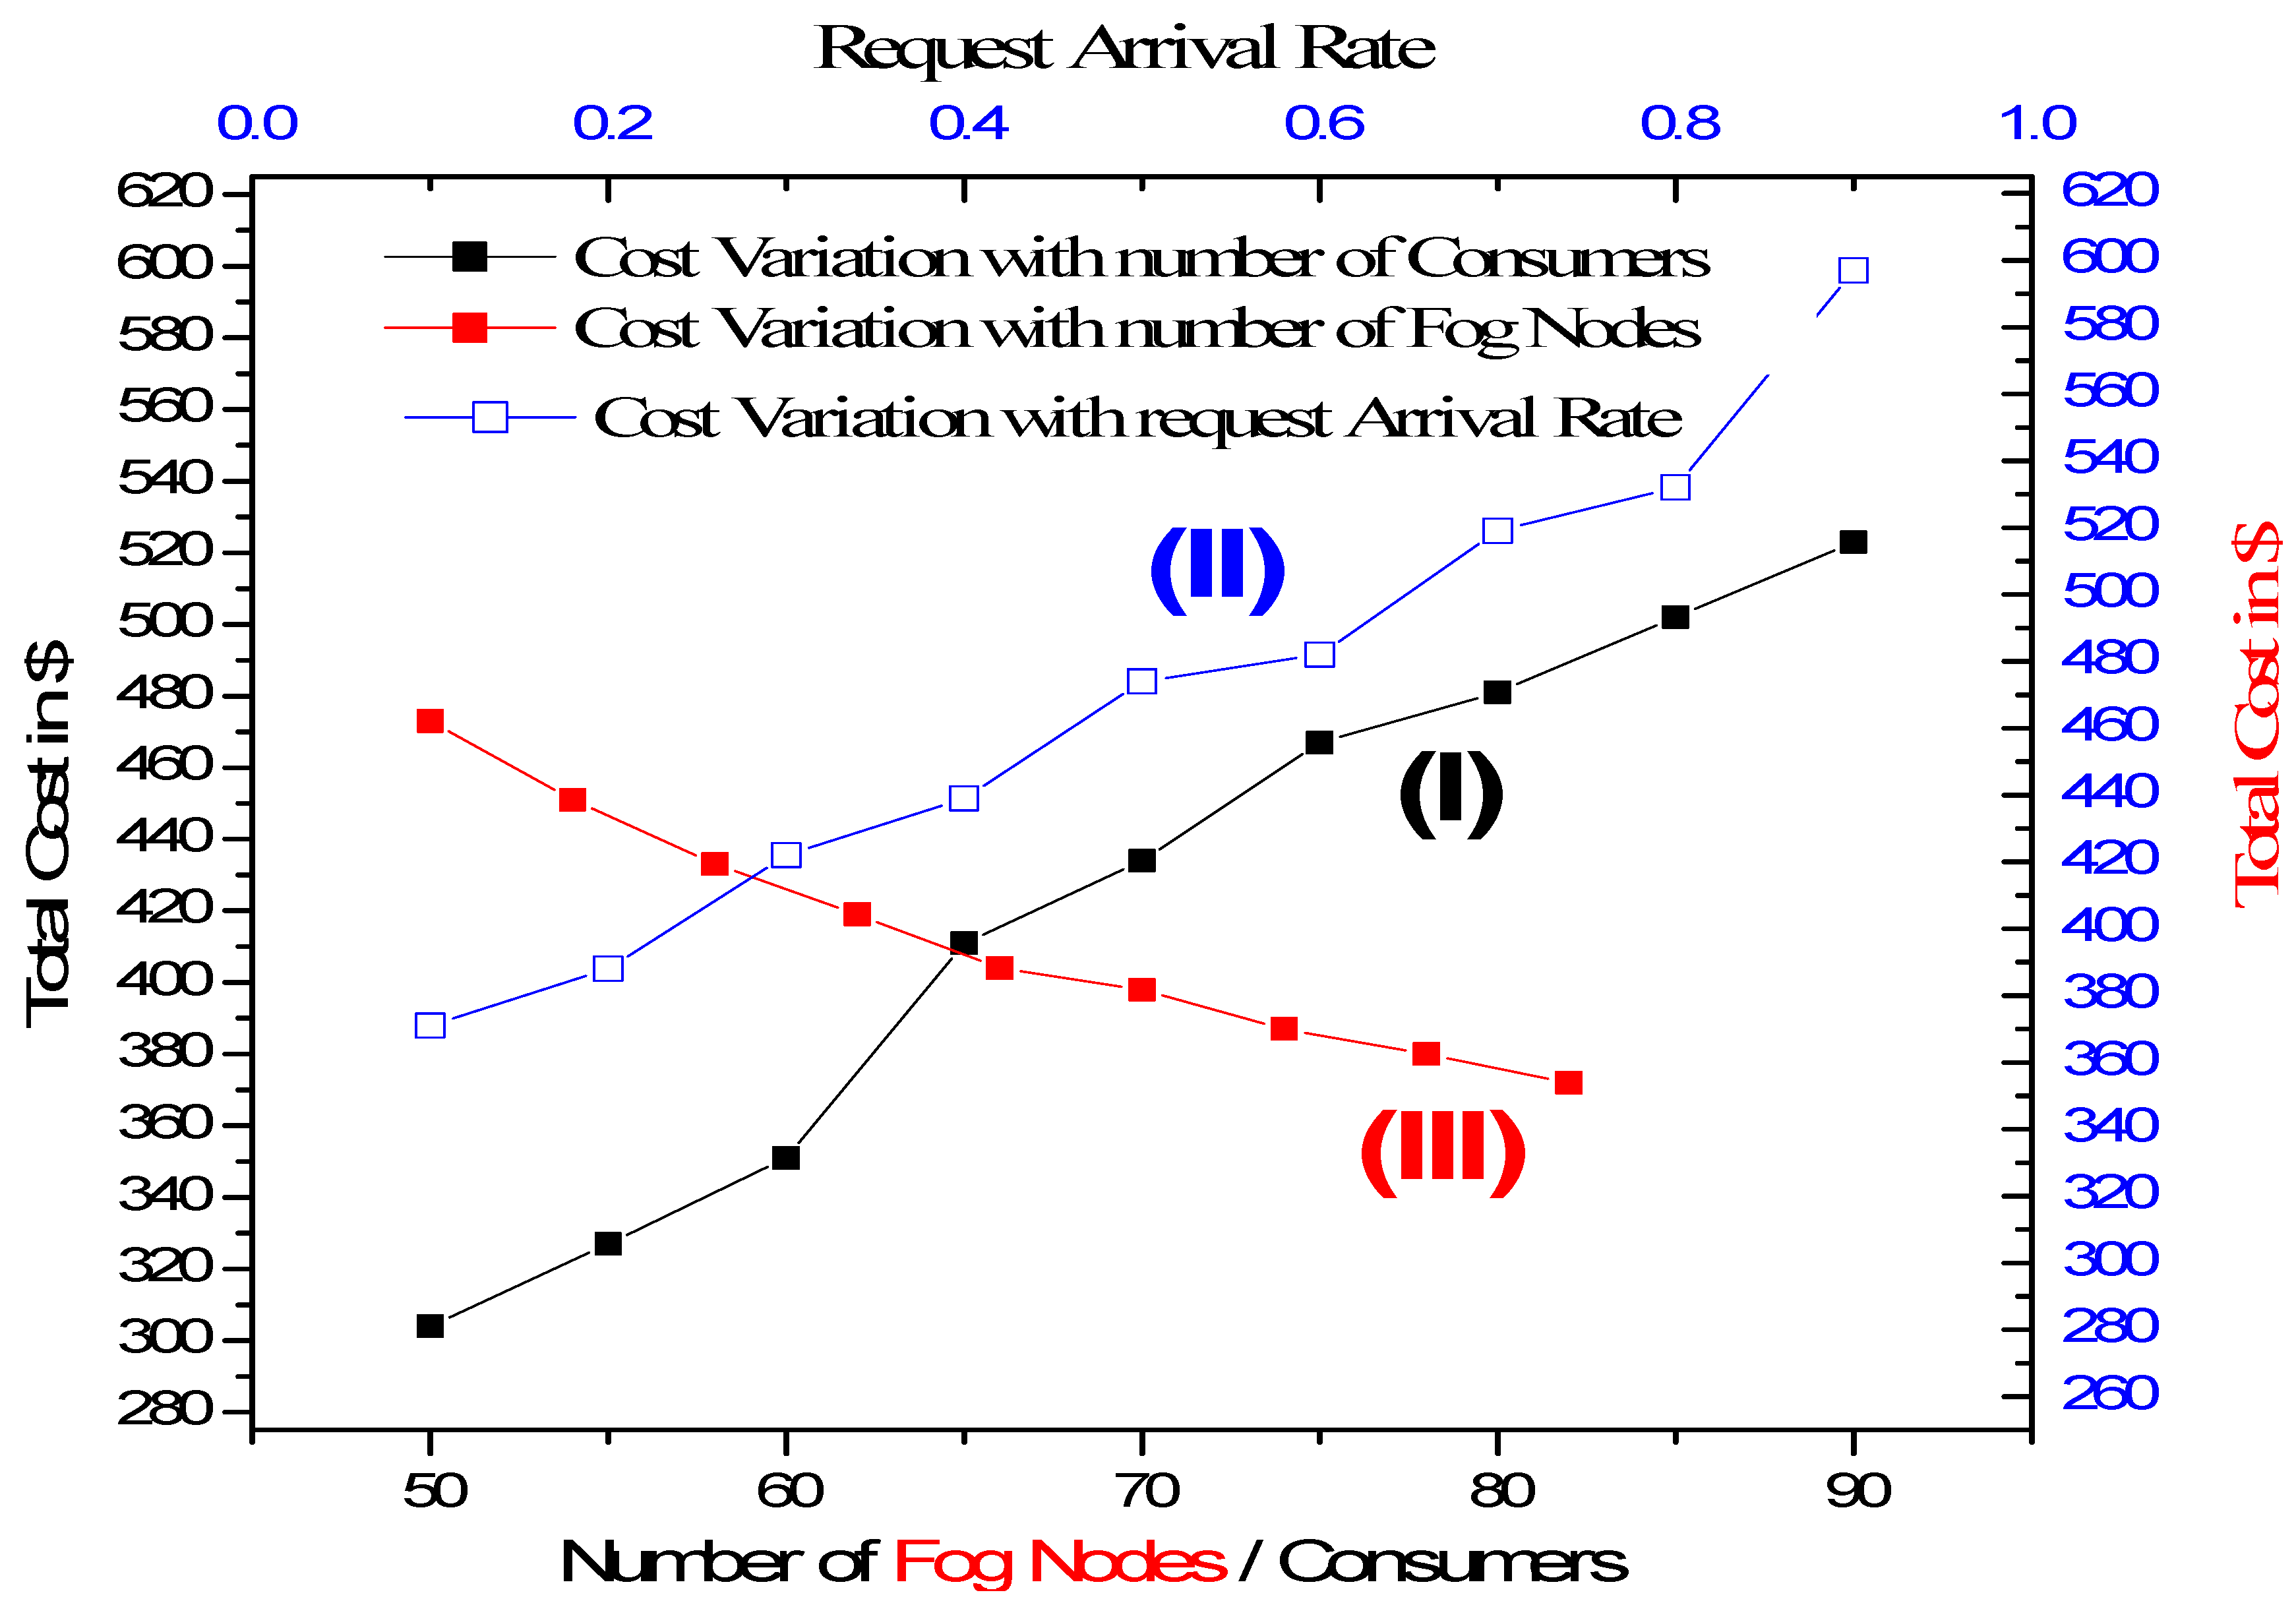
Figure 8 shows the variation of cost when the network parameters are varied, i.e., the number of application users, the data arrival rate, number of fog nodes, etc. For
Figure 8, the optimization model was run on a pilot network of only 80 users and 50 FCNs having five BUs allocated each fog nodes. Curve (I) shows the variation in the cost of architecture when the number of consumers are varied from 50 to 95. It is observed that the cost profile also shows a nearly piece-wise linear growth corresponding to rise in the population of fog customers. This supports the intuition that more customers will create more service requests, thus generating more data traffic and hence more VMs need to be deployed.
The cost variation against change in arrival rate is shown in curve II where the architecture also shows similar cost profile because in order to guarantee optimal QoS more BUs as well as processing resource are needed. Correspondingly the cost due to communication latencies also increases, thus augmenting the overall cost. However, if more and more fog nodes are deployed more efficiently the task will be accomplished and correspondingly better options for VM deployment. Similarly curve (III) illustrates the total cost as a decreasing function of the number of Fog Nodes. The cost of task distribution and virtual machine deployment algorithms decrease significantly when the network is populated with more number of FCNs, hence the total cost decreases.
6. Conclusions and Future Work
FC, when complemented with optimal workload allocation strategies, is able to support context-aware virtually real-time applications, providing improved computing performance, and geodistributed intelligence in SG ecosystems. In this work, we presented a fog-based data intensive analytics scheme with cost-efficient resource provisioning optimization approach that can be used for SG applications. In order to achieve QoS guaranteed FC execution strategies, we jointly examine user–FCN association, workload allocation, VM deployment, and communication network constraints towards minimizing the cost of architecture. For comparative performance assessment of cloud versus fog computing, we formulated an MINLP optimization problem, which is further solved using MDE algorithm. Exhaustive simulation results are presented to depict the enhanced performance of FC in terms of the provisioned QoS attributes, viz., service latency (response time), power consumption, and cost of architecture.
Such observations related to FC reveal its latent potential as a store and compute model for emerging IoE environments such as SG. For further conclusive insights, real-world trials need to be conducted on SG architectures. The efficacy of typical FC paradigm may be improved by embedding selective sensing intelligence in the edge nodes as well dedicated FCNs. Intelligent mobility management techniques for data generators and data consumers will potentially improve the performance of FC architectures.
