Article

Analysis of Nonlinear Bypass Route Computation for Wired and Wireless Network Cooperation Recovery System

1
Neko 9 Laboratories, Tokyo 140-0001, Japan
2
Graduate School of Engineering, Chiba University, Chiba 263-8522, Japan
*
Author to whom correspondence should be addressed.
Big Data Cogn. Comput. 2018, 2(3), 28; https://doi.org/10.3390/bdcc2030028
Submission received: 23 July 2018 / Revised: 24 August 2018 / Accepted: 28 August 2018 / Published: 3 September 2018

Abstract

:
It is a significant issue for network carriers to immediately restore telecommunication services when a disaster occurs. A wired and wireless network cooperation (NeCo) system was proposed to address this problem. The goal of the NeCo system is quick and high-throughput recovery of telecommunication services in the disaster area using single-hop wireless links backhauled by wired networks. It establishes wireless bypass routes between widely deployed leaf nodes to relay packets to and from dead nodes whose normal wired communication channels are disrupted. In the previous study, the optimal routes for wireless links were calculated to maximize the expected physical layer throughput by solving a binary integer programming problem. However, the routing method did not consider throughput reduction caused by sharing of wireless resources among dead nodes. Therefore, this paper proposes a nonlinear bypass route computation method considering the wireless resource sharing among dead nodes for the NeCo system. Monte Carlo base approach is applied since the nonlinear programming problem is difficult to solve. The performance of the proposed routing method is evaluated with computer simulations and it was confirmed that bandwidth division loss can be avoided with the proposed method.

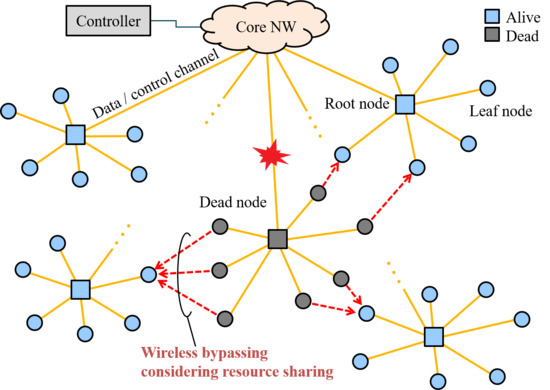
Graphical Abstract

1. Introduction

The world is often stricken by catastrophic disasters, e.g. earthquakes, hurricanes, and tsunamis [1,2]. In recent years, telecommunication services are indispensable for both emergency responders and civilians to perform disaster-response operations and confirm the safety of their families and friends. However, it is also often disrupted in disaster period. In particular, wired networks are sensitive to disasters because of fiber cable disconnections [3]. Wired network systems including passive optical networks (PONs), which prevail among today’s access networks, are employed to provide fiber-to-the-home (FTTH) services and backhaul and fronthaul for cellular networks [4]. Therefore, it is a significant problem for network carriers to restore telecommunication services in the disaster-stricken area as soon as possible. Furthermore, considering the rapid growth of Internet of Things (IoT) applications [5], the fault tolerance of optical networks is also essential for stably forwarding big sensor data [6,7].
A conventional approach for the quick recovery of optical networks is to employ redundant systems [8,9,10]. Since their target is restoring local systems, redundant systems are not strong candidates for the disaster recovery where wide range of failures must be dealt with. It has been considered that wireless network technologies can provide alternative communication means over a wide area to compensate failures of wired networks. Most existing schemes to recover communication services have focused on deploying multi-hop wireless networks in the disrupted area due to the disaster [11,12,13]. A use of portable mobile base stations was investigated in [14]. A wireless multi-hop backhauled network powered by renewable energy was developed in [15]. The use of solar power was conceived to provide energy to networks disrupted by disasters [16]. With these schemes, wireless networks can be flexibly deployed to restore telecommunication services in a wide area. However, it was a significant problem that they lack promptness because they are deployed after disaster occurs. In addition, the achievable throughput of wireless links is basically in inverse proportion to the number of hops to the destination in wireless mesh networks [17]. Thus, a recovery scheme that can achieve both quick-recovery and high-throughput was required.
Furthermore, hybrid architectures such as wireless-optical broadband access network (WOBAN) [18,19] and fiber-wireless (FiWi) networks [20,21] have been investigated to ensure the robustness of optical networks. In these architectures, wireless routers are extensively deployed, and they compose mesh networks in the front-end of PON systems. Traffic disrupted by failures in optical networks is rerouted via the wireless mesh network in the front-end. These architectures are possible candidates for improving the survivability of optical networks against disasters. However, there exist concerns about cost and throughput. That is, deploying a huge number of wireless routers is troublesome and expensive for network operators; it is difficult to place and maintain numerous routers in a wide area. Moreover, the reduced hop length is preferable to assure higher wireless link throughput because it rapidly falls with the increase of hop counts [17].
To address this problem, the wired and wireless network cooperation (NeCo) system was proposed [22,23,24]. It can immediately establish high-rate single-hop wireless bypass links between widely deployed leaf nodes to relay packets to and from dead nodes whose normal wired communication channels are disrupted by a disaster. The optimal routes are calculated to maximize the expected physical layer wireless transmission rate. However, the previously proposed routing method did not consider throughput reduction caused by sharing of wireless resources among dead nodes [25]. When multiple dead nodes are bypassed to the specified alive node, their transmission rates are expected to decrease due to sharing of limited spectral resources. Therefore, this paper proposes a novel bypass route computation method considering the wireless resource sharing. Since it modifies the objective function to a nonlinear programming problem, a Monte Carlo based approach is employed for easily solving the problem.
The rest of the paper is organized as follows. Section 2 describes the system model with brief summary of previous proposal. Section 3 presents the newly proposed nonlinear routing method. Section 4 shows computer simulation results. Section 5 concludes this paper.

2. NeCo System

This section introduces the previously proposed NeCo system, on which the proposal in this paper is based. First, the system overview and recovery sequence is explained in Section 2.1. Then, the bypass routing method is described in Section 2.2.

2.1. Overview

The purpose of the NeCo system is to quickly recover communication services after a disaster. Figure 1 depicts the concept of the NeCo system. The root nodes are installed in central offices. They are connected to core networks to forward traffic to/from the Internet. The leaf nodes are widely deployed to provide access services such as FTTH and mobile, and they are connected to the root nodes using optical networks. The topology of optical networks can be point-to-point and point-to-multipoint including PON. Each leaf node establishes a logical connection called control channel with a controller which is installed in a remote server. In normal periods, as shown in Figure 1a, leaf nodes send/receive traffic to/from the root nodes via the optical networks. When a disaster occurs, wireless bypass routes are established between alive nodes and dead nodes whose normal communication channel is disrupted, as shown in Figure 1b.
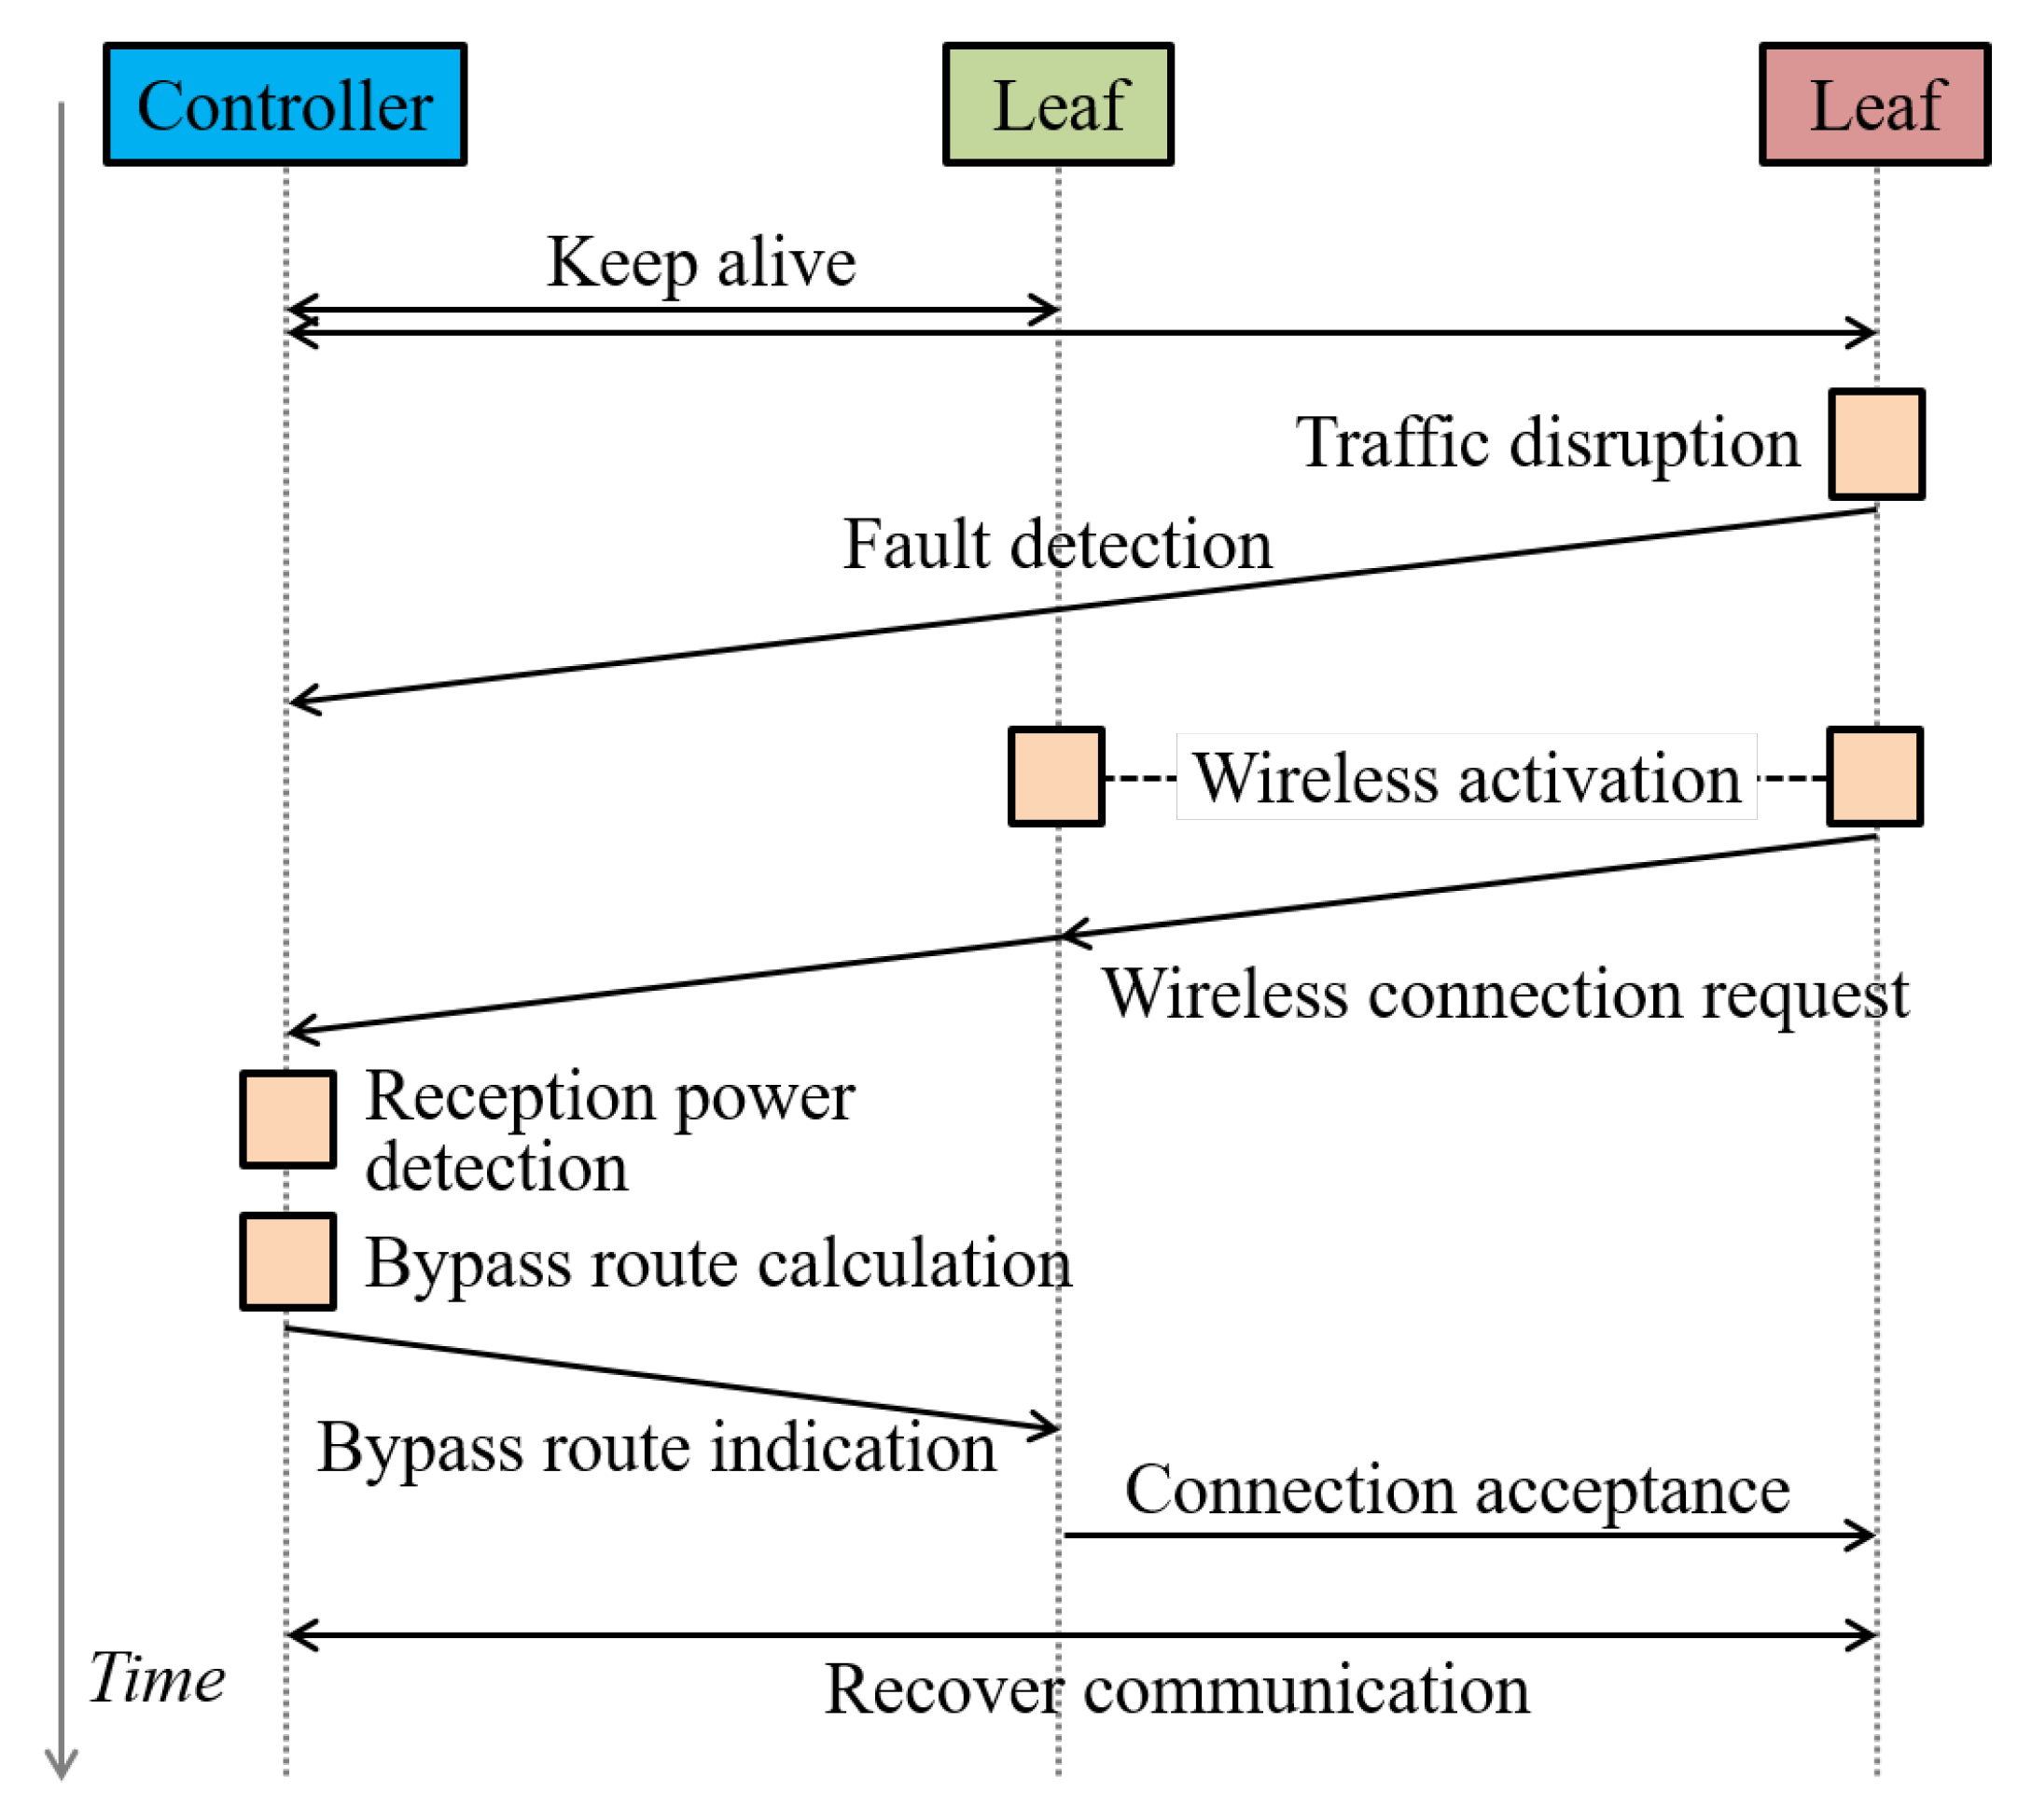
The recovery sequence of the NeCo system is shown in Figure 2. The controller periodically checks the states of leaf nodes using keep alive messages. When a traffic disruption occurs, the controller detects it and the state of the leaf node becomes dead. Then, all leaf nodes activate their wireless communication function which is deactivated in normal periods. The dead nodes broadcast wireless connection requests to other leaf nodes. The alive nodes report the reception power of the received signals to the controller. Utilizing acquired information on the reception power, the controller computes the optimal wireless bypass routes to maximize the throughput. It indicates the computed results to the alive nodes. Following the indication, they send connection requests to designated dead nodes. Consequently, dead nodes can recover communication to core networks using the established bypass routes.

2.2. Routing

The bypass route calculation was formulated as a linear programming problem in the previous study. Here, we summarize the formulation in the previous study [23] to clearly explain the proposed method of this paper in the next section. The objective of the routing is to maximize the total expected throughput of bypass routes. The definition of used variables are the following. i and j denote the identifiers for the leaf nodes. A binary parameter y j represents the state of j-th node; if j-th node is alive y j = 1 is satisfied, and otherwise y j = 0 . A binary parameter x i , j denotes the state of wireless link between i-th and j-th nodes; x i , j = 1 means that i-th node is connected to j-th node, and x i , j = 0 otherwise. The achievable physical layer wireless transmission rate between i-th and j-th nodes is denoted as d i , j , which is decided by the reception power between them. In the case of i = j , d i , i = 1 is defined. There is a limitation of the number of wireless links connected to an alive node at the same time; A j denotes the maximum number of nodes linked to j-th node. It should be pointed that the achievable bandwidth decreases in accordance with the number of bypass links to the same alive node. This is because the wireless bandwidth is shared among them. Based on the definitions above, the bypass route computation is formulated as:
Max i j x i , j d i , j
s . t . y j = x j , j j
y j d i , j x i , j 0 i , j
j x i , j 1 i
i x i , j A j + 1 j
x i , j = 0 , 1
The objective function formulated in Equation (1) is to maximize the total expected physical layer transmission rate of established bypass routes. To ensure that there is no bypass route for an alive node, x j , j = 1 is defined for y j = 1 in Equation (2). A dead node can be connected to an alive and reachable node; i-th dead node can be linked to j-th node that satisfies y j = 1 and d i , j > 0 as formulated in Equation (3). Establishing multiple wireless links from a dead node is not considered; the maximum number of bypass routes for a dead node is one (Equation (4)). The constraint for the maximum number of dead nodes connected to an alive node is formulated in Equation (5).
With this formulation, the total expected physical layer wireless link rate is maximized based on the signal reception power between leaf nodes. This linear programming problem is easy to solve, however, it does not consider the division loss in throughput due to the shared wireless bandwidth among multiple dead nodes connected to the same alive node. When multiple dead nodes are linked to the same alive node, the achievable throughput is reduced more than the expected value calculated in the formulation above. This throughput degradation would become non-negligible if A j is set to a large value.

3. Proposed Routing

This section describes the proposed routing method. First, the concept is introduced in Section 3.1. Second, Section 3.2 describes the formulation. Then, the detail of routing algorithm is elaborated in Section 3.3.

3.1. Concept

This paper proposes a routing method considering the shared wireless bandwidth among multiple dead nodes. The formulation described in Section 2.2 is modified to a nonlinear programming problem. With the proposed routing method, better bypass routes with higher throughput can be found even if overlapped routes increase with the previous method.

3.2. Formulation

The objective function is total expected throughput observed in alive nodes. It is defined as the physical layer wireless transmission rate determined by the reception power and the bandwidth sharing. Generally, multiple access is performed in time or frequency domains which are limited spectral resources (bandwidth). When several dead nodes are bypassed to the specified alive node, their respective achievable transmission rate decreases. A key modification to the previous objective function in Equation (1) is to consider the bandwidth division by i x i , j . Thus, the nonlinear programming problems is:
Max i j x i , j d i , j i x i , j
s . t . y j = x j , j j
y j d i , j x i , j 0 i , j
j x i , j 1 i
i x i , j A j + 1 j
x i , j = 0 , 1

3.3. Algorithm

A nonlinear programming problem is difficult to solve with a general solver which can efficiently solve linear programming problems. Thus, in this paper, we employ a Monte Carlo based approach to solve the nonlinear problem. First, the initial bypass routes are chosen by random selection considering the constraints. In the random process, the occurrence probabilities of each route are proportionally distributed as their reception powers. Let p i , j denote the probability that x i , j = 1 is satisfied in this random selection. p i , j is formulated as
p i , j = y j d i , j j y j d i , j ( j y j d i , j > 0 ) 0 ( j y j d i , j = 0 )
In Equation (11), p i , j = 0 means that ith node cannot connect to jth node with a wireless link. This is caused by two conditions: (a) jth node is also dead, which is denoted as y j = 0 ; or (b) the reception power of wireless transmission between these nodes is too weak, which is denoted as d i , j = 0 . If either of the two conditions is satisfied, y j d i , j = 0 , p i , j = 0 . If y j d i , j = 0 is satisfied for all j, p i , j is defined as 0, as shown in the second case of Equation (11).
With this approach, the routes with larger reception power are more likely to be selected. Based on the selected routes, the objective function is calculated. Then, the bypass routes are randomly selected again. After a certain number of iterations, the best routes that maximizes the objective function are selected.
The procedure of the proposed method is described in Algorithm 1. In the algorithm, M denotes the number of iterations and we define P = { p 0 , 0 , p 0 , 1 } and X = { x 0 , 0 , x 0 , 1 } .
Algorithm 1 Route calculation algorithm.
1:
P G e t P r o b a b i l i t y ( )
2:
c 0
3:
while c < M do
4:
     X G e t R o u t e ( )
5:
     f G e t O b j e c t i v e F u n c t i o n ( )
6:
    if f > f M a x then
7:
         f M a x f
8:
         X b e s t X
9:
     c c + 1
10:
X X b e s t

4. Computer Simulation

The performance of the proposed routing method was evaluated through computer simulations. This section describes the results of performance evaluation.

4.1. Simulation Condition

4.1.1. Transceiver Definitions

General simulation parameters are listed in Table 1. Wireless network simulator thoroughly follows the IEEE802.11ac specification [26] assuming that can be mounted on nodes at low cost. Each node is assumed to employ 4.97 GHz band for outdoor use [27] and have a single omni-directional antenna commonly used for transmission and reception. Transmission power is set to 23 dBm with 40 MHz bandwidth and antenna gain is assumed to be 13 dBi gain to enable long distance communication. The simulation is event-driven [28,29]. It proceeds per 1 μ s step, and detailed procedures are implemented: exponential backoff, data packet transmission with acknowledge (ACK) response, carrier sense, collision detection and retransmission. Each node works in a distributed manner and avoids co-channel interference via carrier sense multiple access with collision avoidance (CSMA/CA) protocol. One of key parameters is the transmission duration T t x depending on physical layer (PHY) level transmission rate. Suppose short guard interval (GI) and low density parity check (LDPC) code in 1500 bytes packet length, values of T t x according to respective modulation and coding scheme (MCS) parameters can be derived as summarized in Table 2. Its detailed formulation can also be seen in [25]. Since all nodes are in carrier sense range, request-to-send (RTS) and clear-to-send (CTS) handshakes are not used to prevent throughput performance reduction from unnecessary overhead. RTS/CTS is not always the reasonable way to establish the stable communication in a distributed manner. It is proven that throughput performance of Basic mode outperforms RTS/CTS mode when the number of wireless nodes in contention is not so large [30].

4.1.2. Channel and Traffic Models

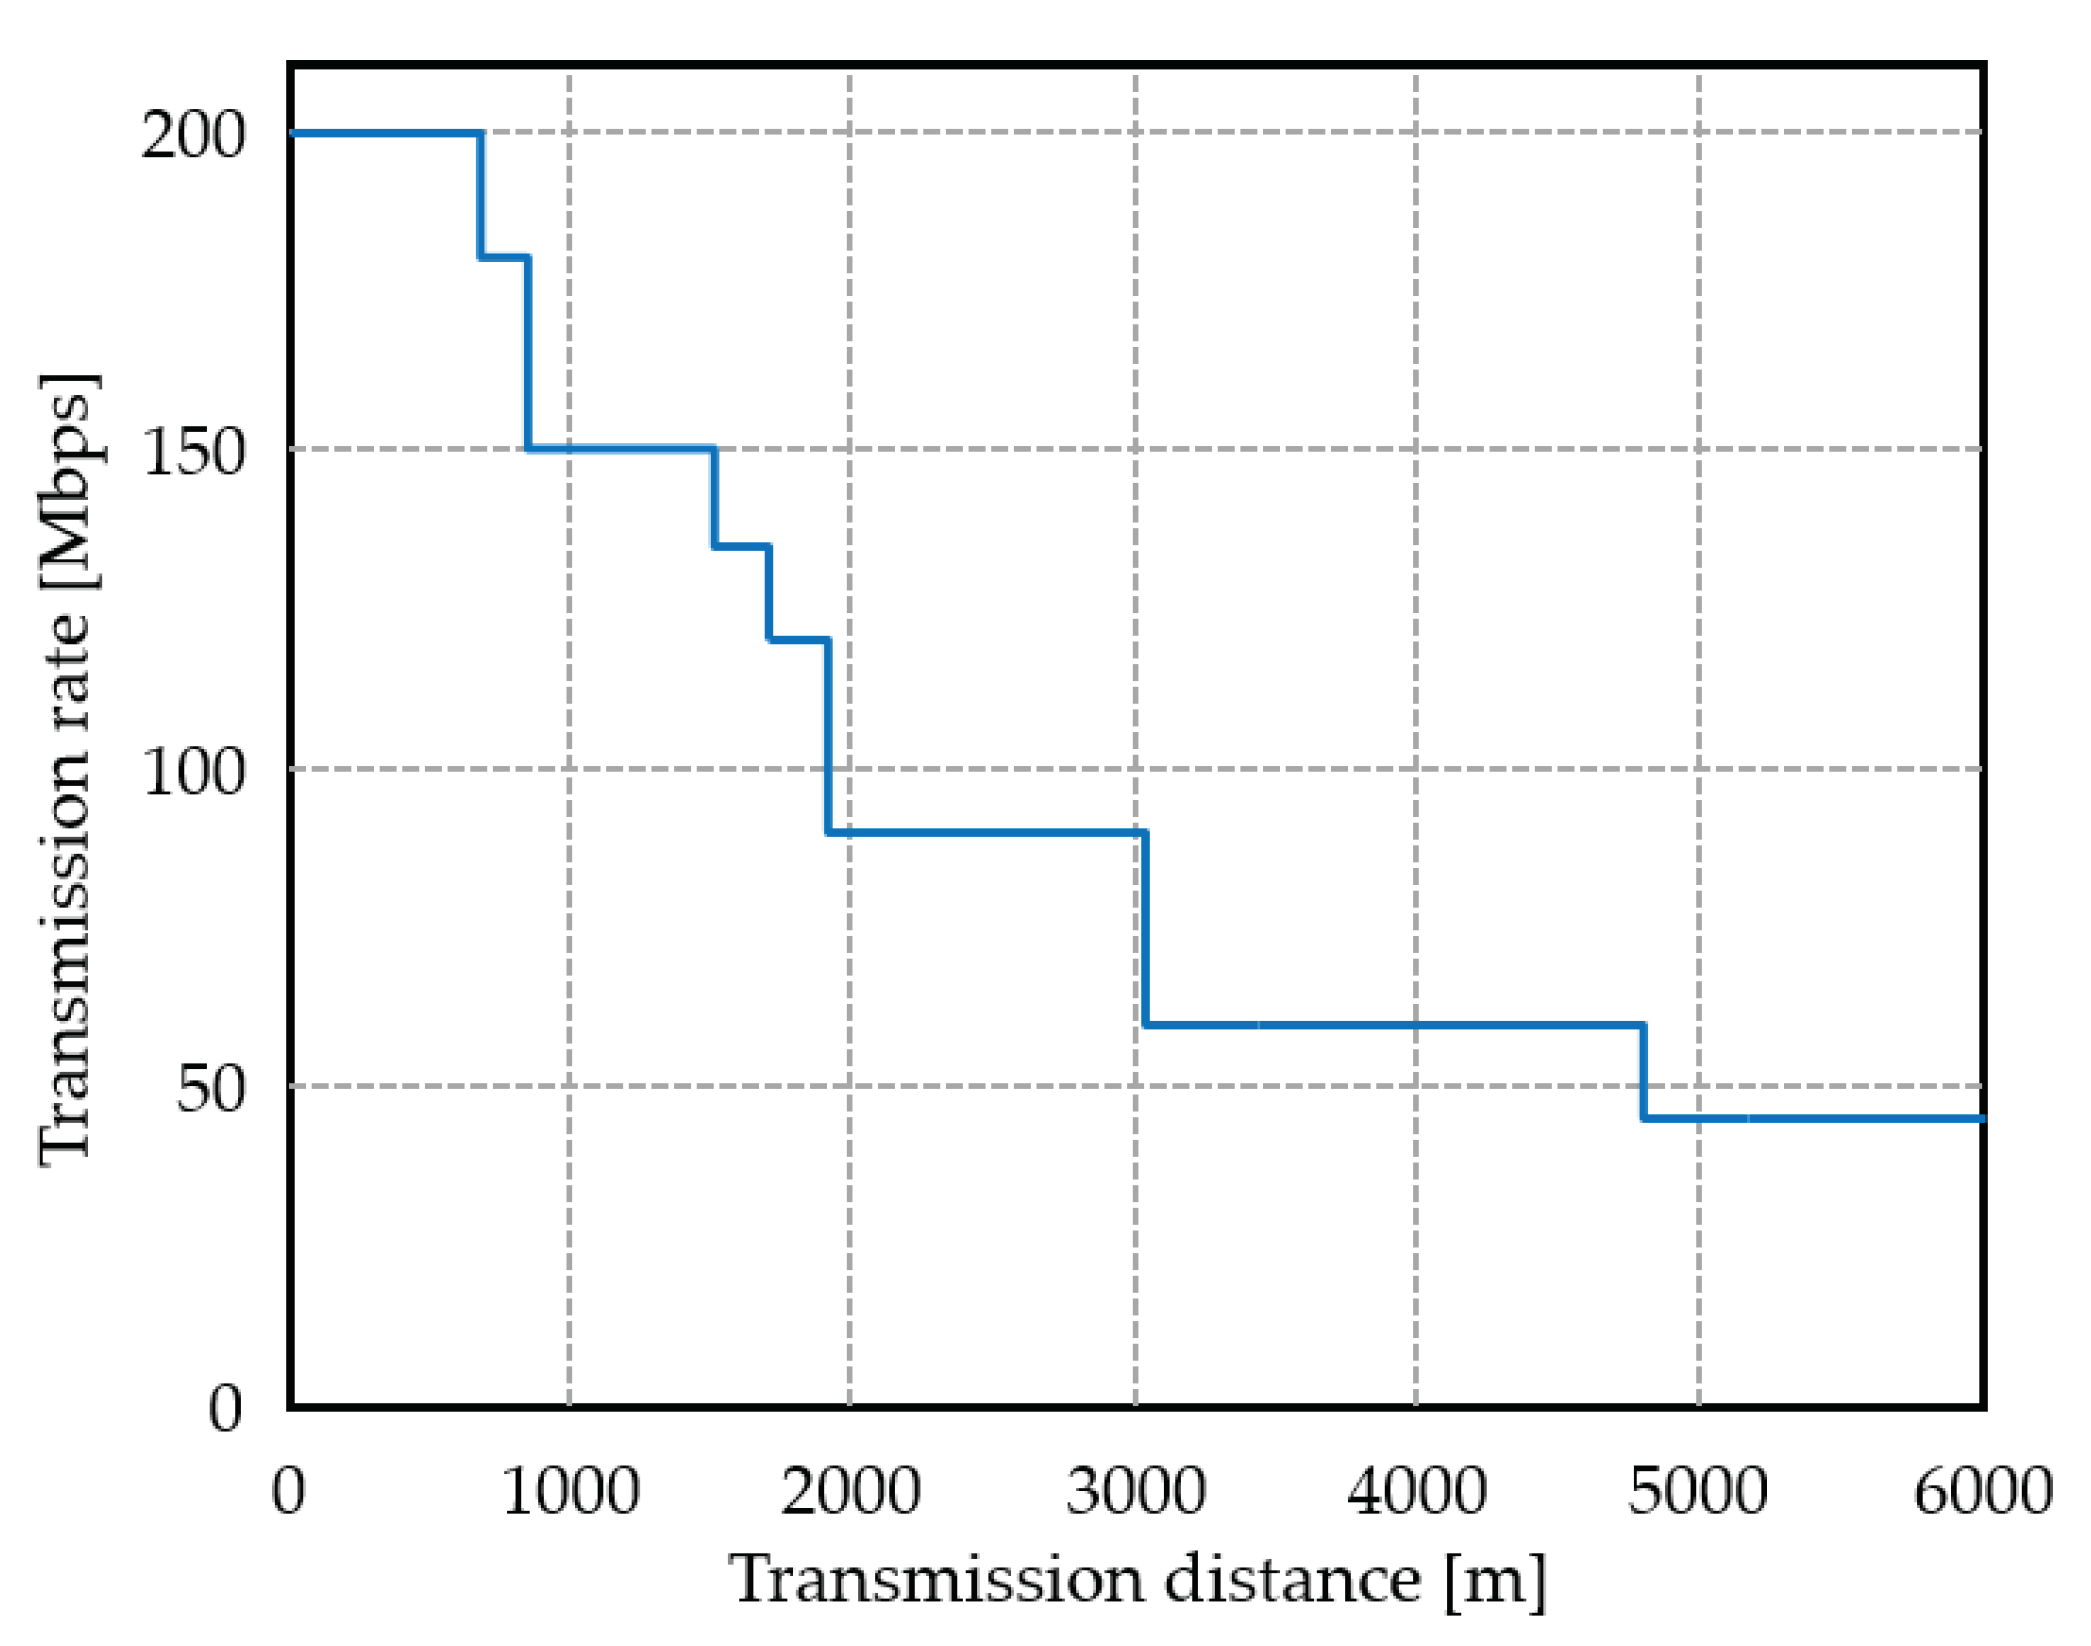
Wireless nodes or their antennas are installed at the top of buildings to ensure long-range communication even in the disaster situation. In this case, line-of-sight (LoS) propagation channel can be expected and this fact was validated in our past experimental studies [33]. Free space propagation model is assumed in the evaluation. Considering simplicity and visibility are the subjects of this study, shadow fading is not considered; reception power directly depends on the distance between wireless nodes. Shadow fading, i.e., long-term fluctuation of received signal power, cannot affect our proposed solution since it attempts to connect nodes by use of signal strength. If shadow fading attenuated some of the propagation links, it is excluded from the routing candidate. In [24], we considered shadowing effect but the effectiveness of our proposal has been unchangeably confirmed. This assumption does not lose generality. From above settings, the achievable transmission rate versus transmission distance can be derived, as shown in Figure 3.
Traffic model follows a Poisson origination. The number of data packets per session is determined at random based on the log-normal distribution. Its mean value is 20 packets for downlink (DL) and 3 packets for uplink (UL) [31]. Here, downlink flow is defined as the transmission from the alive node to the dead node. The ratio of the total offered load of downlink to uplink is set to 6:1 [32]. User datagram protocol (UDP) traffic is assumed but considering bidirectional traffic can imitate transmission control protocol (TCP) as well. We then focus on medium access control (MAC) level performance. Occurred packets are queued into the buffer dedicated for each destination node with a first-in first-out (FIFO) manner. Subject of the throughput calculation is only successfully received packets at the receiver.

4.1.3. Evaluation Metrics

This paper observes two performance metrics: system throughput and average delay. System throughput Γ (bps) is defined as aggregated MAC level throughput for all packet transmissions successfully delivered to a destination. It is expressed as,
Γ = 1500 × 8 N r x T s i m
where N r x and T s i m represent the total number of received packet and simulation period, respectively. A 1500 bytes data packet size is assumed. Average packet delay T d e l a y is then defined as,
T d e l a y = 1 N r x k = 1 N r x T r x , k T b u f , k
where T b u f , k is the instant when the k-th packet is buffered to the transmission node and T r x , k is the instant when the packet is successfully received. Simulation is carried out for T s i m = 120 s which ensures a good convergence.

4.2. Simulation Results

4.2.1. Fundamental Analysis in Simplified Topology

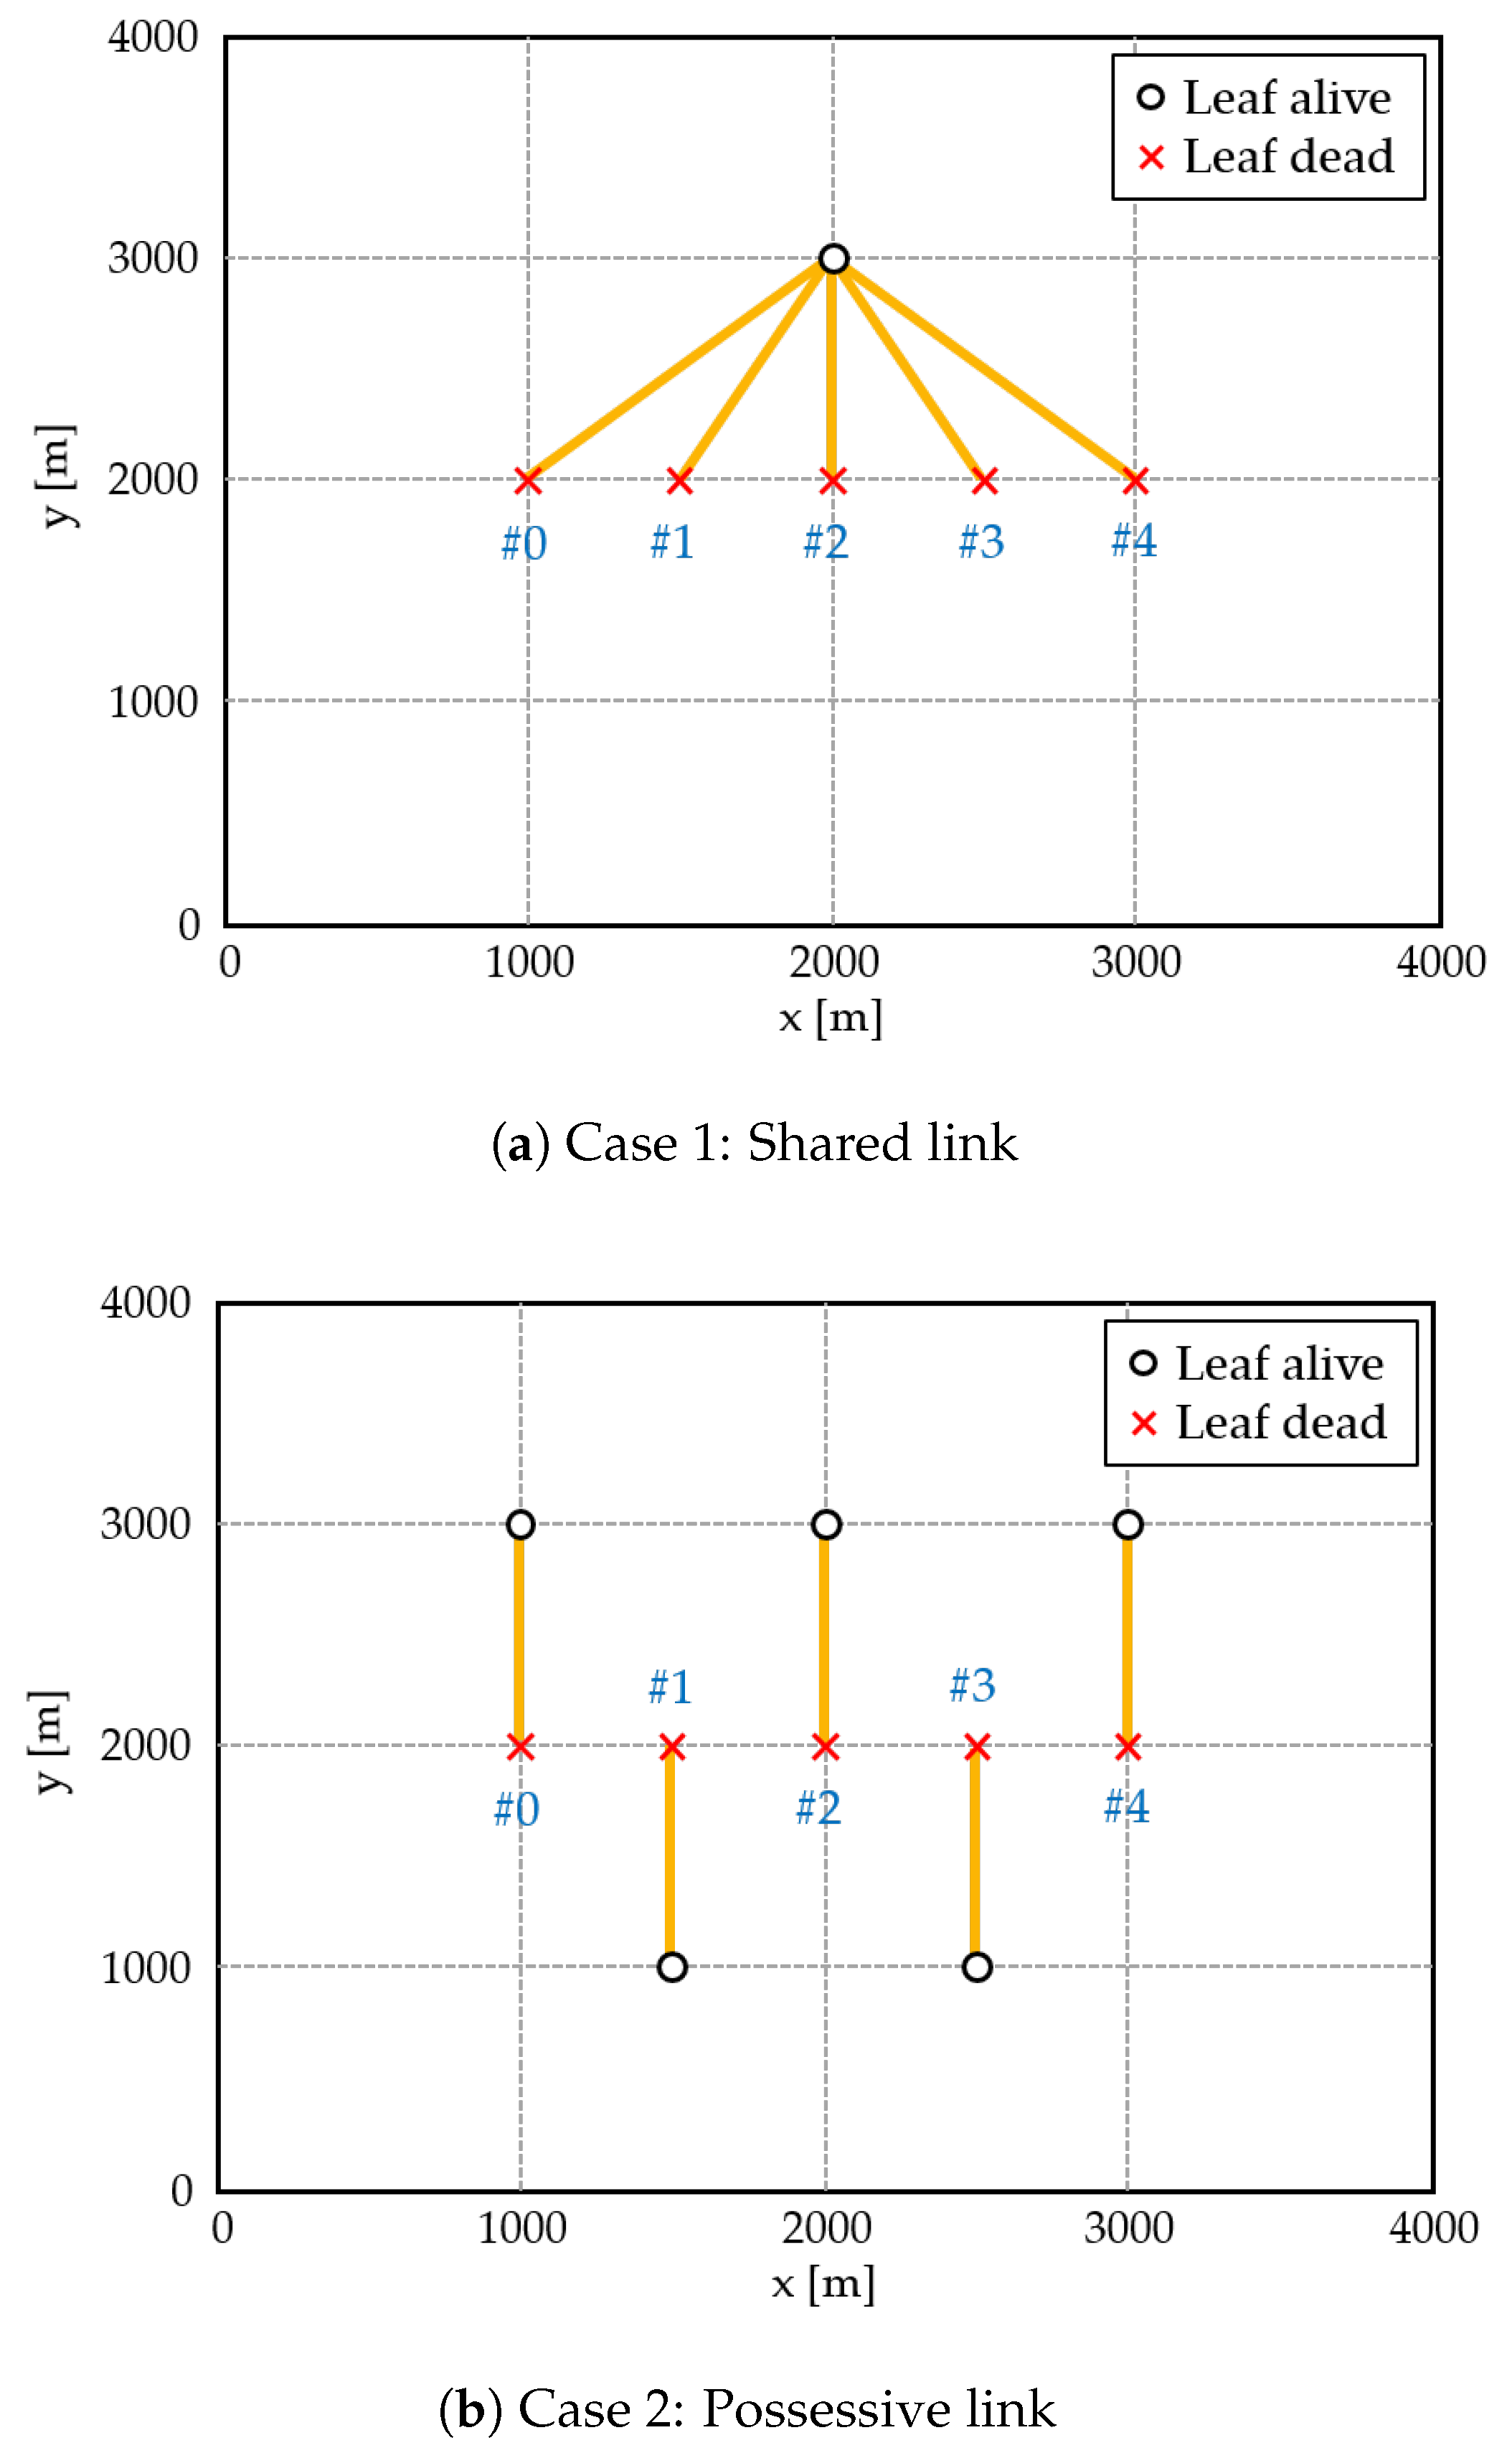
Prior to the verification of the proposed formulation, the effectiveness of the concept using simplified topologies is first validated. The following provides two routing conditions, as shown in Figure 4.
  • Case 1: Shared link. All dead nodes are connected to one alive node.
  • Case 2: Possessive link. Each node is connected to one alive node.
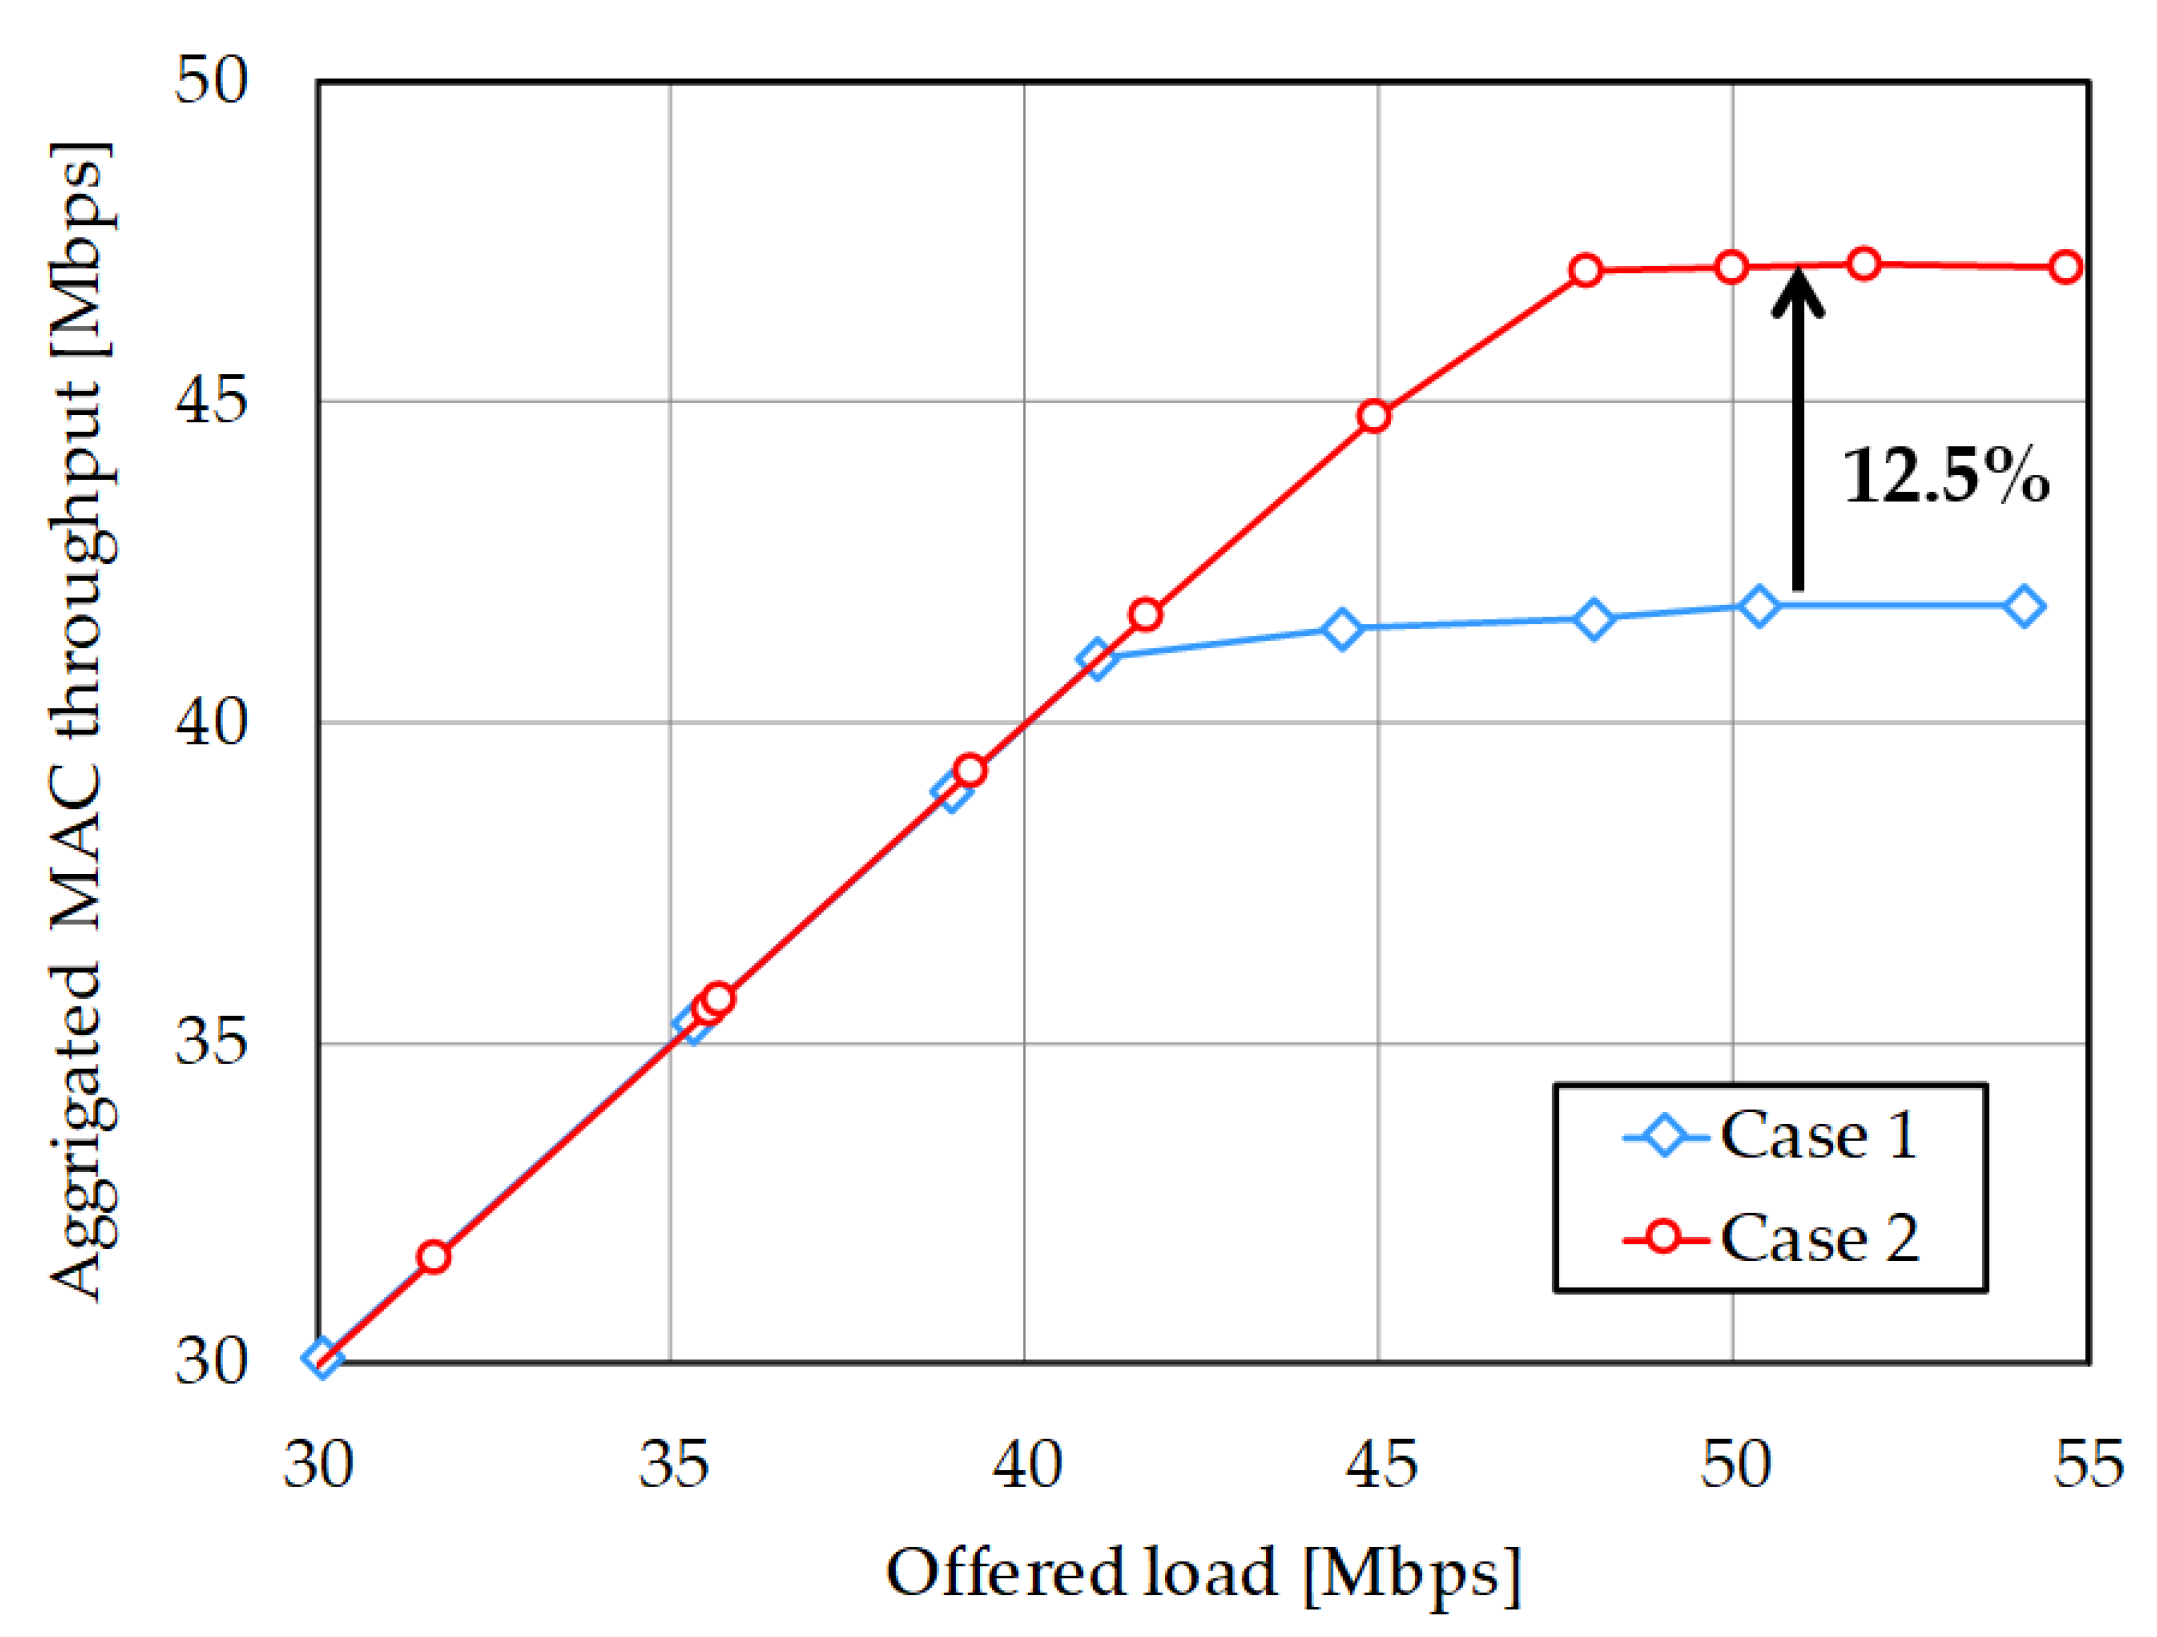
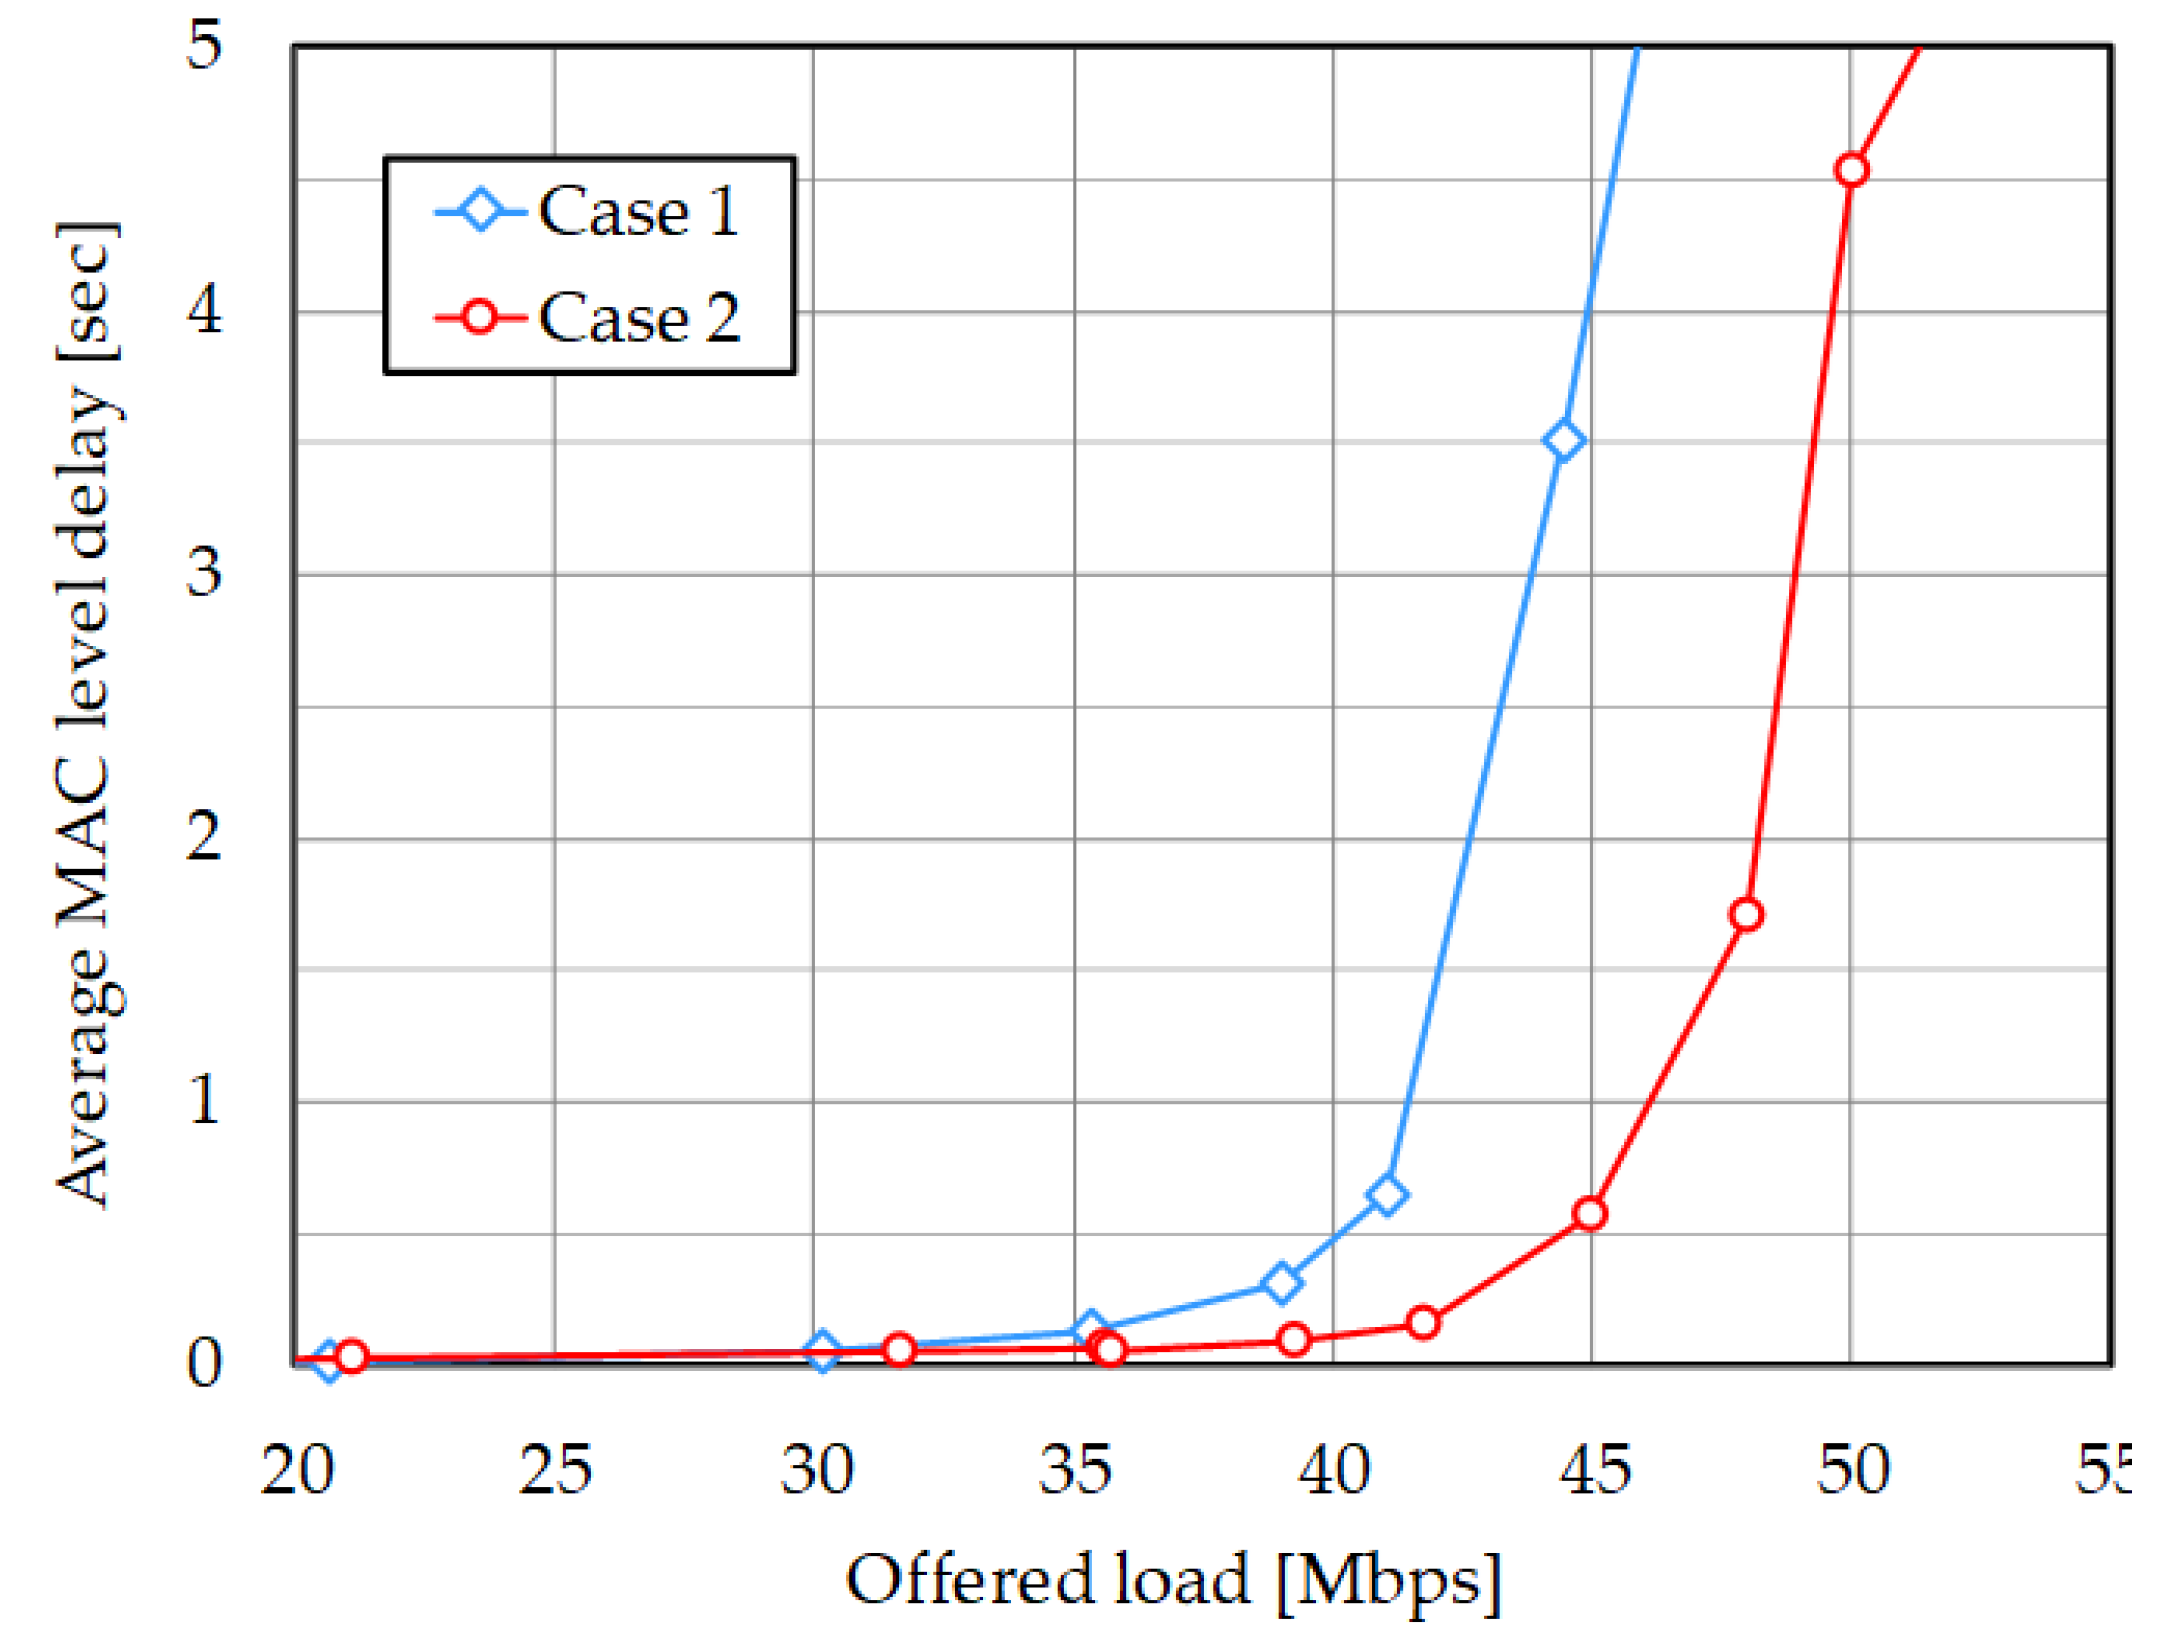
Transmission rate of each link is 150 Mbps. Figure 5 shows the system throughput performance versus offered load and Table 3 summarizes saturated values for each cases. As expected, possessive connection in Case 2 exhibits better system throughput value than the shared connection in Case 1 and its improvement is 12.5%. Case 2 is also effective in terms of average MAC level delay performance, as shown in Figure 6. It implies that system capacity can be enhanced by around 5 Mbps under the specified delay constraint.
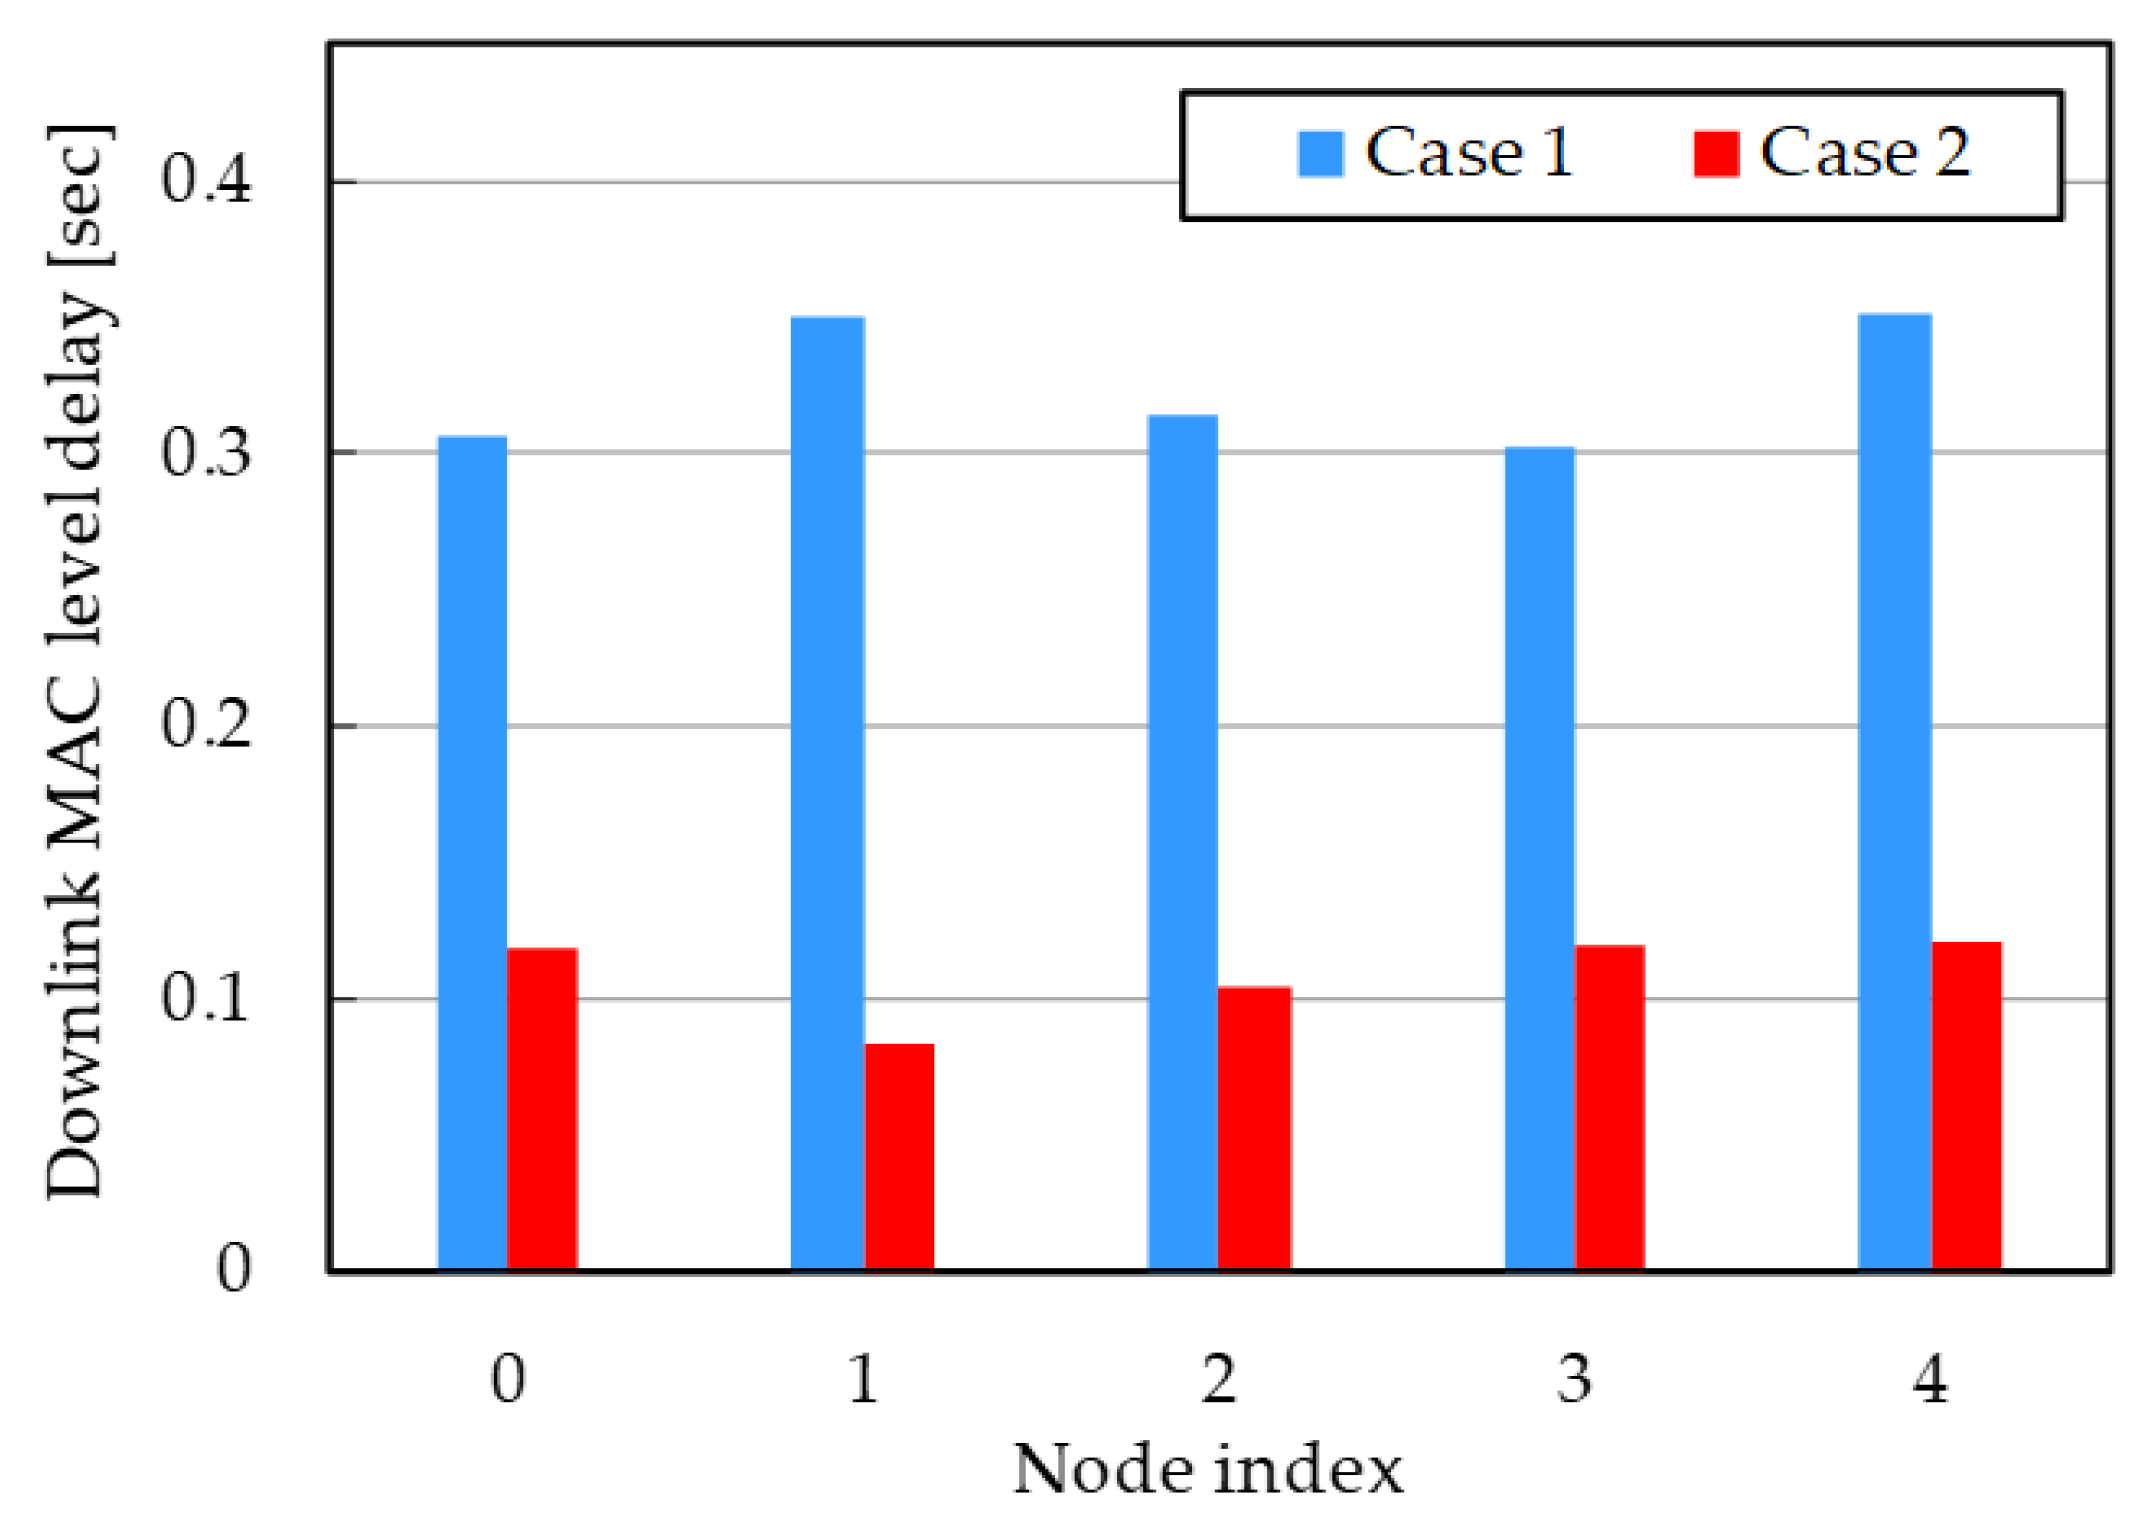
Its detailed behavior can be observed in Figure 7 and Table 4, which breakdowns downlink MAC level delay for each dead node. In this case, offered load is 38 Mbps, which is the region just before the system capacity reaches the saturation point. As shown in Figure 7 and Table 4, delay values of all nodes are significantly reduced by 60% or more. In the downlink transmission in Case 1, network performance strongly depends on random backoff behavior of the alive node solely. If collision occurs in succession, backoff time cumulates and all nodes should be in standby state. When the link connection is established as in Case 2, random backoff functionality is dispersed and thus we can expect statistical multiplexing effect to avoid such accumulative standby state. Not only does this enhance the maximum throughput, but it can also improve transmission delay even in the lower offered load region. Thus, this fundamental analysis validates our concept and approach.

4.2.2. Practical Scenario in Random Topology

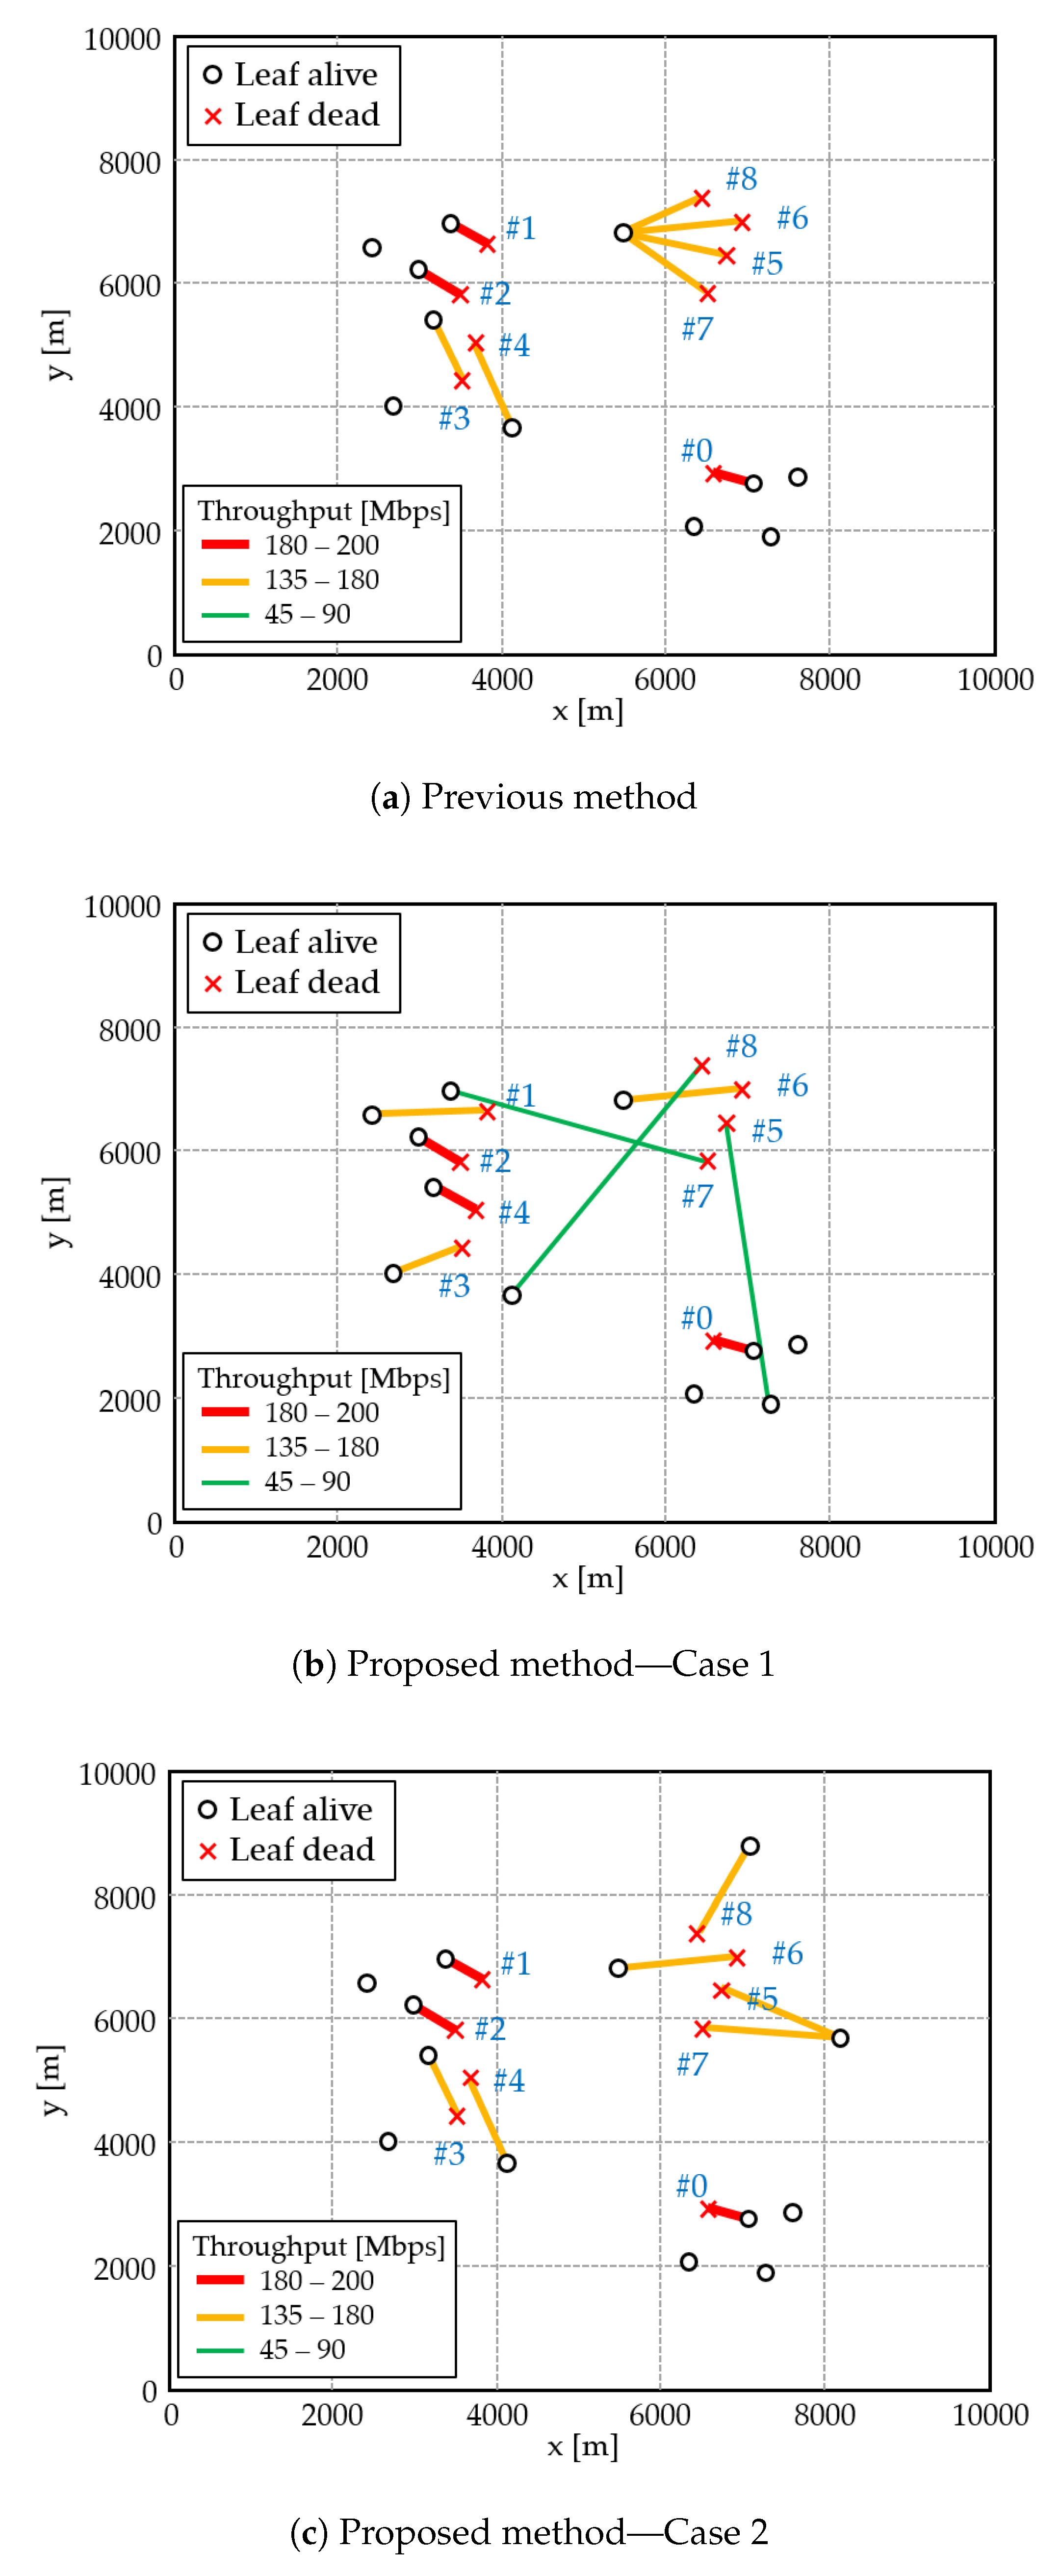
Based on the above fundamental and fine results, the following examines the effectiveness of the proposed approach in more practical scenario where nodes are deployed at random. In this experiment, there are 20 leaf nodes in an 10-square kilometer area. Their positions are randomly determined, and the state of each node is randomly set as alive or dead. Upper limit of wireless connection A j is set to 4. Resultant topology and routing is shown in Figure 8. Figure 8 only plots alive/dead nodes for visibility and compares following three cases.
(a)
Previous method
(b)
Proposed nonlinear method—Case 1: sparse alive nodes
(c)
Proposed nonlinear method—Case 2: dense alive nodes
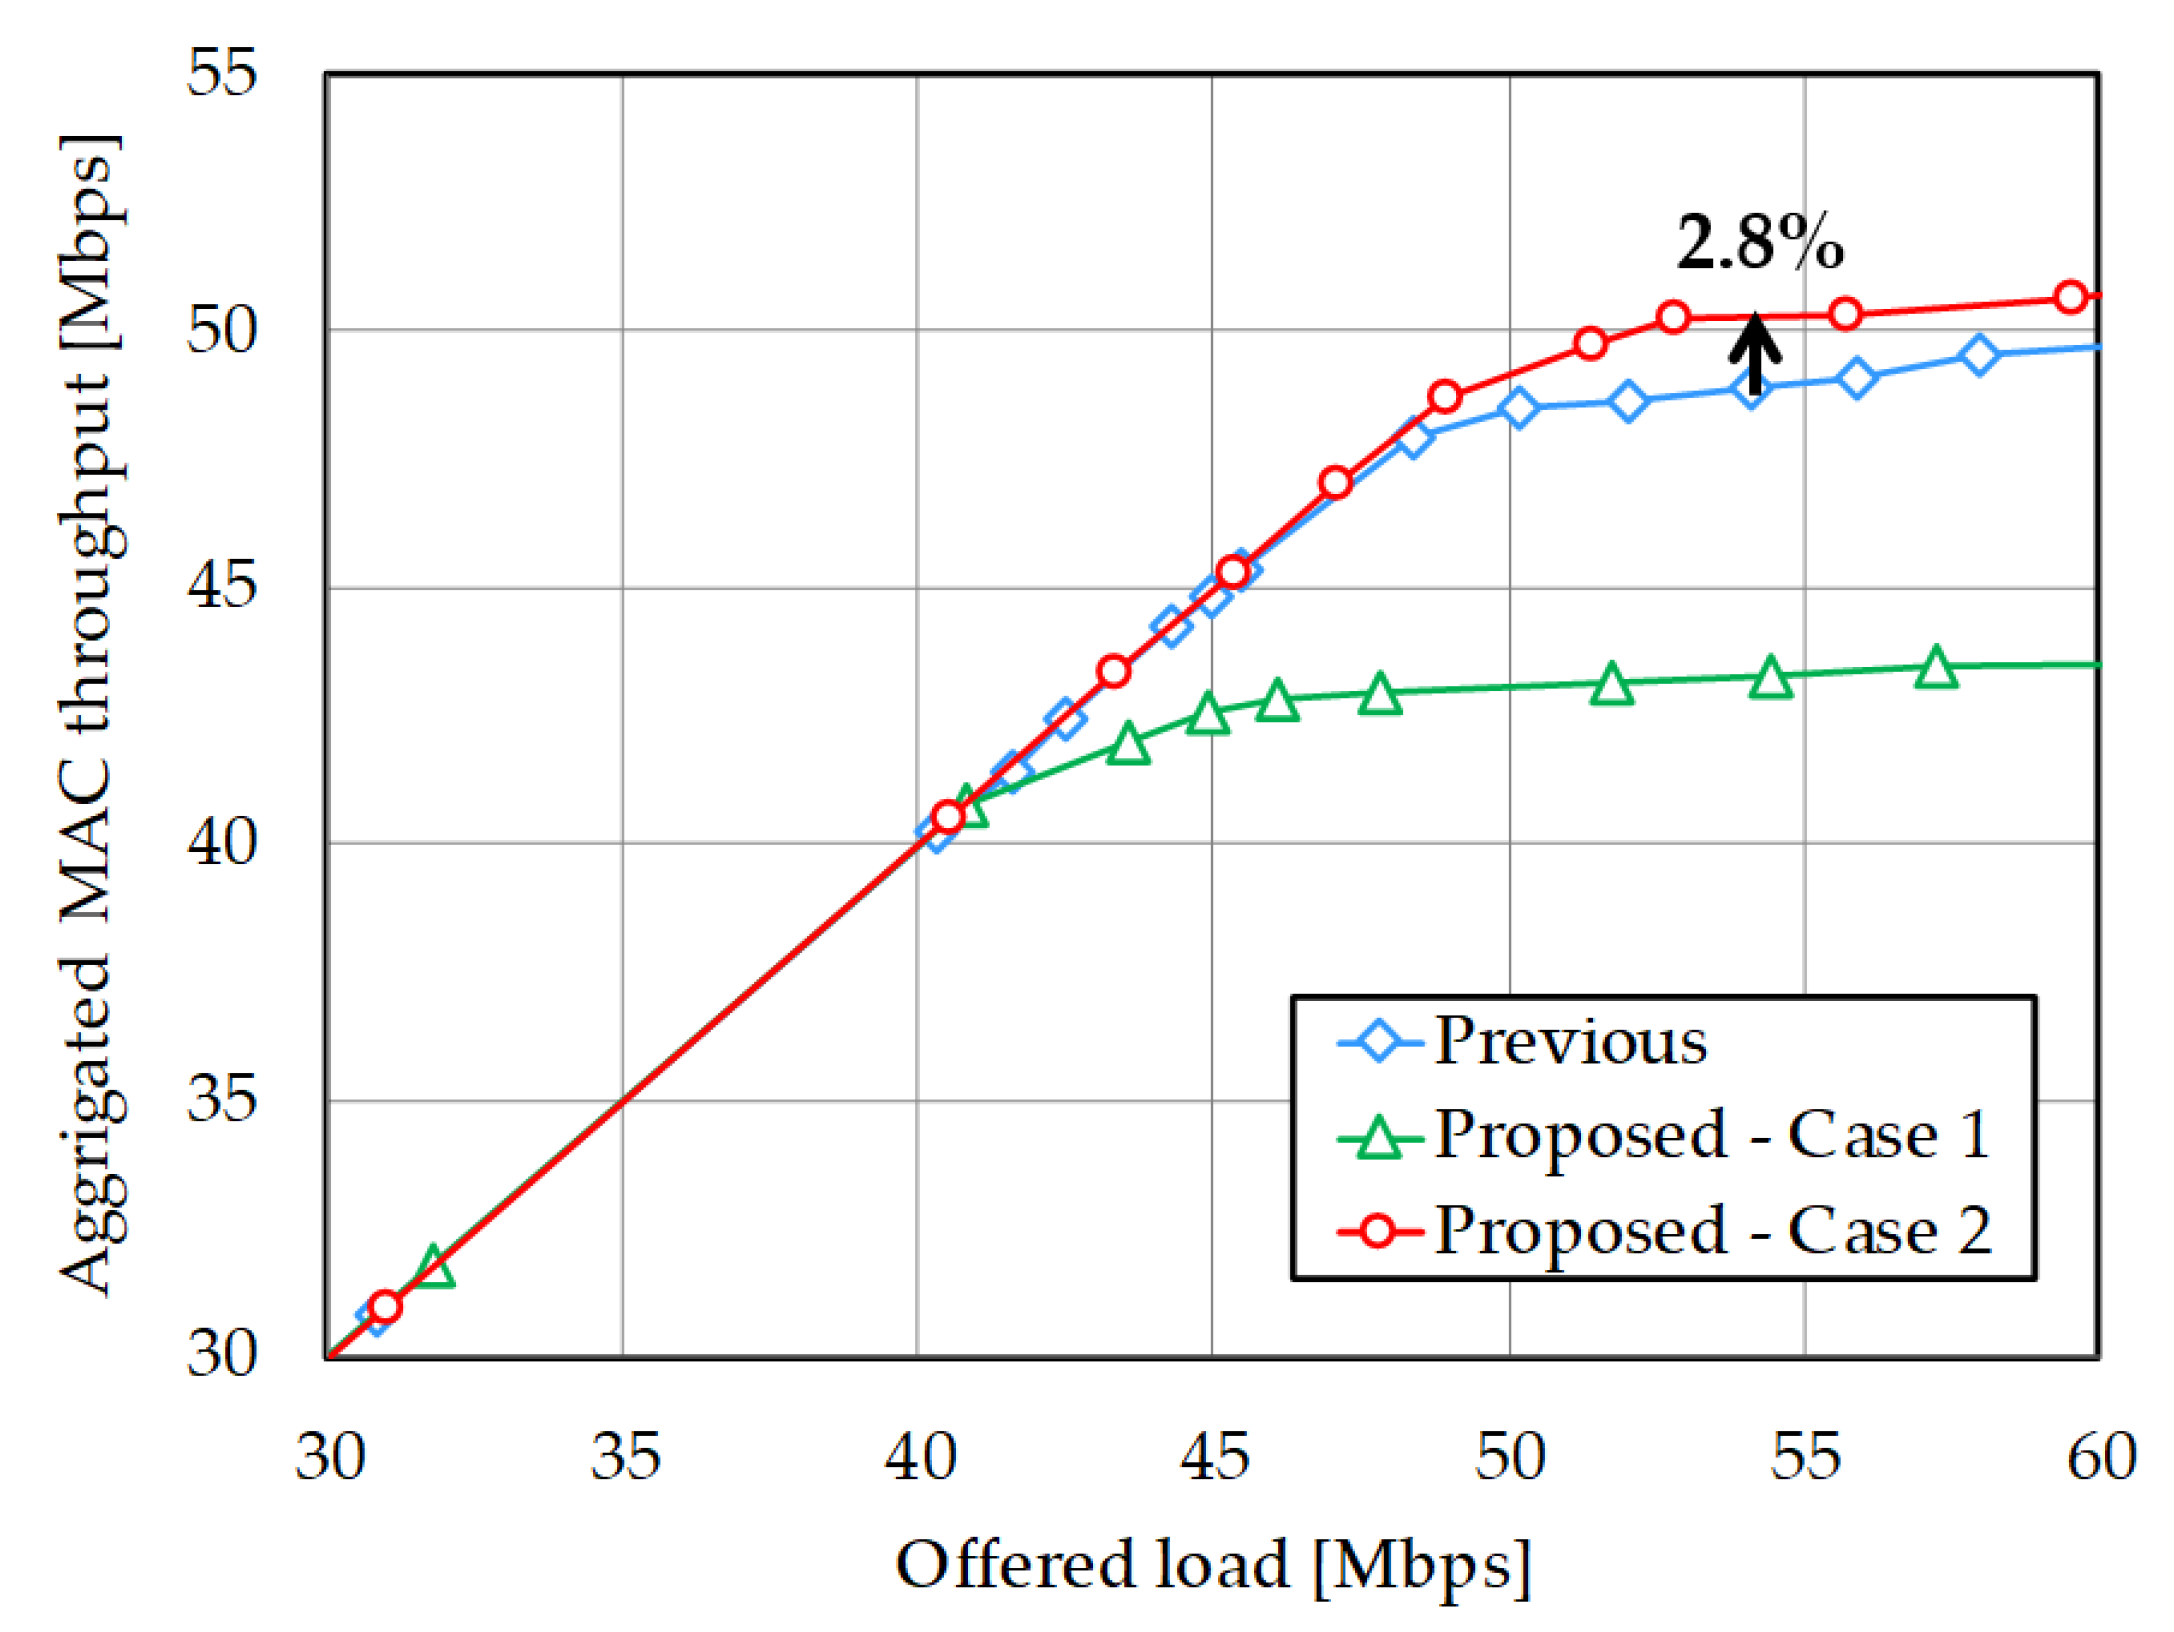
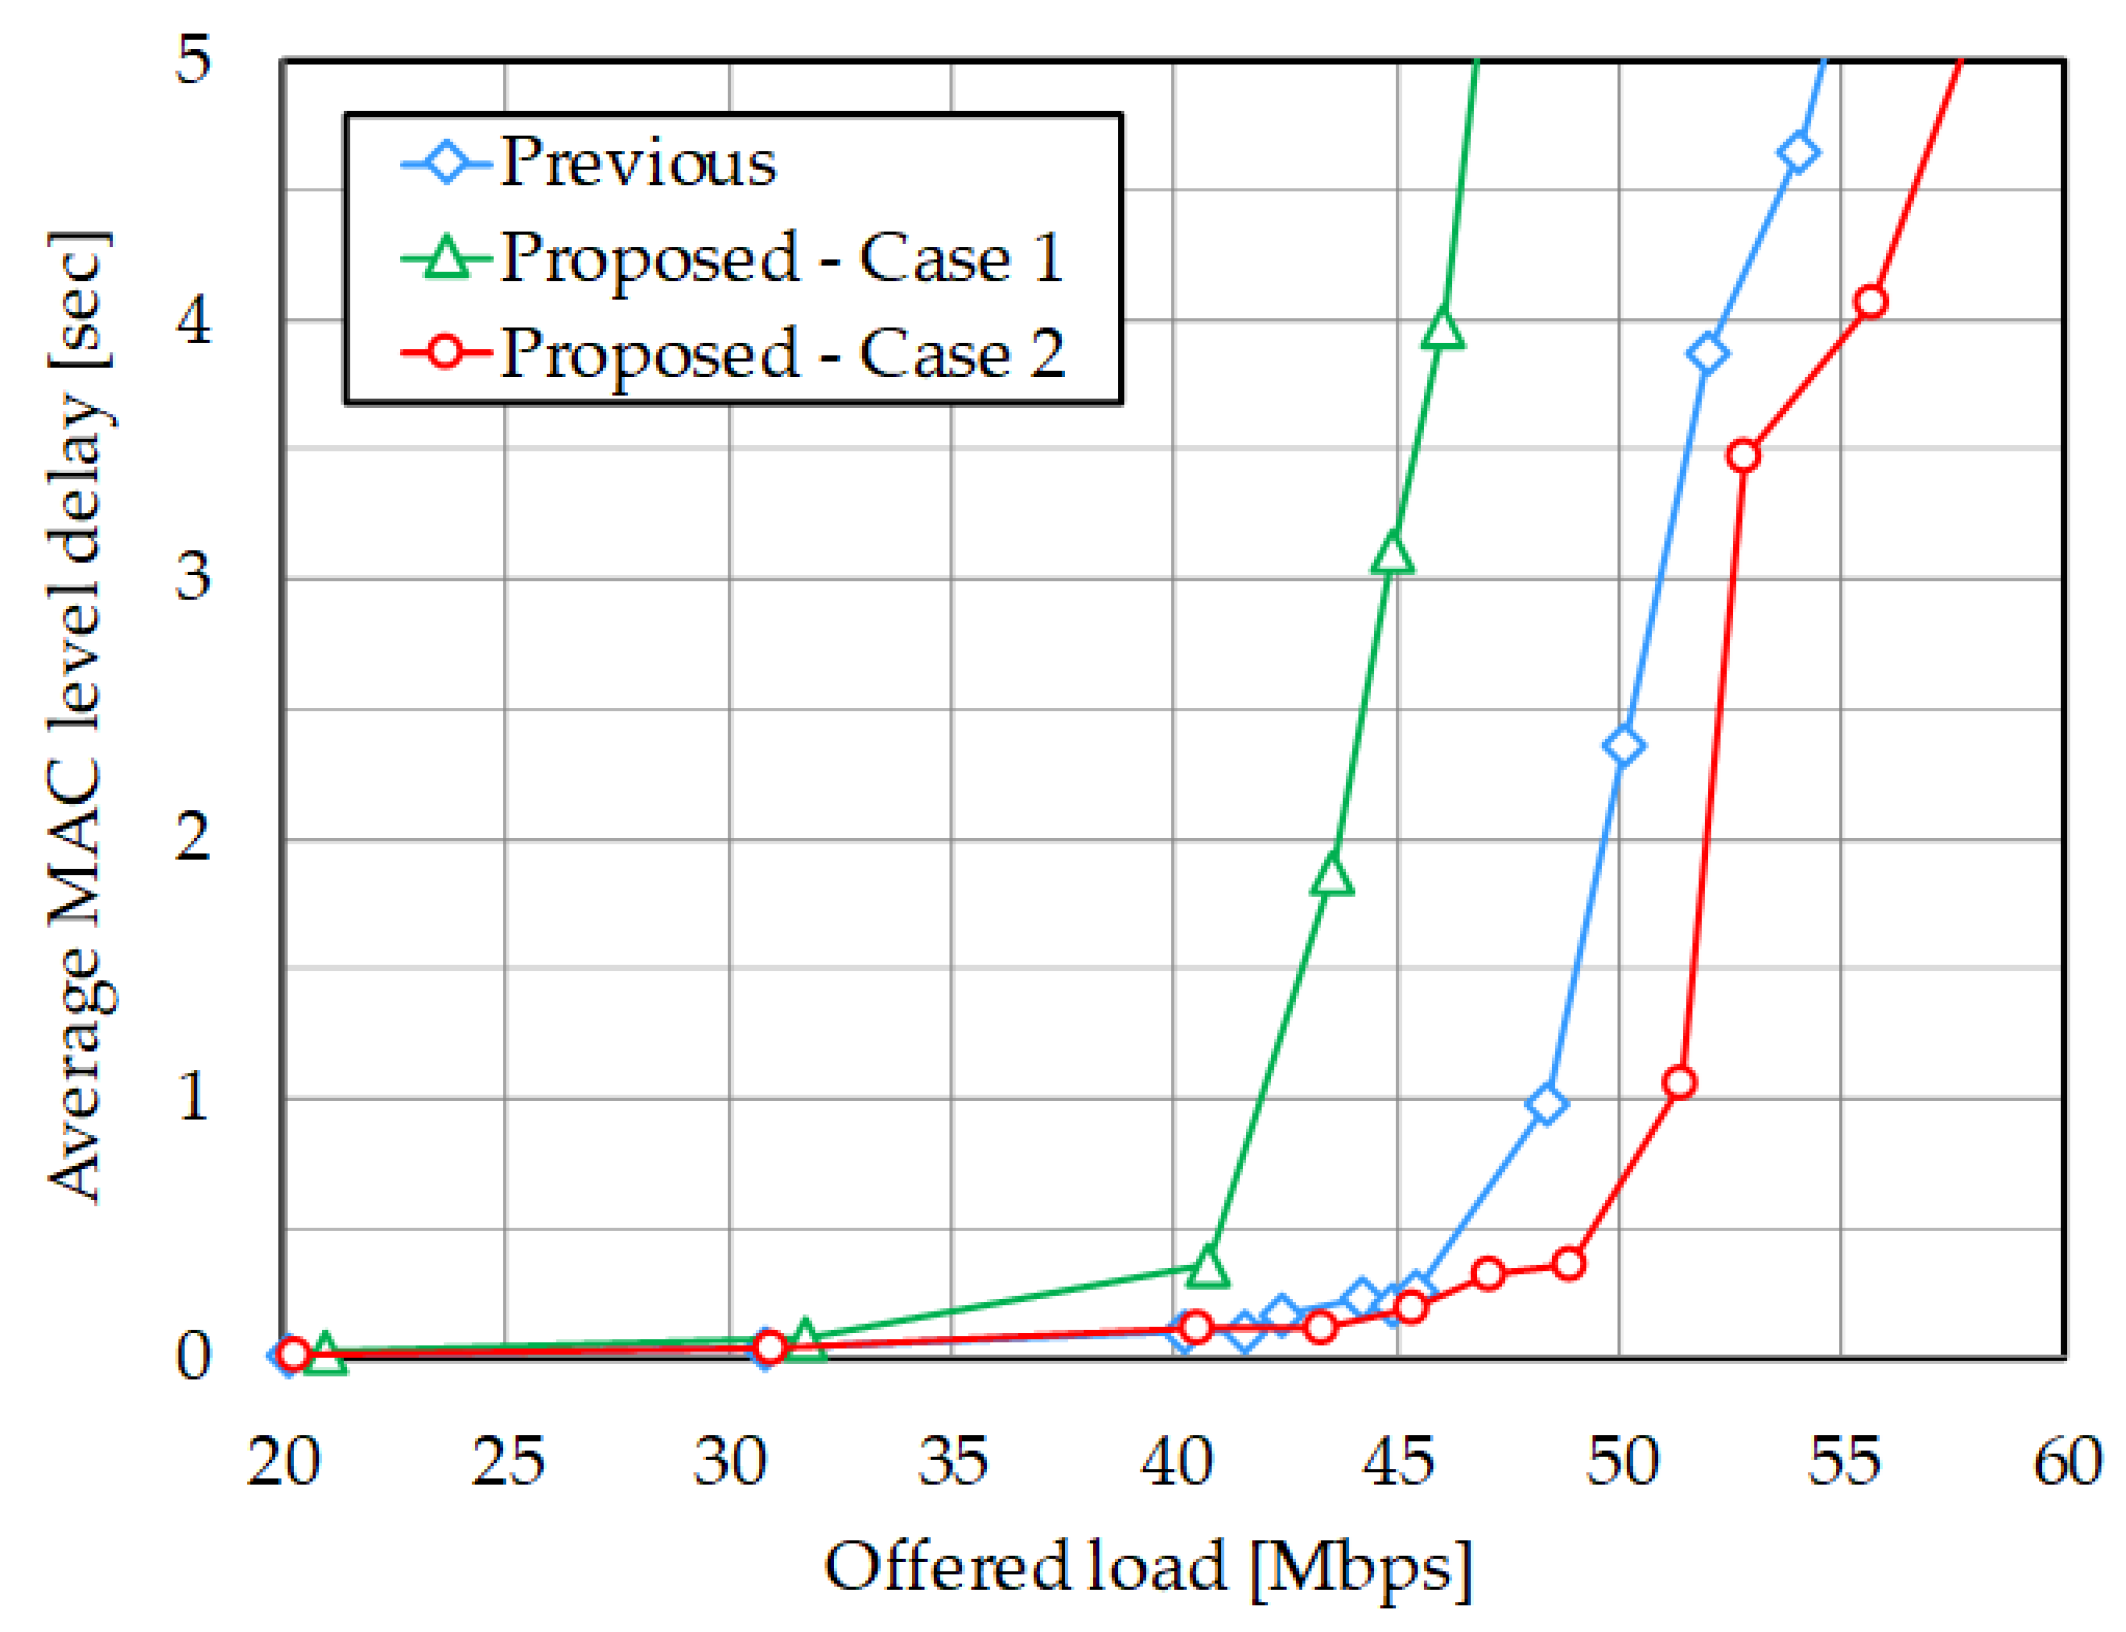
Evaluation focuses on the 5th–8th dead nodes which are connected to the same alive node with the previous method (Figure 8a). The proposed method successfully avoids selecting overlapped alive node. Meanwhile, in Case 1, the 5th, 7th, and 8th nodes are forced to connect to distant alive nodes and their achievable throughput values are reduced (Figure 8b). Figure 9 shows system throughput performance with offered load. Its saturated values are also visualized in Table 5. Unfortunately, throughput value with the proposed scheme in Case 1 is reduced by 11.4%. It is because the objective function in Equation (6) is based on achievable PHY level transmission rate, however, practical MAC level behavior is imposed by framing overhead, as shown in Table 2. Actual throughput performance in MAC level is worse than expected. (For example, focusing on MCS indices of 0 and 1, PHY rate is doubled but the transmission duration T t x cannot be halved.) When alive nodes densely exist, as in Case 2 (Figure 8c), such unfavorable condition can be avoided. The 5th, 7th, and 8th nodes are connected to nearby alive nodes with keeping satisfactory link connectivity. It can achieve improved system throughput performance compared to the previous method by around 2.8%. Figure 10 plots average MAC level delay performance. Proposed method with Case 2 can also outperform the previous method, whereas Case 1 shows inferior delay characteristic. Removing shared bypassing with firm connectivity normalizes transmission opportunity among dead nodes and it can alleviate excessive standby state for the 5–8 nodes. Improving delay performance accordingly enhanced system capacity, that is, maximal throughput value.
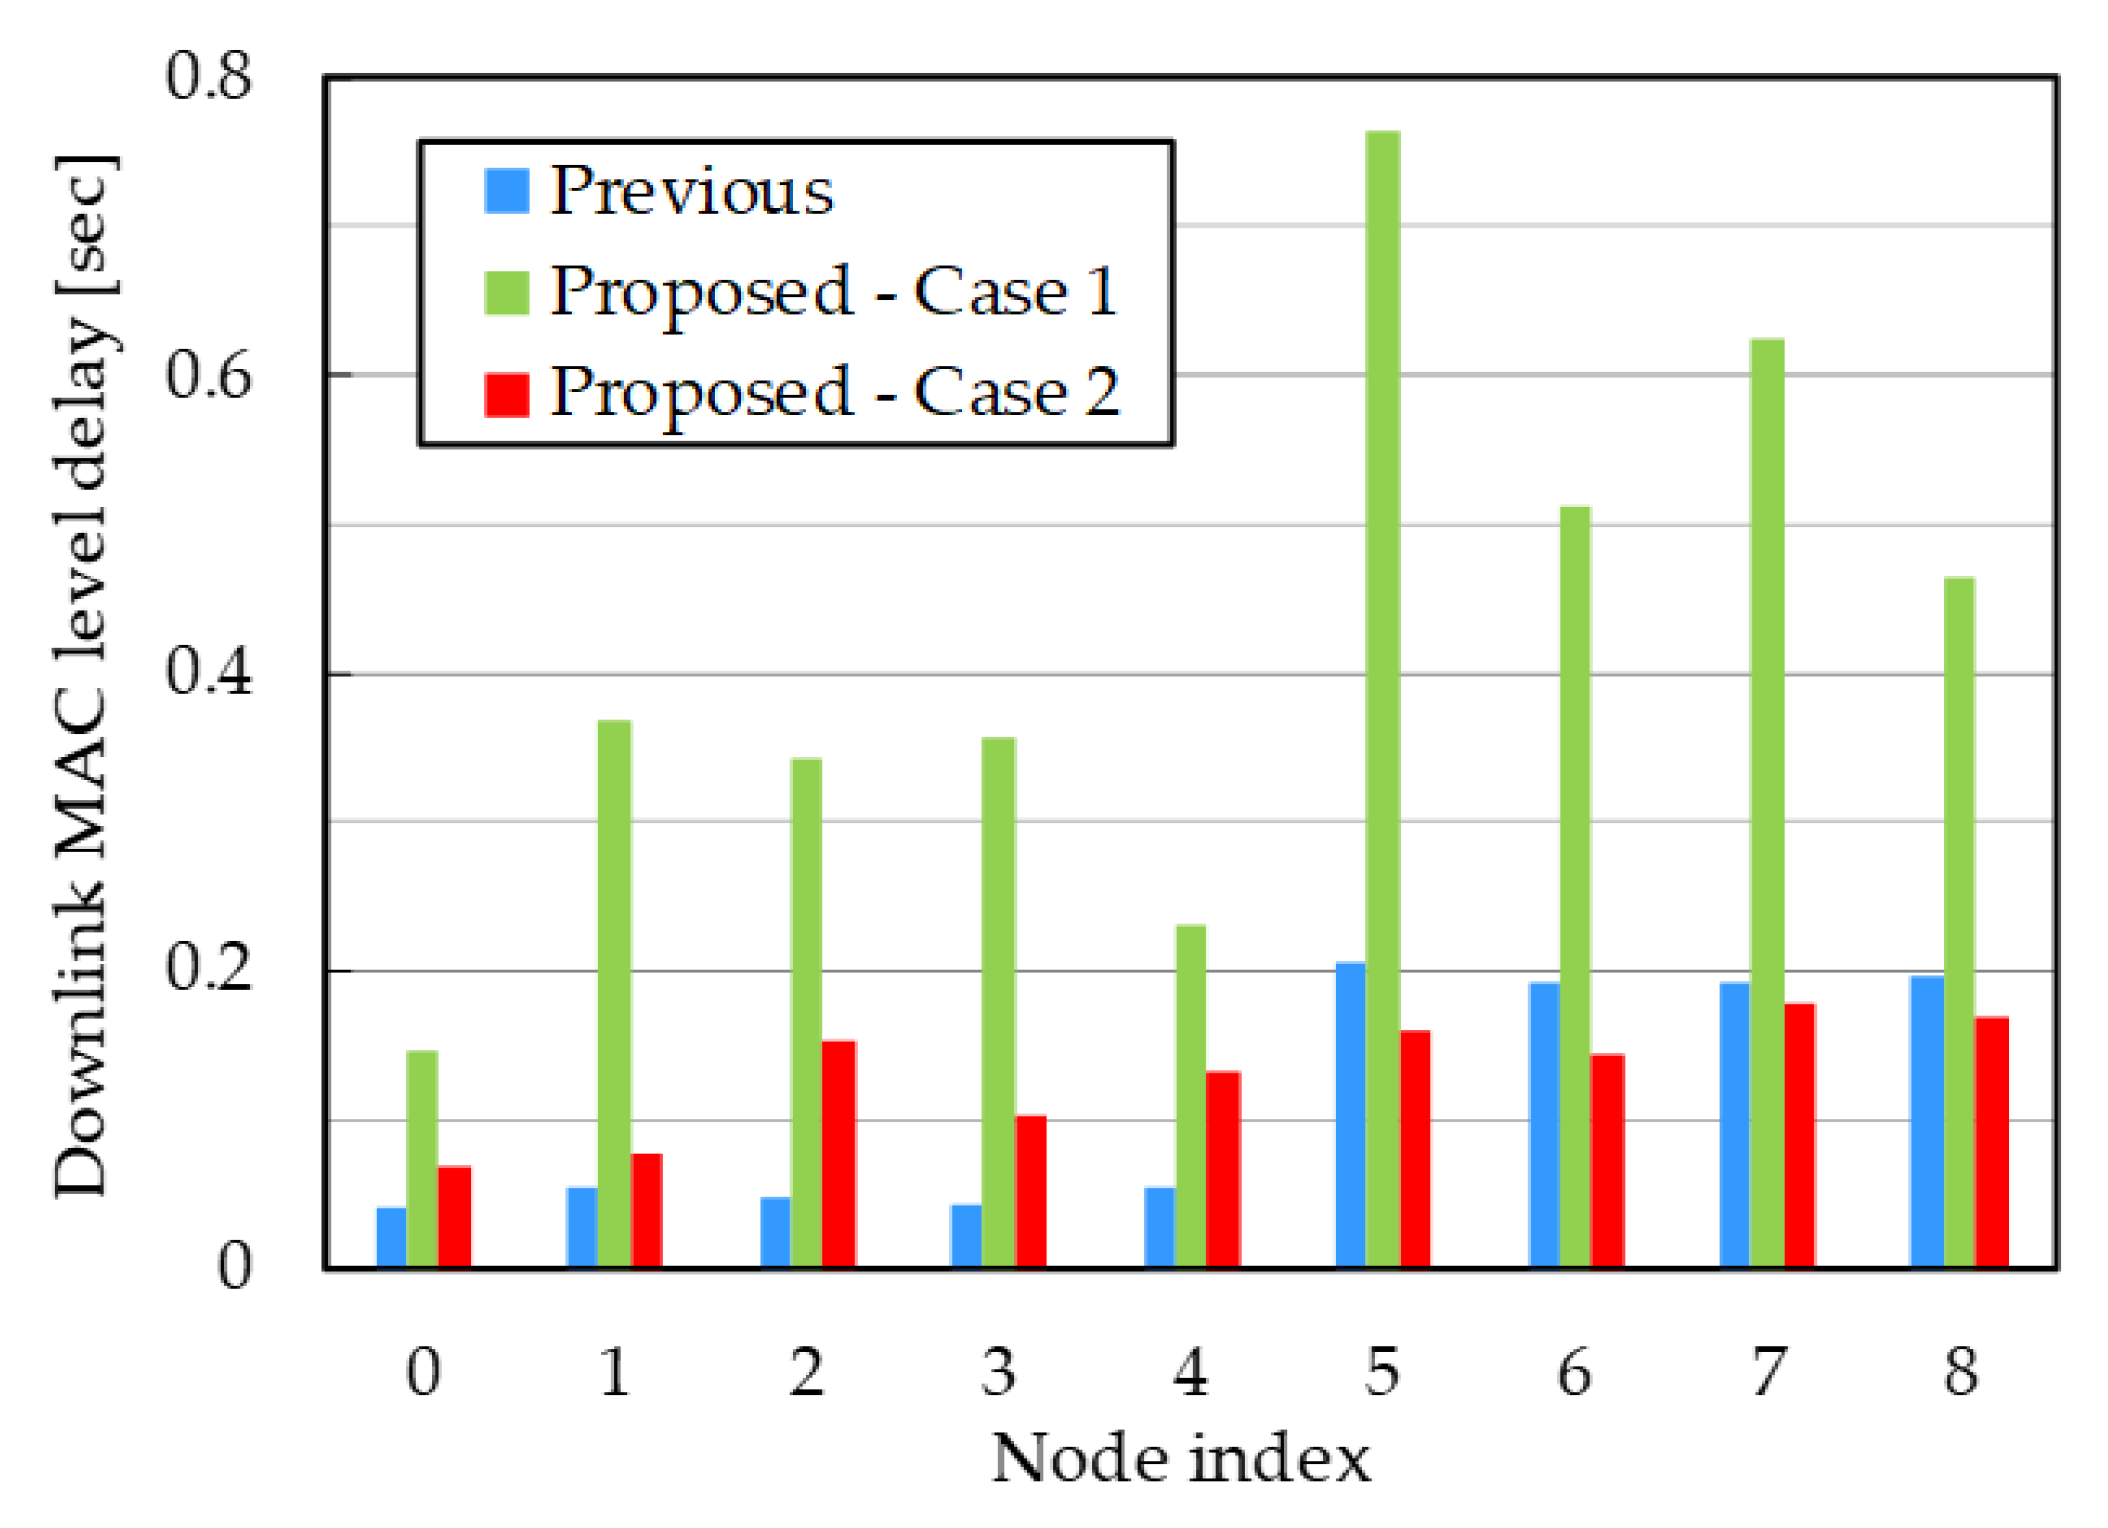
Above observation can be verified by Figure 11 and Table 6 plotting average delay for each dead node at 40 Mbps offered load. In Case 1, all delay performances were deteriorated. Data transmission in bypass links for the 5th, 7th, and 8th nodes takes a long time due to lowered achievable rates; it dominated other nodes to prevent their transmission. This performance reduction can be compensated if available alive nodes exist near these dead nodes, as in Case 2. Depending on the network topology, the previous method sometimes causes reduced throughput due to the bandwidth sharing. Nevertheless, the proposed nonlinear routing can resolve such unfair situation while keeping improved system throughput compared to the conventional one.

4.3. Discussion

A realistic network topology differs with areas or countries, and various types of disasters can strike various types of network topologies. Thus, it is difficult to predict the generality of dead/alive node distribution. As disclosed above, our proposed scheme may not effectively work depending on network topologies, especially for alive nodes distribution. Such unfavorable condition is expected to be avoided by further modification of objective function in Equation (6). One possibility is to weight its denominator with considering MAC overhead. A simpler approach is to provide some constraints to avoid disagreeable bypassing, e.g. prohibit connecting far alive nodes. These approaches may however require intensive parameter tuning according to packet structure of each flow, network topologies and their link connectivities. It could open up new knowledge as well as solutions, and will be further investigated as our future work.
Another approach to improve the performance of the proposed system in any condition is using additional recovery nodes, as we previously investigated [23,24]. This depends on the demand distribution in the disaster area because the node distribution is determined by the demand distribution for the telecommunication services. For example, in sparsely distributed areas where no alive node is located nearby, an isolated leaf node cannot establish a bypass route. To overcome this limitation, our previous proposal is to deploy additional/temporal recovery nodes in the same way as other leaf nodes. They are normally disabled to reduce power consumption, and are initiated after a disaster. Recovery nodes can dramatically increase the options for bypass routes when they are deployed in areas even where the leaf nodes are sparsely distributed. The number and location of recovery nodes can be optimized with our scheme in [24] considering the relationship between the improvement of throughput and cost. Even if the network topology is similar to Case 1, it can be improved to be similar to Case 2 using recovery nodes. Therefore, we can conclude that the proposed routing in this paper is still meaningful for any network topology.

5. Conclusions

This paper proposes a nonlinear bypass route computation method for the NeCo system which achieves both rapid recovery and high throughput using wireless bypass routes backhauled by wired networks. The goal of the proposed method is to address the issue of previously proposed routing method, which is the throughput reduction caused by the wireless resource sharing among dead nodes. That is, if bypass routes of multiple dead nodes overlap, their transmission rates are expected to decrease because of sharing of limited spectral resources. To address this issue, the proposed method considers the shared wireless bandwidth in the route calculation. It was confirmed through simulative analysis that the proposed routing method can avoid bandwidth division loss if several alive nodes are located nearby. The proposed approach can be a valuable means in large-scale network to keep higher throughput even in partially collapsed situation.

Author Contributions

Y.N. conceived the proposed scheme and conducted routing calculation; K.M. provided simulation results based on the routing results; and Y.N. and K.M. wrote the paper.

Funding

Part of this research was funded by JSPS KAKENHI grant number 17H06562 and the KDDI Foundation.

Conflicts of Interest

The authors declare no conflicts of interest.

Abbreviations

The following abbreviations are used in this manuscript:
NeCoNetwork Cooperation
PONPassive Optical Network
LoSLine-of-Sight
CSMA/CACarrier Sense Multiple Access with Collision Avoidance
PHYPHYsical layer
GIGuard Interval
LDPCLow Density Parity Check
MCSModulation and Coding Scheme
RTSRequest-to-Send
CTSClear-to-Send
DLDownlink
ULUplink
UDPUser Datagram Protocol
TCPTransmission Control Protocol
MACMedium Access Control
FIFOFirst-In First-Out

References

  1. Thomas, G.; Gene, F.; McCarty, M. Hurricane Katrina: Social-Demographic Characteristics of Impacted Areas; University of North Texas Libraries: Denton, TX, USA, 2005. [Google Scholar]
  2. Nobuoto, N.; Yoshihisa, M. Comparison of Functional Damage and Restoration Processes of Utility Lifelines in the 2016 Kumamoto Earthquake, Japan with Two Great Earthquake Disasters in 1995 and 2011. JSCE J. Dis. FactSheets 2016, FS2016-L-0005, 1–9. [Google Scholar]
  3. Habib, M.F.; Tornatore, M.; Dikbiyik, F.; Mukherjee, B. Disaster survivability in optical communication networks. Comput. Commun. 2013, 36, 630–644. [Google Scholar] [CrossRef]
  4. De La Oliva, A.; Pérez, X.C.; Azcorra, A.; Di Giglio, A.; Cavaliere, F.; Tiegelbekkers, D.; Lessmann, J.; Haustein, T.; Mourad, A.; Iovanna, P. Xhaul: toward an integrated fronthaul/backhaul architecture in 5G networks. IEEE Wirel. Commun. 2015, 22, 32–40. [Google Scholar] [CrossRef] [Green Version]
  5. Atlam, H.F.; Walters, R.J.; Wills, G.B. Fog Computing and the Internet of Things: A Review. Big Data Cognit. Comput. 2018, 2, 10. [Google Scholar] [CrossRef]
  6. Kang, K.D.; Chen, L.; Yi, H.; Wang, B.; Sha, M. Real-Time Information Derivation from Big Sensor Data via Edge Computing. Big Data Cognit. Comput. 2017, 1, 5. [Google Scholar] [CrossRef]
  7. Nakayama, Y.; Sezaki, K. Per-Flow Throughput Fairness in Ring Aggregation Network with Multiple Edge Routers. Big Data Cognit. Comput. 2018, 2, 17. [Google Scholar] [CrossRef]
  8. Mitsui, T.; Sakamoto, T.; Hara, K.; Yoshimoto, N. Flexible and scalable PON protection architecture using N: M redundancy toward next generation access network. In Proceedings of the 17th Asia-Pacific Conference on Communications, Sabah, Malaysia, 2–5 October 2011; pp. 224–229. [Google Scholar]
  9. Tsutsumi, T.; Sakamoto, T.; Sakai, Y.; Fujiwara, T.; Ou, H.; Kimura, Y.; Suzuki, K.I. Long-reach and high-splitting-ratio 10G-EPON system with semiconductor optical amplifier and N: 1 OSU protection. J. Lightwave Technol. 2015, 33, 1660–1665. [Google Scholar] [CrossRef]
  10. Tsutsumi, T.; Sakai, Y.; Sakamoto, T.; Kubota, M.; Otaka, A. Field Trial and Analysis of N: 1 Redundant 10G-EPON Using Boost-type Semiconductor Optical Amplifier. In Proceedings of the 2015 Optical Fiber Communications Conference and Exhibition, Los Angeles, CA, USA, 22–26 March 2015. [Google Scholar]
  11. Manoj, B.S.; Baker, A.H. Communication challenges in emergency response. Commun. ACM 2007, 50, 51–53. [Google Scholar] [CrossRef]
  12. Portmann, M.; Pirzada, A.A. Wireless mesh networks for public safety and crisis management applications. IEEE Int. Comput. 2008, 12, 18–25. [Google Scholar] [CrossRef]
  13. Lien, Y.N.; Chi, L.C.; Huang, C.C. A multi-hop walkie-talkie-like emergency communication system for catastrophic natural disasters. In Proceedings of the 39th International Conference on Parallel Processing Workshops, San Diego, CA, USA, 13–16 September 2010. [Google Scholar]
  14. Ueda, Y. Vehicle-mounted Transportable Mobile Base Station and Backhaul Link for Disaster Relief Operation. New Breeze 2014 Summer 2014, 26, 2–3. [Google Scholar]
  15. Baldo, N.; Dini, P.; Mangues-Bafalluy, J.; Miozzo, M.; Núñez Martínez, J. Small cells, wireless backhaul and renewable energy: A solution for disaster aftermath communications. In Proceedings of the 4th International Conference on Cognitive Radio and Advanced Spectrum Management, Barcelona, Spain, 26–29 October 2011. [Google Scholar]
  16. Todd, T.D.; Sayegh, A.A.; Smadi, M.N.; Zhao, D. The need for access point power saving in solar powered WLAN mesh networks. IEEE Netw. 2008, 22, 4–10. [Google Scholar] [CrossRef]
  17. Li, J.; Blake, C.; De Couto, D.S.; Lee, H.I.; Morris, R. Capacity of Ad Hoc Wireless Networks. In Proceedings of the 7th Annual International Conference on Mobile Computing and Networking, Rome, Italy, 16–21 July 2001; pp. 61–69. [Google Scholar]
  18. Thota, S.; Bhaumik, P.; Chowdhury, P.; Mukherjee, B.; Sarkar, S. Exploiting wireless connectivity for robustness in WOBAN. IEEE Netw. 2013, 27, 72–79. [Google Scholar] [CrossRef]
  19. Sarkar, S.; Dixit, S.; Mukherjee, B. Hybrid wireless-optical broadband-access network (WOBAN): A review of relevant challenges. J. Lightwave Technol. 2007, 25, 3329–3340. [Google Scholar] [CrossRef]
  20. Yinpeng, Y.; Ranaweera, C.; Lim, C.; Wong, E.; Guo, L.; Liu, Y.; Nirmalathas, A. Optimization Framework for Deployment of Hybrid Fiber Wireless Networks with Survivability Constraints. In Proceedings of the Asia Communications and Photonics Conference 2015, Hong Kong, 19–23 November 2015. [Google Scholar]
  21. Maier, M. Survivability techniques for NG-PONs and FiWi access networks. In Proceedings of the 2012 IEEE International Conference on Communications (ICC), Ottawa, ON, Canada, 10–15 June 2012; pp. 6214–6219. [Google Scholar]
  22. Nakayama, Y.; Maruta, K.; Tsutsumi, T.; Sezaki, K. Wired and wireless network cooperation for quick recovery. In Proceedings of the IEEE International Conference on Communications (ICC), Kuala Lumpur, Malaysia, 22–27 May 2016; pp. 1–6. [Google Scholar]
  23. Nakayama, Y.; Maruta, K.; Tsutsumi, T.; Sezaki, K. Wired and Wireless Network Cooperation for Wide-Area Quick Disaster Recovery. IEEE Access 2018, 6, 2410–2424. [Google Scholar] [CrossRef]
  24. Nakayama, Y.; Maruta, K.; Tsutsumi, T.; Yasunaga, R.; Honda, K.; Sezaki, K. Recovery Node Layout Planning for Wired and Wireless Network Cooperation for Disaster Response. In Proceedings of the 2018 IEEE International Conference on Communications Workshops, Kansas City, MO, USA, 20–24 May 2018. [Google Scholar]
  25. Maruta, K.; Nakayama, Y.; Tsutsumi, T. Throughput Performance Evaluation on Wired and Wireless Network Cooperation Quick Recovery System Employing IEEE 802.11 DCF. In Proceedings of the Fifth International Conference on Network, Communication and Computing, Kyoto, Japan, 17–21 December 2016; pp. 267–271. [Google Scholar]
  26. IEEE. Wireless LAN Medium Access Control (MAC) and Physical Layer (PHY) Specifications. IEICE Tech. Rep. 2013, 108, 67–72. (In Japanese) [Google Scholar]
  27. 5 GHz Wireless Access System. 2006. (In Japanese). Available online: http://www.soumu.go.jp/main_sosiki/joho_tsusin/policyreports/joho_tsusin/pdf/tosin_061221_4.pdf (accessed on 29 August 2018).
  28. Mitsunaga, K.; Maruta, K.; Higa, Y.; Furukawa, H. Application of directional antenna to wireless multihop network enabled by IPT forwarding. In Proceedings of the 2008 2nd International Conference on Signal Processing and Communication Systems, Gold Coast, QLD, Australia, 15–17 December 2008; pp. 1–6. [Google Scholar] [CrossRef]
  29. Maruta, K.; Furukawa, H. Highly Efficient Multi Channel Packet Forwarding with Round Robin Intermittent Periodic Transmit for Multihop Wireless Backhaul Networks. Sensors 2017, 17, 2609. [Google Scholar] [CrossRef] [PubMed]
  30. Bruno, R.; Conti, M.; Gregori, E. IEEE 802.11 optimal performances: RTS/CTS mechanism vs. basic access. In Proceedings of the 13th IEEE International Symposium on Personal, Indoor and Mobile Radio Communications, Lisboa, Portugal, 18 September 2002; pp. 1747–1751. [Google Scholar] [CrossRef]
  31. Abrams, M.; Williams, S.; Abdulla, G.; Patel, S.; Ribler, R.; Fox, E.A. Multimedia Traffic Analysis Using CHITRA95. In Proceedings of the Third ACM International Conference on Multimedia, San Francisco, CA, USA, 5–9 November 1995; pp. 267–276. [Google Scholar]
  32. ISP Backbone Traffic in Japan. Available online: http://www.hongo.wide.ad.jp/InternetTraffic/data/ (accessed on 29 August 2018).
  33. Maruta, K.; Ohta, A.; Kurosaki, S.; Arai, T.; Iizuka, M. Experimental Investigation of Space Division Multiplexing on Massive Antenna Systems for Wireless Entrance. IEICE Trans. Commun. 2017, 100, 1436–1448. [Google Scholar] [CrossRef]
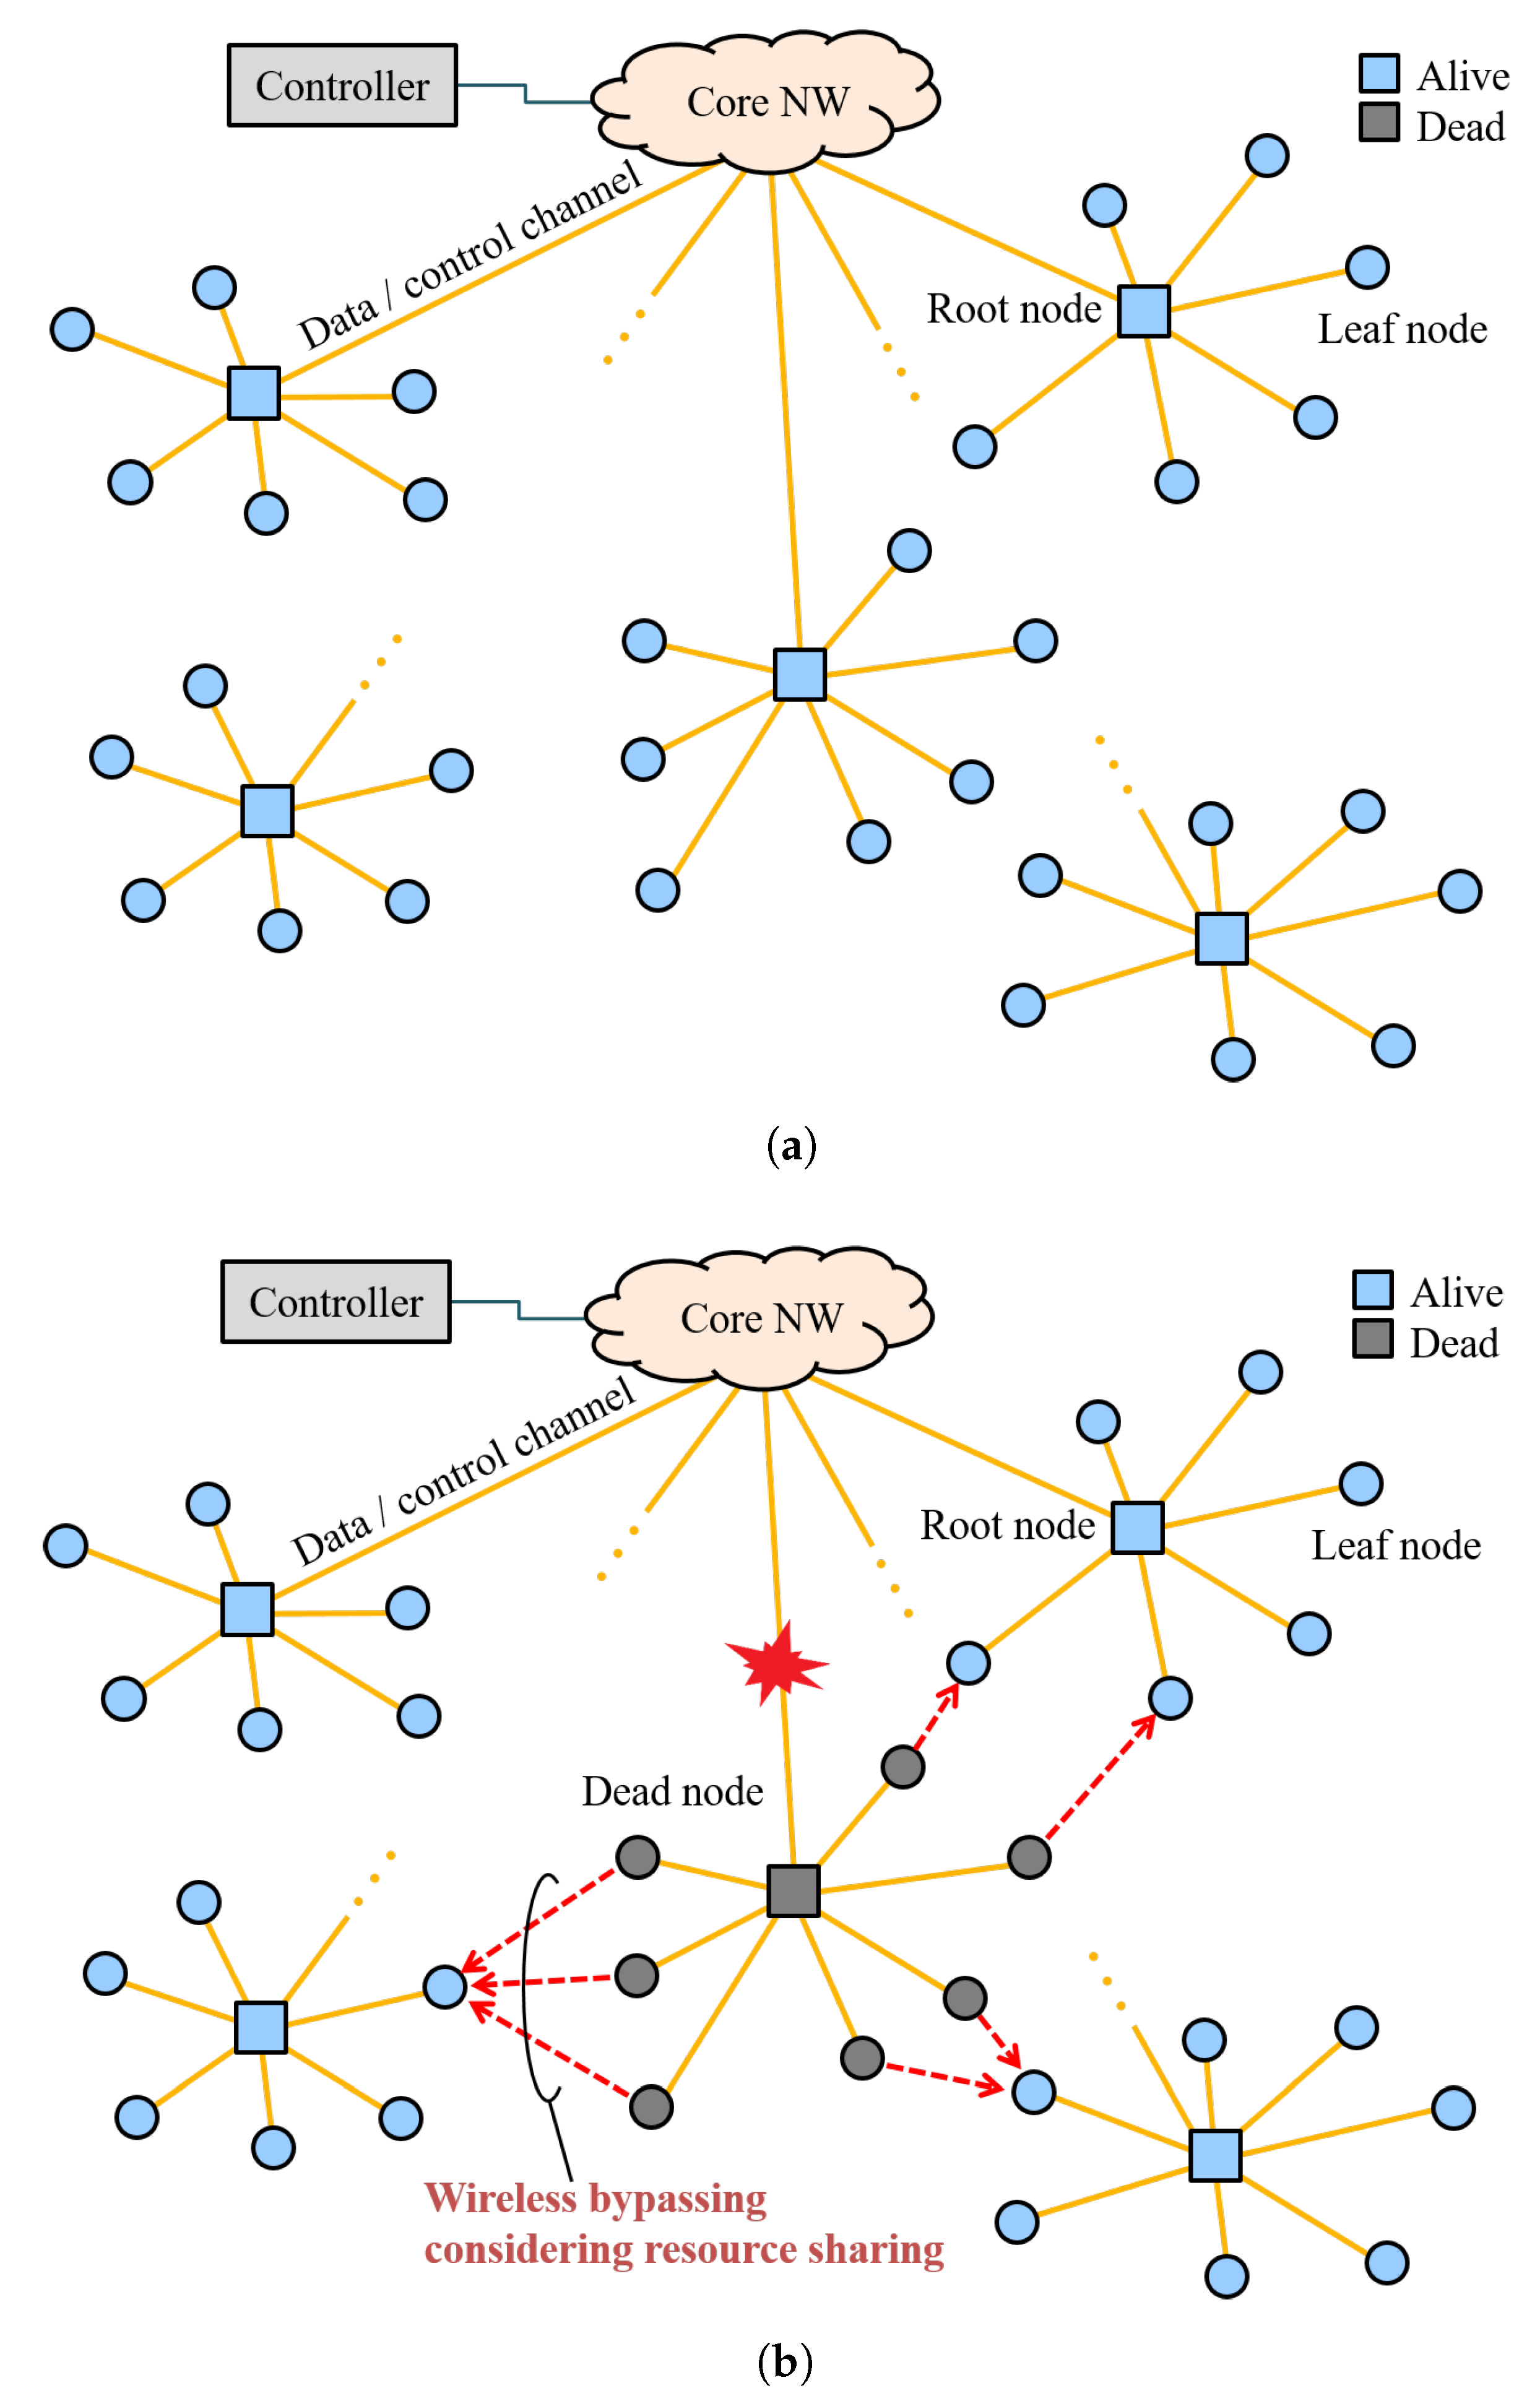
Figure 1. Concept of the NeCo system: (a) normal period; and (b) after disaster.
Bdcc 02 00028 g001
Figure 2. Recovery sequence for the NeCo system.
Bdcc 02 00028 g002
Figure 3. Transmission rate with distance.
Bdcc 02 00028 g003
Figure 4. Simplified topology and routing results.
Bdcc 02 00028 g004
Figure 5. Aggregated MAC level throughput in simplified topology.
Bdcc 02 00028 g005
Figure 6. Average MAC level delay in simplified topology.
Bdcc 02 00028 g006
Figure 7. Downlink MAC level delay for each node in simplified topology (38 Mbps offered load).
Bdcc 02 00028 g007
Figure 8. Simulated topology and routing results.
Bdcc 02 00028 g008
Figure 9. Aggregated MAC level throughput in practical topology.
Bdcc 02 00028 g009
Figure 10. Average MAC level delay in practical topology.
Bdcc 02 00028 g010
Figure 11. Downlink MAC level delay for each node in practical topology (40 Mbps offered load).
Bdcc 02 00028 g011
Table 1. Simulation parameters.
ItemValue
Carrier frequency 4.97 GHz
System bandwidth40 MHz
Wireless interfaceIEEE802.11ac [26]
RTS/CTSOff
Number of antenna1, Omni-directional
Number of channel1
Number of spatial stream1
Guard interval lengthShort: 400 nsec
Transmission power23 dBm
Antenna gain13 dBi
Channel modelFree space propagation
Poisson origination,
Log-normal distribution
Traffic modelUDP Packet: 1500 bytes,
Average: DL: 20, UL: 3 [31]
Load ratio DL:UL = 6:1 [32]
Table 2. MCS parameters.
MCS IndexRx Level [dBm]Tx Rate [Mbps]Mod. OrderCoding Rate T tx [ μ sec]
0 79 15BPSK 1 / 2 844
1 76 30QPSK 1 / 2 444
2 74 45QPSK 3 / 4 312
3 71 6016QAM 1 / 2 244
4 67 9016QAM 3 / 4 180
5 63 12064QAM 2 / 3 144
6 62 13564QAM 3 / 4 132
7 61 15064QAM 5 / 6 124
8 56 180256QAM 3 / 4 112
9 54 200256QAM 5 / 6 104
Table 3. Saturated throughput values in simplified topology.
Case 1Case 2
Saturated throughput value [Mbps]41.8547.09
Improvement—-12.5%
Table 4. Summarized delay values in simplified topology.
Node index01234
Delay [sec]Case 10.310.350.310.300.35
Case 20.120.080.100.120.12
Improvement61.6%75.9%66.8%60.3%65.5%
Table 5. Saturated throughput values in practical topology.
Previous Proposed—Case 1Proposed–Case 2
Saturated throughput value [Mbps]48.8950.2443.31
Improvement/Degradation—-2.8% 11.4 %
Table 6. Summarized delay values in target nodes.
Node Index5678
Delay [sec]Previous0.210.190.190.20
Proposed—Case 20.160.140.180.17
Improvement22.3%25.3%6.5%14.0%