Article

Wall-Proximity Effects on Five-Hole Probe Measurements †

1
ISAE-SUPAERO, Université de Toulouse, 31400 Toulouse, France
2
von Karman Institute for Fluid Dynamics, Chaussée de Waterloo 76, 1640 Rhode-Saint-Genèse, Belgium
3
Safran Tech, Rue des jeunes Bois, 78117 Châteaufort, France
*
Author to whom correspondence should be addressed.
This paper was published in the proceedings of the XXVI Symposium on Measuring Techniques in Turbomachinery Transonic and Supersonic Flow in Cascades and Turbomachines (MTT26), Pisa, Italy, 28–30 September 2023 under the https://doi.org/10.1088/1742-6596/2511/1/012025.
Int. J. Turbomach. Propuls. Power 2024, 9(2), 16; https://doi.org/10.3390/ijtpp9020016
Submission received: 28 November 2023 / Revised: 19 March 2024 / Accepted: 18 April 2024 / Published: 8 May 2024

Abstract

:
Wall proximity affects the accuracy of pressure probe measurements with a particularly strong impact on multi-hole probes. The wall-related evolution of the calibration of two hemispheric L-shaped 3D-printed five-hole probes was investigated in a low-speed wind tunnel. Pressure measurements and 2D particle image velocimetry were performed. The wall proximity causes the probe to measure a flow diverging from the wall, whereas the boundary layer causes the probe to measure a velocity directed towards the wall. Both angular calibration coefficients are affected in different manners. The error in angle measurement can reach 7°. These errors can be treated as calibration information. Acceleration caused by blockage is not the main reason for the errors. Methods to perform measurements closer to the wall are suggested.

1. Introduction

Five-hole probes (5HPs) are a valuable tool in fluid dynamics studies. They are cost-effective and can be designed to be robust [1] and miniaturised [2,3]. Numerous efforts have been carried out by researchers to further improve the convenience and range of use of 5HPs. For example, Hall [4] offered a 3D-printable open-access probe design that does not need individual calibrations; alternative calibration methods, using several sets of calibration coefficient definitions depending on the flow direction, have been developed that widen the angle range of the probes [5,6]; pressure sensors have been embedded in the probe head itself to perform high-frequency measurements [7]; and traverse processes have been designed that optimise the measurement grid to speed up the traverses [8]. Also, when considering a full assembly comprising a probe and a traversing system, the sizes of interfaces tend to be smaller and safer than those of optical access (a few millimetres versus a few centimetres), making them the preferential choice for the characterisation of confined flows in secluded spaces. Nevertheless, different experimental error sources are generated in these conditions, such as intrusiveness (i.e., the modification of a portion of the flow field due to the presence of the measurement device [9]) and loss in accuracy in the wall-proximity region and within strong gradients [10]. The loss of validity of a classical “clean jet” calibration is the root cause for such behaviour.
The wall-proximity effect is known to appear when the probe is closer than two diameters from the wall [11,12]. Jangir also observed this threshold in his efforts to produce a miniature four-hole probe [13]. Because of the presence of the probe, streamlines are deflected away from the wall [9]. This effect is partially mitigated by an increase in shear in the boundary layer (deflecting streamlines towards it). Still, the error induced on the probe flow angle measurements quickly becomes unacceptable.
Smout [14] reports that a wedge probe, used for 2D measurements, has its static pressure and yaw angle measurement affected by the proximity of a wall. The yaw angle measurement error can reach 0.7° for 5° of yaw. Sang Woo [15] investigated the wall-proximity effect for a five-hole cobra probe featuring a conical head, measuring in a flow field characterised by boundary layers as thick as 2.8% of the probe diameter using the setup pictured in Figure 1. The authors reported a yaw angle error reaching 5° and a pitch angle error reaching 8°. They suggested keeping the probe at least two diameters from the wall, where its effect is initially perceived [15].
Treaster and Yocum [12] recommend avoiding measurements in the wall region as the effect on static pressure extends further than two diameters. In general, studies in the literature suggest employing as small as possible hardware, a path that cannot often be undertaken because of structural and manufacturing limitations [1]. Another obstacle to miniaturisation of 5HPs is the longer settling times of smaller probes [16]. As a consequence, a correction that allows measurements within the two-diameter wall distance is needed. A first step in this direction is to measure the evolution of the probe calibration as a wall region is approached.
This work aims to measure the magnitude and trends of the changes in angular calibration coefficients due to wall proximity for an L-shaped hemispherical five-hole geometry with a short stem (5HP). This probe will be employed in the BEARCAT engine research platform of SAFRAN [1]. After presenting the experimental setup and the methods, the experiment of Lee [15] will be compared to some configurations of the present work. The effect of a thicker boundary layer will be presented next, followed by considerations about the interaction between the boundary layer and the wall-proximity effects. The last section before the conclusion contains a discussion of the results and remarks on how the evolution of the local velocity field compares to the evolution of the calibration coefficients.

2. Materials and Methods

2.1. Setup

The objective of the setup is to traverse the 5HP at given yaw and pitch angles in a varying set of boundary layer thicknesses to probe diameter ratios and Mach numbers while performing pressure and PIV measurements.
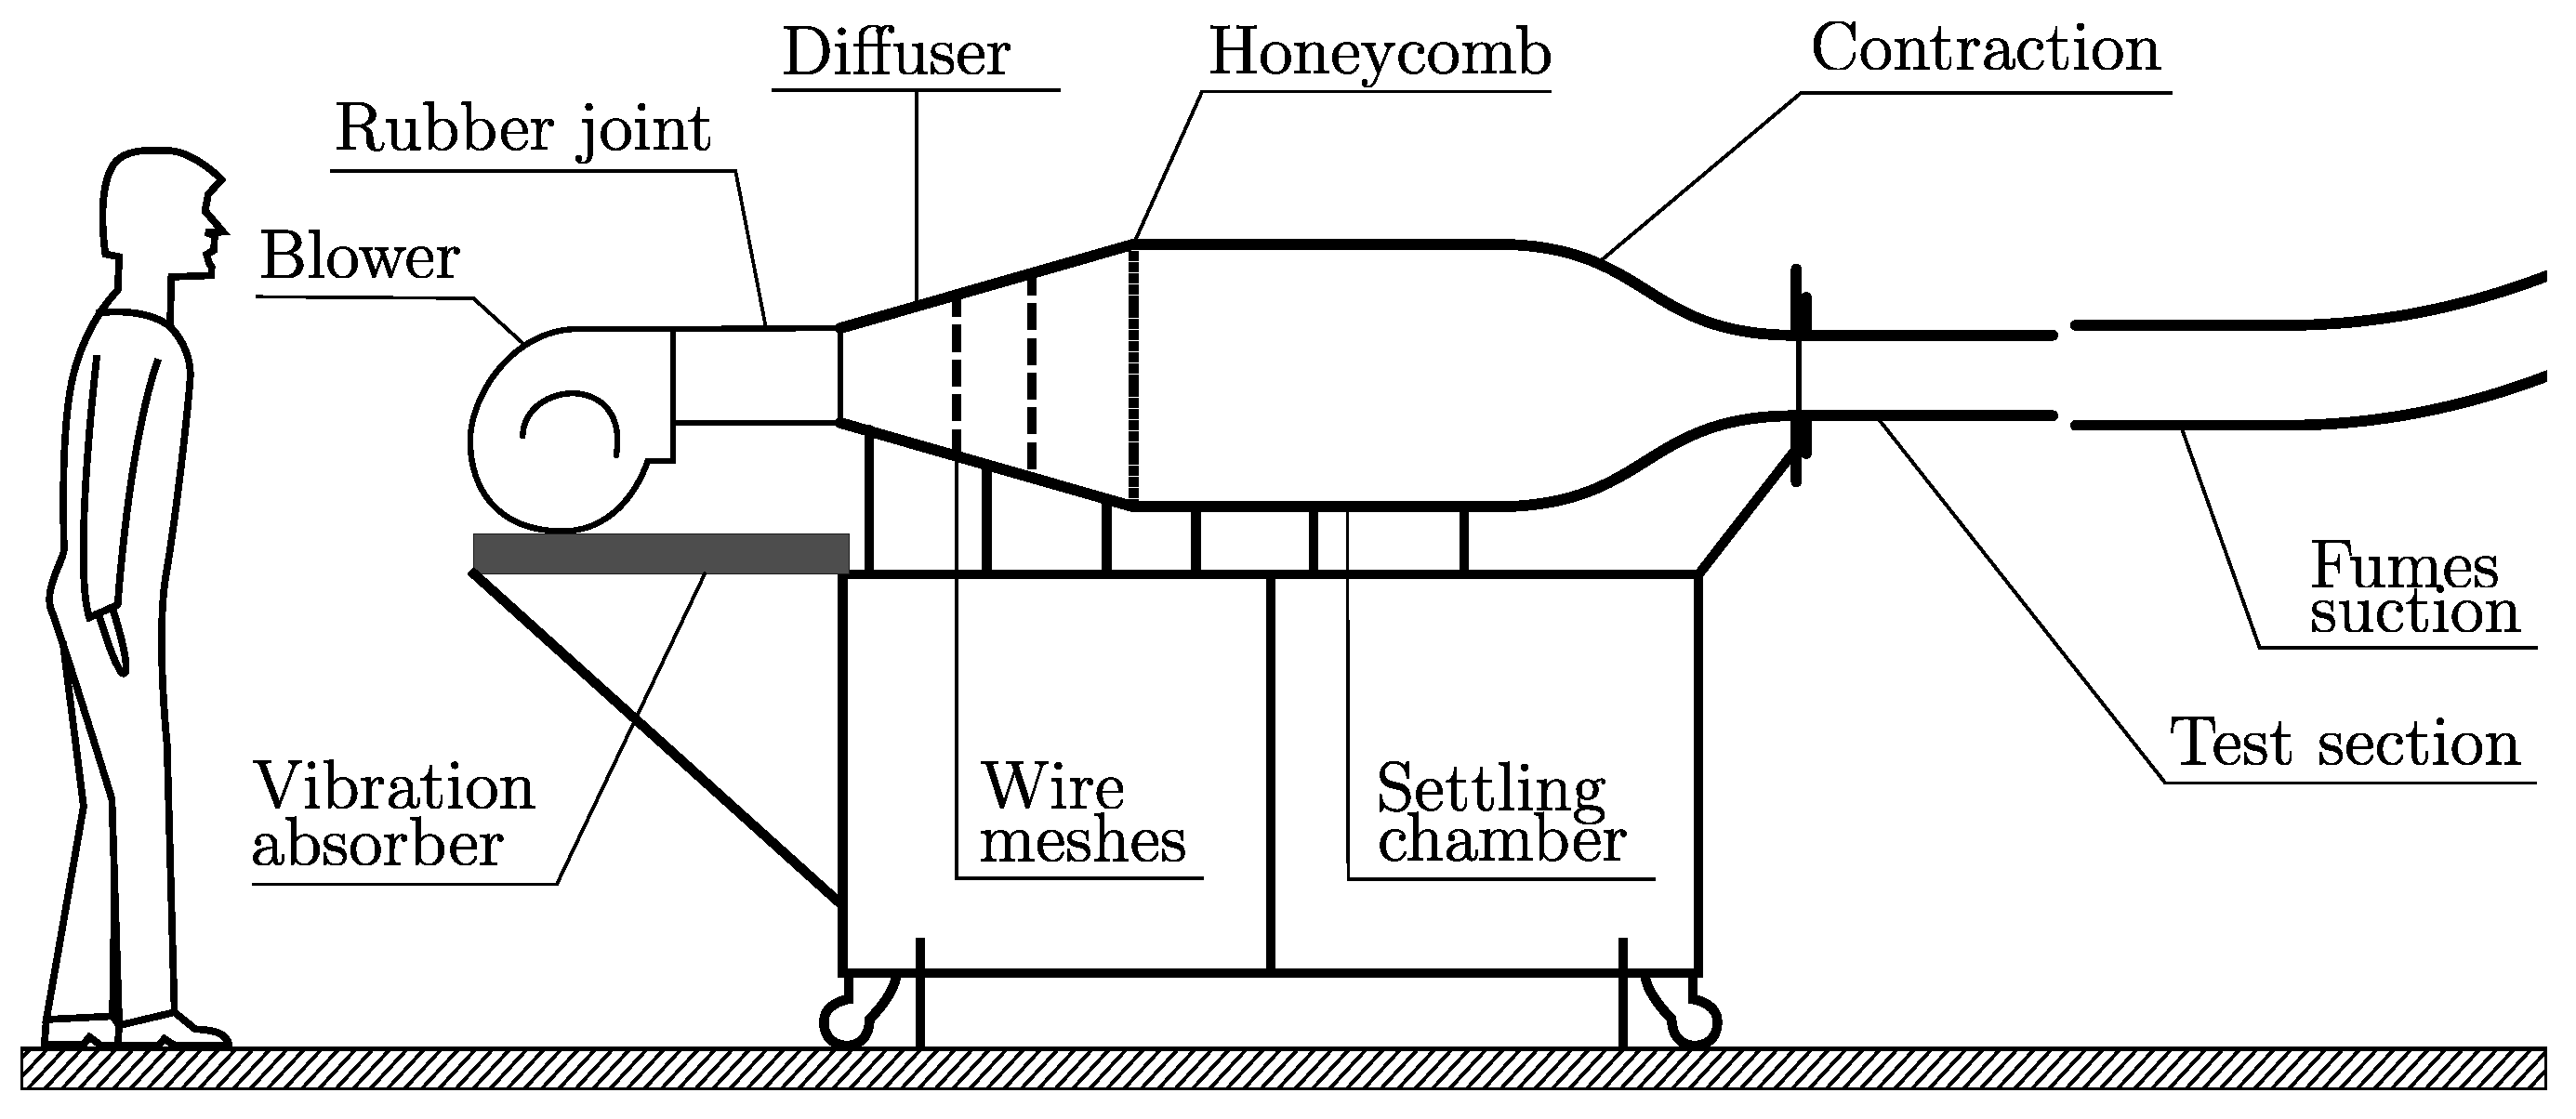
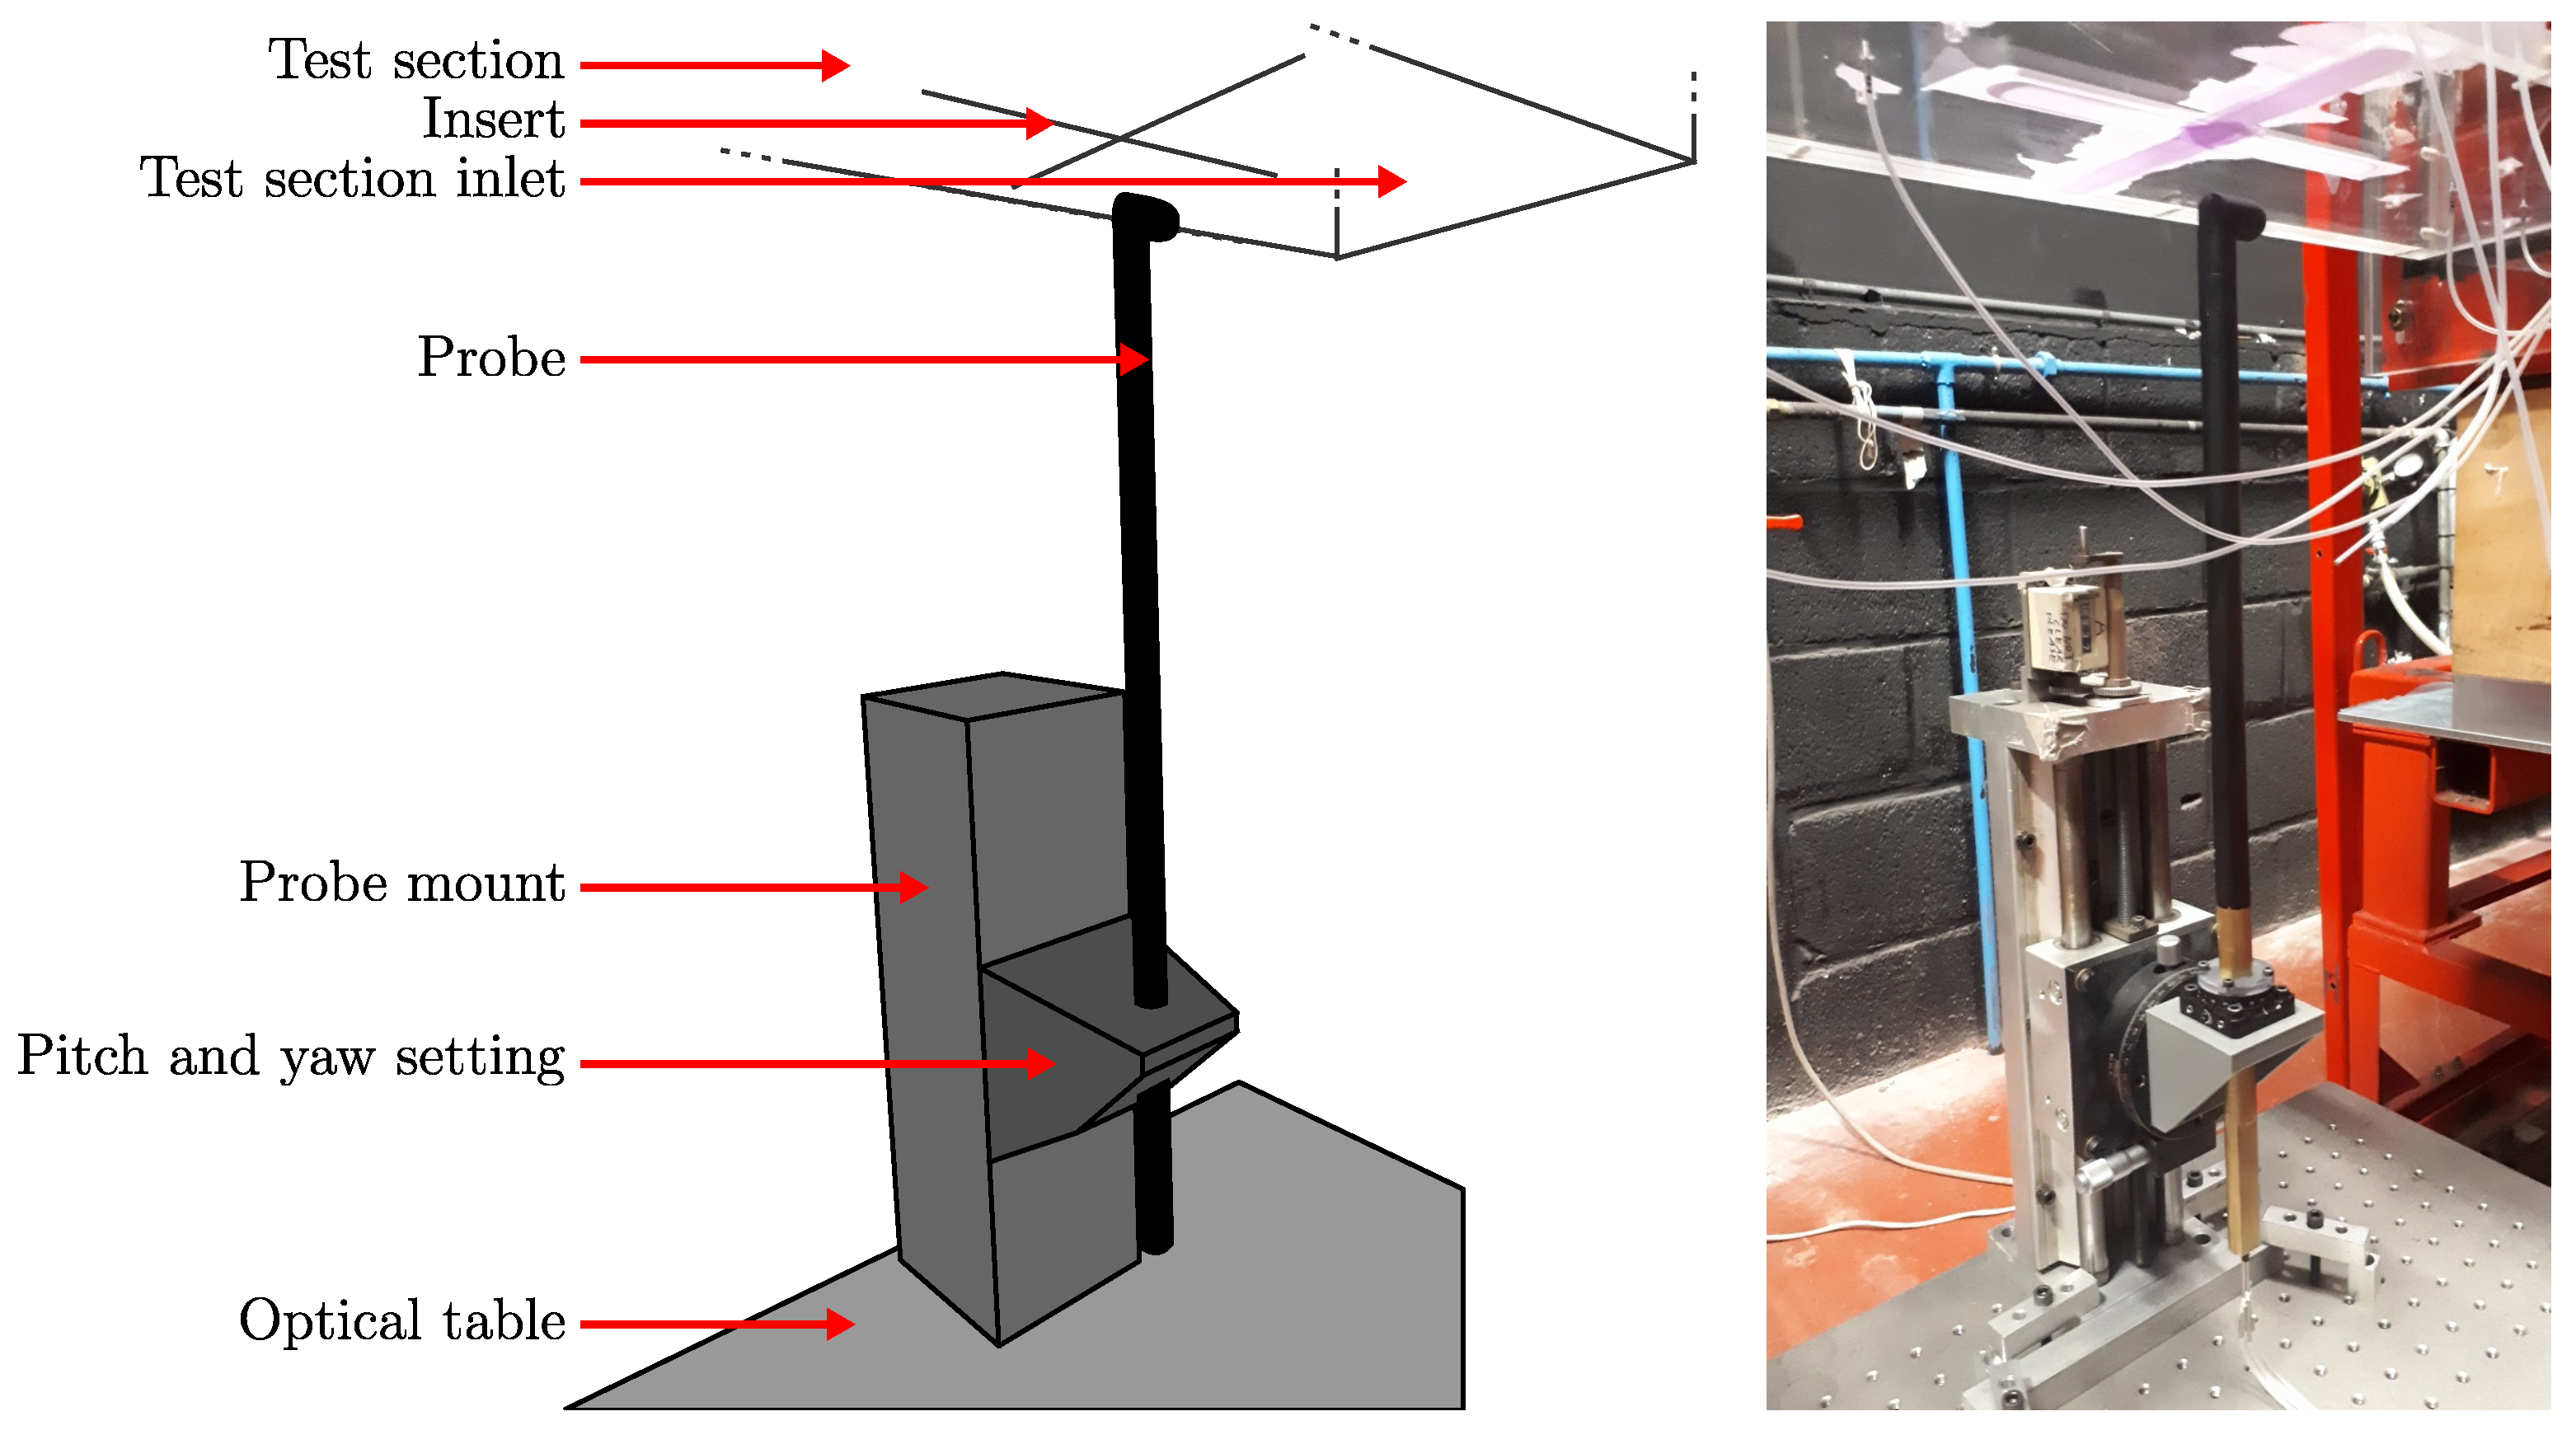
The L-12 wind tunnel of the von Karman Institute for Fluid Dynamics (VKI), represented in Figure 2, is a low-speed atmospheric wind tunnel, reaching Mach 0.05 at ambient temperature and pressure. The test section is 1 m long, with a 20 cm × 20 cm square cross-section. The test section discharges into a larger round suction pipe to evacuate the PIV smoke. There is a 3 cm gap between the test section and the suction pipe. This allows for the installation of a probe-traversing system, displayed in Figure 3, and for a flat plate with a sharp leading edge to be positioned at the mid-height of the cross-section. The test section features several static pressure tap ports at different axial locations. Finally, the test section is fully transparent, allowing for optical measurements to be carried out.
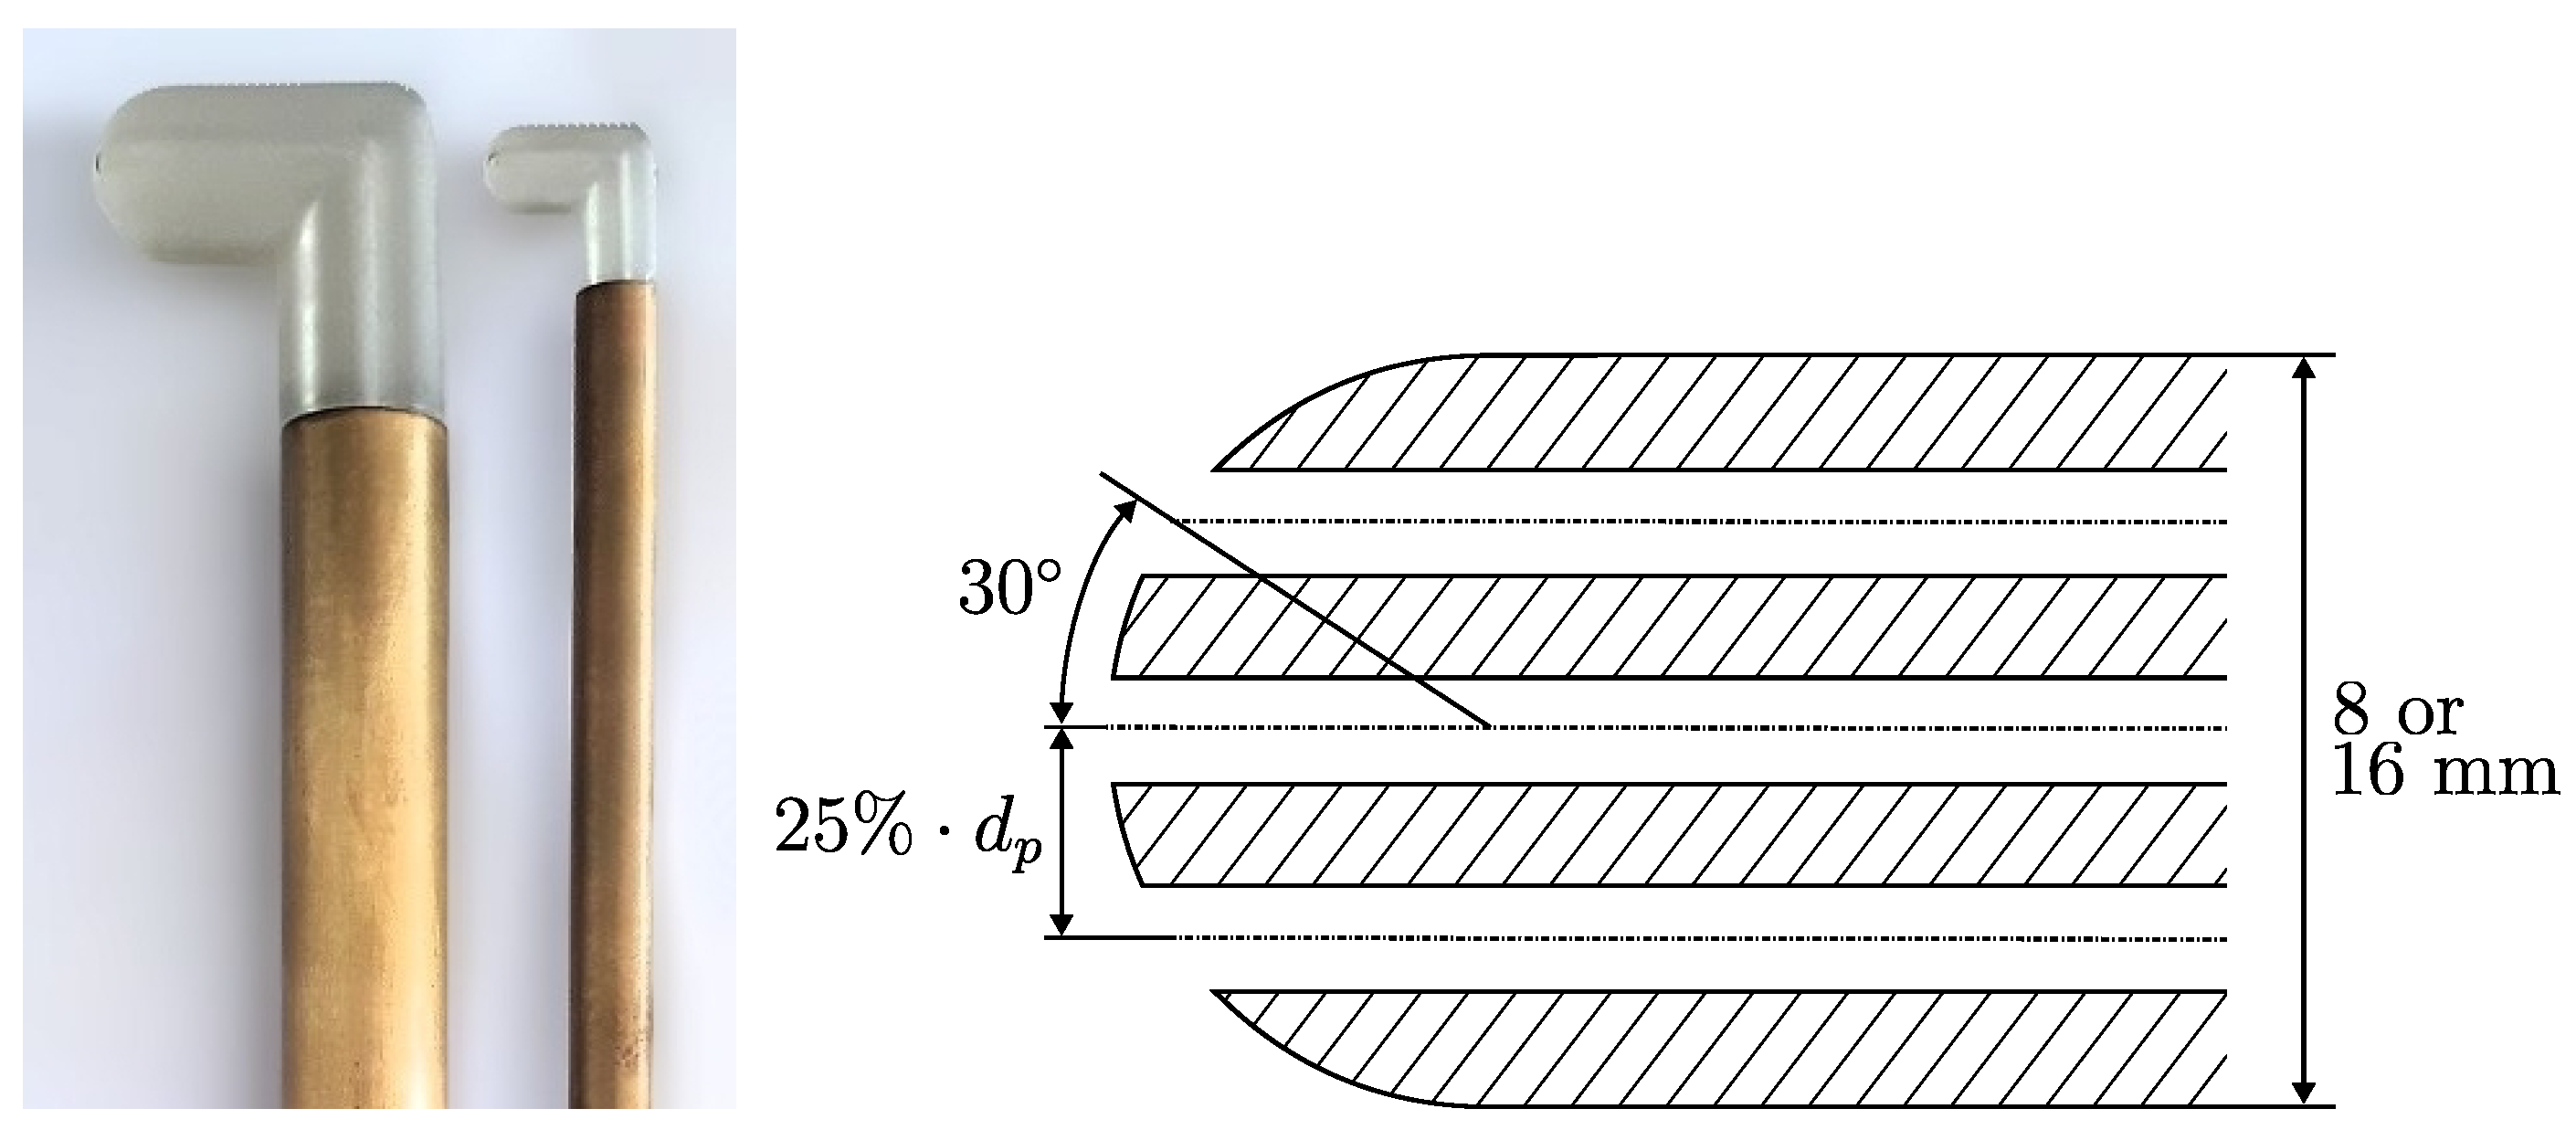
This work’s probe geometry is inspired by a probe used at SAFRAN on the BEARCAT test rig. It has a diameter of 4 mm. The probes used for this experiment are scaled up to diameters of 8 mm and 16 mm; see Figure 4. The upscaling aims at obtaining a relative boundary layer size small enough for the large probe to stay out of it during most of the traverse at the highest available Mach number.
The probe hole pressure sensors were ±250 Pa LBA bleed sensors from SensorTechnics. The static pressure was acquired by a ±86 Pa Validyne sensor and the total pressure by a ±220 Pa Validyne sensor. The sensors were calibrated using a Druck DPI610 250 Pa calibrator. The ambient pressure and temperature were recorded twice a day using the VKI atmospheric pressure service and a room thermometer. The wind tunnel was fitted with a 2D time-averaged PIV system. The PIV system had a Quantel Twins BSL200 laser head and LaVision Imager Intense cameras and was driven by DAVIS7 from LaVision.
Lee’s probe geometry is reported in Figure 1 [15]. Lee’s probe’s side holes are at a different angle than those of the probe in this work. As a consequence, the sensitivity to yaw and pitch of the angle calibration coefficients will differ between his work and the present investigation. With the head of Lee’s probe being further from the mast than this work’s probe, the calibration map is expected to be more centred, and the evolution of the coefficients near the wall is expected to be less orientation-dependent thanks to a weaker mast potential effect.

2.2. Methodology

The calibration coefficients were measured at different distances from the flat plate at two locations downstream of the leading edge. At the “upstream position”, 84 mm downstream from the leading edge, the boundary layer was expected to be 2.6 mm thick at 16 m/s, assuming it was turbulent. At the “downstream position”, 200 mm downstream of the leading edge, the boundary layer was expected to be 5.5 mm thick at the same bulk flow speed. The Reynolds number of the different configurations and the relative boundary layer size compared to the probe’s diameter are given in Table 1. The configuration of Lee [15] is reported as a reference.
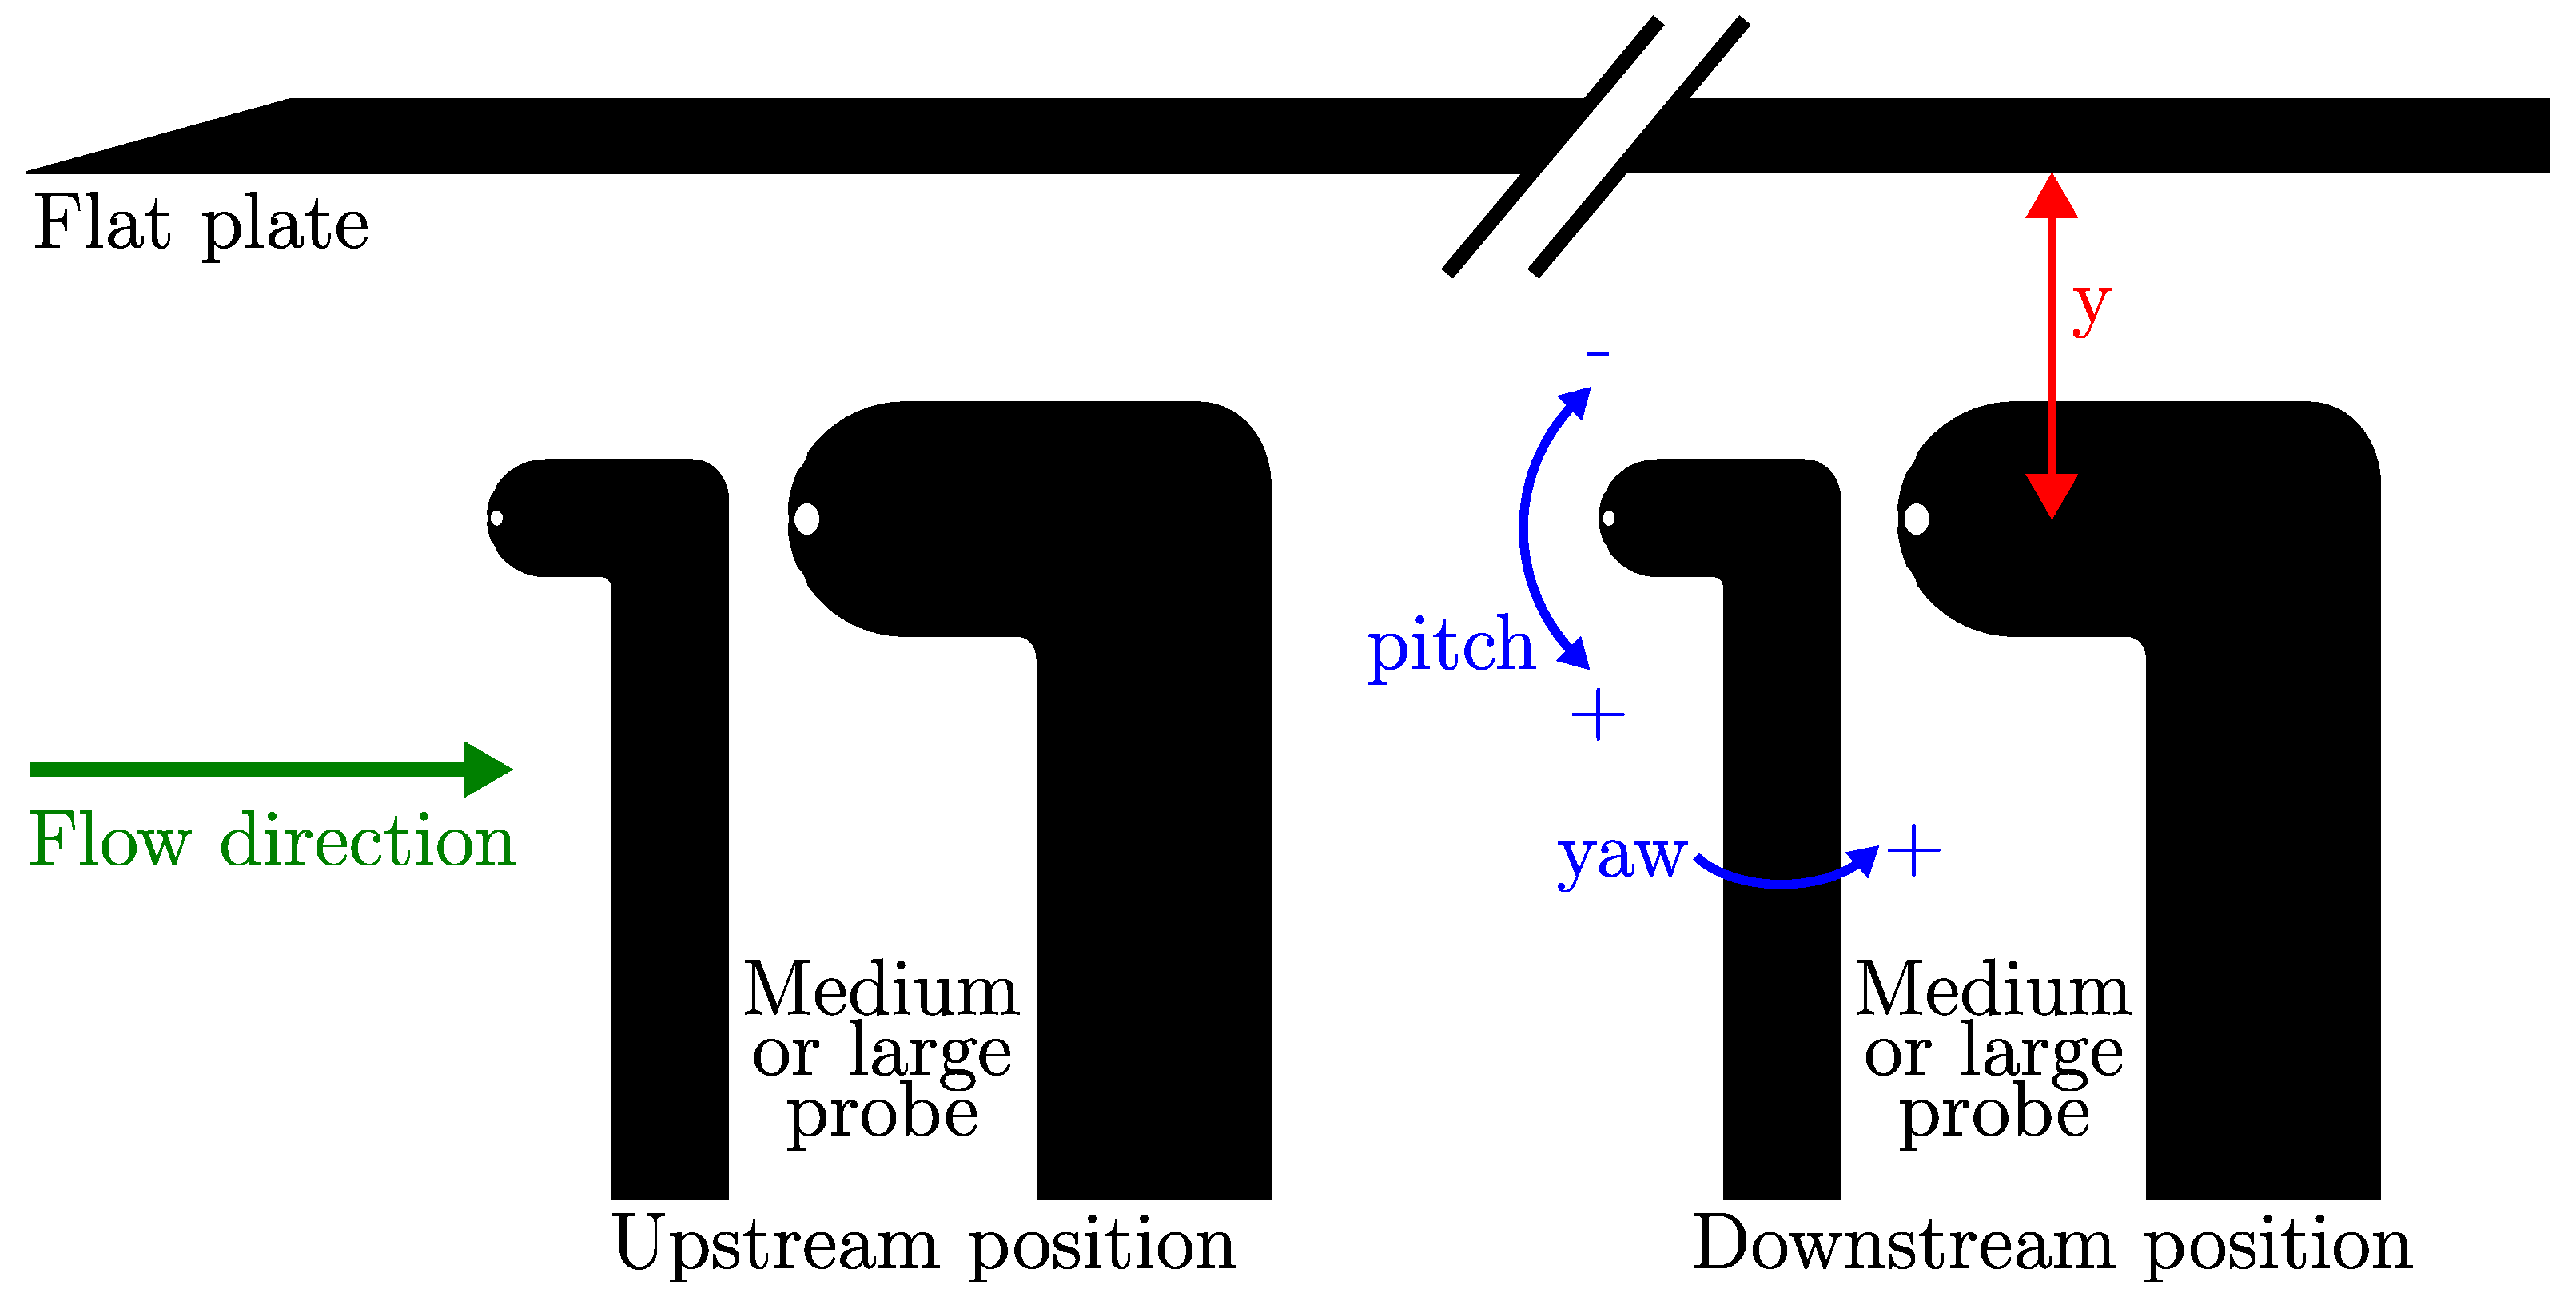
The probe head was traversed from 5 cm away from the flat plate, corresponding to distances of 6 diameters and 3 diameters for the 8 mm and 16 mm probes, respectively, until contact between the probe and the flat plate. The reference for the distance was the probe head centre, meaning that the minimum distance from the wall was 0.5 diameters. The traverse spatial resolution varied from half a diameter at the beginning to 0.1 diameters at the end. The probe mount allowed for horizontal translation, vertical translation, rotation around the probe mast axis (yaw), and rotation in the test section’s symmetry plane (pitch). When changing its pitch, the probe head was kept at a constant stream-wise position. A previous study has shown that a lateral change of less than 2 cm of the probe head does not change the pressure measurements. This means that the rotation around the mast axis is equivalent to a yaw rotation around the head centre. Figure 5 reports the layout of the experiment together with the adopted flow angle conventions.
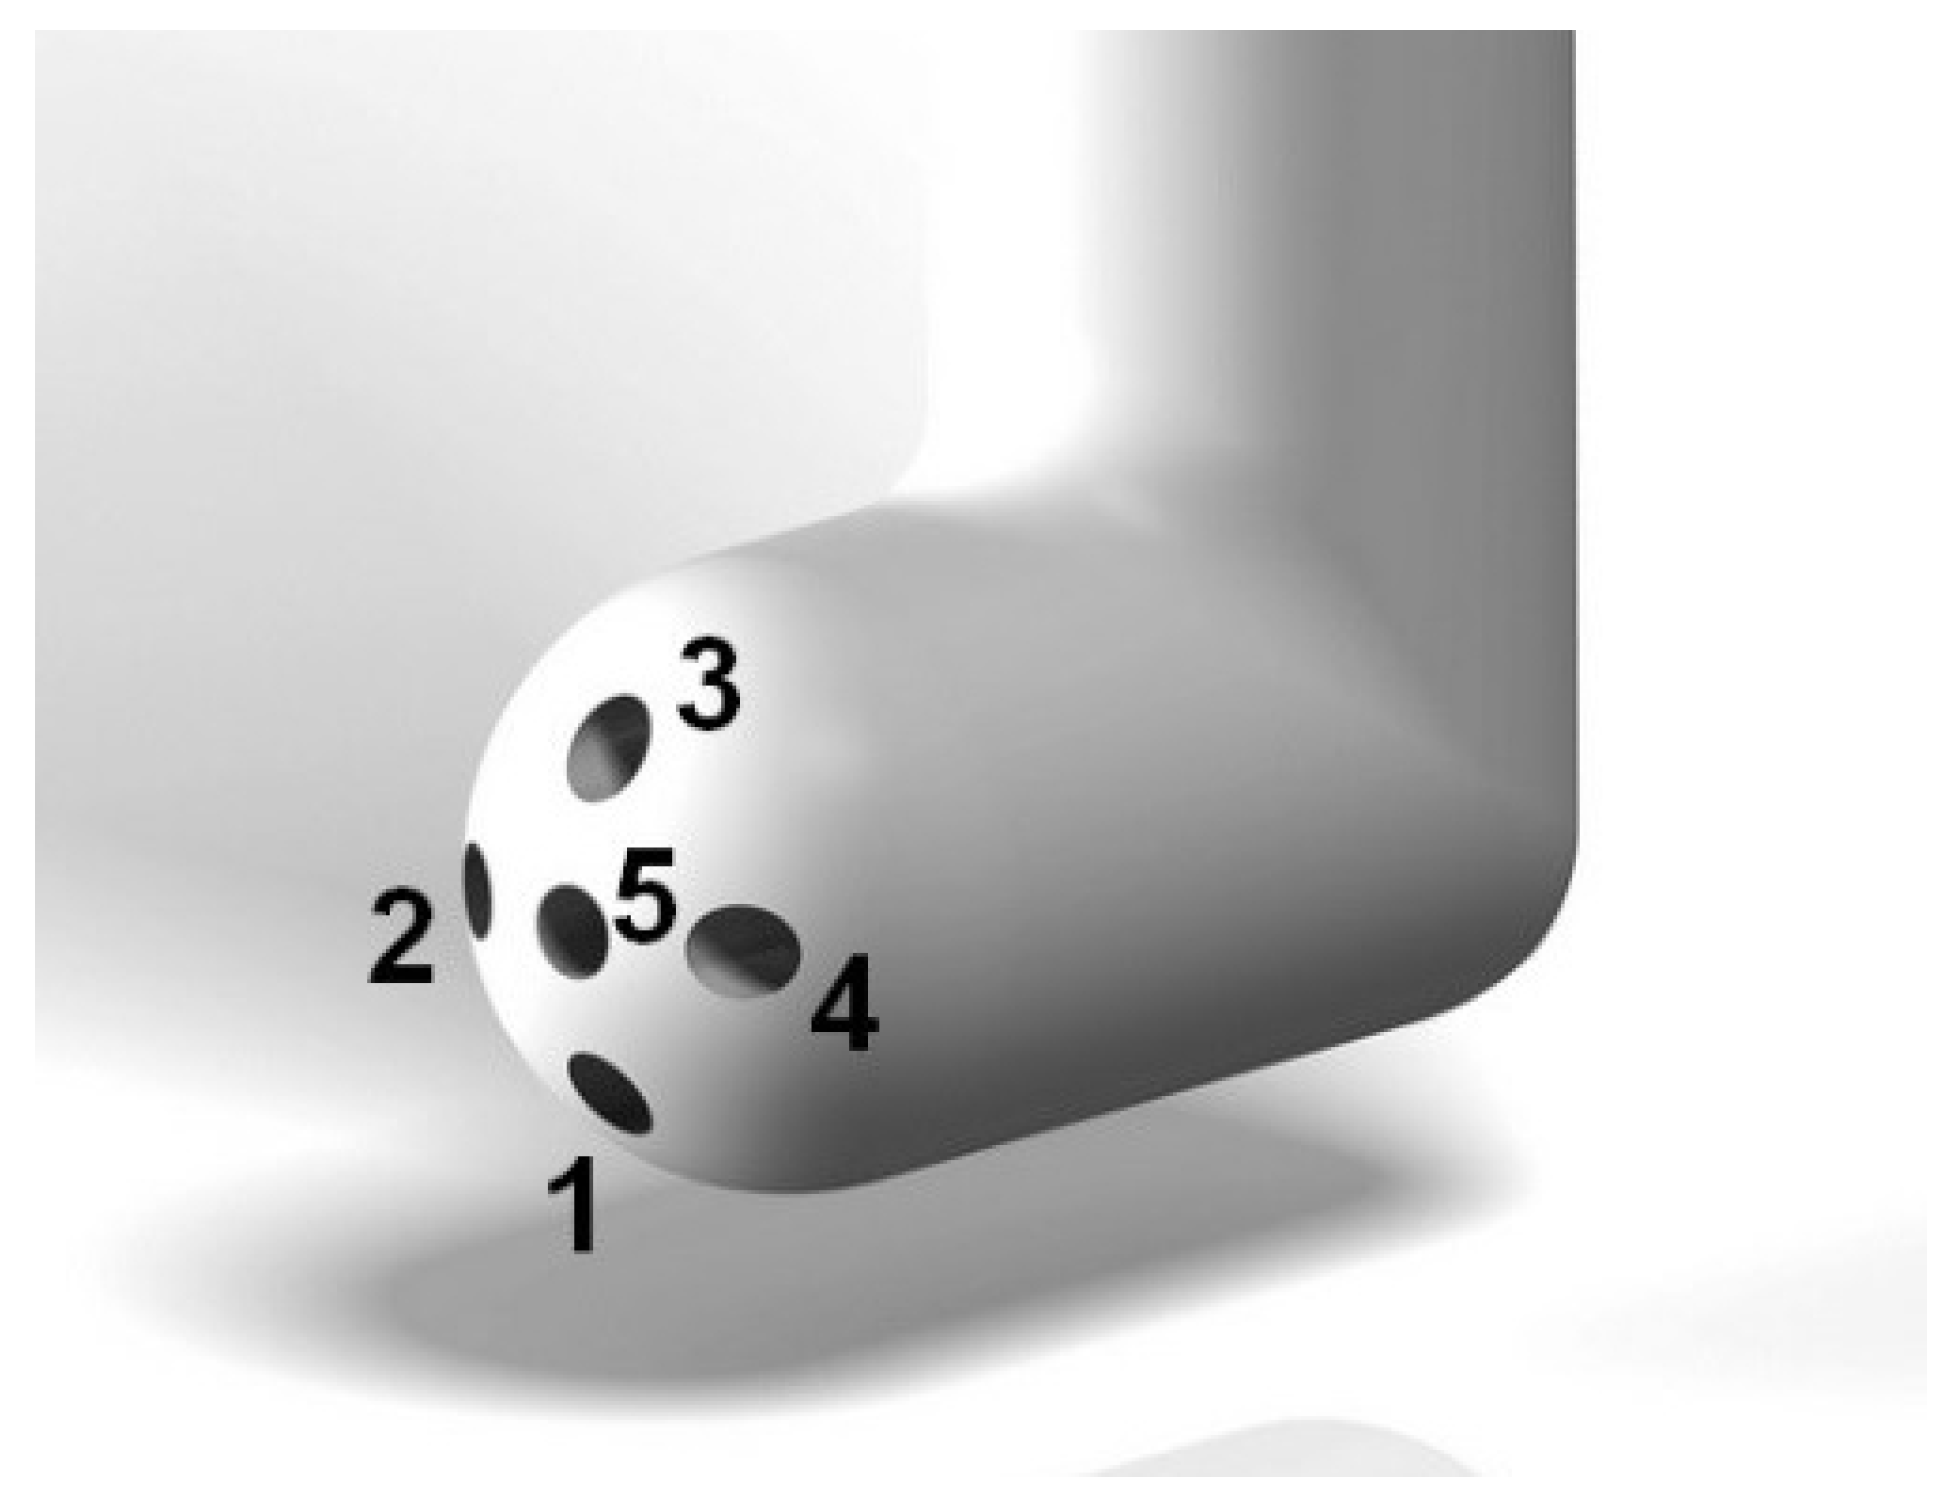
At each probe position, orientation, and height, the pressure data from the five probe holes, the static pressure on the test section wall, and the total pressure in the settling chamber were retrieved. Traverses were performed for different probe orientations relative to the flat plate, as presented in Table 2. The intent was to simulate real turbomachine environments where the probe is often not orthogonal to nearby walls. The 10° angle was chosen as it provides a significant difference between the measurements of each hole while ensuring independence of the yaw and pitch calibration coefficients. A preliminary calibration showed that the probe was symmetric in the yaw plane, allowing the number of measurements to be reduced by only studying positive yaw values. The mast forbids this assumption in the pitch plane. The pitch and yaw calibration coefficients are defined as follows, while the hole naming convention is reported in Figure 6.
k y a w = p 4 p 2 p 5 p ¯ k p i t c h = p 3 p 1 p 5 p ¯ p ¯ = p 1 + p 2 + p 3 + p 4 4
PIV was used for two reasons:
  • To provide information about the undisturbed flow field to use as a reference of what the probes should measure;
  • To provide information about the local flow around the probe to help understand the changes in pressure coefficient due to the wall proximity.
PIV measurements were made without the probe to measure the undisturbed flow field, comprising the boundary layer and part of the free flow outside the boundary layer, and with the probe installed. In the cases with no mechanical yaw, the flow field disturbed by the probe was measured by PIV every five probe positions. The PIV parameters were as follows:
  • 2 to 3 pixels of particle size on the camera sensor;
  • 8 pixels displacement between each frame in the free stream;
  • 10 particles per 32 × 32-pixel window.
The post-processing parameters were:
  • adaptative PIV;
  • 64 pixels maximum window size;
  • 8 pixels minimum window size;
  • 4 pixels grid step size;
  • 1.3 minimum peak height ratio;
  • outlier detection.
The post-processing was performed using the software DynamicStudio 6.4 by Dantec Dynamics.

2.3. Data Quality

The identified sources of uncertainty are displayed in Table 3. Apart from the uncertainties of the pressure sensors, the uncertainties in the yaw and pitch measurements due to the data reduction method were calculated from statistics on the measured yaw and pitch values in 15 independent free-stream realisations. For the PIV, the number of image pairs was determined to match the uncertainty and confidence interval shown in Table 3, based on the Gaussian distribution of the velocity in the post-processed images. The standard deviation of the velocity norm in the area of interest around the probe head was used as the estimation of the variance. It reaches 10% of the velocity. The errors due to the camera calibration are very low in comparison, due to the angle of the camera being less than 1°.
No hysteresis linked to the direction of the probe movement or to velocity or yaw changes was reported.

3. Results

The results are in three main parts. In Section 3.1 and Section 3.2, the wall-proximity effect is investigated. Section 3.3 focuses on the effect of the boundary layer. Finally, Section 3.4 discusses the coupling between these two sources of errors.

3.1. Wall-Proximity Effect

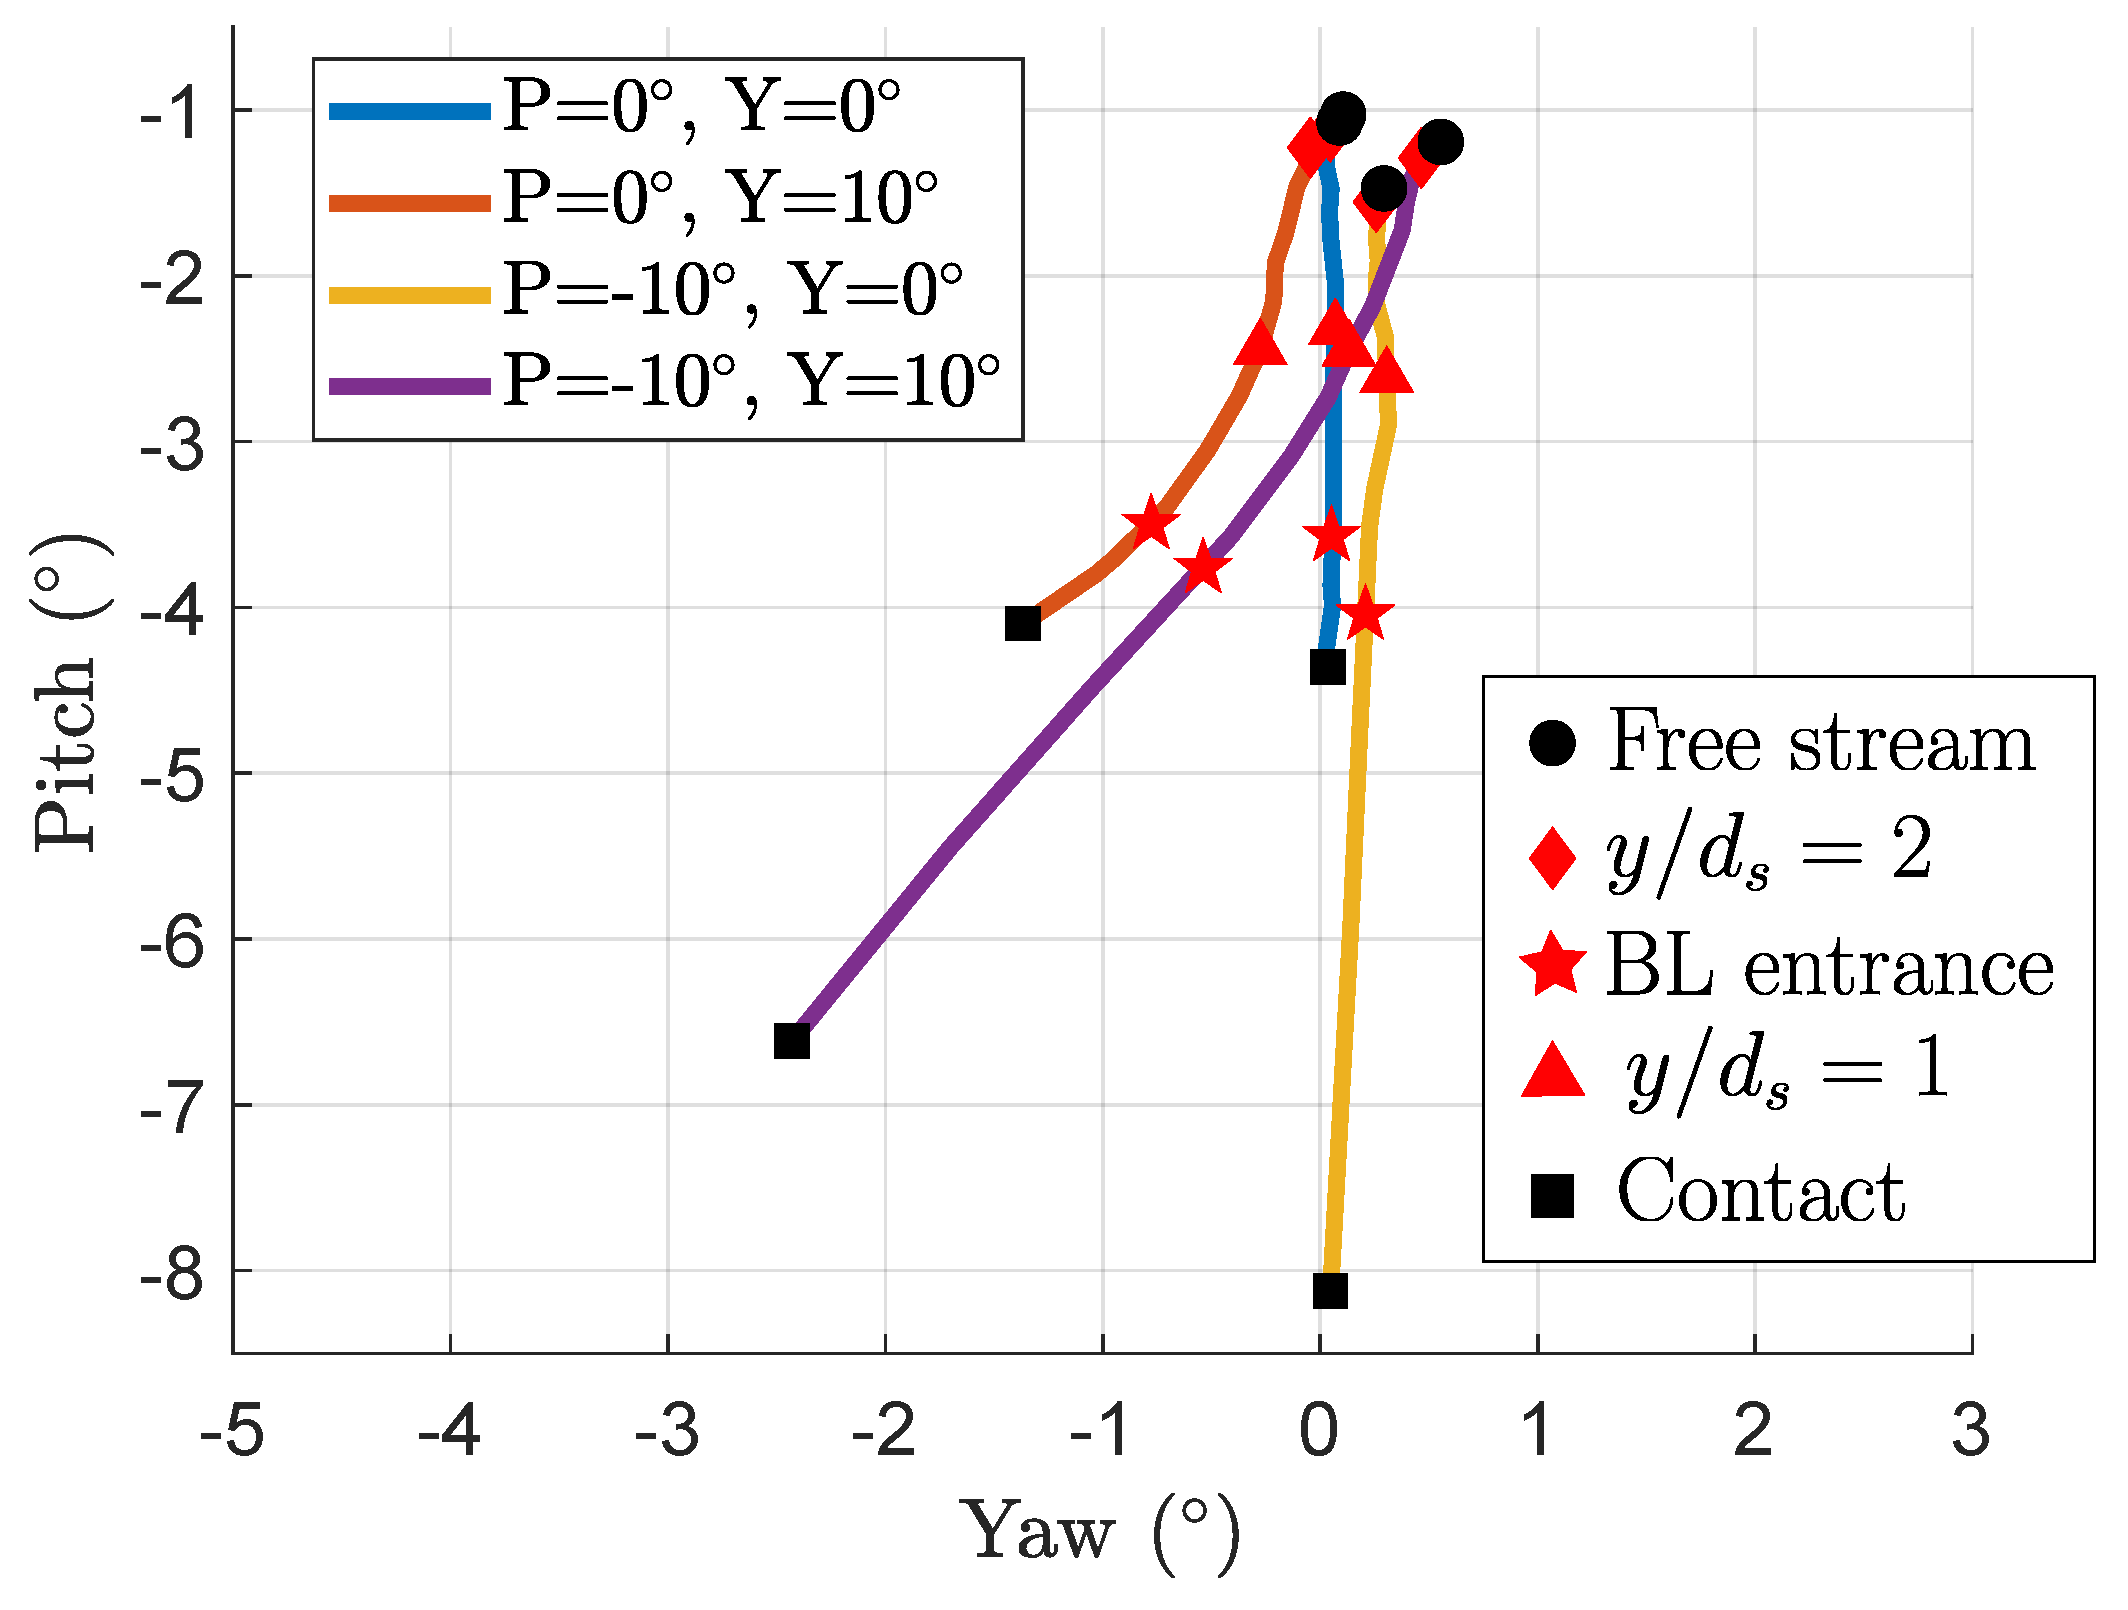
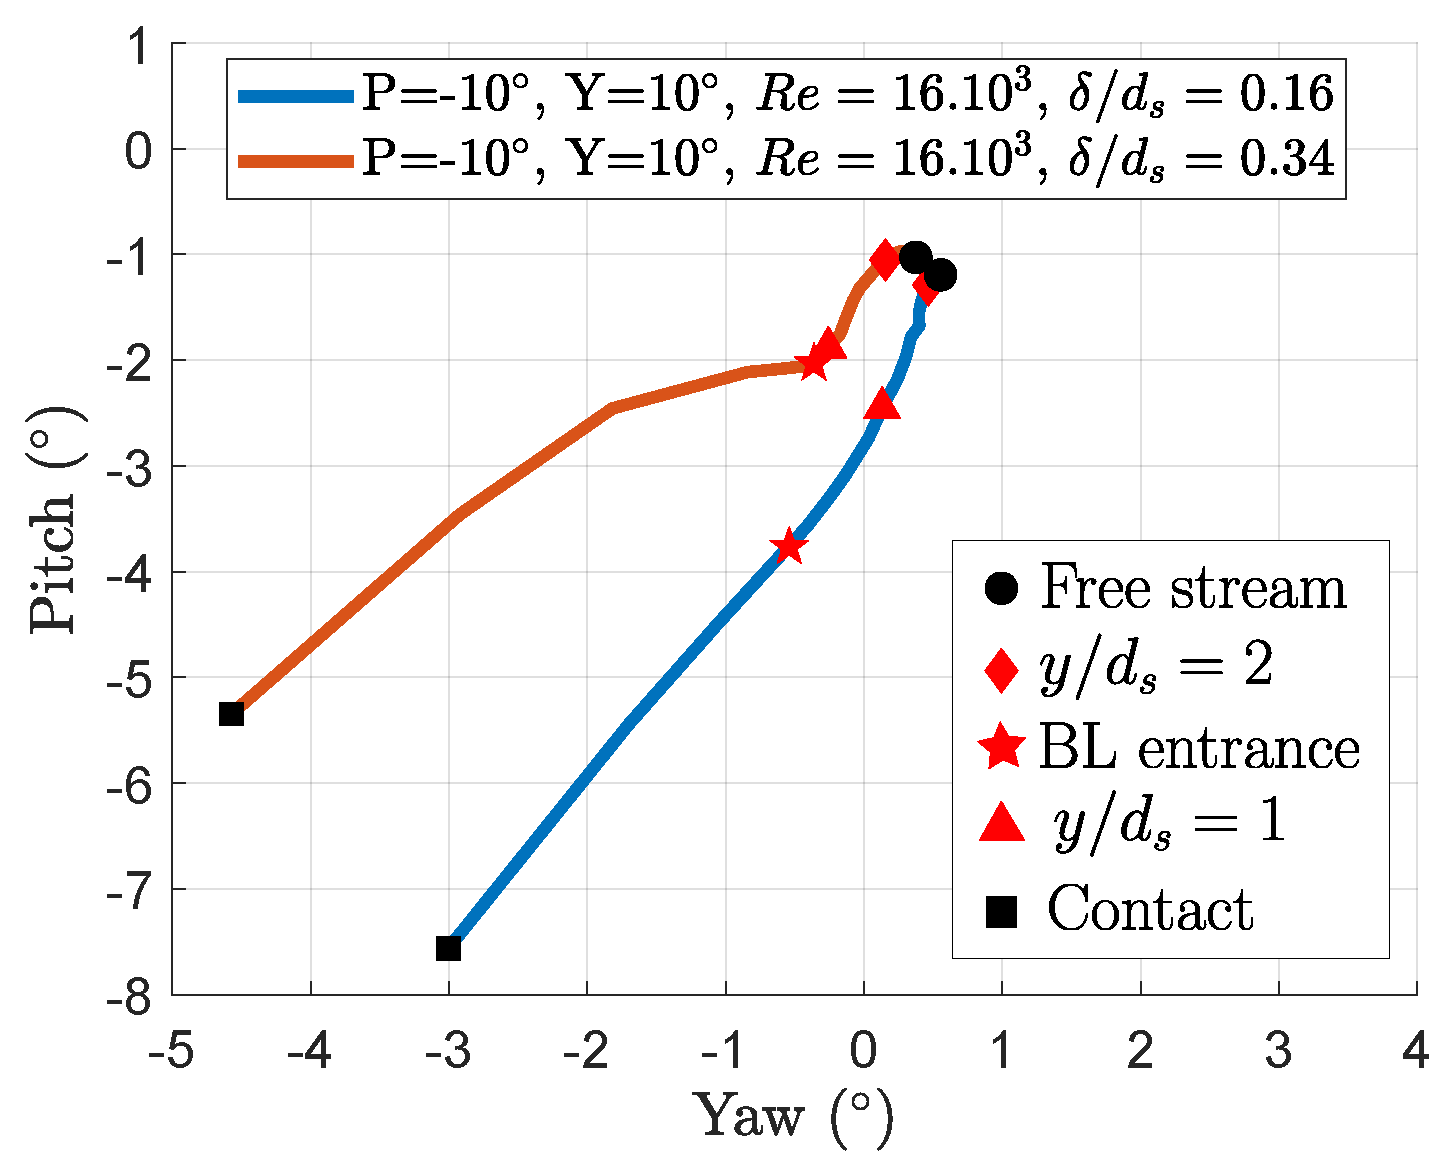
Among the investigated configurations, the δ 99 / d p = 0.16 case is the closest to the setup of Lee [15] ( δ 99 / d p = 0.028 ), taken hereafter as reference. The pressure data from the probe are interpreted using a free-stream calibration performed beforehand. In the current arrangement, the flow should exhibit a zero radial and transversal velocity component (i.e., fully parallel to the walls) so that the measured flow angles should be either zero or constant if a mechanical offset exists. Figure 7 shows a representative example of the evolution of the readings of a probe when approaching the wall. The same representation is used for the analysis of the actual results. The black circle represents the beginning of the traverses, three or six diameters away from the wall. The red star shows where the probe starts to be immersed in the theoretical boundary layer (BL), and the red diamond and triangle show, respectively, where the probe is two and one diameters away from the wall.
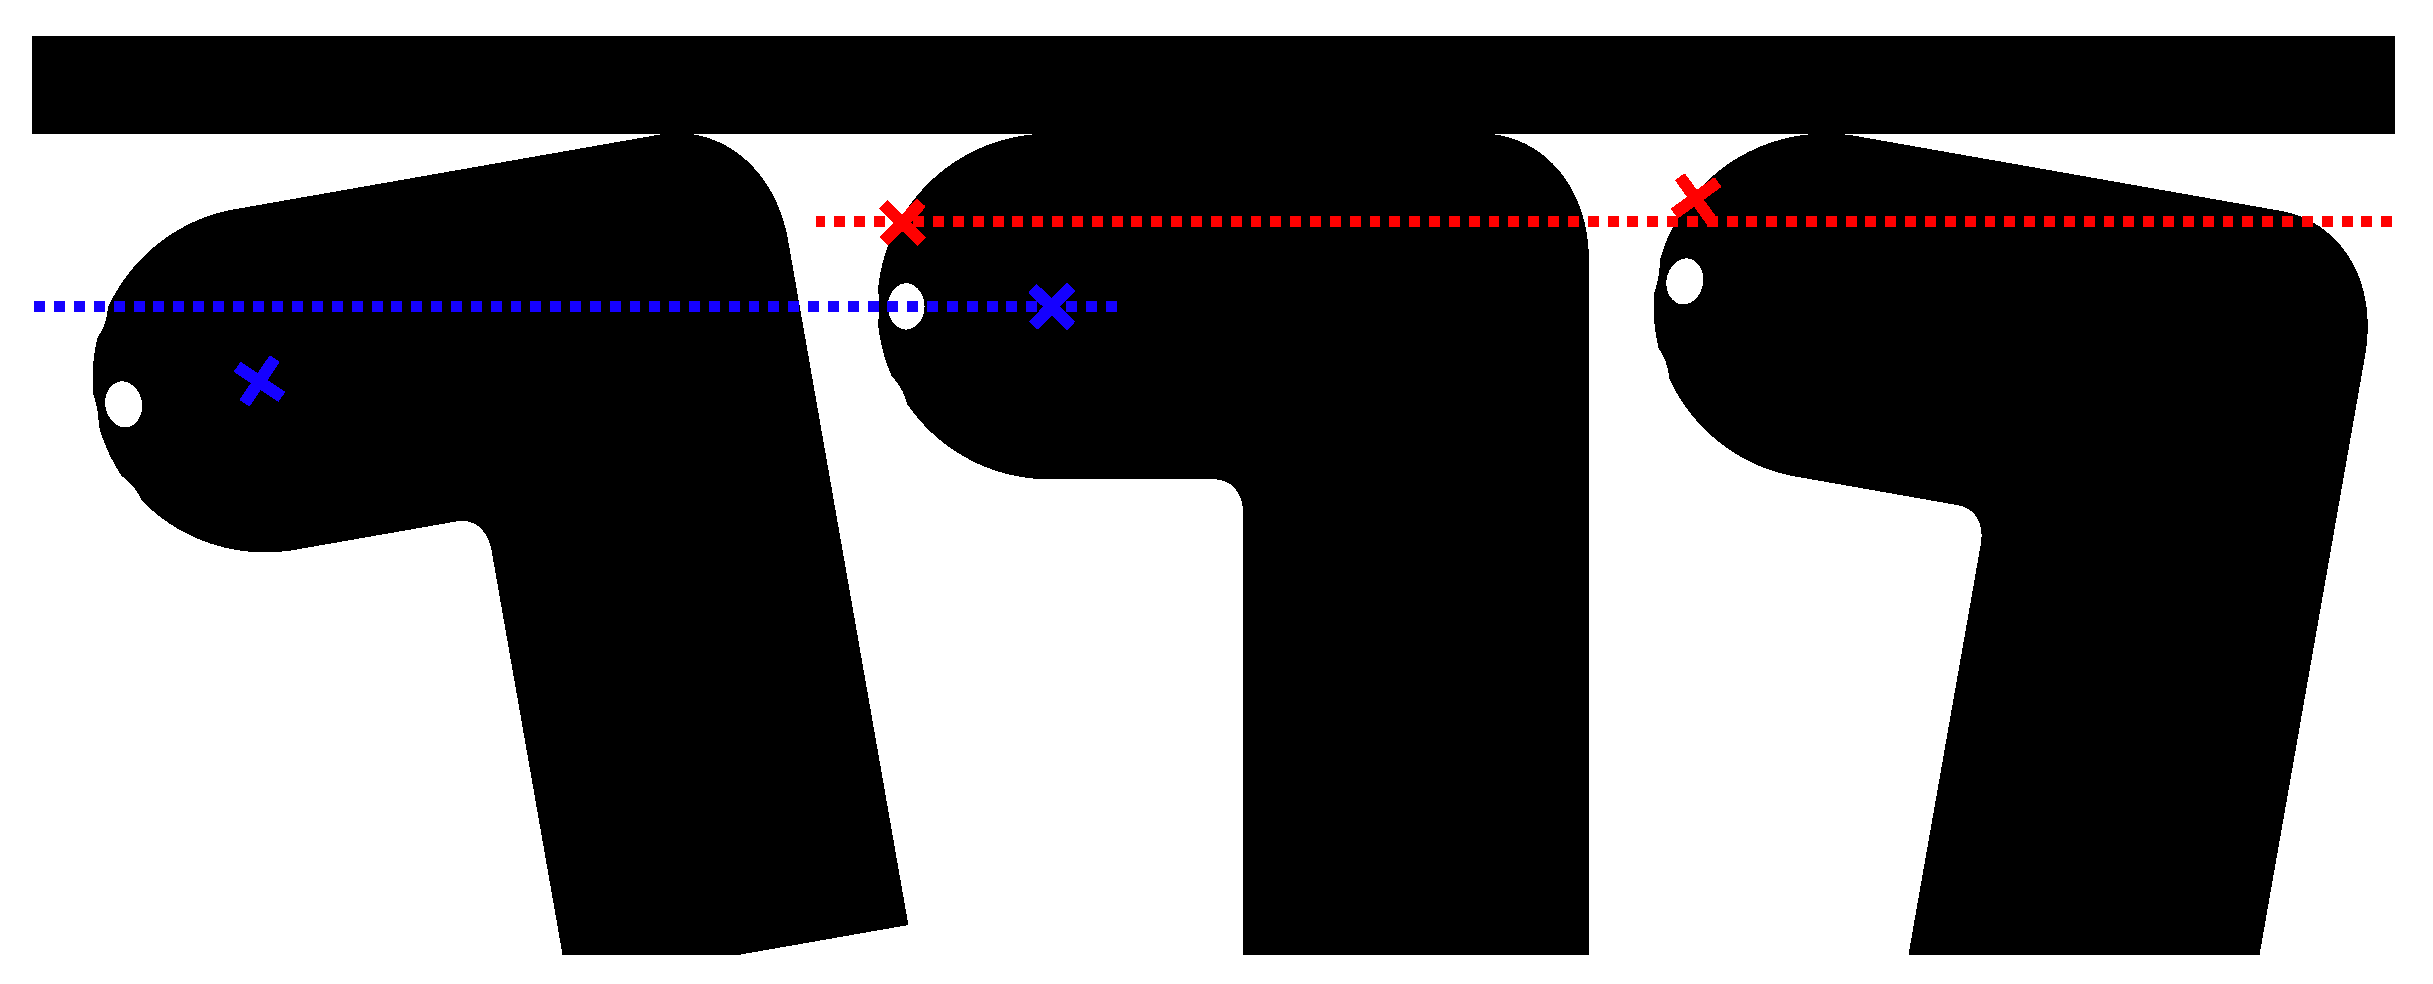
Figure 8 reports the evolution of the perceived flow angles in the case with δ 99 / d p = 0.16 and R e = 16 · 10 3 and for four different mechanical pitch and yaw arrangements of the probe. The yellow and blue curves show that the measurements in yaw are unaffected by the wall proximity when the probe head is aligned with the flow. The purple and red curves show that the non-zero mechanical yaw creates a yaw measurement error. Comparison of the red and blue curves with their negative mechanical pitch counterparts shows that the error in pitch and yaw measurements is much stronger for negative pitch angles. The most significant change in the pitch (resp. yaw) coefficient detected corresponds to a 7° (resp. 3°) variation in pitch (resp. yaw). In those positions, the probe’s top hole ( P 1 ) comes closer to the wall, as shown in Figure 9, which might be the reason for the more substantial effect. The pitch error is smaller when there is a yaw error, but the extent of the curve is almost the same, as shown in Table 4. The position of the probe is, therefore, a key parameter in the magnitude of the error caused by wall proximity in the interpretation of the pressure data. This means that the orientation of walls should be part of the recorded data during traverses subject to the wall-proximity effect.
This formalisation reveals that the error starts when the probe is two diameters away from the wall for all three probe positions. This could be the threshold for deciding whether to include the wall orientation in the traverse data. This is the standard value found in the literature for the upper boundary of the wall-proximity effect.
Lee’s results [15] show the same threshold for the wall-proximity effect. The evolution of the calibration coefficients in his work can be compared with the case δ 99 / d p = 0.16 and R e = 16 · 10 3 from the present study. The x-axis in the data from [15] is reversed for two reasons:
  • This experiment has a pitch coefficient definition opposite to the one from [15];
  • This experiment uses a different positive yaw direction.
As the probe geometries are different, a linear transformation was applied to be able to compare the results in Figure 10. The evolution of the yaw angle coefficient retrieved in [15] is totally compatible with the one obtained in the present work (see Figure 10a). Differences arise for the pitch coefficient when the probe is orthogonal to the flat plate, as shown in Figure 10b in blue. The similarity of Lee’s blue and green curves compared to the difference between the same curves for this work’s results shows the importance of having the mast far from the probe head to simplify the probe operation. If the probe coefficients behave similarly for all probe mechanical positions, then the evolution of the coefficients is easier to predict.
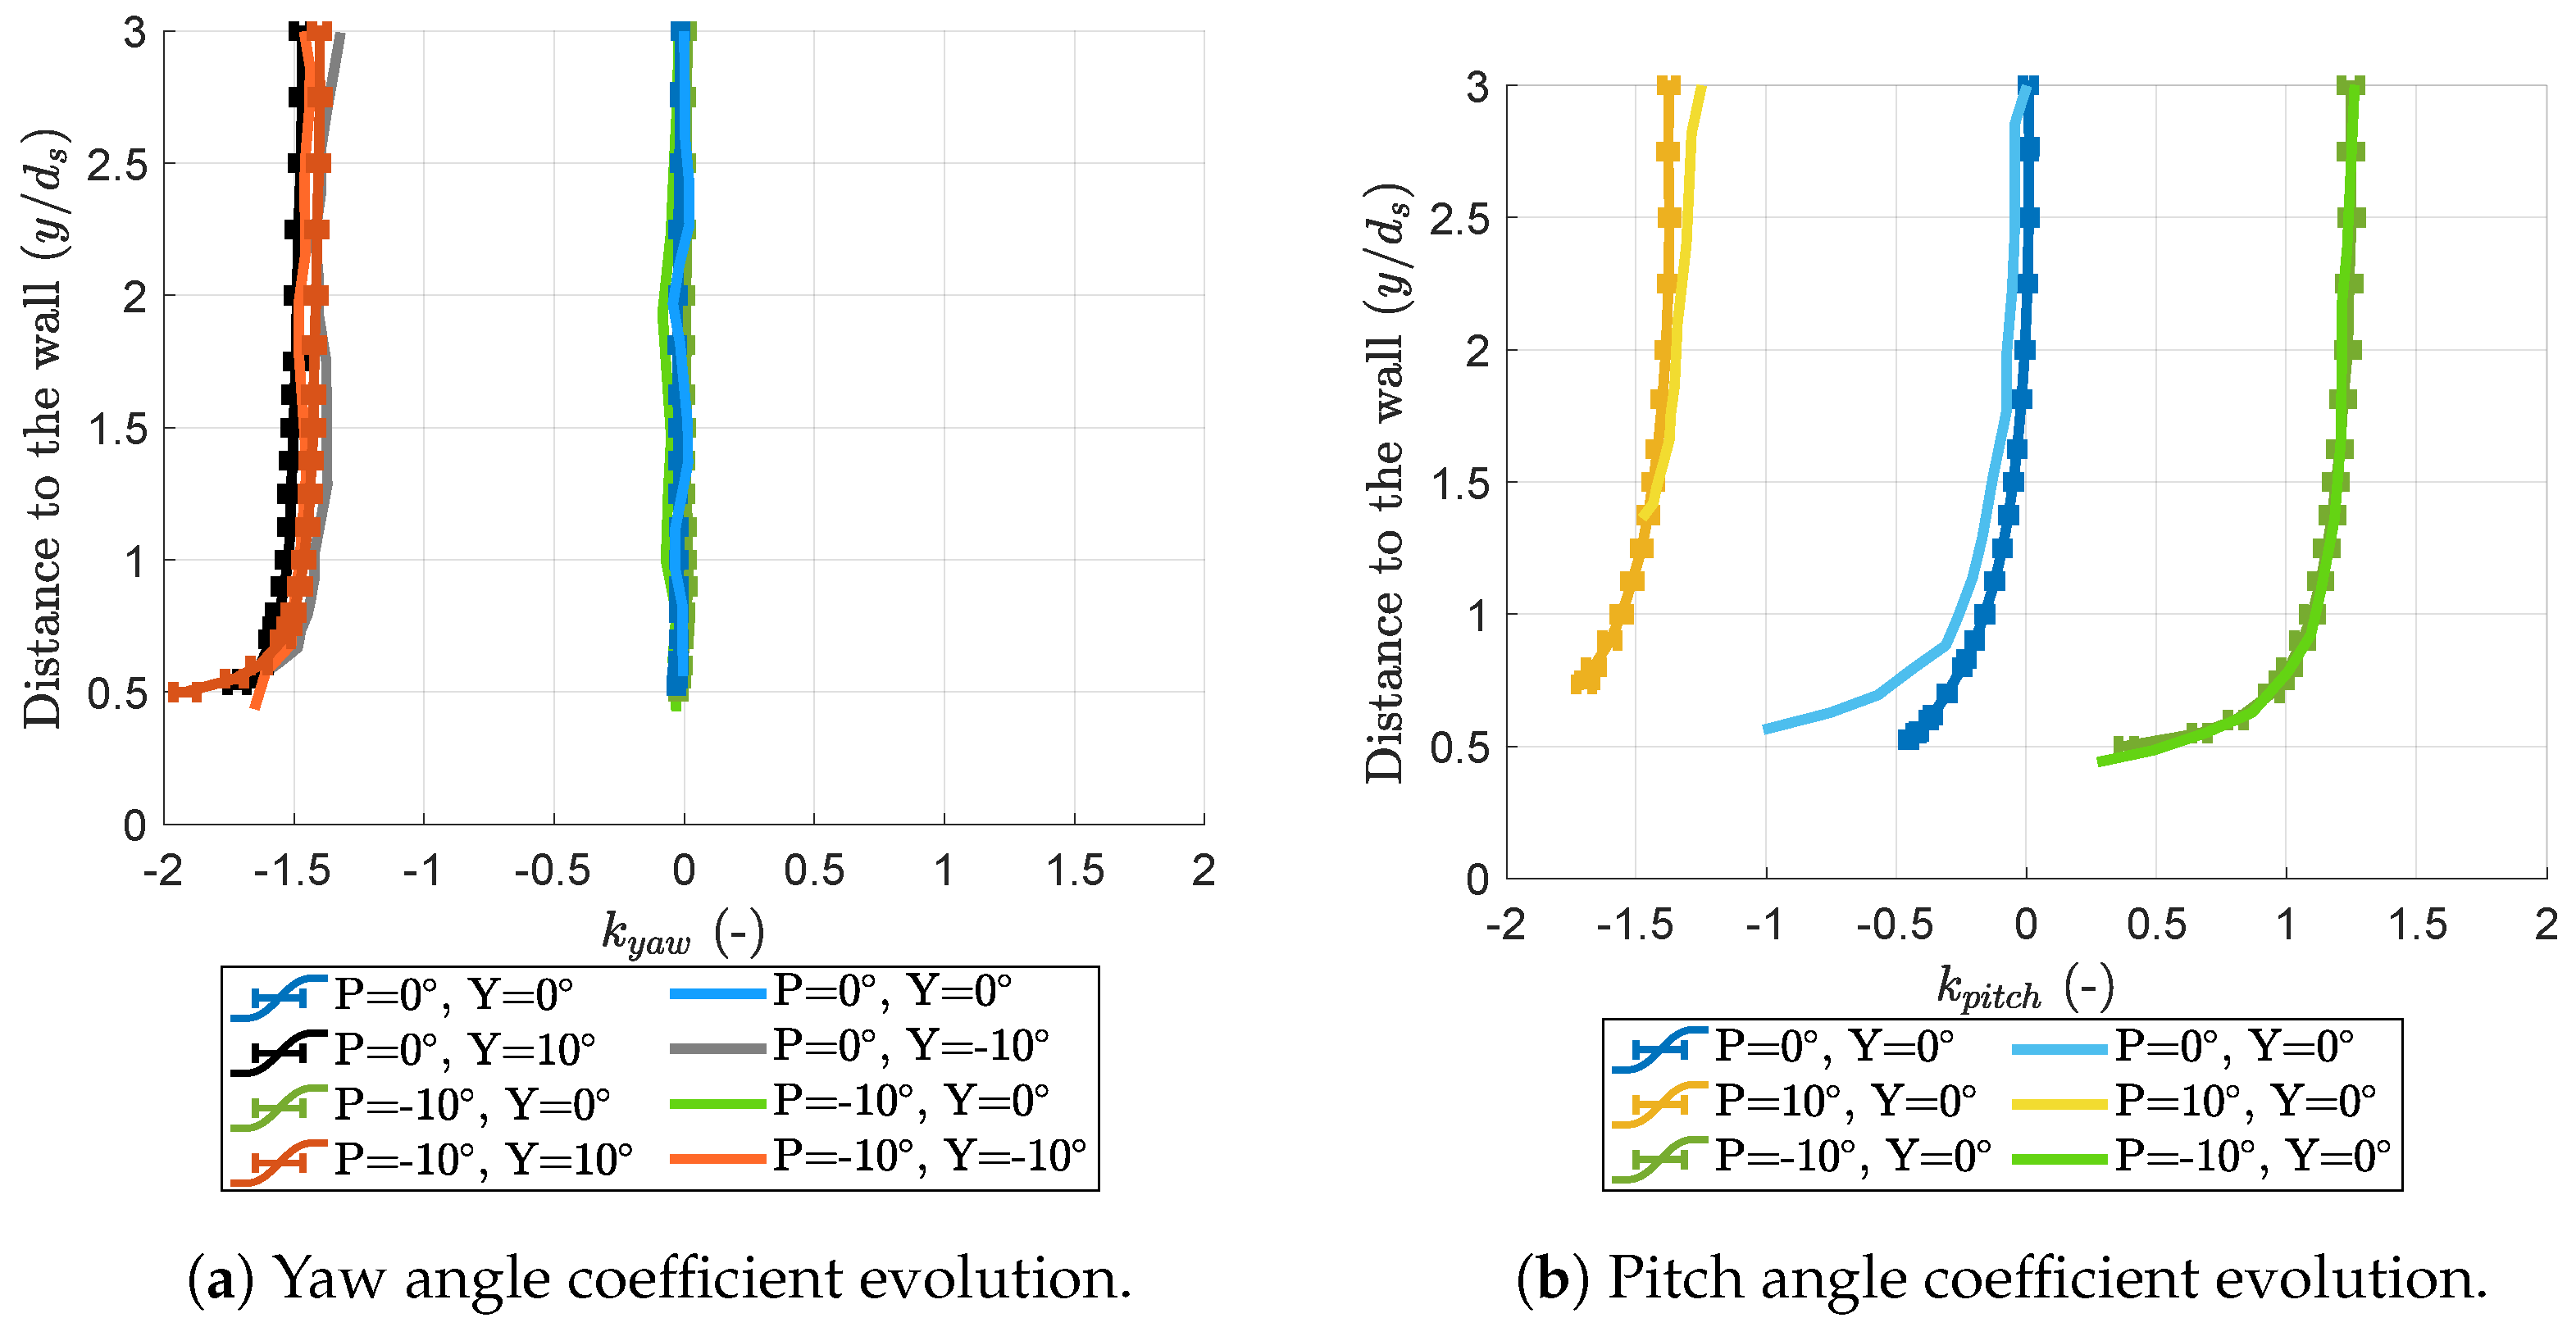
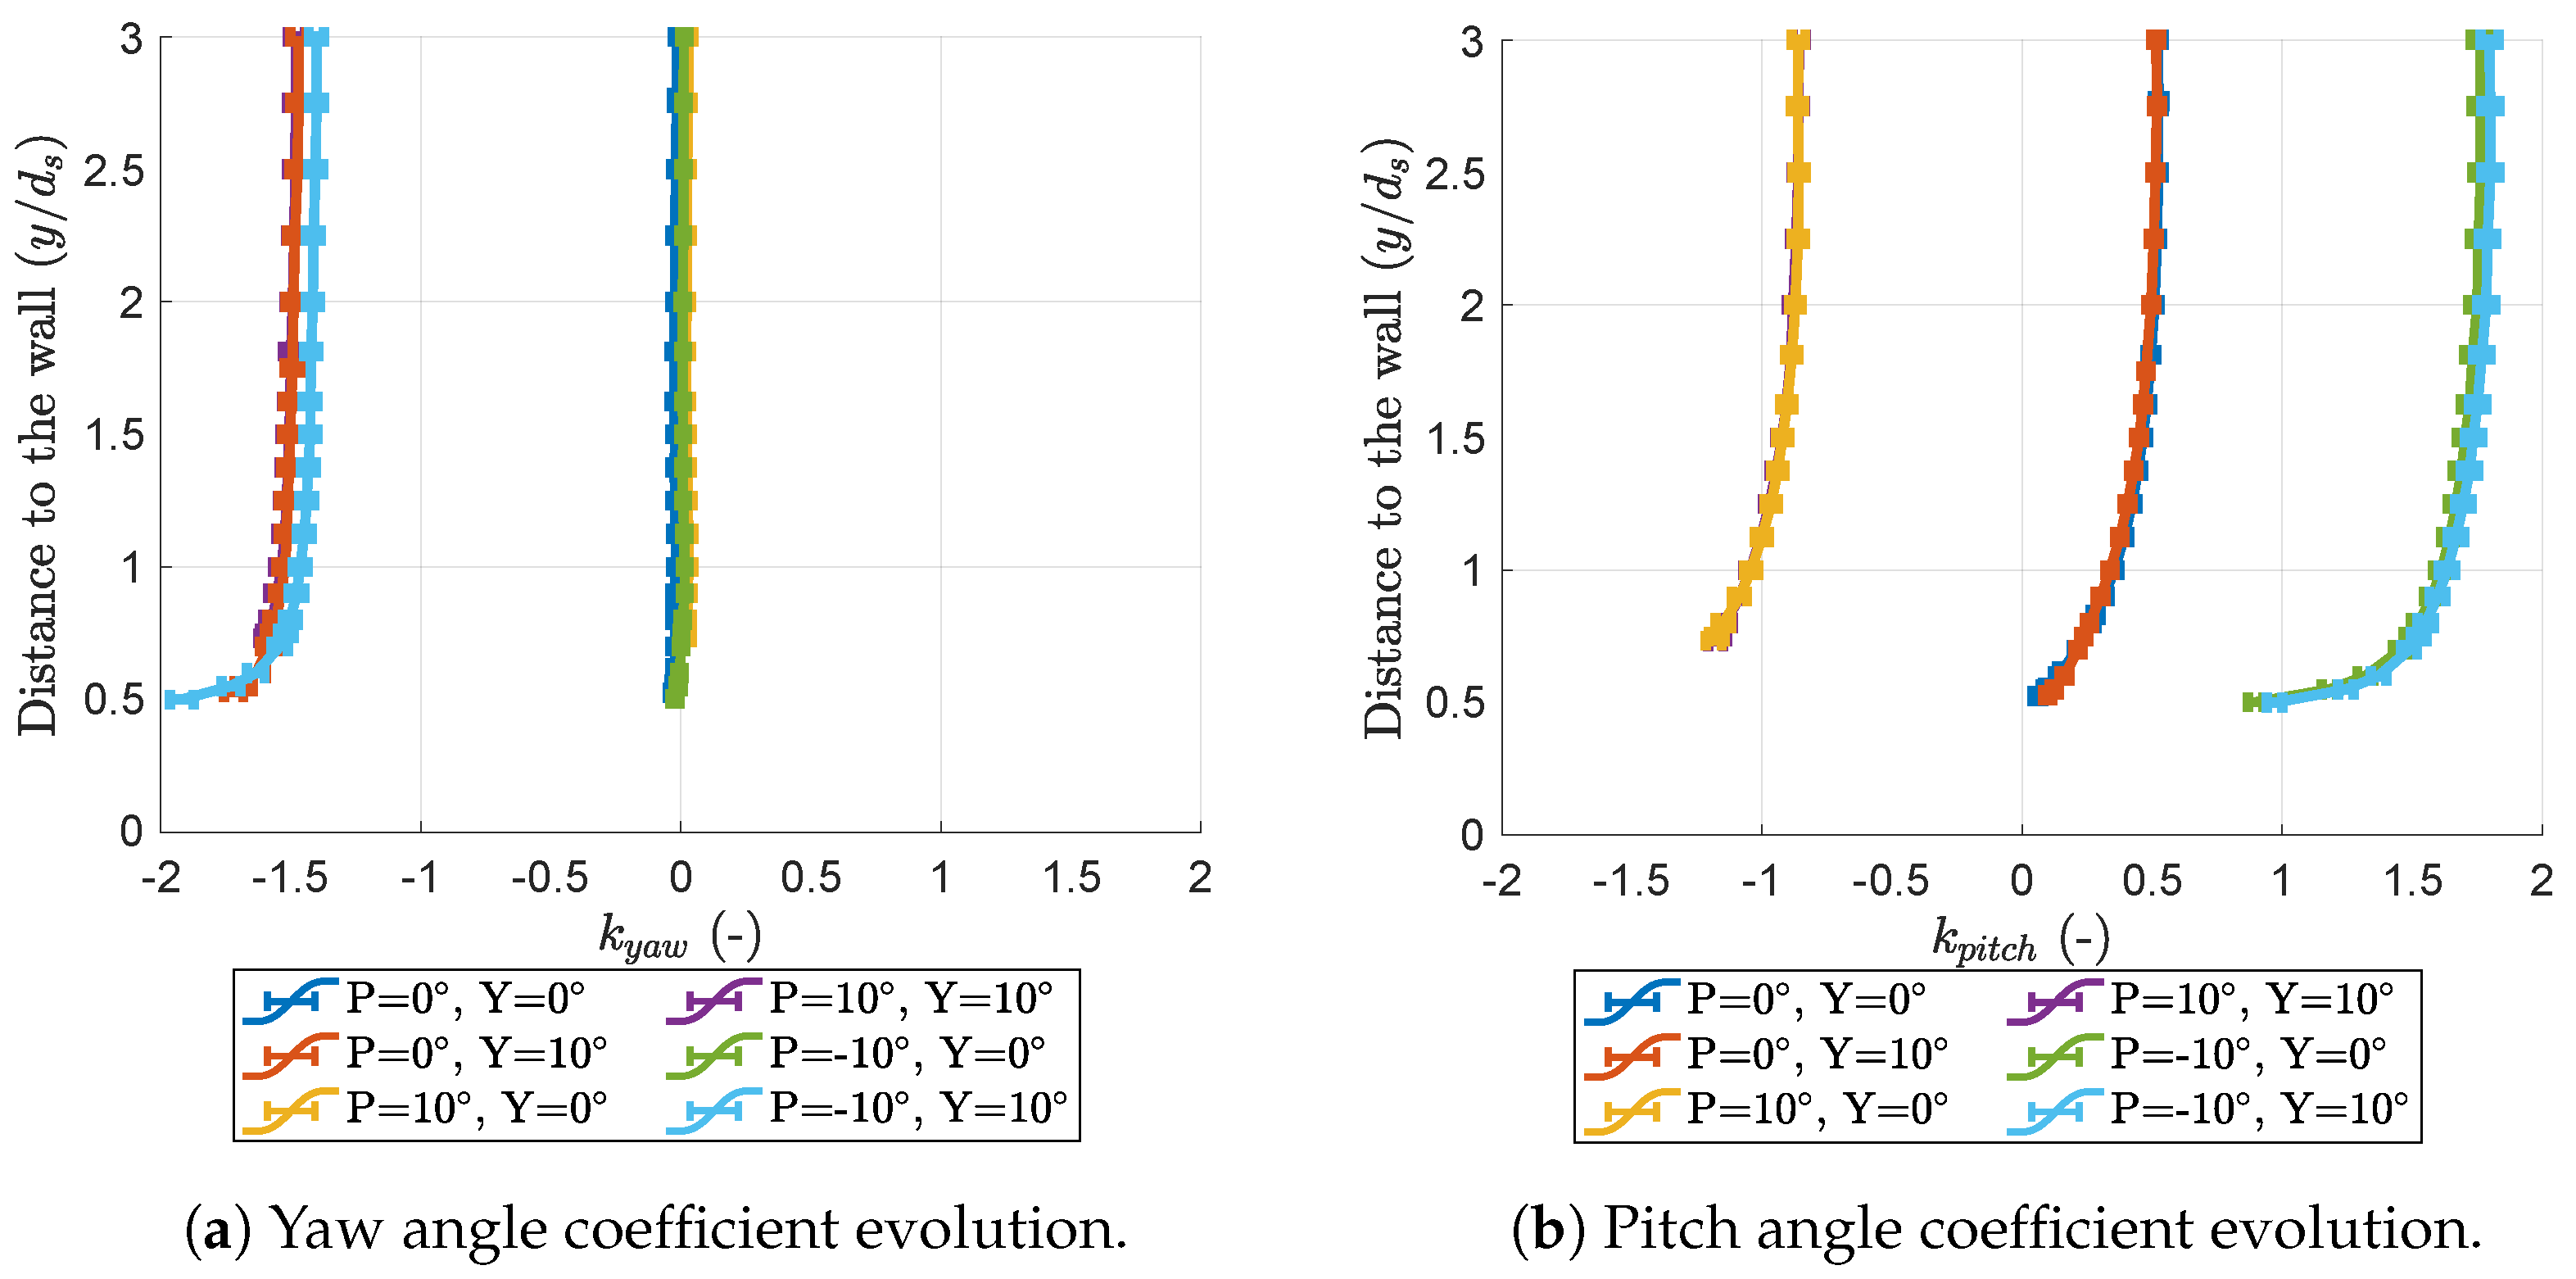
Figure 11 focuses on the calibration coefficients from the present work. The yaw coefficient seems to be independent of the probe’s pitch according to Figure 11a, while in Figure 11b the pitch coefficient seems independent of the probe’s yaw for a given pitch. This means that the current definition of the coefficients makes them a valid tool even in the wall-proximity effect zone. Figure 11a shows that the yaw measurement error described in Figure 8 comes from a yaw coefficient overestimation. The evolution of the pitch coefficient is always in the same direction. This could mean that the stagnation point on the probe is moving toward the hole closest to the wall. The interpretation via the free-stream calibration is that the flow is diverging more from the wall.
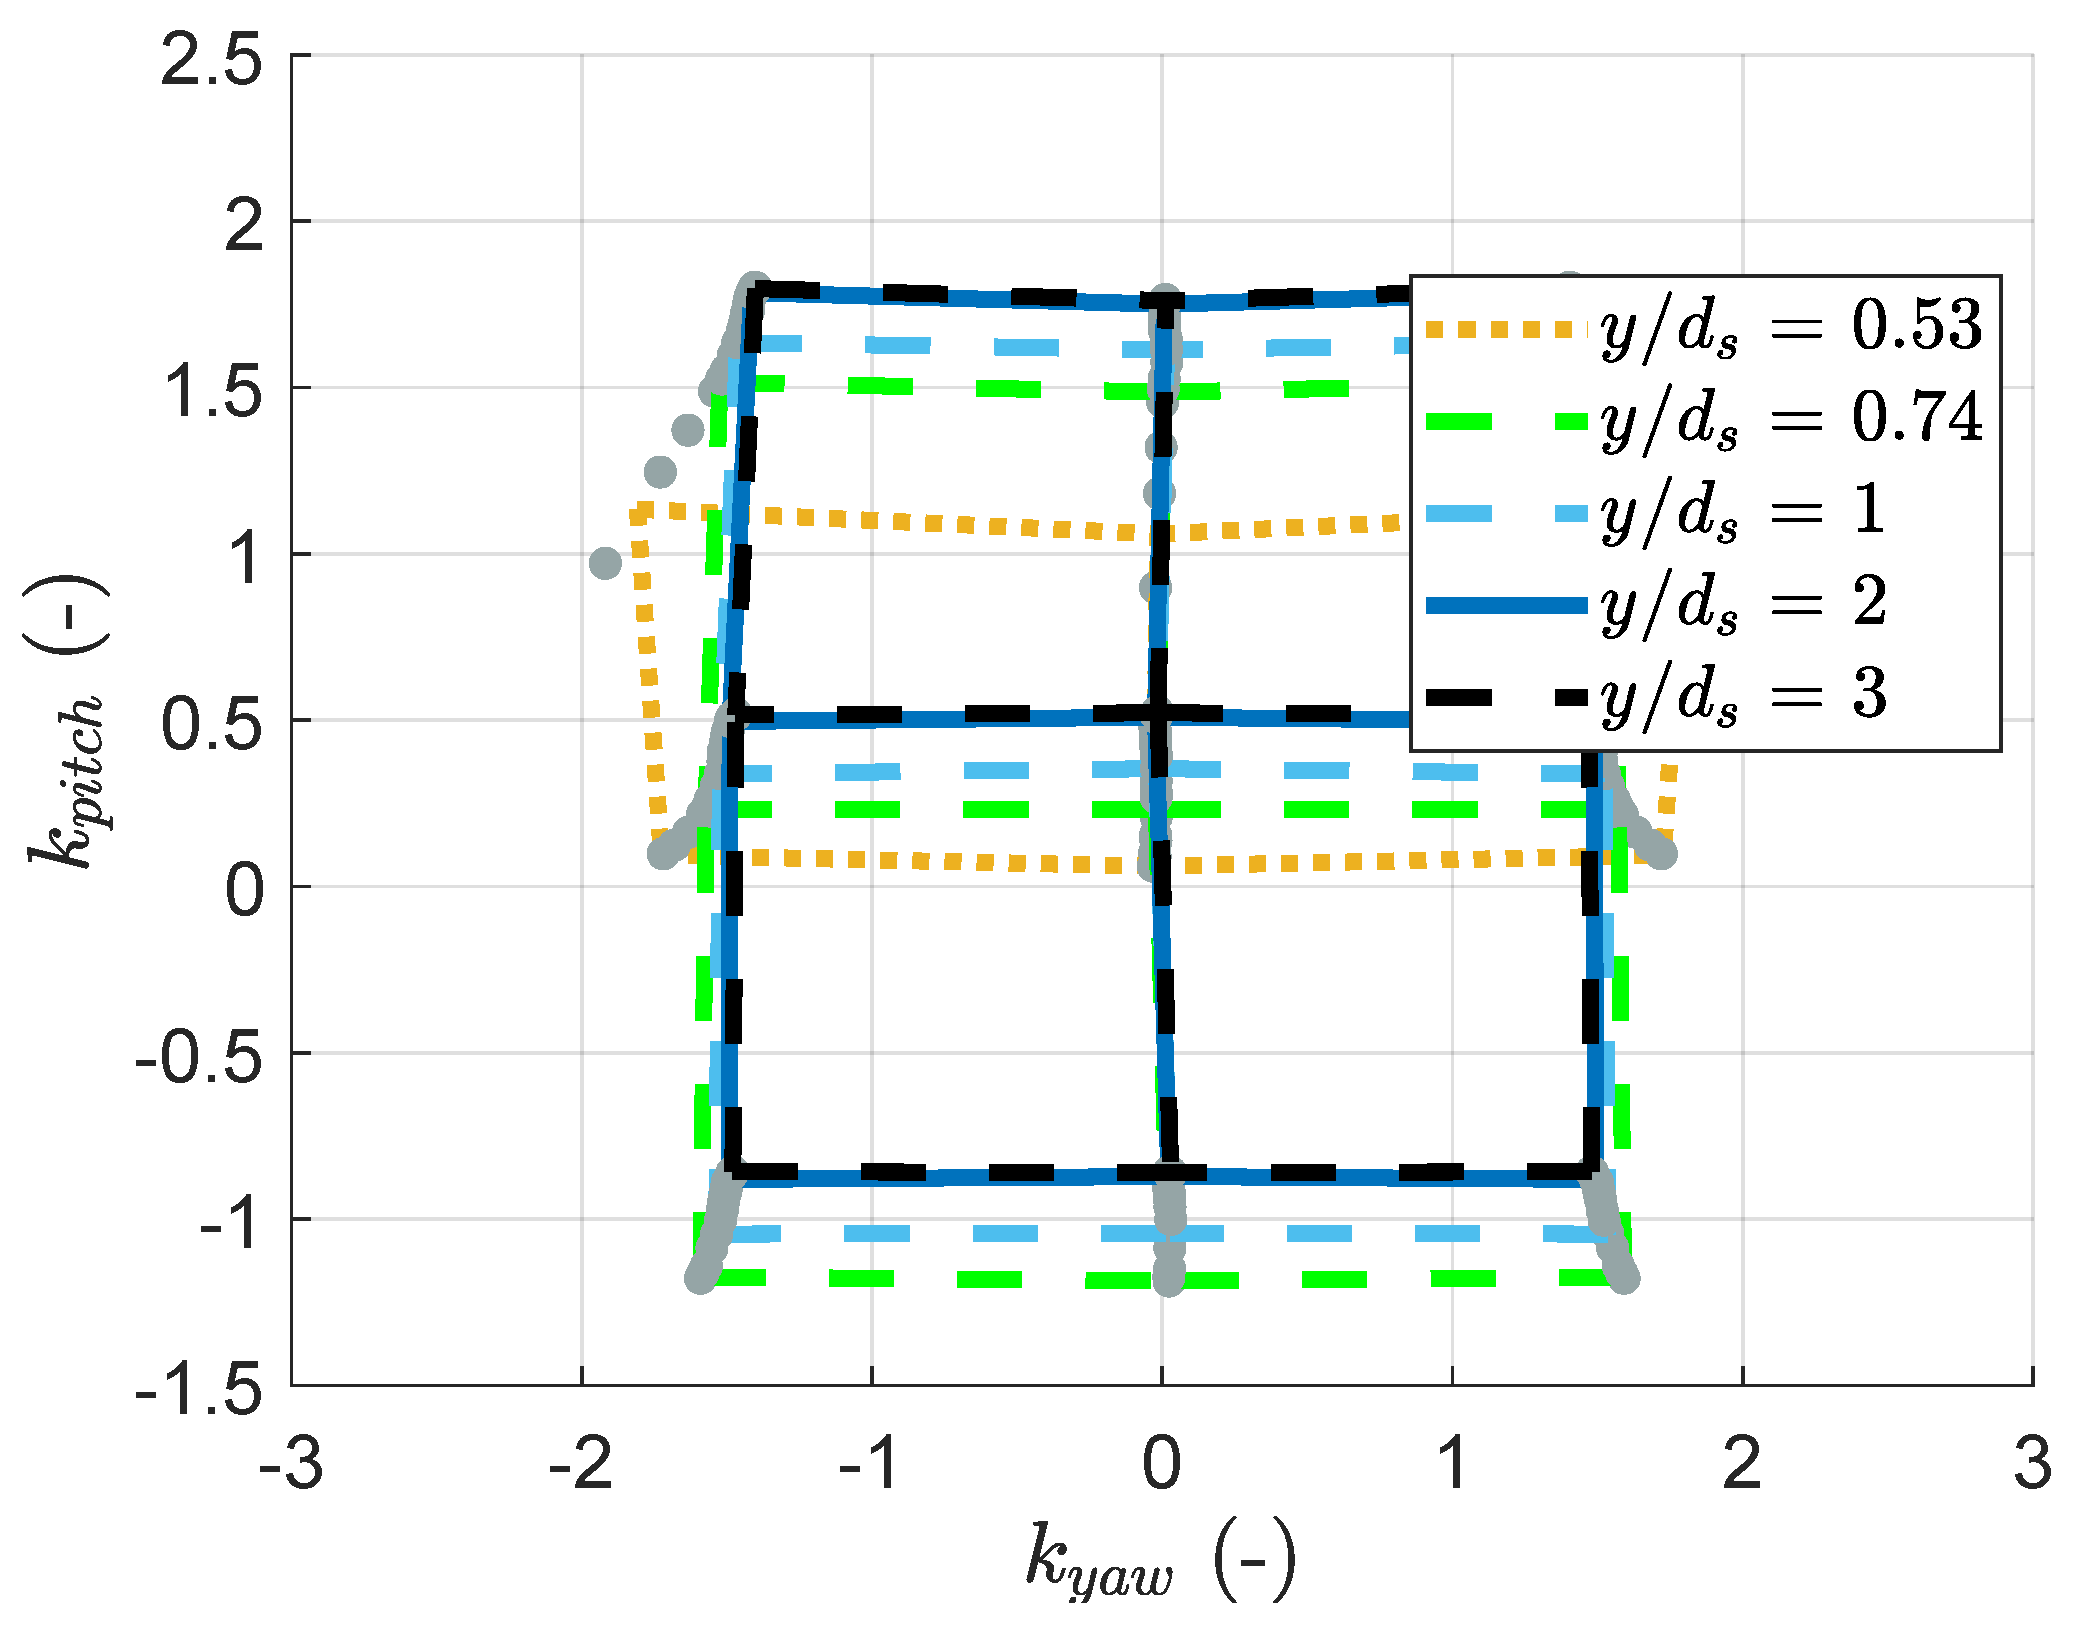
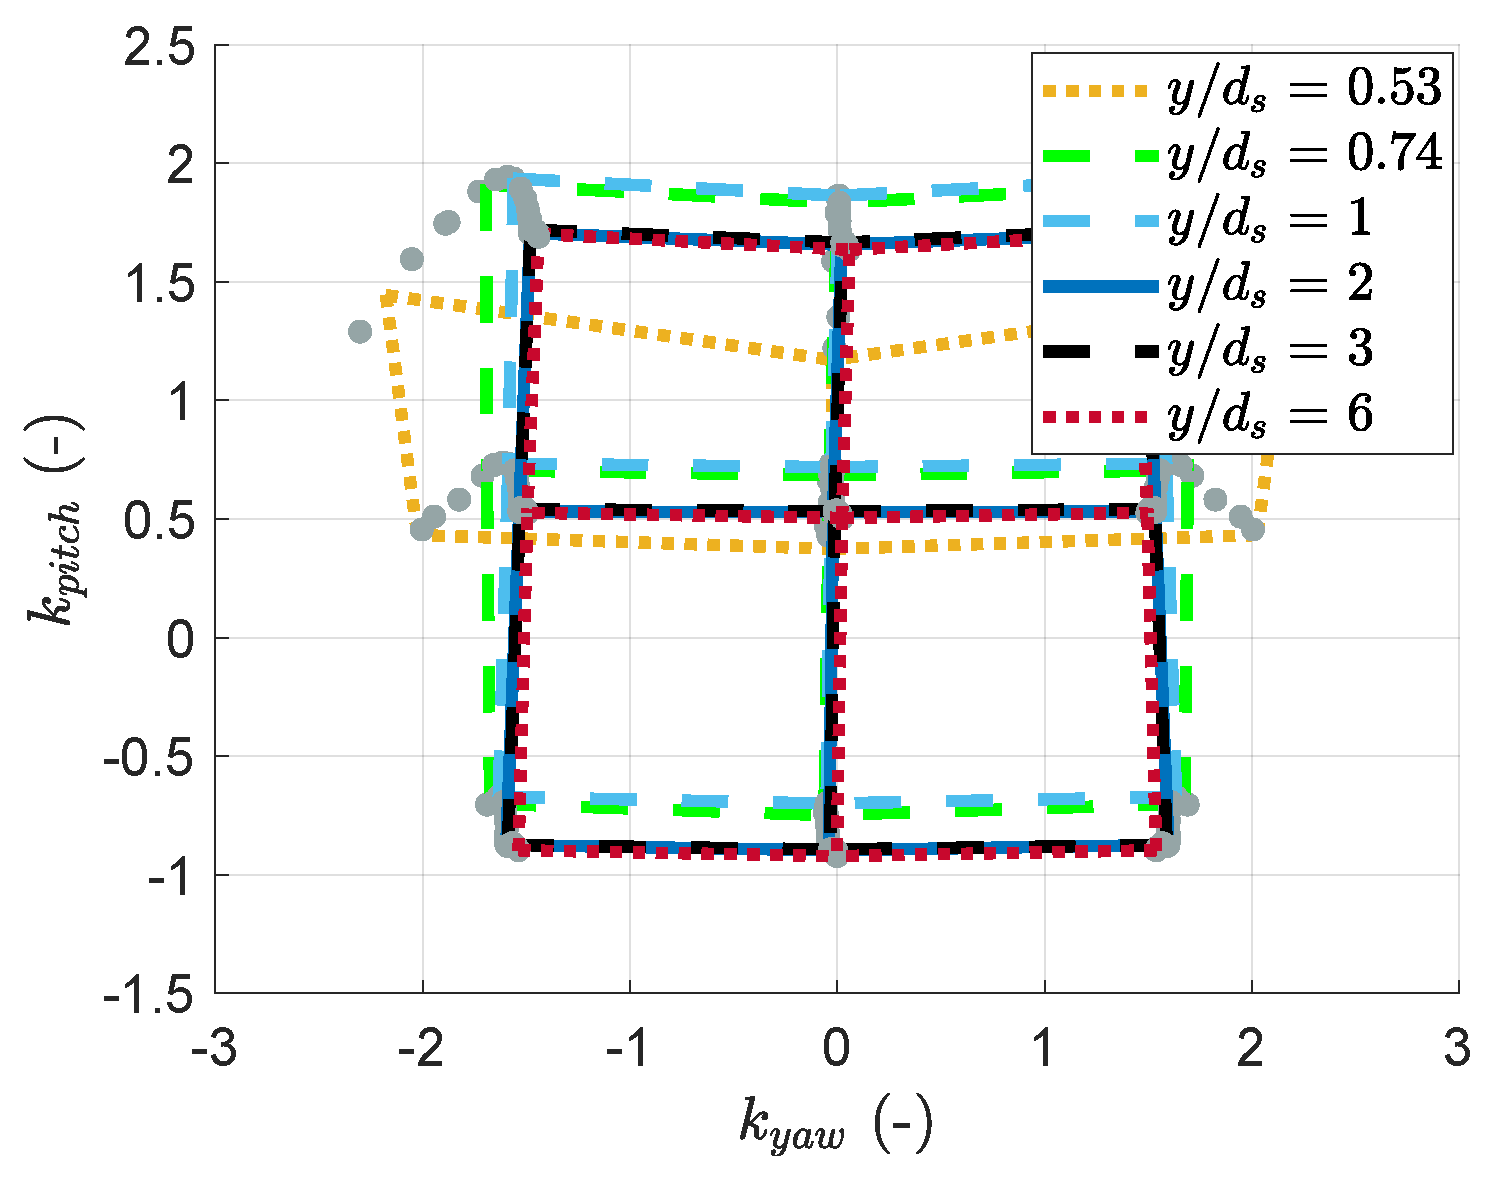
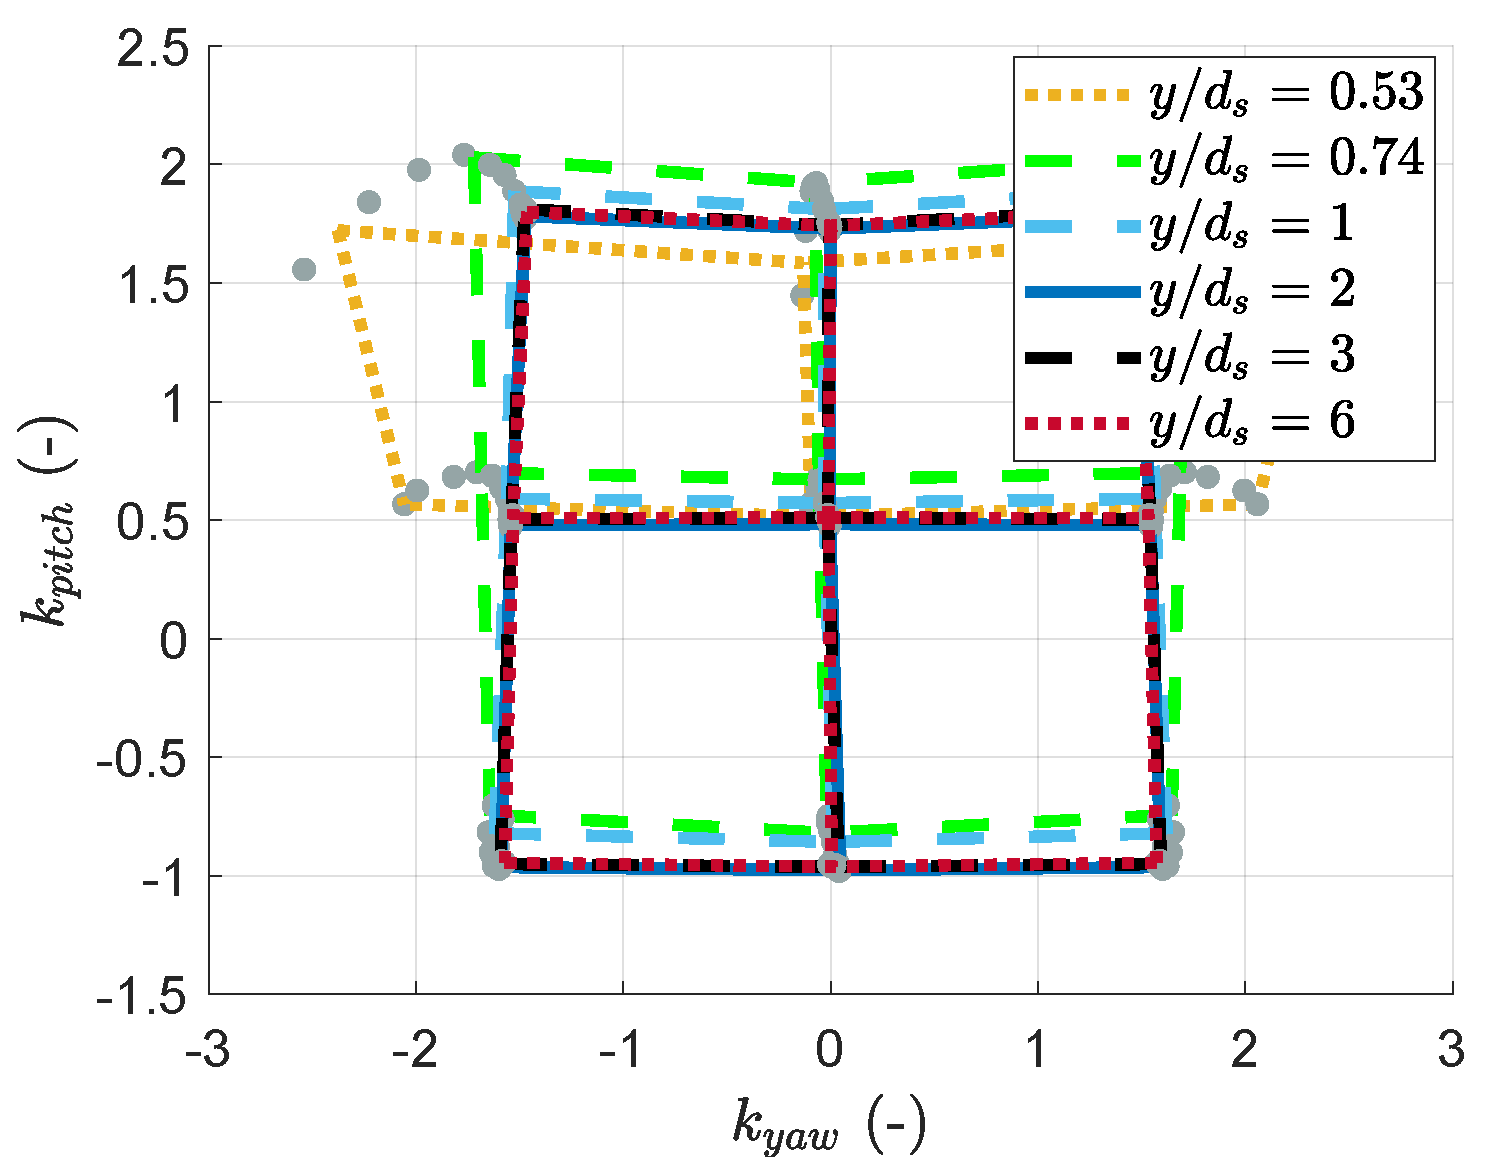
The combination of Figure 8 and Figure 11a displays the data in the form of calibration maps, visible in Figure 12. They bear the pairs of k y a w and k p i t c h for each probe position for given Mach and Reynolds numbers. The positive yaw angle data are duplicated in the negative yaw part of the maps for better readability. The black map represents data far from the wall and can be taken as a free-stream condition. If the wall-proximity effect or boundary layer is absent or negligible, the map should not change close to the wall. However, Figure 12 shows that this is not the case. This figure shows that the error in angle measurements can be instead interpreted as a calibration map change close to the wall, in order to expand the space where 5HPs are able to perform measurements.

3.2. Similarities in the Evolution of the Coefficients

This section examines the idea, not found in the literature, that the k p i t c h or k y a w evolution curves near the wall, for different probe geometries, have comparable shapes and could be scaled.
The evolution of k p i t c h measured in this work for δ 99 / d p = 0.16 , R e = 16 · 10 3 , 0° and −10° of mechanical yaw and pitch, respectively, was chosen as the reference curve. This choice is further supported by the remarkable similarity between the evolution of the pitch coefficient for Lee’s probe and for the considered one, despite the differences in geometry. The reference curve is normalised to build a quantity called k p i t c h * so that k p i t c h * = 0 at y * = 0.5 and k p i t c h * = 1 at y * = 3 with y * = y / d p . k p i t c h * is defined as
k p i t c h * = k p i t c h k p i t c h , y * = 0.5 k p i t c h , y * = 3 k p i t c h , y = 0.5
The data for the other traverses are normalised the same way and handled as follows:
  • the free-stream value is set equal to k p i t c h * = 1 at y * = 3 ;
  • the distance or “error” between the measured curve and the reference curve is computed;
  • the curve is linearly scaled in the y * and k p i t c h * directions until the error is minimised.
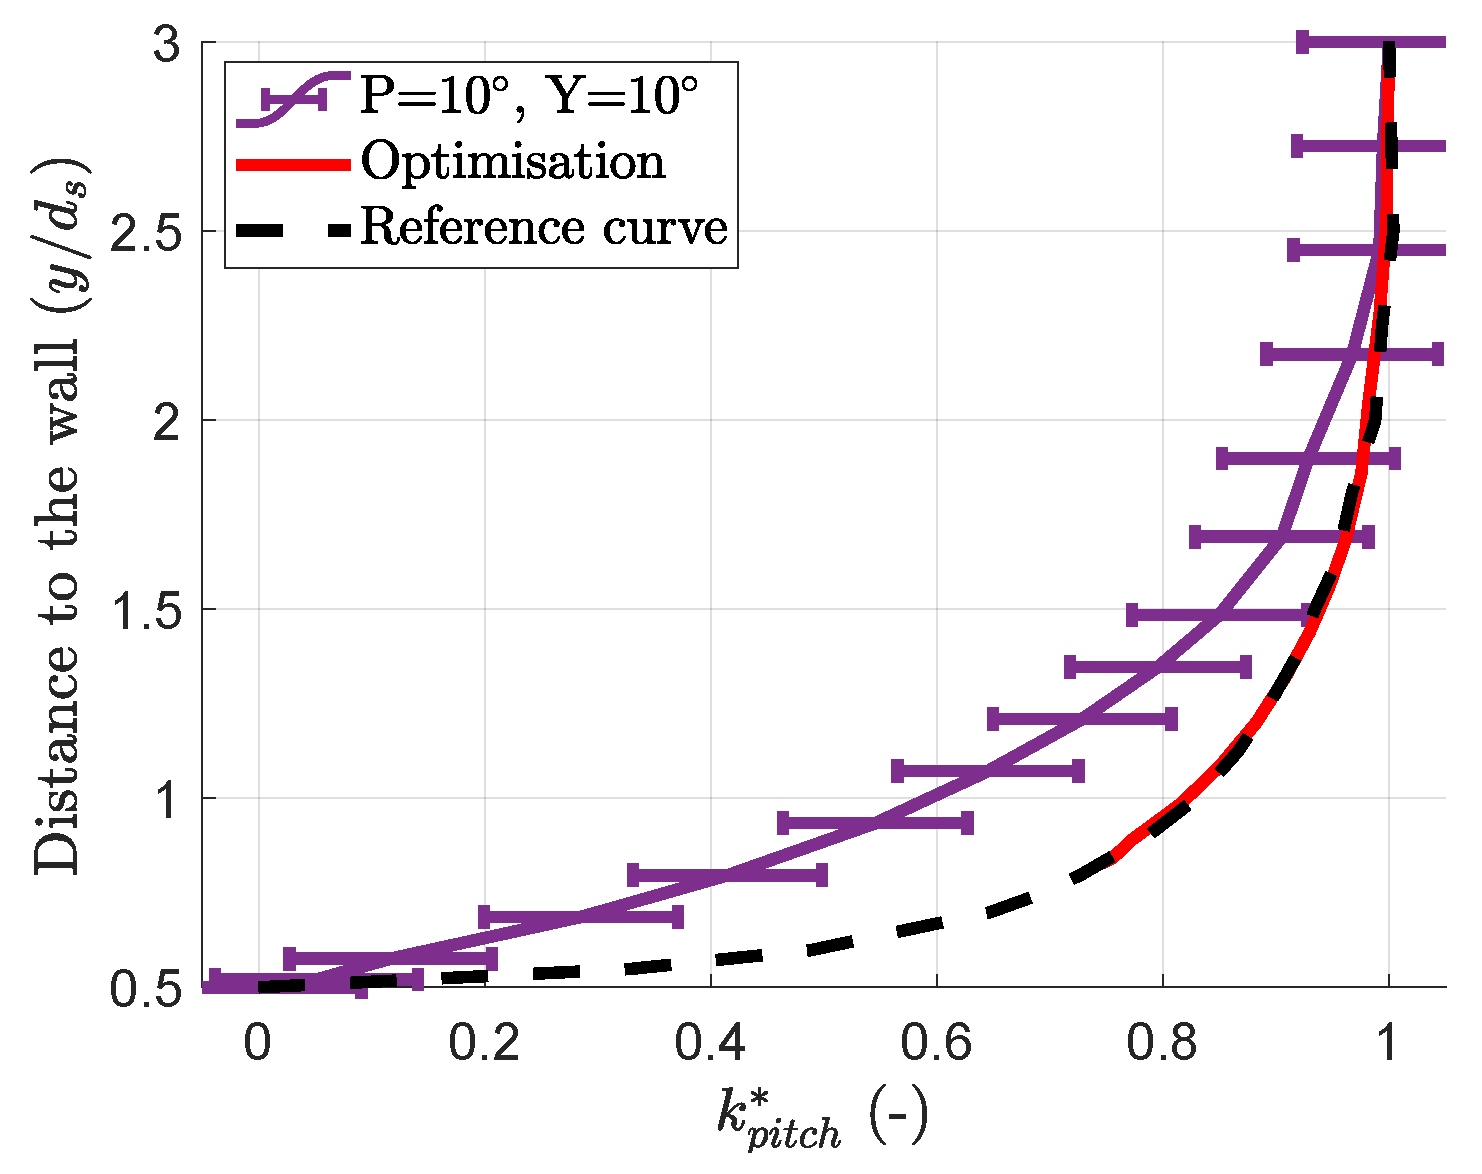
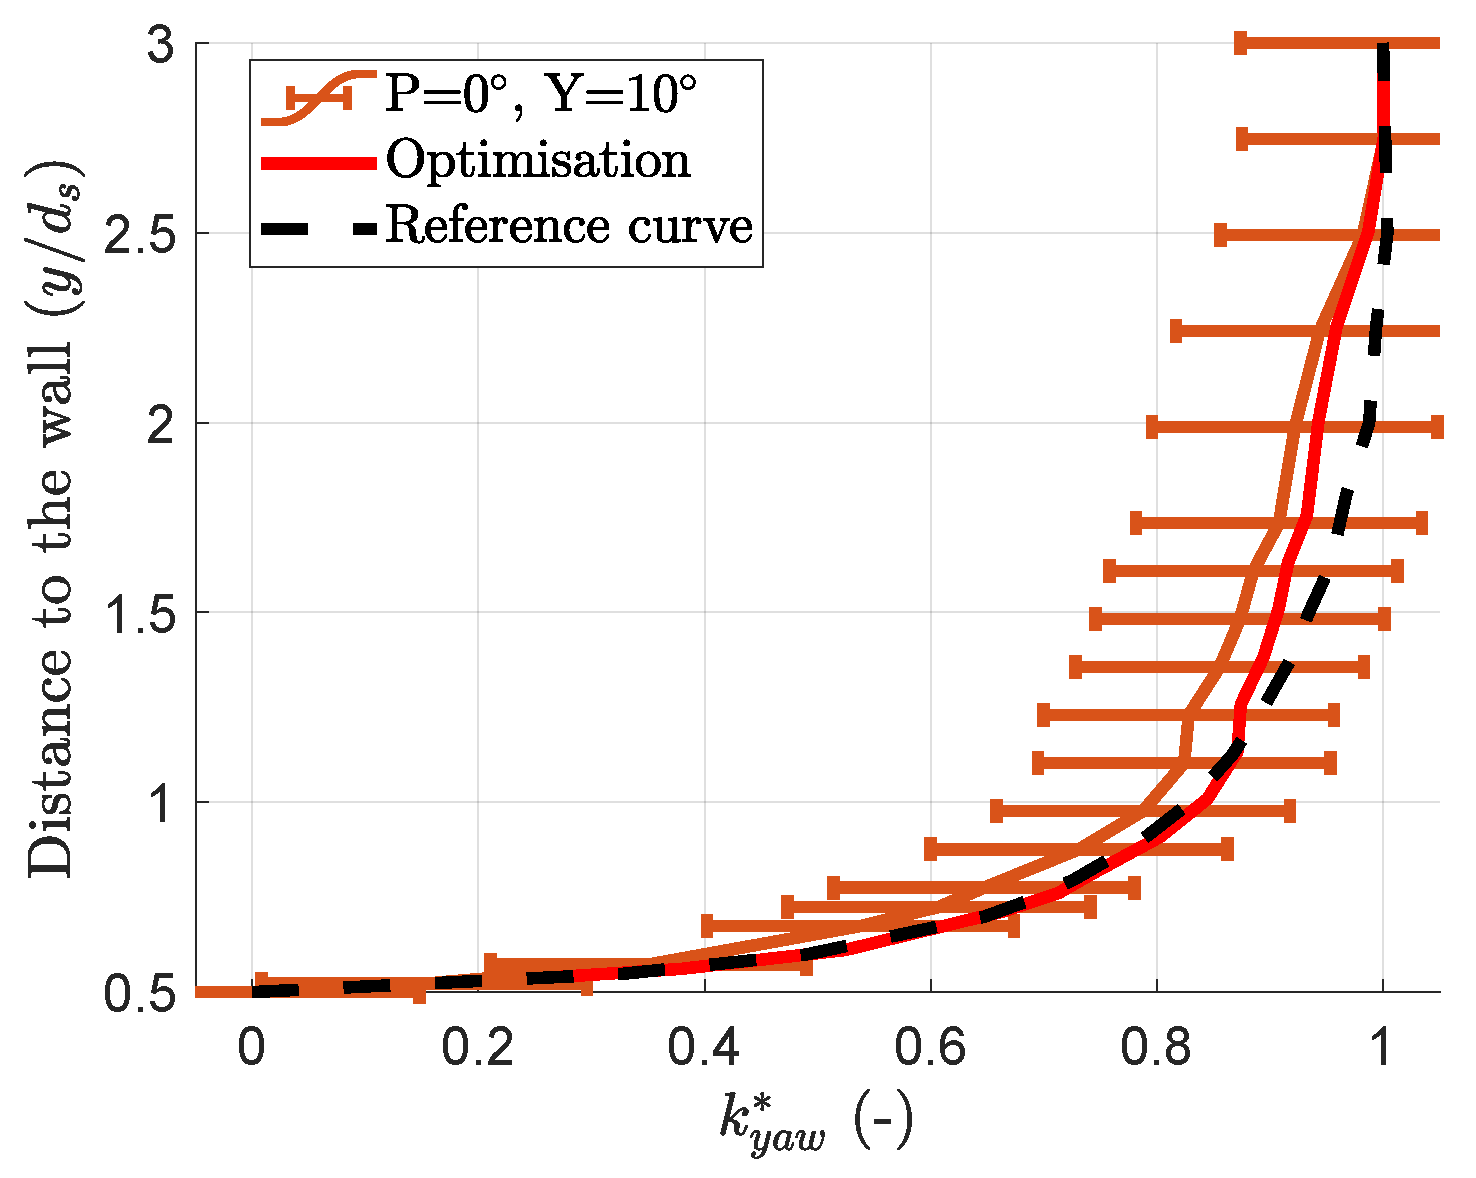
This method gives the vertical and horizontal scaling needed to best fit the traverse data to a part of the reference curve, as illustrated in Figure 13. Table 5 shows the results of this approach. The reference error is the distance between the reference curve and a constant line of k p i t c h * = 1 . All other errors are compared to this reference. Minimal distances are under 1% for this work’s data. The larger discrepancies for Lee’s data are partly due to noise, especially for P = 10 . The same work was conducted for the yaw coefficient, using the same reference curve as shown in Figure 14.
The difference between the free-stream k y a w and the value close to the wall is smaller than that of k p i t c h for all probe orientations in both works. A consequence is an increase in signal-to-noise ratio that prevents the algorithm from converging properly in some cases, thus leading to larger errors. In those cases, the initial normalised k y a w was taken as the actual “optimised” result. They are highlighted in bold in Table 6, which records the outputs of the algorithm for the yaw coefficient evolution curves.
There is a fair similarity between all k y a w and k p i t c h evolution curves in this work and Lee’s data that might extend to other 5HP geometries. This means that knowledge of the evolution of the probe calibration near the wall could be obtained by calibrating the probe at only three distances to the wall: in the free stream, at y * = 1 , and when the probe touches the wall. The reference curve could then be interpolated to build the rest of the data.
Considering higher δ 99 / d p ratios leads to a different behaviour of the coefficients, this means that the boundary layer effect has to be taken into account. This is further discussed in Section 3.3.

3.3. Boundary Layer Influence

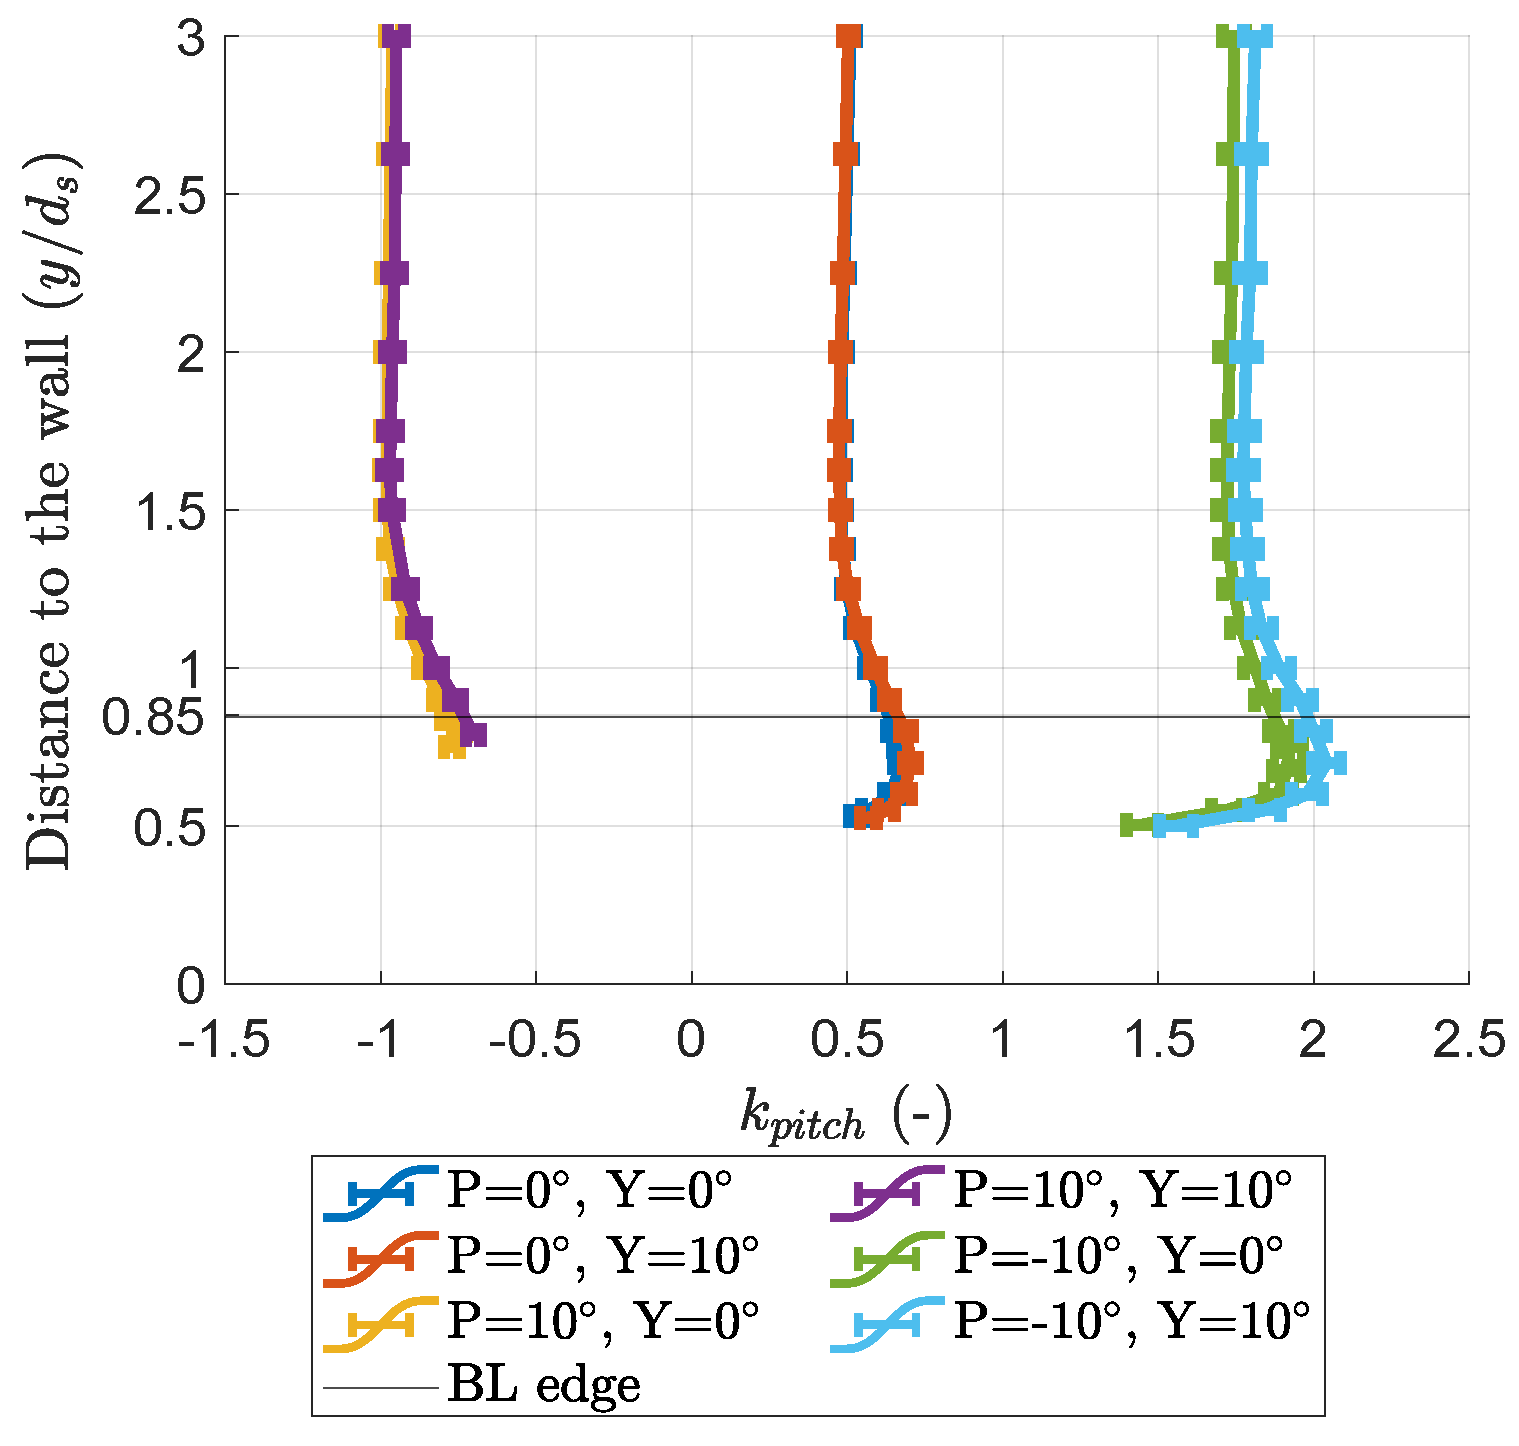
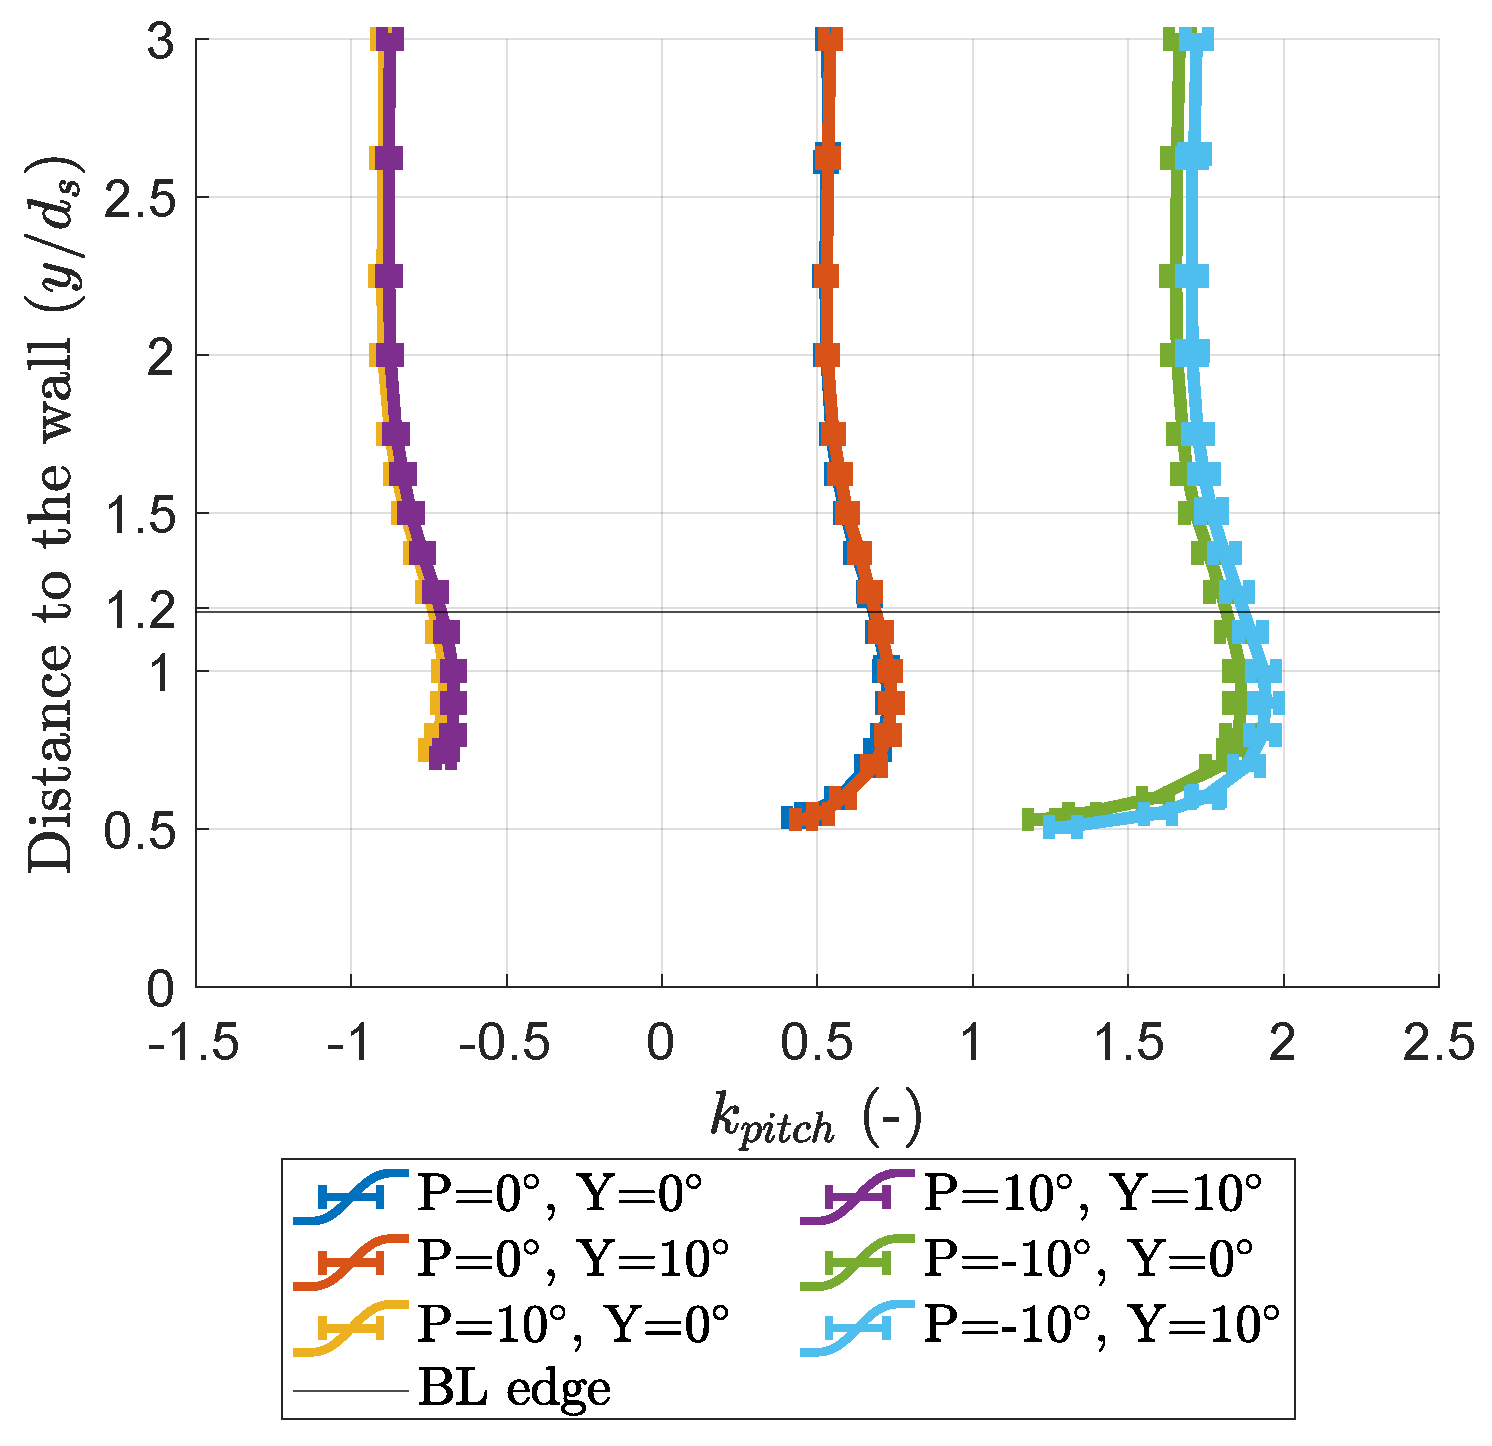
The objective of this section is to highlight the boundary layer’s contribution to calibration coefficient changes near the wall and the magnitude of the measurement errors due to the boundary layer. Figure 15 and Figure 16 present the results for δ 99 / d p = 0.33 and δ 99 / d p = 69 . With respect to the previous case δ 99 / d p = 0.16 , the curves are not monotonous but present a hump.
Despite the small shift between the light blue and green curves (likely to come from an alignment error), the presence of a thicker boundary layer does not modify the independence of k y a w and k p i t c h in this range of probe orientations. The hump appears further from the wall when δ 99 / d p is higher (around y * = 0.7 for δ 99 / d p = 0.33 and y * = 0.9 for δ 99 / d p = 69 ) and it is about 15% higher for P = 10 compared to P = 0 in both situations. The curves for P = 10 do not present a full hump because the mast reaches the wall too soon. These figures show that the sooner the boundary layer meets the probe, the more predominant its influence is.
Figure 15 and Figure 16 show both the wall-proximity and the boundary layer effect. A method was devised to isolate the boundary layer effect:
  • The assumption is made that the boundary layer and wall-proximity effect are independent;
  • The assumption is made that y * is the only wall-proximity effect parameter for a given probe orientation;
  • The case with δ 99 / d p = 0.16 and R e = 16 · 10 3 is assumed to only exhibit the wall-proximity effect;
  • For a given probe orientation, the traverse data from the case with δ 99 / d p = 0.16 and R e = 16 · 10 3 are subtracted from the data with larger boundary layer thicknesses.
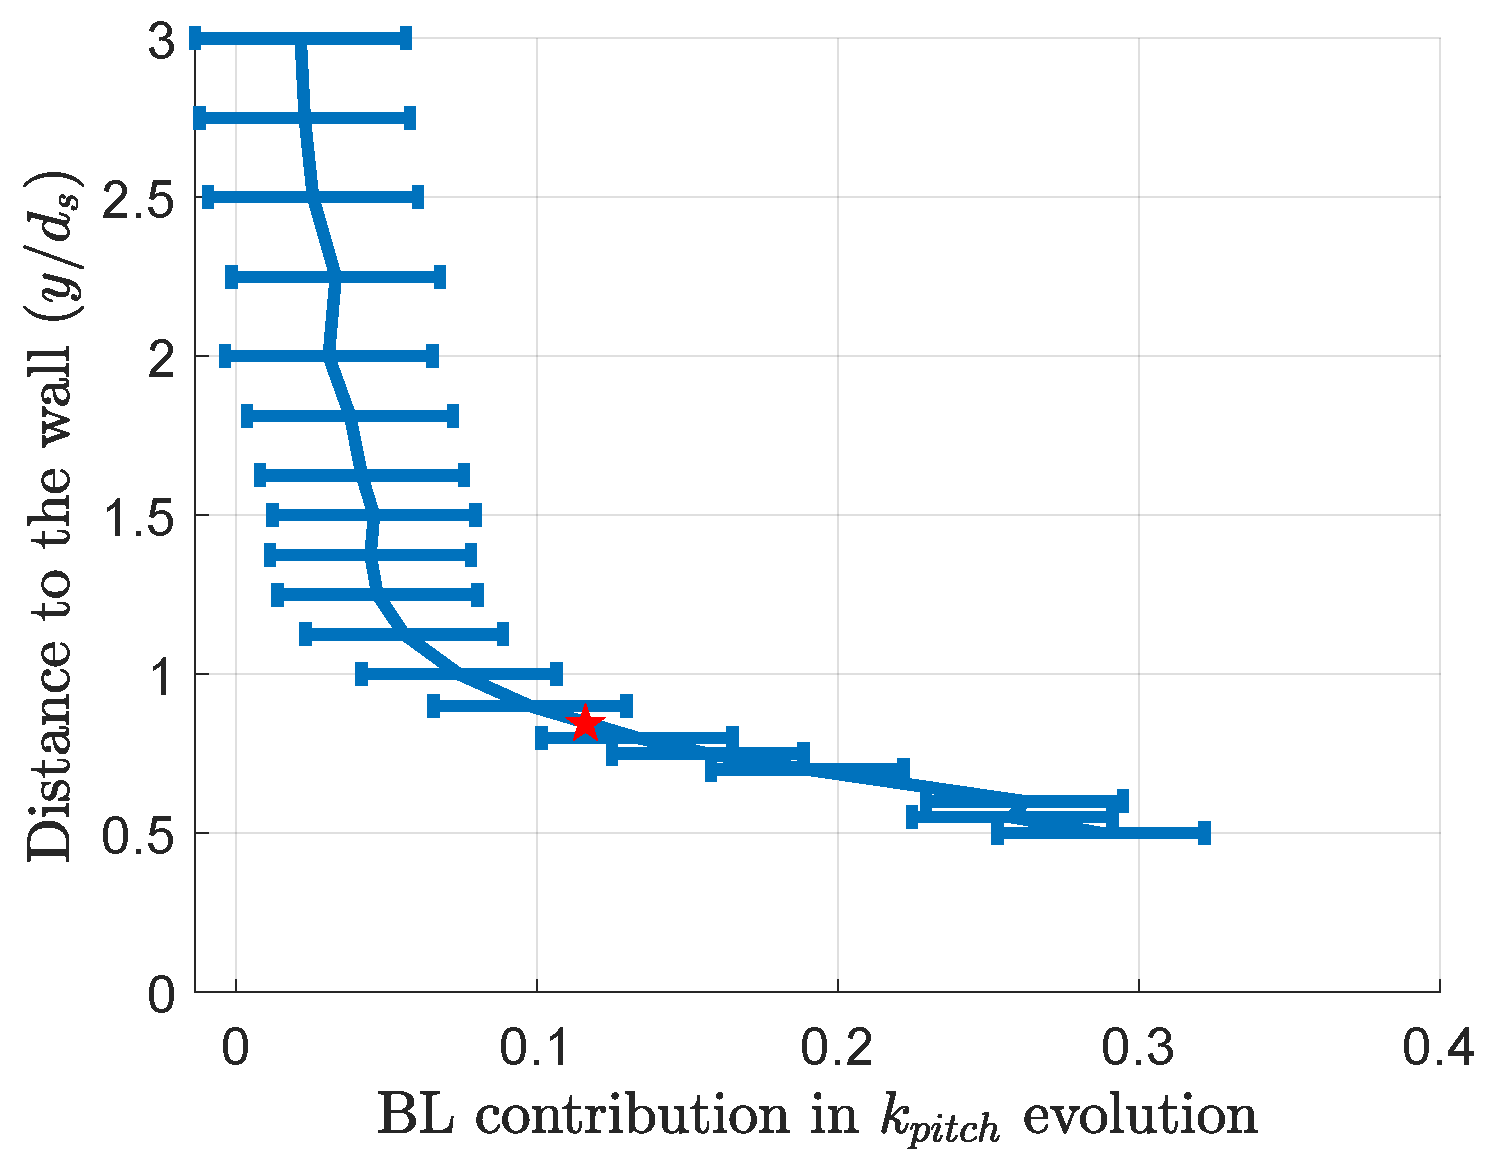
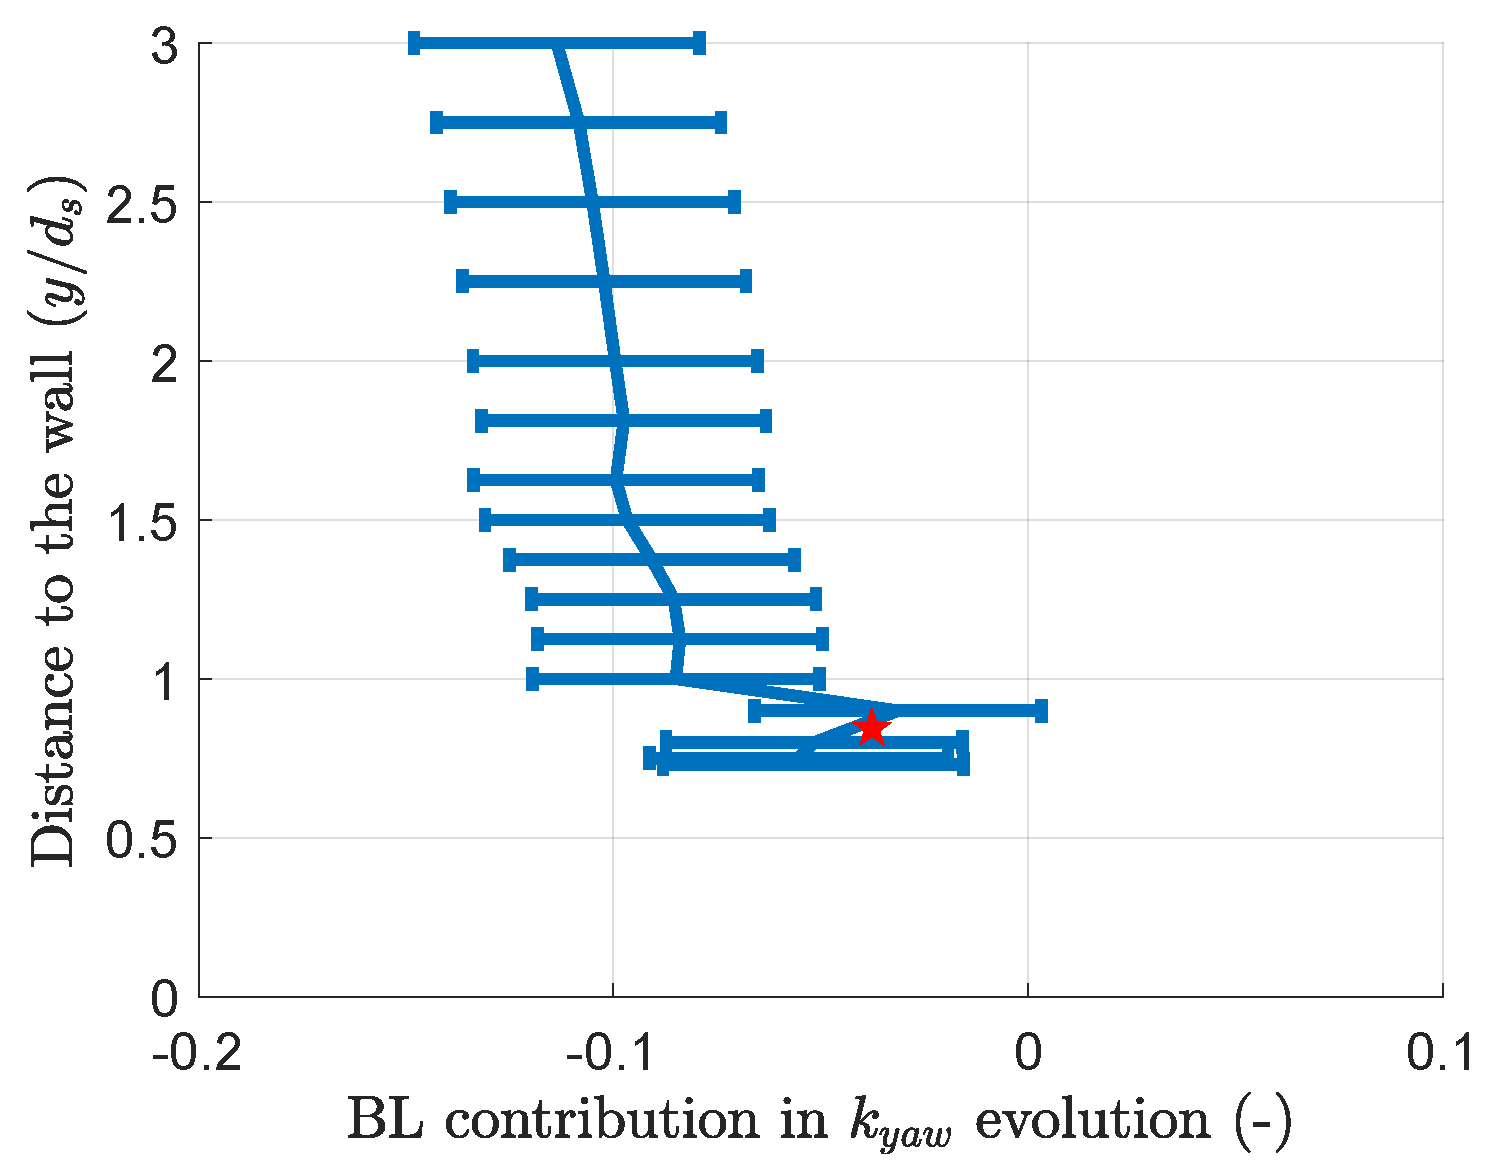
The results of this method for a traverse with δ 99 / d p = 0.34 and R e = 16 · 10 3 (resp. δ 99 / d p = 0.69 and R e = 8 · 10 3 ) for the pitch coefficient are shown in Figure 17 (resp. Figure 18).
Figure 17 shows that the boundary layer increases the perceived pitch. This fits with the effects of shear flow described by Bailey [9] and Appukutan [17]: the shear makes the probe measure a flow going in the opposite direction to the gradient. However, Figure 18 exhibits a slope change around y * = 0.75 . This decrease in pitch coefficient near the wall is present in the majority of cases, and is more pronounced and starts further from the wall for bigger δ 99 / d p ratios. The considered explanation is that the boundary layer displacement thickness changes the effective wall distance that triggers the wall-proximity effect. A bigger number of traverses in varying boundary layer thicknesses would be necessary to assess this hypothesis.
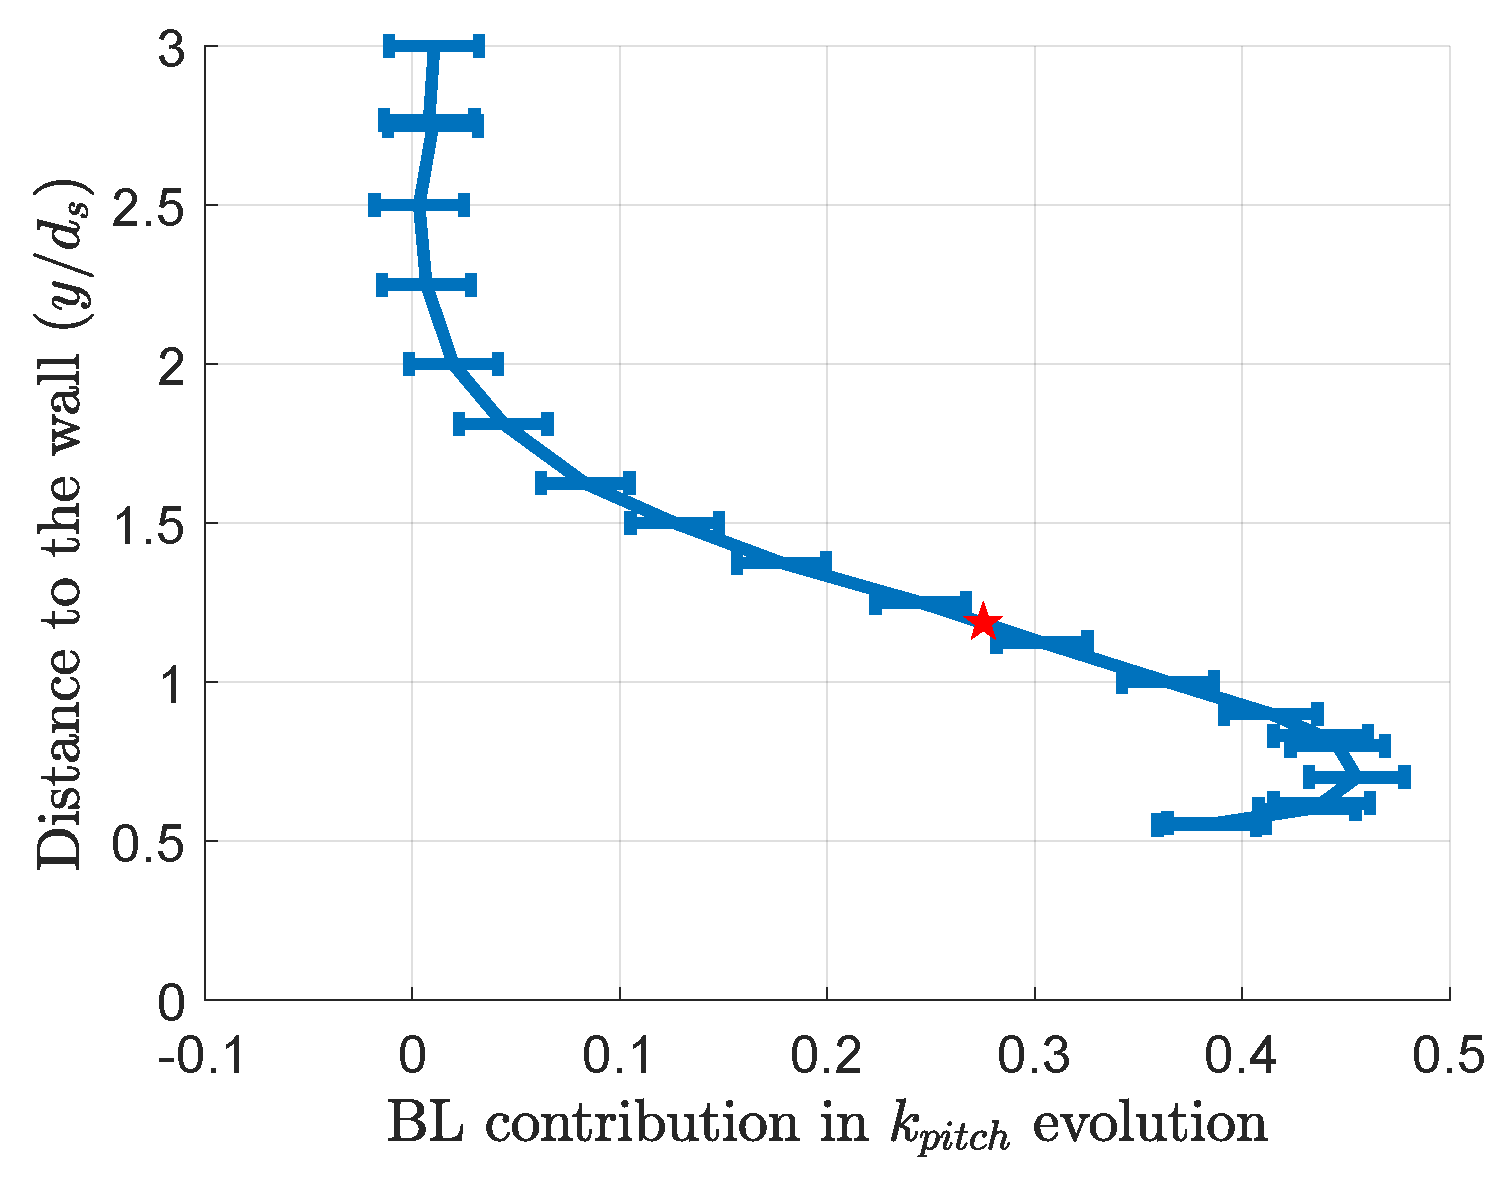
The results of this method for a traverse with δ 99 / d p = 0.33 and R e = 8 · 10 3 (resp. δ 99 / d p = 0.34 and R e = 16 · 10 3 ) for the yaw coefficient are shown in Figure 19 (resp. Figure 20). The boundary layer further increases the yaw coefficient error in negative pitch orientations but reduces it when the probe has a positive pitch. The boundary layer contribution in the yaw measurement error is, in the worst cases, two to three times weaker than the wall-proximity contribution.
Multi-hole probes in gradients are subject to resolution errors [18], i.e., the errors stemming from the assumption that the five holes are in the same location when the flow is not homogeneous. The following method was used to estimate the resolution error magnitude of the calibration coefficients’ evolution in the boundary layer:
1.
The PIV boundary layer velocity profile was analysed thanks to the undisturbed flow PIV acquisitions;
2.
For each probe position, the velocity facing each hole was obtained, which is illustrated in Figure 21;
3.
The static pressure was assumed to be constant through the boundary layer;
4.
The set of five velocity values was converted into a set of five pressure values using the calibration data;
5.
The set of pressure values was converted into calibration coefficients.
Because of the probe’s absence during the PIV measurements, these results do not account for its intrusiveness; hence, they are purely highlighting the resolution issue. The results displayed in Figure 22 show that the resolution issue in the boundary layer could be responsible for:
  • a yaw coefficient underestimation for positive pitch positions;
  • a yaw coefficient overestimation for negative pitch positions;
  • a shift of the map towards higher k p i t c h values.
This observation fits with the experimental results: the opposite effect of the wall proximity and boundary layer for the pitch coefficient is visible in Figure 23. Also, the horizontal stretch is maximal at the top of the map, where the BL effect and the wall proximity sum up, and almost insignificant at the bottom, where the two error sources have opposite effects. When applied to the case δ 99 / d p = 0.33 and R e = 8 · 10 3 shown in Figure 19, this algorithm gives a maximum k p i t c h drift of 0.4, to be compared to the 0.3 drift in Figure 19. The resolution effect could be the main cause of the boundary-layer-related measurement errors near the wall.
Figure 24 compares the flow angle reading for the two probes at δ 99 / d p = 0.16 and R e = 16 · 10 3 and δ 99 / d p = 0.33 and R e = 8 · 10 3 with no yaw or pitch. It shows that a slight asymmetry in the probe or its setting can trigger yaw measurement errors. In the δ 99 / d p = 0.33 and R e = 8 · 10 3 case, the boundary layer almost compensates for the effect of wall proximity. Figure 25 compares the measurement with negative pitch and yaw at δ 99 / d p = 0.16 and δ 99 / d p = 0.33 for R e = 16 · 10 3 . It shows that the presence of the boundary layer increases the yaw measurement error from around 3° to around 5° but decreases the pitch measurement error from −8° to −5°. The curves exhibit a change in direction when the probe enters the boundary layer.

3.4. Coupling between the Wall and the Boundary Layer Effects

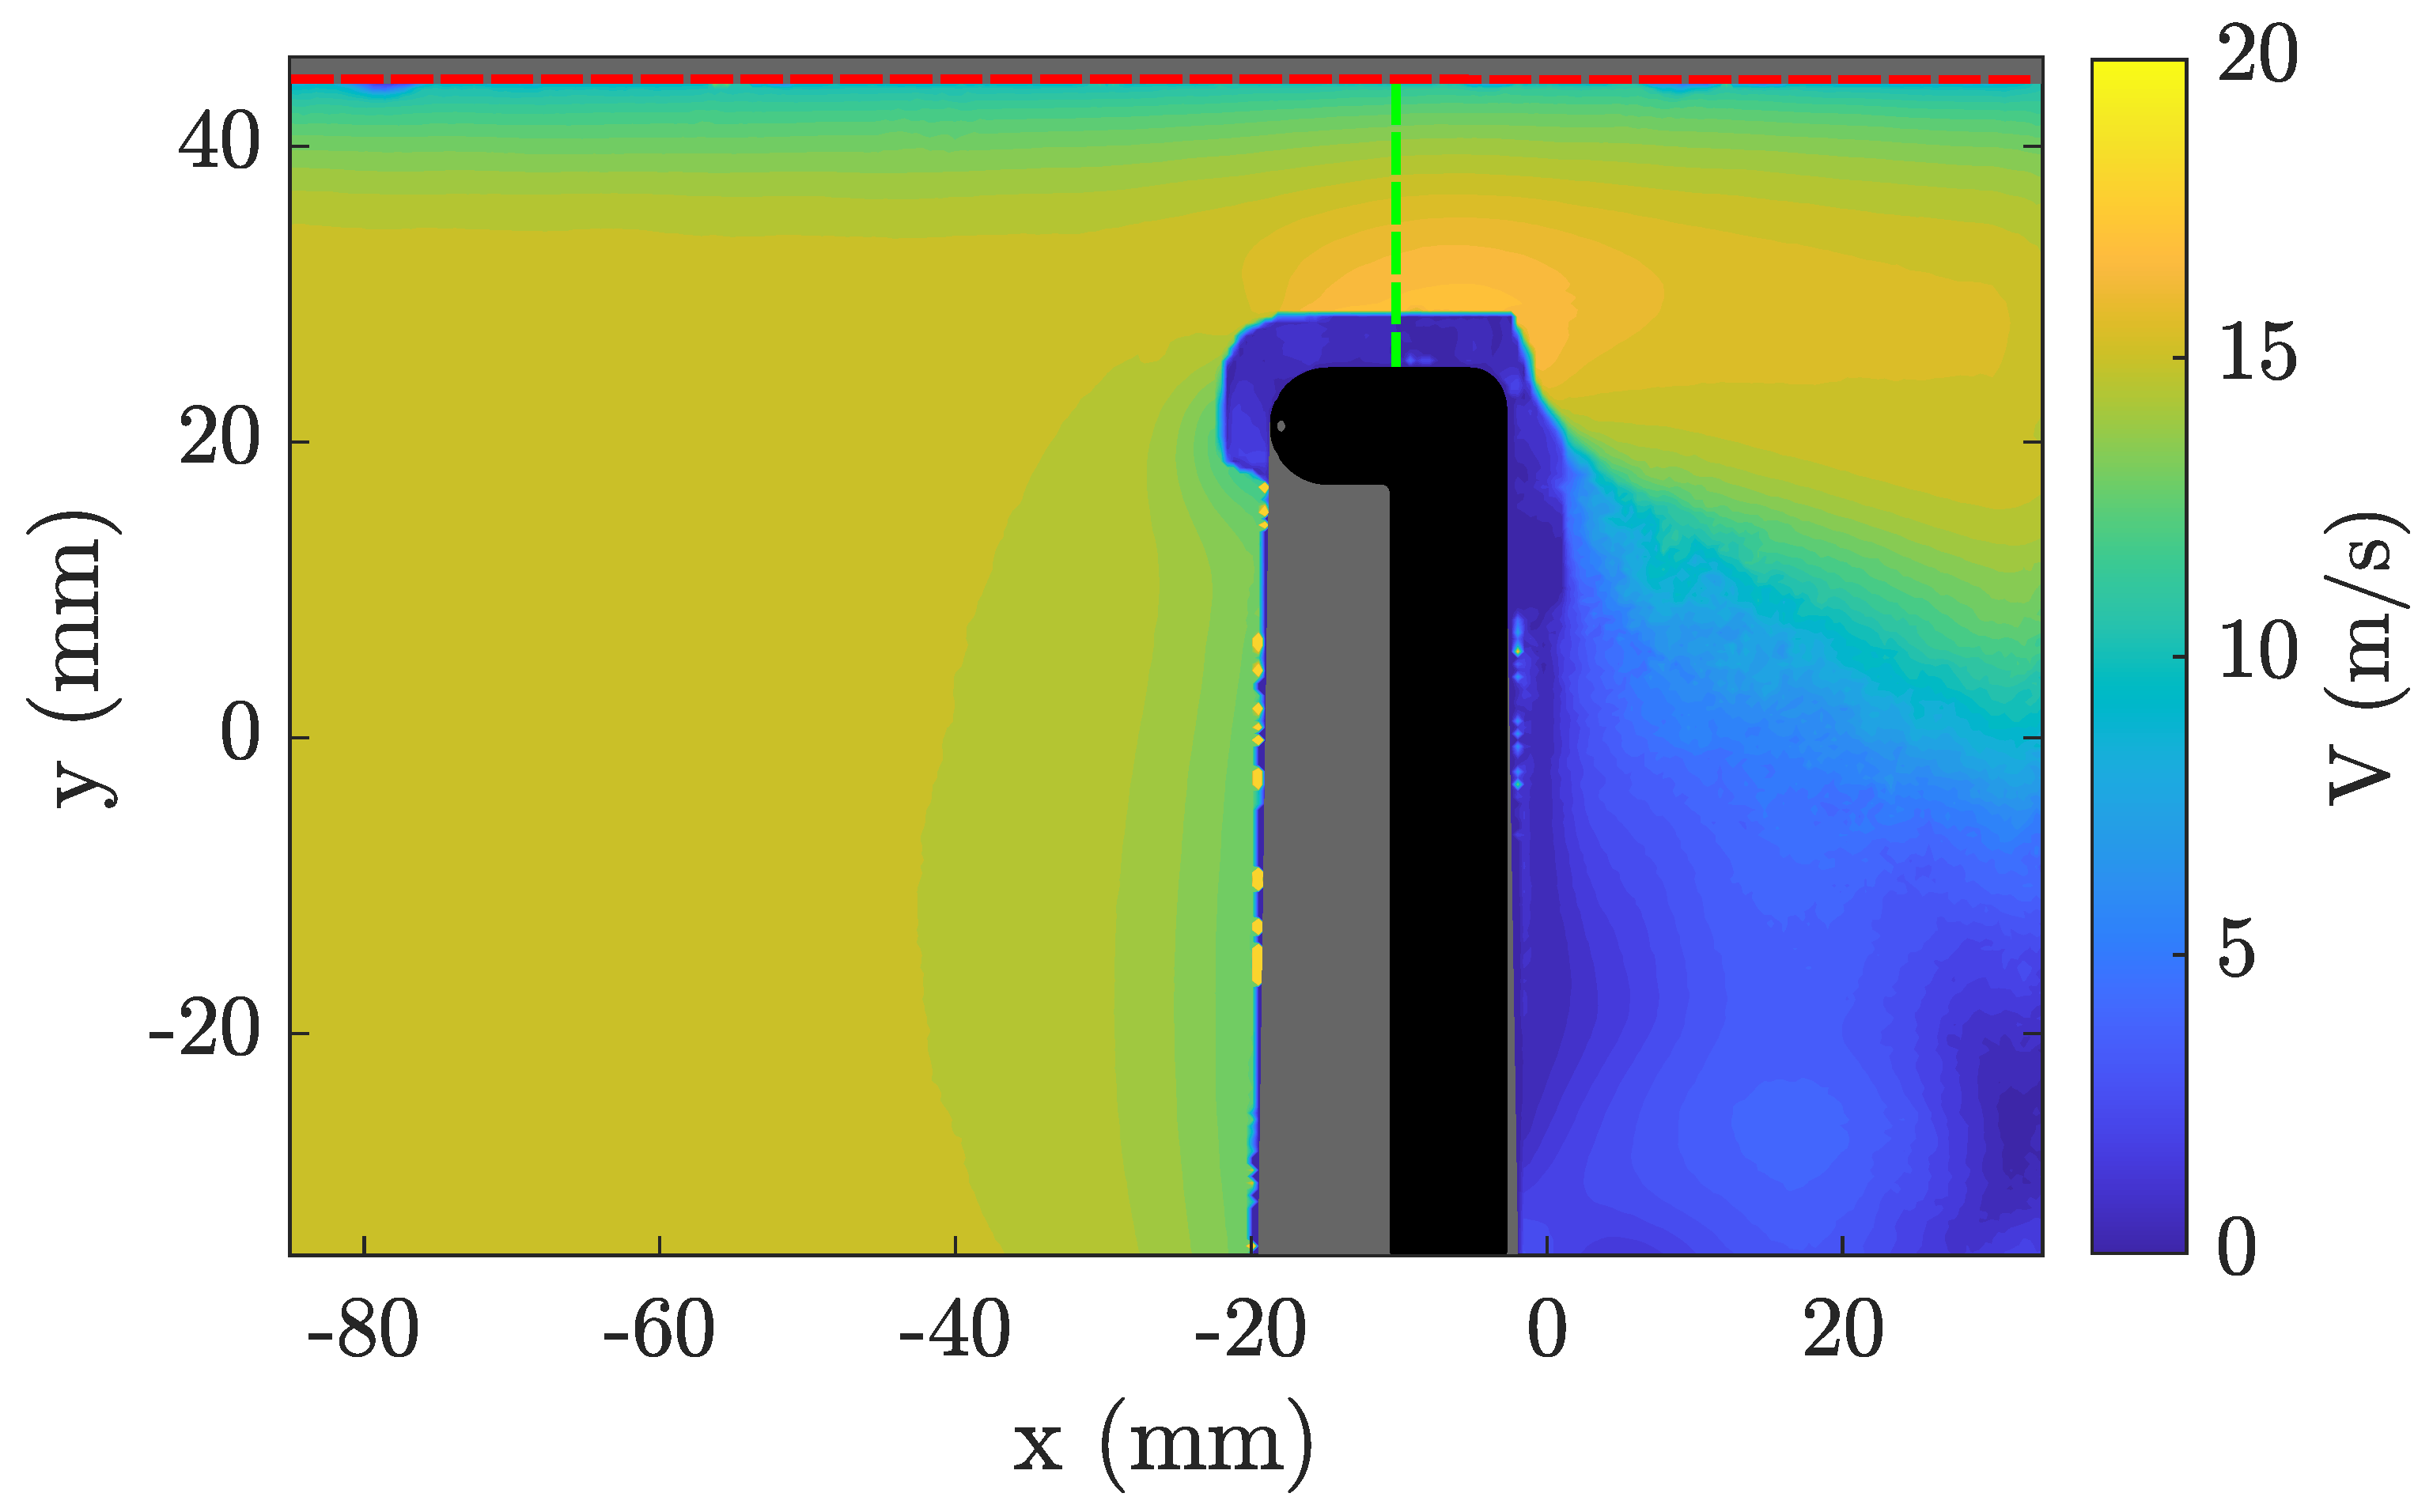
The pressure in the probe holes depends on the velocity field, which is altered by the probe–wall interaction. PIV was used to assess whether local velocity modifications due to the presence of the probe might be responsible for the calibration coefficient changes. The PIV field is the result of both the effects of the wall proximity and the boundary layer. The blockage of the flow near the wall triggers an acceleration between the probe and the wall, which may have some consequences on the pressure distribution along the probe head. The PIV results allow this acceleration to be measured and correlated to the measured pressure coefficients. Figure 26 shows the region where the flow velocity is extracted and the maximum computed. Table 7 reports the results for different probe heights. The velocity magnitude was normalised by the free-stream velocity.
The maximum geometrical blockage due to the presence of the probe is 4% and happens when the probe is in contact with the wall. However, the maximal velocity is more than 10% higher than the free-stream velocity. It is above the effective reduction in the cross-section and cannot be corrected by a blockage factor. The maximum acceleration happens when the probe is around three diameters away from the wall. However, the evolution of the calibration coefficients shows no change in the calibration coefficients at this distance; see Figure 16. This means that the flow acceleration between the probe and the wall is not the primary driver in the calibration map distortions.
Figure 23 displays results for the case from the PIV analysis where δ 99 / d p = 0.69 and R e = 8 · 10 3 , whereas Figure 27 displays results for δ 99 / d p = 0.33 and R e = 8 · 10 3 . The upward vertical shift with the thicker boundary layer seems smaller than with a thinner boundary layer. A very thick boundary layer might have a less significant effect on the measurements because it reduces the maximal shear across the probe. Figure 28 shows examples of the measured yaw and pitch for smaller total pressures. The maximal error in pitch is 3.5°, and the maximal error in yaw is 3°. Both effects seem weaker or more balanced with low-speed flows.
The variety of possible boundary layer thickness-to-probe size ratios makes the design of boundary-layer-specific and wall-proximity-specific corrections necessary.

4. Discussion

- 
Lee’s results suggest that the further the mast is from the probe head, the closer the coefficient evolution is to the reference shape. A CFD or potential flow study of a conceptual spherical probe, free from any mast influence, could help test this hypothesis. The available dataset was not sufficient to assess whether the base shape deformation follows a specific function of the probe orientation. This obstacle could be overcome with finer calibration grids. If a model for this function is found, then the precision of the measurements can be improved by using the calibration data to set up the model and use it during measurement campaigns. The differences in the results for Lee’s work and this work in Table 5 show that this function would be geometry-dependent and suggest performing a calibration close to a wall for each probe geometry.
- 
The magnitude of the wall-proximity and boundary layer effects varies greatly between situations, and so does the balance between the two effects. Two separate corrections specific to the potential effect and the boundary layer itself are probably required. Such corrections could help overcome the two-diameter limit when exploring a flow close to a wall. The first step is to define the wall distance from which the corrections should be triggered. The position where the probe’s tip reaches the theoretical boundary layer is a natural candidate as an indicator. However, the correlation is not good in all cases. A better indicator could consider the probe boundary layer thickness, probe diameter, and wall boundary layer thickness. It is also possible that the local acceleration around the probe affects the wall boundary layer thickness when the probe comes closer to the wall. CFD simulations would help identify those quantities.
- 
A significant feature of the interaction between the boundary layer and the wall-proximity effects is the yaw coefficient’s weak evolution for a positive probe pitch, as highlighted in Figure 23 (the diagram’s lower part looks insensitive to the wall distance). A hypothesis for this observation is that the elbow in the probe, which is closer to the wall than the probe’s head, protects it from the most significant changes in the local velocity distribution. PIV measurements in the horizontal plane could help investigate this hypothesis. Also, the probe’s bend is above its head in these positions. The head cannot be as close to the wall as in the rest of the map. This prevents the boundary layer or the wall proximity from affecting the coefficients as much as in the prediction shown in Figure 22, for which the head is brought into contact with the wall, even if this is not physically possible.
- 
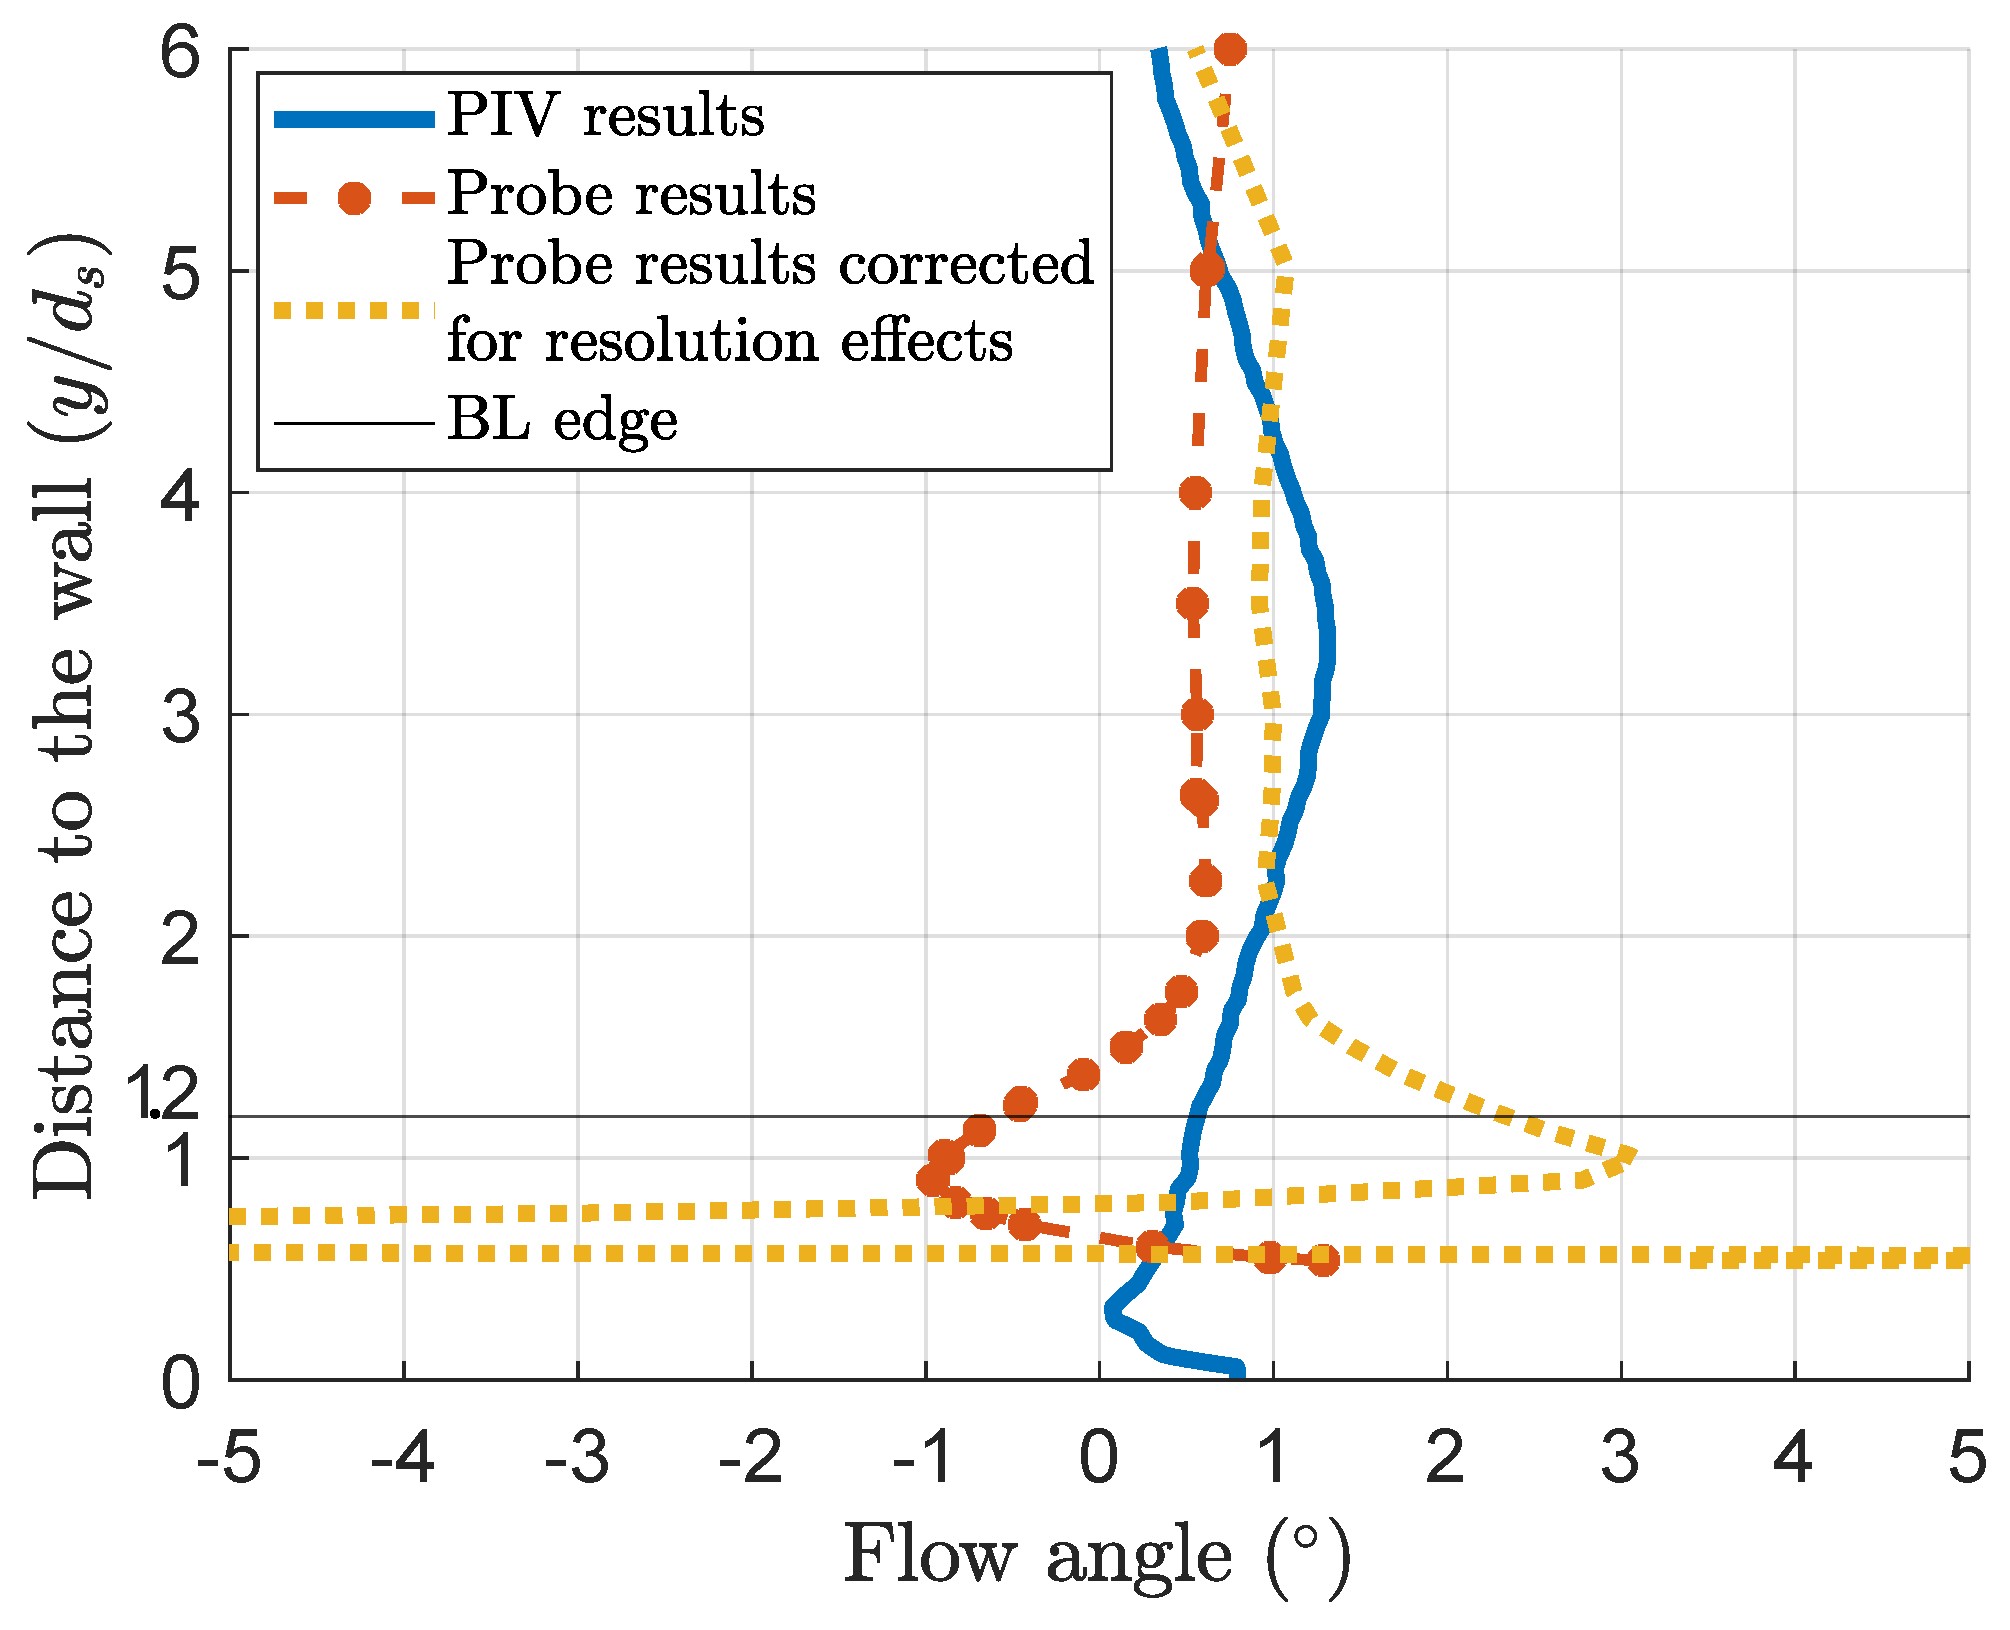
Section 3.3 shows that the resolution problem is the main issue responsible for the boundary layer effect on 5HP measurement errors near a wall. A correction of the error due to the distance between the probe holes, as described in an article by Vinnemeier [10], is hard to enforce in the wall-proximity case. The strongest gradients happen in regions without data, requiring interpolation for the hole furthest from the wall. The extrapolation can lead to aberrant results, as shown in Figure 29. The correction helps the probe measurements better fit the PIV results between two and six probe diameters where there is enough data to perform the interpolations. Models of the boundary layer and wall-proximity effects could help extrapolate the data missing for this correction. CFD could help to separate the two error sources to design the corrections.
- 
During a traverse in a real test bench, the probe can come close to at least two walls: the one in which it is inserted and the one at the other traverse end. Only the proximity of the wall opposite to the probe insertion hole is considered here. Another simplification in this work is that the turbomachine’s walls’ curvature is disregarded, and the flow is often not axial. The experimental conditions are also far from engine conditions, being incompressible when the flow can reach transonic velocity in the high-pressure turbine region.
- 
The usual Reynolds number in 5HP turbomachines studies ranges from 5 · 10 3 to 8 · 10 4 [19], whereas it spans from 4 · 10 3 to 1.6 · 10 4 in this study. In the Reynolds region not explored in this work, above 1.6 · 10 4 , in incompressible flows, the boundary layers would be thin compared to the probe diameter. The authors would expect the angle calibration coefficients to behave similarly to the results from Section 3.1. Mach numbers can approach 1 in turbomachines, whereas this work focuses on incompressible flows. A complementary study would be necessary to extend the results to high Reynolds numbers in compressible flow, as they might change the way the probe interacts with the wall.
- 
Mach and Reynolds number changes have been shown to be able to adversely affect 5HP measurements [9,20,21,22,23,24]. Decoupling Mach and Reynolds number effects was not possible in this work because the quantity d 99 / d p , which is very significant here, adds constraints to the problem. However, this work’s probe’s calibrations in the Mach and Reynolds number range considered here showed no Mach or Reynolds number effect on the yaw and pitch calibration coefficients. The errors when measuring close to the wall in the Mach and Reynolds number range considered here for this work’s probe are then not expected to come from changes in the free-stream calibration due to Mach and Reynolds number changes.
- 
A deeper look into the evolution of each probe hole pressure shows that the hole closest to the wall is very sensitive to the wall proximity and the main hole responsible for the pitch angle coefficient drift. As 5HPs can perform measurements using solely the centre and three side holes [5], an algorithm that predicts a value for the sensible pressure hole from the four other pressures and compares it to the measured value can be designed. A significant difference between the predicted and the measured value could serve as a signal, for example, that the post-processing should be performed using a zonal calibration or that measurements are less reliable.

5. Conclusions

The common rule is that the wall-proximity effect starts when the probe is two diameters away from the wall. This work underlines the universality of this rule, which was observed to be valid for the Safran probe. The calibration behaviour for a thin boundary layer is the same in this work and the work of Lee [15]. The changes in calibration coefficients near the wall are suggested to be interpreted as a new parameter of calibration maps instead of sources of error to help perform measurements closer to walls.
It was shown that all angle calibration coefficients show a similarity in their evolution near the wall in the absence of a boundary layer. This result shows that near-wall calibrations can be performed with a reduced number of measurement points.
The changes in calibration coefficients were extended to cases with a significant BL thickness. This experiment shows an effect of the wall proximity distinct from the boundary layer effect, which can be isolated in some cases. The probe measures a pitch diverging from the wall as it comes closer to the wall, but the boundary layer has the opposite effect. The two effects compete regarding pitch measurements and can sometimes balance each other out. These findings are coherent with the work of Bailey [9]. In cases with yaw, the wall’s proximity increases the perceived yaw. Those results are summarised in Figure 30.
In cases where the two effects could be isolated, the boundary layer had an effect on the yaw measurement two to three times weaker than the wall proximity. The boundary layer reinforces the wall-proximity effect when the probe has a negative pitch relative to the wall. The opposite happens for positive pitch. The boundary layer effect seems to be dampened when the boundary layer is very large.
The diversity of relative amplitude and spatial reach of the two error sources implies that two separate corrections, along with a resolution effect correction, are necessary. The ultimate correction would then have three components: the distance between the holes, the boundary layer, and the wall proximity.
Finally, it was shown that the magnitude of the flow acceleration between the probe and the wall is not the most significant quantity to explain changes in angle coefficients due to the wall proximity.
The design of wall-proximity correction could extend the field measurable with 5HPs. If no satisfying correction method is found, this effort will clarify where the results are less reliable and by how much. In that case, the calibration data could be used to detect when a probe hole is providing a pressure value that is too discrepant.

Author Contributions

Conceptualisation, A.V., N.B., F.F. and J.-L.C.; data curation, A.V.; formal analysis, A.V., N.B., F.F. and J.-L.C.; funding acquisition, N.B., F.F. and J.-L.C.; investigation, A.V.; methodology, A.V., N.B., F.F. and J.-L.C.; project administration, N.B., F.F. and J.-L.C.; resources, A.V., N.B., F.F. and J.-L.C.; software, A.V.; supervision, N.B., F.F. and J.-L.C.; validation, A.V., N.B., F.F. and J.-L.C.; visualisation, A.V.; writing—original draft, A.V.; writing—review and editing, A.V., N.B., F.F. and J.-L.C. All authors have read and agreed to the published version of the manuscript.

Funding

This research was supported by SAFRAN and Association Nationale de la Recherche et de la Technologie (ANRT). Grant number: 2020/0024.

Data Availability Statement

The data generated during this work are not confidential and can be provided by the authors.

Acknowledgments

The authors would like to thank Philippe Mouligné from ISAE-SUPAERO, Didier Welter, Lucas Belot, and the technical staff of VKI, the PIV team, and the Ph.D. students who provided training with the PIV system in VKI for their help in the present work.

Conflicts of Interest

Author Jean-Louis Champion was employed by the company Safran Tech. The remaining authors declare that the research was conducted in the absence of any commercial or financial relationships that could be construed as a potential conflict of interest.

References

  1. Bidan, G.; Champion, J.L. Development of ultra high temperature multi-hole probes. In Proceedings of the XXIV Biennial Symposium on Measuring Techniques in Turbomachinery, Prague, Czech Republic, 29–31 August 2018; pp. 105–111. [Google Scholar]
  2. Georgiou, D.P.; Milidonis, K.F. Fabrication and calibration of a sub-miniature 5-hole probe with embedded pressure sensors for use in extremely confined and complex flow areas in turbomachinery research facilities. Flow Meas. Instrum. 2014, 39, 54–63. [Google Scholar] [CrossRef]
  3. Ligrani, P.M.; Singer, B.A.; Baun, L.R. Miniature five-hole pressure probe for measurement of three mean velocity components in low-speed flows. J. Phys. E Sci. Instruments 1989, 22, 868–876. [Google Scholar] [CrossRef]
  4. Hall, B.F.; Povey, T. The Oxford Probe: An open access five-hole probe for aerodynamic measurements. Meas. Sci. Technol. 2017, 28, 035004. [Google Scholar] [CrossRef]
  5. Paul, A.; Upadhyay, R.; Jain, A. A novel calibration algorithm for five-hole pressure probe. Int. J. Eng. Sci. Technol. 2011, 3, 89–95. [Google Scholar] [CrossRef]
  6. Ma, S.; Hu, J.; Wang, X.; Ji, J. The Application of a Laser-Printed Miniature Five-Hole Probe in the End-Wall Flow Measurement of a Multistage Axial Compressor. Aerospace 2023, 10, 1020. [Google Scholar] [CrossRef]
  7. Gaetani, P.; Persico, G. Technology Development of Fast-Response Aerodynamic Pressure Probes. Int. J. Turbomach. Propuls. Power 2020, 5, 6. [Google Scholar] [CrossRef]
  8. Bartsch, C.; Hölle, M.; Jeschke, P.; Metzler, T. 1D Adaptive Measurement Grid for Improved Pneumatic Probe Measurements. In Proceedings of the Turbo Expo: Power for Land, Sea, and Air, Montreal, QC, Canada, 15–19 June 2015; p. V006T05A005. [Google Scholar] [CrossRef]
  9. Bailey, S.C.C.; Hultmark, M.; Monty, J.P.; Alfredsson, P.H.; Chong, M.S.; Duncan, R.D.; Fransson, J.H.M.; Hutchins, N.; Marusic, I.; McKeon, B.J.; et al. Obtaining accurate mean velocity measurements in high Reynolds number turbulent boundary layers using Pitot tubes. J. Fluid Mech. 2013, 715, 642–670. [Google Scholar] [CrossRef]
  10. Vinnemeier, F.; Simon, L.; Koschel, W. Korrektur des Kopfgeometrieeinflusses einer Fünfloch- Drucksonde auf die Meßergebnisse / Correction method for the head geometry influence of a five-hole pressure probe on the measurement results. Tech. Mess. 1990, 57, 296–303. [Google Scholar] [CrossRef]
  11. MacMillan, F.A. Experiments on Pitot-Tubes in Shear Flow. In Aeronautical Research Council Reports & Memoranda; Cranfield University: Bedford, UK, 1957. [Google Scholar]
  12. Treaster, A.L.; Yocum, A. The Calibration and Application of Five-Hole Probes; Technical Report; Pennsylvania State University Park Applied Research Lab: State College, PA, USA, 1978. [Google Scholar]
  13. Jangir, R.; Sitaram, N.; Gajanan, C. A Miniature Four-Hole Probe for Measurement of Three-Dimensional Flow with Large Gradients. Int. J. Rotating Mach. 2014, 2014, 297861. [Google Scholar] [CrossRef]
  14. Smout, P.D.; Ivey, P.C. Investigation of Wedge Probe Wall Proximity Effects: Part 1—Experimental Study; American Society of Mechanical Engineers: New York, NY, USA, 1996; Volume 78767. [Google Scholar]
  15. Lee, S.W.; Yoon, T.J. An investigation of wall-proximity effect using a typical large-scale five-hole probe. KSME Int. J. 1999, 13, 273–285. [Google Scholar] [CrossRef]
  16. Grimshaw, S.D.; Taylor, J.V. Fast Settling Millimetre-Scale Five-Hole Probes. In Proceedings of the ASME Turbo Expo 2016: Turbomachinery Technical Conference and Exposition, Seoul, Republic of Korea, 13–17 June 2016. [Google Scholar] [CrossRef]
  17. Appukuttan, R.J.A.; Miller, H.P.H. Probe Measurement Errors Caused by Shear Flows. In Proceedings of the The 17th Symposium on Measuring Techniques in Transonic and Supersonic Flow in Cascades and Turbomachines, Stockholm, Sweden, 9–10 September 2004; pp. 105–111. [Google Scholar]
  18. Sitaram, N.; Lakshminarayana, B.; Ravindranath, A. Conventional probes for the relative flow measurement in a turbomachinery rotor blade passage. J. Eng. Power-Trans. ASME 1981, 103, 406–414. [Google Scholar] [CrossRef]
  19. Lee, S.W.; Jun, S.B. Reynolds number effects on the non-nulling calibration of a cone-type five-hole probe for turbomachinery applications. J. Mech. Sci. Technol. 2005, 19, 1632–1648. [Google Scholar] [CrossRef]
  20. Boerner, M.; Bitter, M.; Niehuis, R. On the challenge of five-hole-probe measurements at high subsonic Mach numbers in the wake of transonic turbine cascades. J. Glob. Power Propuls. Soc. 2018, 2, 453–464. [Google Scholar] [CrossRef]
  21. Kost, F. The Behaviour of Probes in Transonic Flowfields of Turbomachinery. In Proceedings of the 8th European Conference on Turbomachinery—Fluid Dynamics and Thermodynamics, Graz, Austria, 23–27 March 2009. [Google Scholar]
  22. Sitaram, N.; Kumar, V.; Pillala, V.; Purushothama, B.; Prasad, B. Calibration of Multi Hole Pressure Probes for Three Dimensional Flow Measurements at High Mach Numbers. In Proceedings of the 12th International Symposium on Experimental Computational Aerothermodynamics of Internal Flows, Genova, Italy, 13–16 July 2015; pp. 1–9. [Google Scholar]
  23. Houtman, E.M.; Bannink, W.J. The Calibration and Measuring Procedure of a Five-Hole Hemispherical Head Probe in Compressible Flow; Recon Technical Report N; NASA STI: Hampton, VI, USA, 1989. [Google Scholar]
  24. Dominy, R.G.; Hodson, H.P. An Investigation of Factors Influencing the Calibration of 5-Hole Probes for 3-D Flow Measurements. In Proceedings of the Turbo Expo: Power for Land, Sea, and Air. American Society of Mechanical Engineers, Cologne, Germany, 1–4 June 1992; Volume 78934, p. V001T01A077. [Google Scholar] [CrossRef]
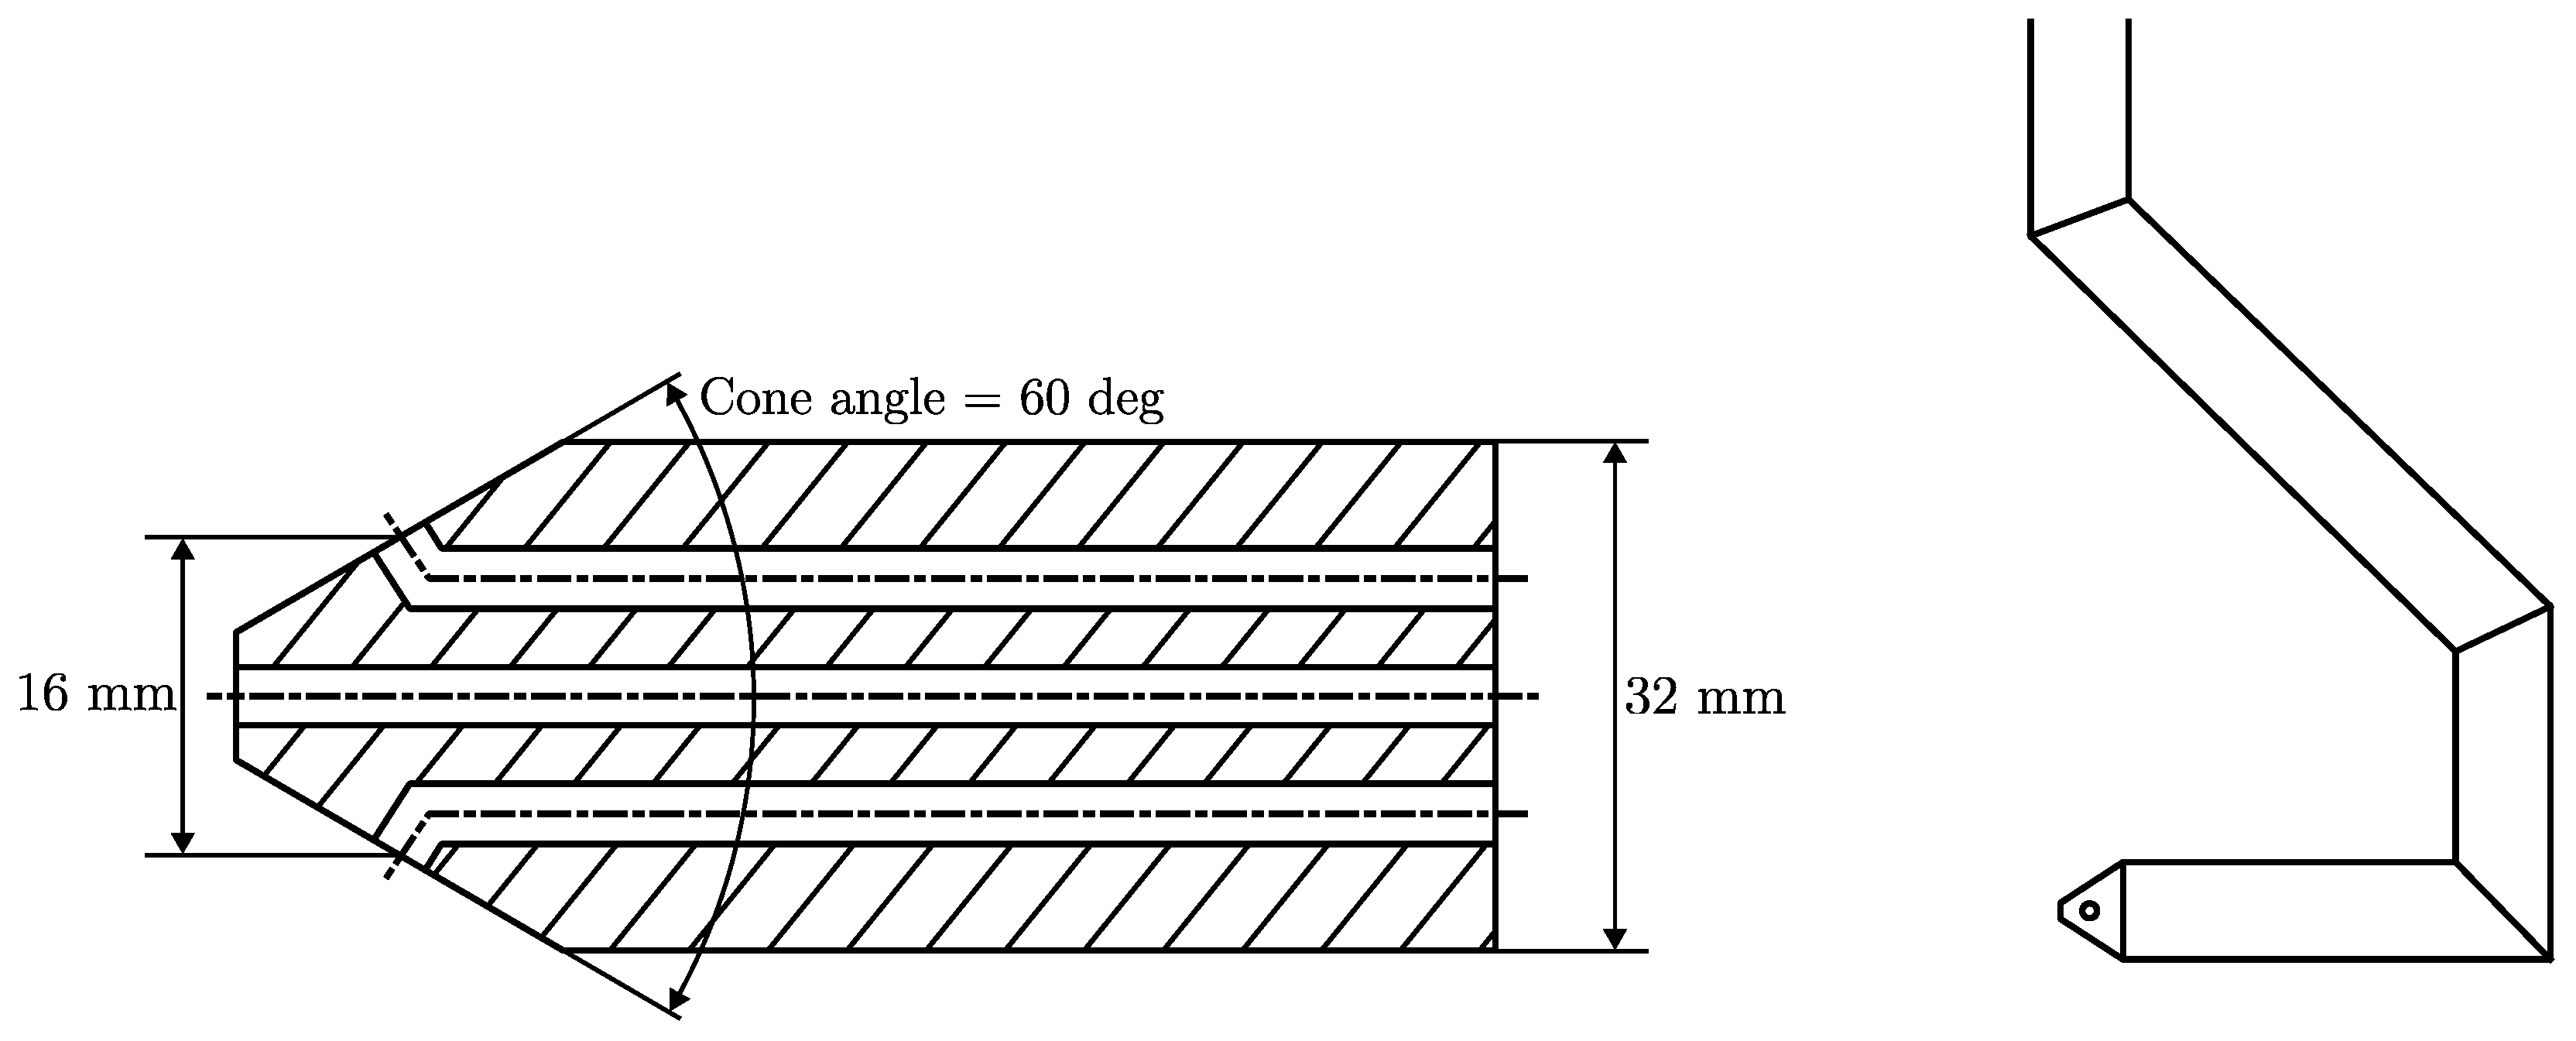
Figure 1. Lee’s probe head details and probe shape [15].
Ijtpp 09 00016 g001
Figure 2. The VKI L-12 wind tunnel.
Ijtpp 09 00016 g002
Figure 3. Mounting gear and test section.
Ijtpp 09 00016 g003
Figure 4. The probes used for the experiment and details of the head. The heads were 3D printed and assembled with the masts in VKI. They were coated in black paint to be less reflective.
Ijtpp 09 00016 g004
Figure 5. Illustration of the probe positions and angle conventions.
Ijtpp 09 00016 g005
Figure 6. Naming convention of the probe holes in this document.
Ijtpp 09 00016 g006
Figure 7. Representation of evolution of the flow angle measurement during a traverse.
Ijtpp 09 00016 g007
Figure 8. Evolution of the flow angle reading error.
Ijtpp 09 00016 g008
Figure 9. The top hole (hole number 1), crossed in red, comes closer to the wall when the probe has a negative pitch. The head centre cannot reach the 0.5 d wall distance when the probe has a positive pitch (blue).
Ijtpp 09 00016 g009
Figure 10. Comparison of the angle coefficient’s behaviour near the wall, reported by Lee et al. [15] for δ 99 / d p = 0.028 and R e = 35 · 10 3 , and from this work for δ 99 / d p = 0.16 and R e = 16 · 10 3 . The solid lines are from Lee [15], and the lines with error bars are from this work.
Ijtpp 09 00016 g010
Figure 11. Angle coefficient’s behaviour near the wall, as measured in this work, for δ 99 / d p = 0.16 and R e = 16 · 10 3 .
Ijtpp 09 00016 g011
Figure 12. Calibration map evolution for δ 99 / d p = 0.16 and R e = 16 · 10 3 . The grey dots are the ( k y a w , k p i t c h ) calculated from the pressure data as functions of wall proximity for a given probe orientation. The yellow map representing the calibration data 0.525 diameters away from the wall is incomplete. The reason is that the head bend prevented the head from getting close to the wall for positive pitches; see Figure 9.
Ijtpp 09 00016 g012
Figure 13. Fit of the k p i t c h * traverse from this work when the probe has a mechanical pitch and yaw of 10°.
Ijtpp 09 00016 g013
Figure 14. Fit of the k y a w * traverse from this work when the probe has a mechanical pitch and yaw of 0° and 10°, respectively.
Ijtpp 09 00016 g014
Figure 15. Pitch coefficient evolution for δ 99 / d p = 0.33 and R e = 8 · 10 3 . The black line marks where the probe reaches the edge of the theoretical boundary layer.
Ijtpp 09 00016 g015
Figure 16. Pitch coefficient evolution for δ 99 / d p = 0.69 and R e = 8 · 10 3 . The black line marks where the probe reaches the edge of the theoretical boundary layer.
Ijtpp 09 00016 g016
Figure 17. BL component in pitch coefficient for −10° pitch and 10° yaw for δ 99 / d p = 0.34 and R e = 16 · 10 3 . The star marks the probe’s entrance into the boundary layer.
Ijtpp 09 00016 g017
Figure 18. BL component in pitch coefficient for 0° pitch and 0° yaw for δ 99 / d p = 0.69 and R e = 8 · 10 3 . The star marks the probe’s entrance into the boundary layer.
Ijtpp 09 00016 g018
Figure 19. BL component in yaw coefficient for 10° pitch and 10° yaw for δ 99 / d p = 0.33 and R e = 8 · 10 3 . The star marks the probe’s entrance into the boundary layer.
Ijtpp 09 00016 g019
Figure 20. BL component in yaw coefficient for −10° pitch and 10° yaw for δ 99 / d p = 0.34 and R e = 16 · 10 3 . The star marks the probe’s entrance into the boundary layer.
Ijtpp 09 00016 g020
Figure 21. The velocity field from the PIV results can help simulate a probe traverse.
Ijtpp 09 00016 g021
Figure 22. Simulation of a calibration map evolution without probe intrusivity or wall-proximity effect.
Ijtpp 09 00016 g022
Figure 23. Calibration map evolution for δ 99 / d p = 0.69 and R e = 8 · 10 3 .
Ijtpp 09 00016 g023
Figure 24. Perceived direction with vertical probes.
Ijtpp 09 00016 g024
Figure 25. Perceived direction with −10° pitch and 10° yaw.
Ijtpp 09 00016 g025
Figure 26. PIV velocity field for δ 99 / d p = 0.69 , R e = 8 · 10 3 , and y * = 3 . The green dashed line is where the maximum velocity was extracted to build Table 7. The red dashed line is the wall. The grey area was not analysed because of the probe’s shadow. The blue zone around the head is a space polluted by laser reflections on the probe’s head.
Ijtpp 09 00016 g026
Figure 27. Calibration map evolution for δ 99 / d p = 0.33 and R e = 8 · 10 3 .
Ijtpp 09 00016 g027
Figure 28. Perceived direction for lower Mach numbers.
Ijtpp 09 00016 g028
Figure 29. Comparison of the PIV pitch angle profile, the probe results, and the results corrected for the distance between the probe holes for δ 99 / d p = 0.69 and R e = 8 · 10 3 , 0° pitch, and 0° yaw.
Ijtpp 09 00016 g029
Figure 30. Summary of the wall-proximity and boundary layer main effects on calibration maps. Green arrows stand for the boundary layer effects and red arrows stand for the wall proximity effect.
Ijtpp 09 00016 g030
Table 1. Experiment parameters. The Reynolds numbers are orders of magnitude. ”Up” and ”down”, respectively, stand for upstream position and downstream position. d p is the probe diameter and δ 99 the boundary layer thickness.
ProbeFlow Speed (m/s) d p (mm)Reynolds Number δ 99 / d p
Lee [15]N/A32 35 · 10 3 0.028
Large probe1616 16 · 10 3 Up: 0.16
Down: 0.34
Large probe816 8 · 10 3 Up: 0.18
Down: 0.38
Medium probe168 8 · 10 3 Up: 0.33
Down: 0.69
Medium probe88 4 · 10 3 Up: 0.36
Down: 0.76
Table 2. Probe mechanical position during the traverses.
TraversePitchYaw
1
210°
310°
410°10°
5−10°
6−10°10°
Table 3. Uncertainty sources and estimations. FS = full span.
SourceUncertaintyOrigin
Probe’s sensors0.12%FS + 0.5% of the resultCalibrations
Total pressure sensor0.1%FS + 1% of the resultCalibrations
Static pressure sensor0.5%FSData sheet
Probe mount0.2° in pitch and yaw setting
0.1 mm in height
1 mm in stream-wise position
Graduations on
the gear
Data reduction
method
0.2° in pitch and yaw measurementStatistics
PIV post-processing μ m a x = 2 %
95% confidence interval
Normal sampling
distribution
k y a w d k y a w =
1 p 5 p ¯ i = 2 , 4 d p i 2 + k y a w 2 ( d p 5 2 + 1 16 i = 1 4 d p i 2 )
Taylor series
expansion
k p i t c h d k p i t c h =
1 p 5 p ¯ i = 1 , 3 d p i 2 + k p i t c h 2 ( d p 5 2 + 1 16 i = 1 4 d p i 2 )
Taylor series
expansion
Room temperature0.5 °CPrecision of
the display
Atmospheric pressure0.01%FS + 1 digitCalibration sheet
Table 4. Extent of the combined yaw and pitch error. This quantity is the distance between the free-stream reading (black dot) and the reading when the probe touches the wall (black square) in Figure 8. In this table, P and Y are, respectively, the mechanical pitch and yaw.
Angle Reading ErrorP = 0°P = −10°
Y = 0°3.3°6.7°
Y = 10°3.4°6.2°
Table 5. Similarity between the traverses and the reference shape for the pitch coefficient.
ExperimentProbe OrientationHorizontal ScalingVertical ScalingMinimal Distance
Constant k p i t c h /112.3
This work (ref)P = −10°, Y = 0°110%
This workP = −10°, Y = 10°0.950.990.8%
This workP = 0°, Y = 0°0.660.930.53%
This workP = 0°, Y = 10°0.490.870.6%
This workP = 10°, Y = 0°0.790.990.8%
This workP = 10°, Y = 10°0.690.960.9%
LeeP = −10°, Y = 0°1.70.972.2%
LeeP = 0°, Y = 0°1.51.01.7%
LeeP = 10°, Y = 0°0.140.613%
Table 6. Yaw coefficient fitting parameters for the traverses with a non-zero probe mechanical yaw.
ExperimentProbe OrientationHorizontal DeformationVertical DeformationMinimal Distance
This workP = −10°, Y = 10°1.714.8%
This workP = 0°, Y = 10°2.51.02.1%
This workP = 10°, Y = 10°2.140.972.3%
LeeP = −10°, Y = 10°7.20.9816%
LeeP = −10°, Y = −10°−9.50.9811%
LeeP = 0°, Y = 10°3.81.04%
LeeP = 0°, Y = −10°−7.11.09%
Table 7. Maximum velocity between the probe head and the wall.
Probe Distanceto the Wall ( y * )Max Velocity ( V / V inf )
41.10
31.13
21.08
1.50.99
1.251.01
10.98
Disclaimer/Publisher’s Note: The statements, opinions and data contained in all publications are solely those of the individual author(s) and contributor(s) and not of MDPI and/or the editor(s). MDPI and/or the editor(s) disclaim responsibility for any injury to people or property resulting from any ideas, methods, instructions or products referred to in the content.