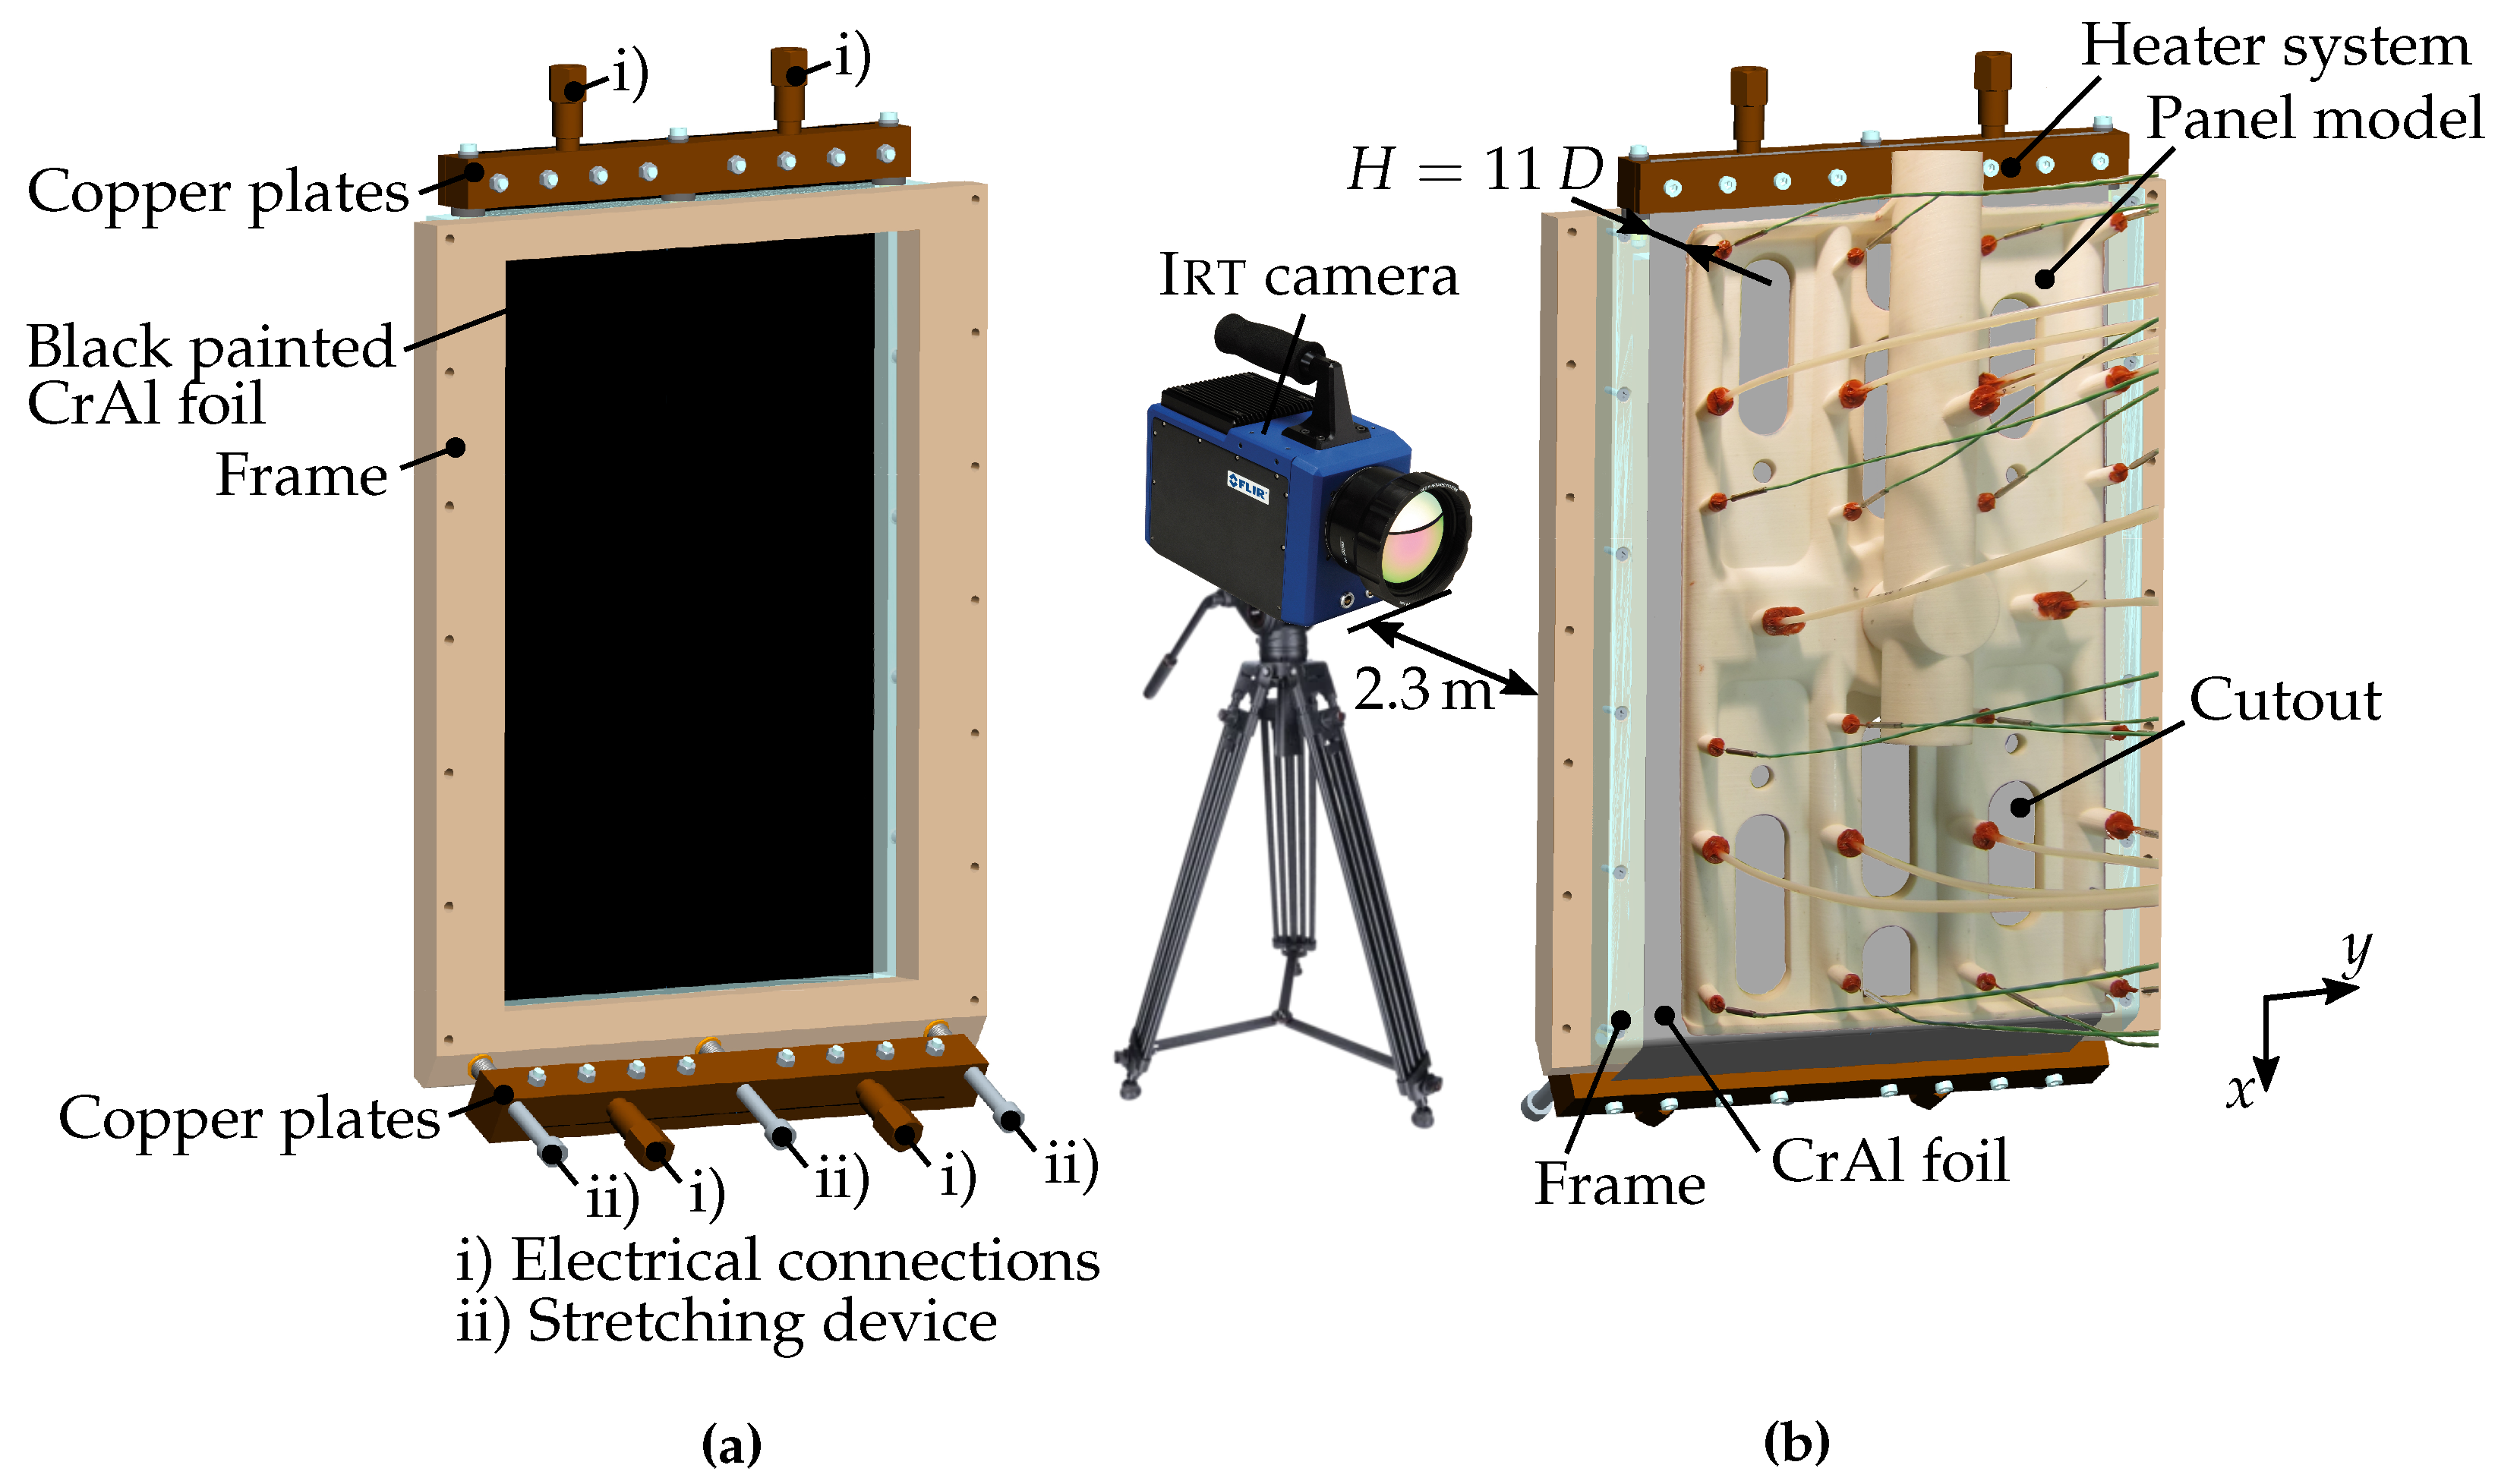
The polymer PA 2201 was used as material manufacturing the model from three individual parts on an Eosint P system (supply tube, top side and bottom side separately). To ensure the tightness of the material, the three parts were treated with a special varnish (Cramolin Plastik) before the gluing process. Silicone seal ensures tightness at the glued joints. The holes were manufactured in a second step with a molding cutter to ensure an adequate hole geometry, which was verified under a microscope.
With a special mechanism, the heater system and the panel model can be rotated in an angle of up to
to the crossflow. The crossflow effect is not discussed within this paper. Cooling air is supplied to the panel model from a screw compressor
Atlas Copco GA 22 with a thermal mass flow controller from
Teledyne Hastings. Up to
g/s, a HFC-303 controller gives an accuracy of
g/s. Higher mass flow rates of up to 50 g/s are generated with an accuracy of
g/s using a HFC-207 controller. After impinging onto the target plate, the cooling air can exit via both sides in
y-direction and through the cutouts (see
Figure 2). The impinging jets and the target plate are protected from environmental influences, as they are integrated inside the wind tunnel. The backside of the target plate, which lies outside the wind tunnel, is protected likewise by a wooden box (not shown in
Figure 3). For the optical access of the IRT camera, the box is left open to one side. In order to avoid reflections, the area between the target plate and the camera is covered with a black cloth. Two K-type thermocouples measure the ambient temperature inside the cloth. The temperature of the impinging jets is also measured using K-type thermocouples at several positions inside the panel model (see
Figure 1). The thermocouples are connected to a MEASURpoint
DT8874-32T from
DataTranslation. A calibration of the thermocouples with a dry-block calibrator
Ametek RCT-159B ensures an accuracy of
K including the uncertainty from the resulting calibration curve.
After the electrical power at the target plate is suddenly switched on, the surface temperature at the outer side of the CrAl foil is measured with the IRT camera. The accuracy of the IRT camera was investigated in a climate chamber with known thermal conditions. Maximum deviations occur for surface temperatures near the surrounding temperature ( K) with an error of K. At higher surface temperatures the accuracy lies within ±0.2 K. For the transient heat transfer measurements, the temperature inside the panel model is nearly constant. With the information of the jet temperature and the IRT data, the heat transfer at the target plate can be predicted. The mathematical procedure will be discussed within the next section.
2.1. Heat Transfer Prediction
For the heat transfer prediction at the target plate, the temperature gradient across the thickness of the CrAl foil is neglected. This assumption is valid according to the lumped-capacitance method [
21,
22], achieving a Biot number of
for the thin foil including the black paint. With this assumption, the heat transfer characteristics at the target plate can be predicted directly from the measured IRT data at the outer side of the foil. For the evaluation process, MATLAB 18 is used.
After reaching steady-state flow conditions, the IRT camera starts recording a few seconds before the heater is switched on. To reduce the thermal noise of the IRT data, the transient temperatures are smoothed over ten values. With the smoothed temperatures, the heat transfer due to forced convection from the impinging jets
is calculated for each pixel
The variables
refer to the position of the pixel on the target plate. The first term on the right-hand side of Equation (
2) denotes the electrical power
of the power supply, which is applied to the surface of the foil
. It is assumed, that the specific heat flux from the power supply
is constant over
, as the electrical resistance of the foil was found to be nearly independent of the temperature in the applied range of 290 K–380 K. The second term in Equation (
2) considers the change of internal energy. As the temperature gradient across the thickness of the foil (
) and of the black paint (
) is neglected,
is constant over
and
. The change of internal energy over time inside the foil and inside the black paint (index variable
X) is calculated for each pixel
The first line in Equation (
3) describes the theoretical formulation of the change of internal energy. The second line shows the implementation in MATLAB. According to the material specification, the density of the CrAl foil is given by
kg/m
3 and the specific heat capacity by
J/(kgK). The material properties can be assumed to be constant in the applied temperature range. For the black paint no material properties are specified. For this reason, the material properties from silicone resin
kg/m
3 and
J/(kgK) are used [
23], as the black paint is based on it.
With the third term in Equation (
2), the heat conduction between the pixels inside the foil and inside the black paint (index variable
X) are considered
As described for Equation (
3), the first line in Equation (
4) gives the theoretical formulation of the heat conduction and the second line shows the implementation in MATLAB. The thermal conductivity of the foil is specified to
W/(mK). For the black paint again, the value for silicone resin is used
W/(mK) [
23]. Since the lateral heat conduction in Equation (
4) refers to the cross-sectional area of the pixels inside the foil and inside the black paint (
), it has to be set in relation to the area of one pixel
. This ensures that all terms in Equation (
2) refer to the same surface.
With the fourth term in Equation (
2), the thermal radiation is considered to
The emissivity of the black paint
was measured in a climate chamber with known thermal conditions. At the inner side of the CrAl foil a value of
is used, which is valid for aluminum foils and polished chrome [
24].
The influence of natural convection on the outer side of the foil is considered with the fifth term in Equation (
2)
The transient behavior of the heat transfer due to natural convection was determined experimentally. This procedure results in a time dependent heat transfer coefficient
, which can be described with polynomial functions. The determination of the local heat transfer coefficient due to natural convection will be explained in
Section 2.2.
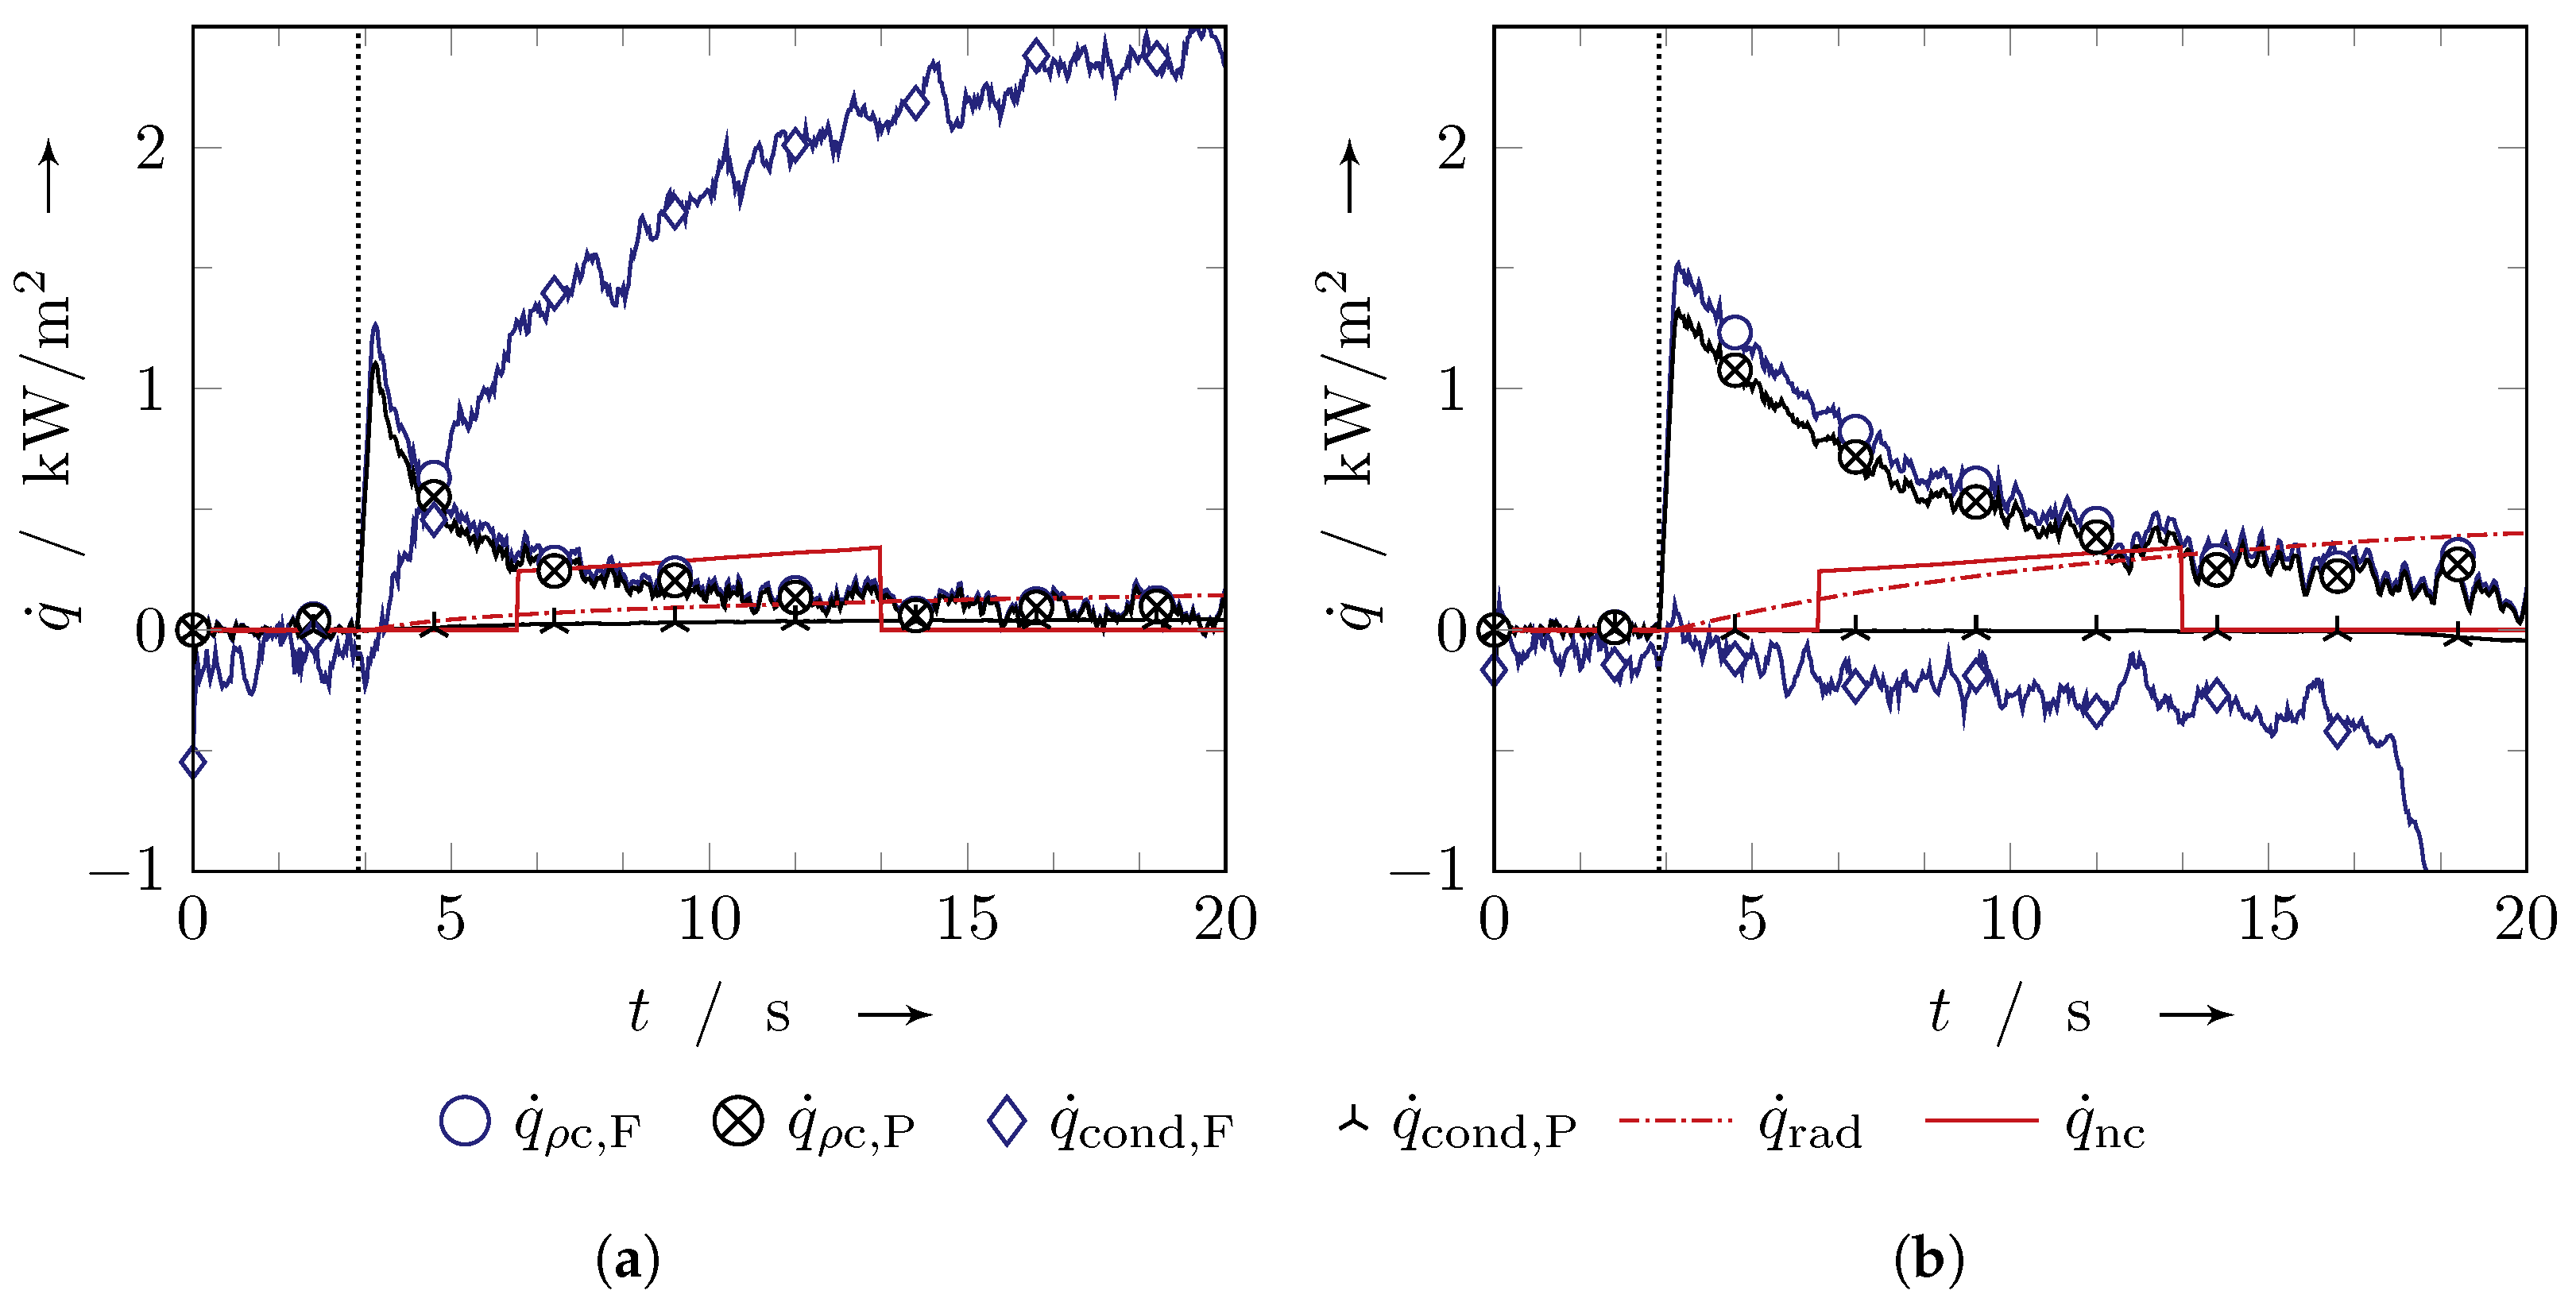
The transient results for the individual terms in Equation (
2) are shown in
Figure 4 exemplarily for one pixel in the stagnation point of an impinging jet and for one pixel in a distance of
from the stagnation point. The jet Reynolds number based on the jet diameter is Re = 2000.
The graphs in
Figure 4 give an impression of the effect of each term on the prediction of the specific heat
, which is transferred by forced convection. The vertical dotted line shows the starting time of the power supply. The electrical power results in a constant specific heat flux of
kW/m
2 for each pixel, which is not inserted in the graphs in
Figure 4. The increase in internal energy
inside the foil and inside the black paint is significant at the beginning. After about
s, both terms decrease, with a steeper gradient in the stagnation point compared to the pixel
outside. Due to high temperature gradients in the stagnation region, the lateral heat conduction inside the foil in
Figure 4a has a considerable effect, whereas the intensity in
Figure 4b is small. At approximately
s the term
decreases steeply in
Figure 4b. This results from an increasing uncertainty of the IRT data, as the temperature of the pixel is outside the calibrated temperature range of the camera. The calibrated temperature range lies within 50 K to achieve higher accuracy of the IRT data. Compared to the effect inside the foil, the heat conduction inside the black paint
is negligible for both pixels. The term denoting the radiation
increases monotonically after the power supply is switched on. Due to higher heat transfer rates and therefore lower surface temperatures in the stagnation region, the effect of radiation is less apparent in
Figure 4a compared to the pixel in
Figure 4b. The term denoting the natural convection
is present only for a time interval 3 s–10 s after turning on the electrical heater. Only for this time interval, polynomial functions are defined to describe the transient behavior of natural convection. The reason for this approach will be explained in
Section 2.2.
With the prediction of the individual transient terms for each pixel and the resulting specific heat flux due to forced convection
in Equation (
2), the Nusselt number can be defined as
The jet diameter
D is used as a characteristic length. As a reference temperature of the fluid, the jet temperature
is used. This definition is valid, as the jet temperature correlates to the surrounding air temperature and the jet Reynolds number is below 35,000 [
25]. The thermal conductivity
k of the air is modeled with Sutherland’s law [
19] using the coefficients presented by White [
20].
Figure 5 shows the transient results of the specific heat flux from Equation (
2) and the Nusselt number from Equation (
7) for the two pixels, which were exemplarily discussed in
Figure 4.
In the stagnation point, the specific heat flux
rises above the specific heat flux
from the electrical power supply. This behavior results from the high lateral heat conduction inside the foil, as shown in
Figure 4a. At the pixel in a distance of
from the stagnation point, the result for the specific heat flux
is below
. In this region, the increase in surface temperature and therefore the effect of increasing internal energy is still dominant, as shown in
Figure 4b. The fast decrease in
at
s should not be considered, as it is related to the increasing uncertainty of the surface temperature
, which increases above the calibrated range of the IRT camera.
In
Figure 5b, the transient results for the Nusselt number are shown for different intensities of the electrical power supply. The blue/black colored curves belong to the specific heat flux distributions from
Figure 5a with
kW/m
2. The gray colored curves result from
kW/m
2 and
kW/m
2, respectively. The overall good agreement shows, that the results are independent of the power supply level, which is an indication, that the evaluation process characterizes the relevant effects accurately. Due to the formation of a thermal boundary layer, the Nusselt number in
Figure 5b decreases rapidly, after turning on the electrical heater. However, the uncertainty in the prediction of the Nusselt number is relatively high at the beginning of the heating process, as the surface temperature is close to the surrounding air temperature, which results in a higher uncertainty of the IRT data (see
Section 2.3). After a few seconds, the Nusselt number at the pixel in a distance of
from the stagnation point asymptotically approaches a constant value. At the stagnation point, the Nusselt number still decreases slightly over the entire time period. Expecting an independence of the Nusselt number from transient effects, this behavior is assumed to be related to an increasing uncertainty in the reference temperature. The air of the impinging jet is mixed with the surrounding air, which heats up during the heating process. As the jet temperature is used as a reference temperature, the error increases over time. This effect is more apparent in regions with low surface temperatures, as they occur in the stagnation region. The increasing uncertainty, as the surrounding components and the surrounding air heats up over time, demonstrates the difficulties of a steady-state technique in comparison to the transient approach, which was mentioned in
Section 1.
For the final evaluation of the heat transfer characteristics, a compromise has to be performed over the described measurement uncertainties. The gray colored region in
Figure 5 shows the chosen time period for the final evaluation. It starts after the steep decrease in the Nusselt number, where the uncertainty of the IRT data is more apparent. From this starting time, the results are averaged over
s, which corresponds to 45 measured values. It is assumed, that the resulting uncertainty of the Nusselt number is smallest in this time period. For the discussion of the heat transfer characteristics in
Section 3, only the averaged values will be shown.
2.2. Modeling of Natural Convection
This section describes the procedure to model the effect of natural convection at the outer side of the CrAl foil in Equation (
2). The foil is similar to a vertical plate, although the plate is limited at the bottom and the top side (see
Figure 2). Many research studies assume a constant value for the heat transfer coefficient due to natural convection over the complete surface [
22]. A common assumption is a value of
W/(m
2K) (see, e.g., Egger et al. [
26]). However, during the transient formation of a thermal boundary layer, the heat transfer coefficient can be significantly higher [
27]. In order to consider the transient heat transfer characteristics of the natural convection at the CrAl foil, it was investigated experimentally. In this study, the CrAl foil was heated without an impinging jet flow. Compared to the transient measurements with impinging jets, natural convection occurs on both sides of the foil. It is assumed, that the heat transfer coefficients
on both sides are identical. The transient results for the specific heat flux due to natural convection is given for each pixel by
Compared to Equation (
2), the lateral heat conduction can be neglected in Equation (
8), as the temperature gradient over the surface of the foil is small. After Newton’s law of cooling, the heat transfer coefficient is defined by
As the heat transfer coefficient for a vertical plate at steady-state conditions is a function of height [
22], the transient results of Equation (
9) are averaged over the width of the CrAl foil. In order to model the transient heat transfer characteristics, a polynomial function of
is used for each pixel height
iAs reference heat transfer coefficient a value of
W/(m
2K) is used. The reference time
is the starting time of the electrical power supply. The results of Equations (
9) and (
10) are shown in
Figure 6 exemplarily for three pixel heights, while
represents the pixel at the bottom side of the foil and
at the upper side.
Due to the formation of a thermal boundary layer, the heat transfer coefficient decreases sharply, after turning on the electrical heater and asymptotically approaches a constant value. This behavior corresponds to the findings of Goldstein and Eckert [
27]. According to Goldstein and Eckert [
27], the results should be independent of the pixel height at the beginning of the transient measurement. An independence of the pixel height is achieved in the upper part of the foil, which is exemplified for the pixels
and 550. For the lower part of the foil at
, the results for
are slightly higher. An explanation for this behavior is the reference temperature
in Equation (
9), which was averaged using four K-type thermocouples at different heights in a distance of
m from the foil. The measured temperatures differ up to 2 K over height and time. Since the influence of the used reference temperature on the prediction of
in Equation (
9) is also apparent for the investigation of the panel model, the effect is reproduced within the modeling of natural convection with respect to Equation (
2). The resulting polynomial functions of
for the three positions on the foil are presented in
Figure 6. The gray colored region illustrates the relevant time period for the final evaluation of the Nusselt number, as mentioned in
Figure 5. In order to increase the accuracy of the polynomial functions in this time period, only the results within a time interval 3 s–10 s after turning on the electrical heater were considered. For this reason, the influence of natural convection in
Figure 4 is only apparent in this time period.
2.3. Measurement Uncertainties
The uncertainty analysis of the experimental procedure is based on the GUM method (Guide to the Expression of Uncertainty in Measurement [
28]), which was defined in the
ISO/
IEC Guide 98-3:2008. The method supports the systematic procedure in building an uncertainty analysis, as requested in the corresponding standards and guides for linear and nonlinear models according to
ISO/
IEC/
EN 17025:2005. For the present uncertainty analysis, the results from a linear approach are compared to the results from a Monte Carlo method after
ISO/
IEC Guide 98-3:2008/Suppl. 1:2008 (see, e.g., Forster et al. [
29]), showing negligible differences. Defining the relevant equations including the uncertainty of the contributing factors, the analysis gives the combined standard uncertainty and the impact of each contributing factor onto the result. The uncertainty of the contributing factors and their impact on the estimation of the combined standard uncertainty of the local Nusselt number are summarized in
Table 2. The relative contribution of each contributing factor on the estimation of the Nusselt number is calculated for each pixel. The results are given exemplarily for one pixel in a stagnation point of row #1, where the uncertainty is highest, and one pixel between two stagnation points of row #2 (
). Besides classical measurement uncertainties, the uncertainty of the Nusselt number depends on the accuracy of the complete modeling process. The uncertainty of
and
had to be assumed, as the exact material properties of the black paint were not known. The assumption of the uncertainty in
results from the modeling of natural convection (see
Section 2.2), where a variation of the power supply level showed slightly different results for
, which lie within
.
The consideration of all terms in Equation (
2) results in a maximum combined standard uncertainty in the Nusselt number of up to ±9% in a pixel in the stagnation region of row #1, where the highest temperature gradients and the maximum Nusselt number occurs. In the stagnation region, the uncertainty of the IRT data is more apparent (up to
K) as
is closer to the ambient temperature. This results in the higher impact of
on the combined standard uncertainty compared to the pixel between two stagnation points (see
Table 2). The pixel between two stagnation points in row #3, that is exemplarily given in
Table 2, shows a combined standard uncertainty of ±3.2%. For the averaged Nusselt number over the four rows of impinging jets, which will be discussed in the next section, the combined standard uncertainty lies within ±5%. Taking into consideration that the experimental method includes the terms of radiation, natural convection, change of internal energy and lateral conduction, the accuracy of the complete model is satisfying. A fundamental requirement to achieve a good accuracy of this method is dedicated to the IRT camera. A high quality concerning the noise equivalent temperature level is necessary to correctly describe the effect of lateral conduction. In the uncertainty analysis, the thermal noise is captured with
in
Table 2. Furthermore, it is of great importance to precisely know the emissivity of the surface of interest, in order to obtain high quality temperature data from the IRT camera. If the local effects are of special interest, the IRT camera should also have a high spatial resolution. The
Flir Sc 7600, which was used for the present study, has a resolution of
pixels. This results in a relatively poor resolution of the impinging jets with
, as the complete panel model is measured in one experiment. For the present investigations, the spatial resolution is still sufficient, as the focus is set on the averaged heat transfer characteristics. The comparison of the transient results of the Nusselt number for different power supply levels in
Figure 5b is an indication, that the experimental method captures the relevant effects with good accuracy.
Regarding the uncertainty of the jet Reynolds number, the mass flow controller HFC-303 with an accuracy of g/s, which was used for 3000, results in a combined standard uncertainty of ±1%. For 4000, the HFC-207 controller with an accuracy of g/s results in a combined standard uncertainty of ±4%.

